Abstract
To overcome the challenges of feature selection in traditional machine learning and enhance the accuracy of deep learning methods for anomaly traffic detection, we propose a novel method called DCGCANet. This model integrates dilated convolution, a GRU, and a Channel Attention Network, effectively combining dilated convolutional structures with GRUs to extract both temporal and spatial features for identifying anomalous patterns in network traffic. The one-dimensional dilated convolution (DC-1D) structure is designed to expand the receptive field, allowing for comprehensive traffic feature extraction while minimizing information loss typically caused by pooling operations. The DC structure captures spatial dependencies in the data, while the GRU processes time series data to capture dynamic traffic changes. Furthermore, the channel attention (CA) module assigns importance-based weights to features in different channels, enhancing the model’s representational capacity and improving its ability to detect abnormal traffic. DCGCANet achieved an accuracy rate of 99.6% on the CIC-IDS-2017 dataset, outperforming other algorithms. Additionally, the model attained precision, recall, and F1 score rates of 99%. The generalization capability of DCGCANet was validated on a subset of CIC-IDS-2017, demonstrating superior detection performance and robust generalization potential.
1. Introduction
With the advancement of network technology, various attack methods have emerged continuously, leading to network intrusions that can occur anytime and anywhere. These activities can cause significant economic losses and even threaten national information security, highlighting the increasing severity of network information security issues. In April 1980, a technical report by the United States Air Force first introduced the Intrusion Detection System (IDS) [1,2]. The IDS is primarily divided into misuse detection [3] and anomaly detection. Misuse detection involves creating a database of abnormal operation characteristics to monitor network behavior; when network behavior matches the database, it is identified as abnormal. However, misuse detection has unavoidable shortcomings: first, it cannot detect abnormal behavior not present in the database; second, as network scales grow, the cost of updating and maintaining the database increases, making misuse detection more challenging. Anomaly detection identifies attacks by detecting deviations from normal network behavior, thereby effectively preventing network intrusions.
Anomaly detection is a critical focus in network security research, particularly in network traffic anomaly detection, where traffic data analysis is used to detect the presence of attacks [4].
With the development of machine learning, experts worldwide have applied these techniques to anomaly traffic detection. Stiawan et al. [5] utilized feature selection techniques in combination with BN, NB, J48, and DT models for intrusion detection. This approach achieved fast detection speeds, making it suitable for high-traffic network environments. Binhan Xu et al. introduced an intrusion detection method combining k-NN and a Support Vector Machine (SVM), which is capable of learning and updating new data within an acceptable time frame, and its prediction time does not rapidly increase during incremental learning [6].
Moreover, a feature selection method based on an enhanced Genetic Algorithm (GA) was proposed by Halim et al. [7] to improve classification features. Singh et al. [8] improved the traditional Bayesian method by employing multiple logarithmic functions. This optimization significantly enhanced the performance of the Bayesian method in detection tasks, providing a more efficient computational approach for Bayesian detection techniques. Gu et al. [9] proposed a detection method based on an SVM and naive Bayes feature embedding. In this approach, the original data were transformed using naive Bayes and then classified with the SVM, improving the feature extraction speed.
However, these machine learning models may not effectively adapt to new anomaly traffic samples, and difficulties in tuning may arise during the training process. Recently, deep neural networks have achieved widespread adoption in various big data analysis scenarios, triggering a surge in deep learning research. Inspired by research findings in computer vision, Li Yong et al. [10] incorporated residual networks into convolutional neural networks (CNNs), achieving higher accuracy and detection rates compared to GoogleNet [11] and LeNet-5 [12]. Chen Jieyuan et al. [13] proposed an anomaly traffic monitoring method based on CNNs and Long Short-Term Memory (LSTM) networks, which enhanced system performance but incurred significant training overhead and long training times. Ma Wengang et al. [14] addressed the shortcomings of traditional network anomaly detection methods, such as poor feature selection and weak generalization, by proposing an optimized method with LSTM and an improved Residual Neural Network.
Further advancements include Xu et al.’s [15] network traffic anomaly detection algorithm based on a Convolutional Recurrent Neural Network, which effectively extracts the spatial and temporal features of network traffic data. Sun et al. [16] integrated a temporal attention mechanism into the CNN-BiLSTM model, reducing training time and improving prediction performance by allowing time steps in the traffic data to receive more focus. Jia et al. [17] utilized a ResNet-BiLSTM model for traffic detection, achieving rapid classification with minimal training samples based on previous information.
However, the aforementioned methods do not account for the varying importance of features across different channels, and continuous convolution and pooling operations can result in information loss. To address these issues, we propose DCGCANet, a network traffic anomaly detection method based on dilated convolution and channel attention. The DCGCANet model is designed to classify traffic information efficiently and accurately. The proposed system architecture and method extend previous work [18]. The main innovations are as follows:
- A feature extraction model based on dilated convolution, specifically Dilated Convolution-1D (DC-1D), was constructed to prevent information loss caused by down-sampling during the convolution process. Furthermore, a structure comprising dilated convolutions with dilation rates of 1, 2, and 3 was designed, ensuring the continuity of features during the information extraction process.
- The one-dimensional dilated convolution structure was combined with GRU gating units to extract both spatial and temporal features from the data.
- A method to judge the importance of feature channels was designed for the model using channel attention. This is because using convolution alone cannot highlight different concerns based on the importance of features, which affects detection efficiency. By adding channel attention (CA) to the network, channels can be weighted according to their importance, so as to focus on important features and improve the ability of the model to detect abnormal traffic.
The remaining sections are organized as follows: In Section 2, the related work and methods used by DCGCANet are introduced. Section 3 presents the structure and implementation steps of the algorithm. Section 4 validates the effectiveness of the algorithm through experiments. Finally, conclusions are provided in Section 5.
2. Materials and Methods
2.1. The One-Dimensional Convolutional Neural Network
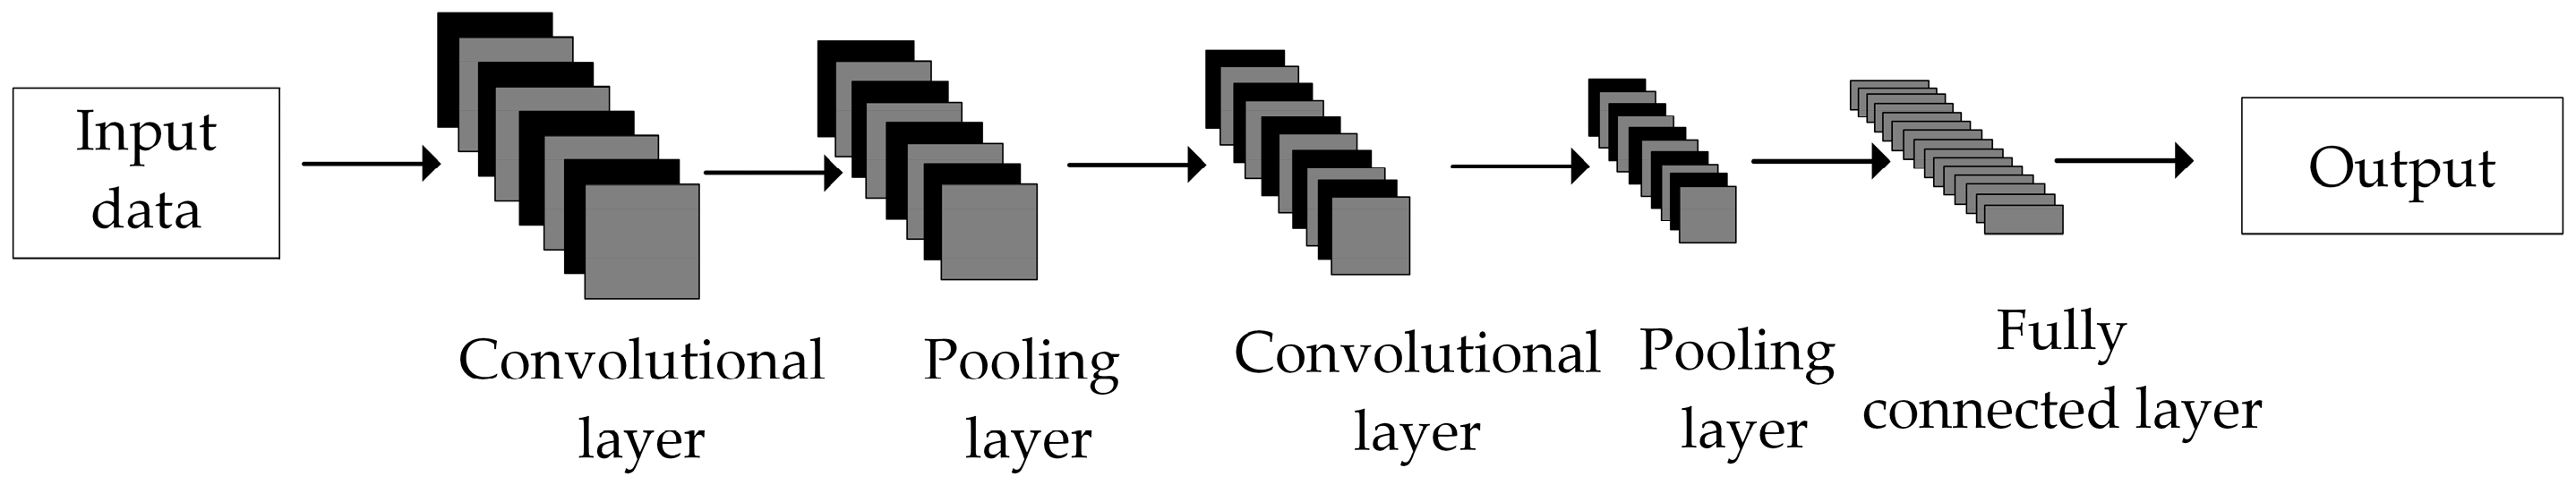
Traditional convolutional neural network (CNN) models are generally composed of five parts: the input layer, convolutional layer, pooling layer, fully connected layer, and output layer. The CNN structure is shown in Figure 1.

Figure 1.
The CNN structure.
The primary function of the convolutional layer is to extract features by applying convolutional kernels to the input data. In the convolutional layer, the weights of each neuron are shared, which significantly reduces the number of parameters. In a one-dimensional convolutional neural network (1D-CNN), the convolutional kernel is a one-dimensional array. The output of the convolutional layer is:
where denotes the output of the j-th neuron in the n-th layer; represents the output of the previous layer (the (n − 1)-th layer), which serves as the input to the n-th layer; signifies the convolutional kernel from the i-th neuron of the (n − 1)-th layer to the j-th neuron of the n-th layer; is the bias for the j-th neuron in the n-th layer; and g is the activation function, typically the ReLU (Rectified Linear Unit) activation function. The rule activation function is shown in Figure 2.
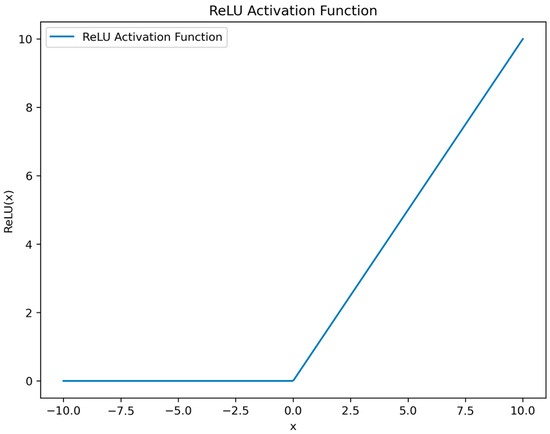
Figure 2.
Rule activation function.
Pooling operation refers to downsampling, commonly known as maximum pooling and average pooling. The expressions are:
where is the pooling output of the i-th neuron in the layer n; s1 and s2 are the pooling scale and step size, respectively; is the max pooling function; and is the average pooling function.
2.2. GRU
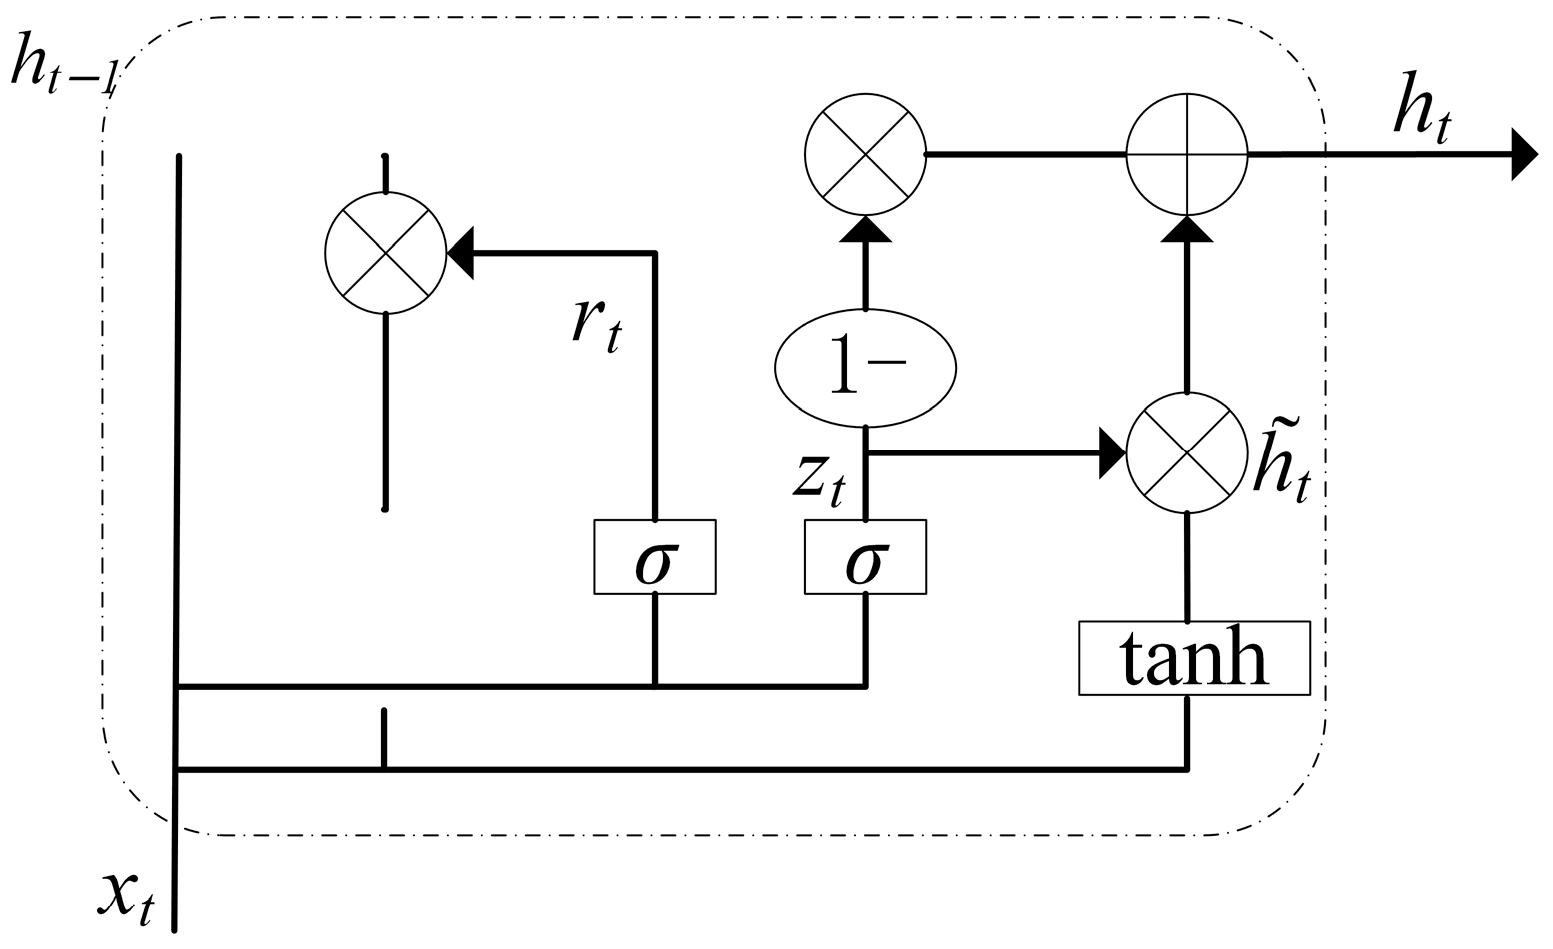
In the context of temporal feature extraction, the Gated Recurrent Unit (GRU) is an important neural network model, similar to the Long Short-Term Memory (LSTM) model but with some optimizations. The GRU includes gate structures such as the update gate zt and the reset gate rt, which control information update and forgetting. The GRU structure is shown in Figure 3.
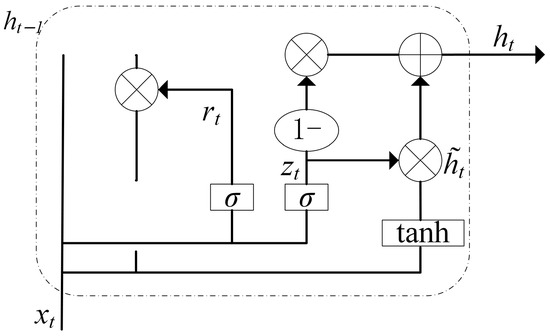
Figure 3.
The GRU structure.
Compared to LSTM, GRUs are more concise in terms of parameters, which helps reduce model complexity and improve convergence speed. The clever design of GRUs allows the network to capture long-term dependencies in sequences while mitigating the vanishing gradient problem. Therefore, GRUs perform well in many tasks involving sequential data processing, including natural language processing, speech recognition, and machine translation, among others.
In the GRU network, the update gate zt determines which parts of the previous hidden state should be passed to the current time step based on the current input and the hidden state from the previous time step. The reset gate rt decides which information in the previous hidden state should be forgotten based on the current input and the hidden state from the previous time step. The calculation process of the GRU is as follows:
where rt represents the reset gate, zt represents the update gate, is the sigmoid activation function, Wr is the weight matrix for the reset gate, Wz is the weight matrix for the update gate, is the candidate hidden state, and ht is the hidden state at time step t.
2.3. Channel Attention Mechanism
The attention mechanism is designed to imitate human vision. When processing visual information, human eyes selectively disregard unimportant details and focus more on significant information, allowing resources to be allocated more efficiently to vital tasks. This mechanism can optimize the convolutional neural network (CNN) model and enhance its performance. Channel attention, specifically, is capable of acquiring channel information and establishing connections between channels, thereby improving the model’s capability to recognize features.
If the data we need to process are X ∈ RC×H×W, C is the number of channels, and H and W are the height and width of the feature map, then the formula for channel attention is:
where a is the attention vector and σ is the sigmoid activation function. F is the fully connected layer, and GAP is global pooling. After obtaining the channel attention a, Y is used to represent the attention that should be given to each channel of the input data X:
where ai represents the i-th element in the attention vector, and Xi represents the i-th channel in the input data.
3. Proposed Method
3.1. Overall Framework of the Model
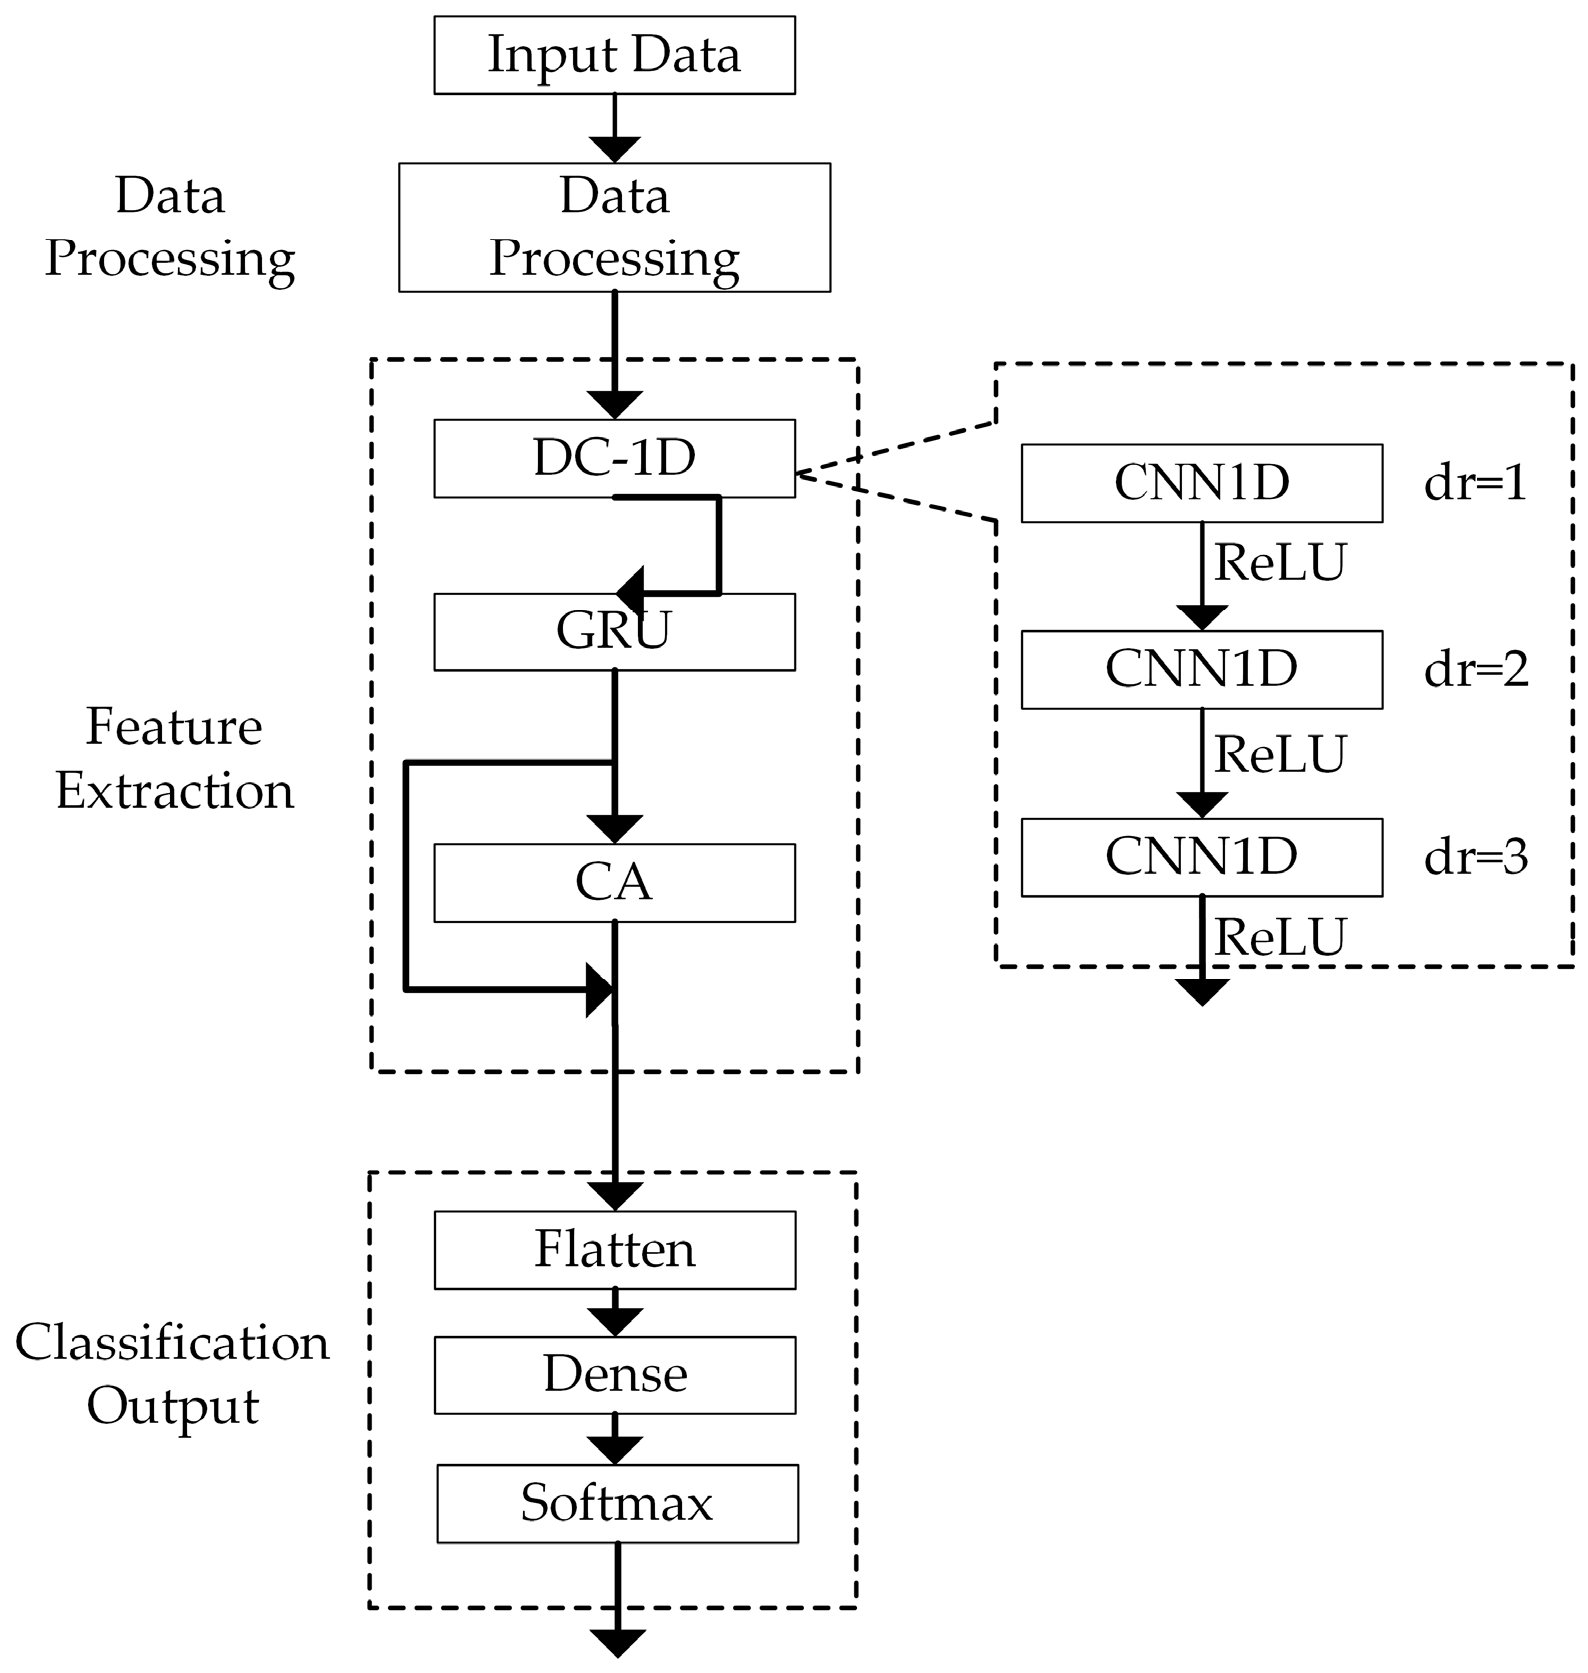
The model comprises three parts: data processing, feature extraction, and classification output, as illustrated in Figure 4.

Figure 4.
Overall framework of the model.
- Data preprocessing is conducted since the different feature intervals in the traffic feature vector possess varying dimensions. To mitigate the impact of these dimensional differences on classification results, features should first be normalized. Mean–variance normalization is employed to transform the data into a normal distribution with a mean of 0 and a variance of 1. The formula for normalization is as follows:where x′ is the processed data, x is the characteristic value of each group of input features, xm is the mean of input features, and s is the standard deviation of each group of input features.
- Then, in the feature extraction stage, the preprocessed data are input into DC-1D. The DC-1D module consists of three convolutional layers with dilation rates of 1, 2, and 3. In DC-1D, the input data are successively passed through three dilated convolutional layers for feature extraction to generate feature maps, with each convolution being processed using the ReLU activation function. Then the GRU module is used to extract its time characteristics. The features extracted are input into the CA module, where the data are weighted by channel through the CA module.
- In the classification output stage, the weighted features are input into the Flatten layer for flattening and then processed by a Dense layer and a Softmax layer for classification purposes.
3.2. DC-1D Structure
To avoid the information loss caused by pooling operations in traditional convolutions, dilated convolutions are used instead of pooling operations in this paper. Dilated convolutions can expand the receptive field without changing the feature resolution, thereby improving computational speed. If the size of the traditional convolution kernel is p and the dilation rate is r, the size of the dilated convolution kernel is given by:
In this case, the receptive fields of traditional convolution and empty convolution are respectively:
where Ri and Ri+1 represent the receptive fields of the current and next layers in traditional convolution, respectively. The terms and denote the receptive fields of the current and next layers in dilated convolution, respectively. Additionally, s is the product of the strides from the first layer to the (i + 1)(i + 1)-th layer. Substituting Equation (9) into Equation (11), we obtain:
From this, it can be seen that the receptive field grows rapidly when performing multi-layer operations with dilated convolutions, allowing for a significantly larger receptive field to be obtained.
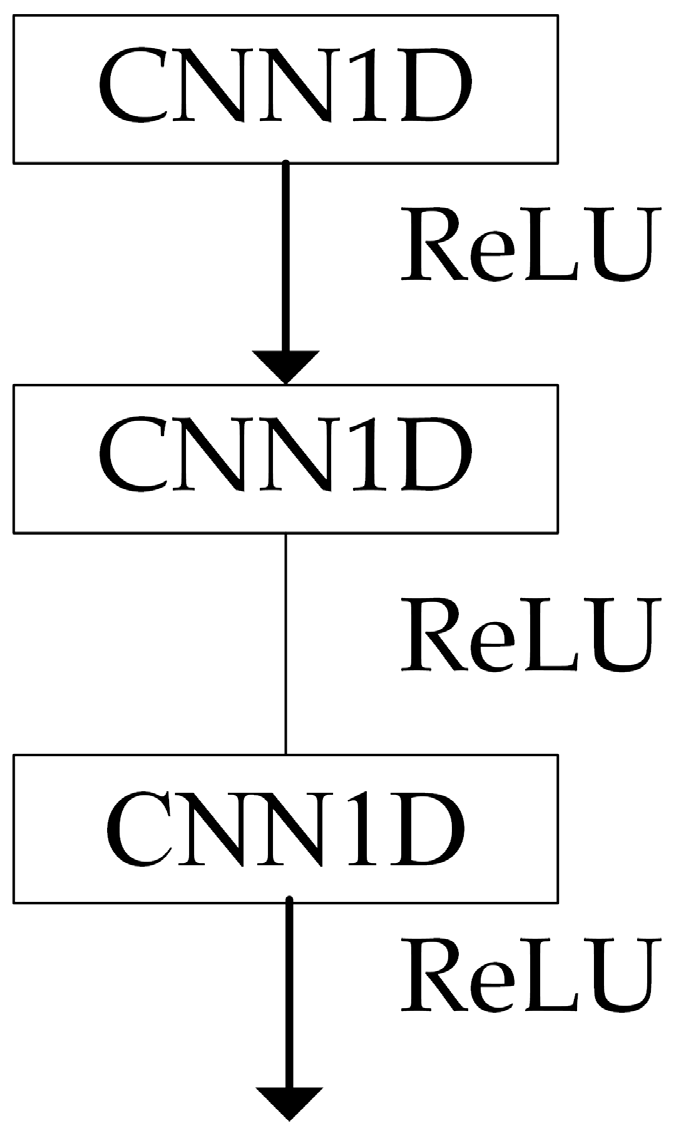
Since dilated convolutions can lead to the loss of continuity between features, to avoid this and achieve multi-scale information acquisition, dilated convolutions with dilation rates of 1, 2, and 3 are stacked to form the DC-1D structure, as shown in Figure 5.

Figure 5.
DC-1D structure.
The one-dimensional data composed of each network traffic feature are taken as the input x. The output after processing through the DC-1D structure is given by:
where , , and represent the dilated convolutions with dilation rates of 1, 2, and 3, respectively. The output feature map is denoted by Fc.
3.3. DC-GRU
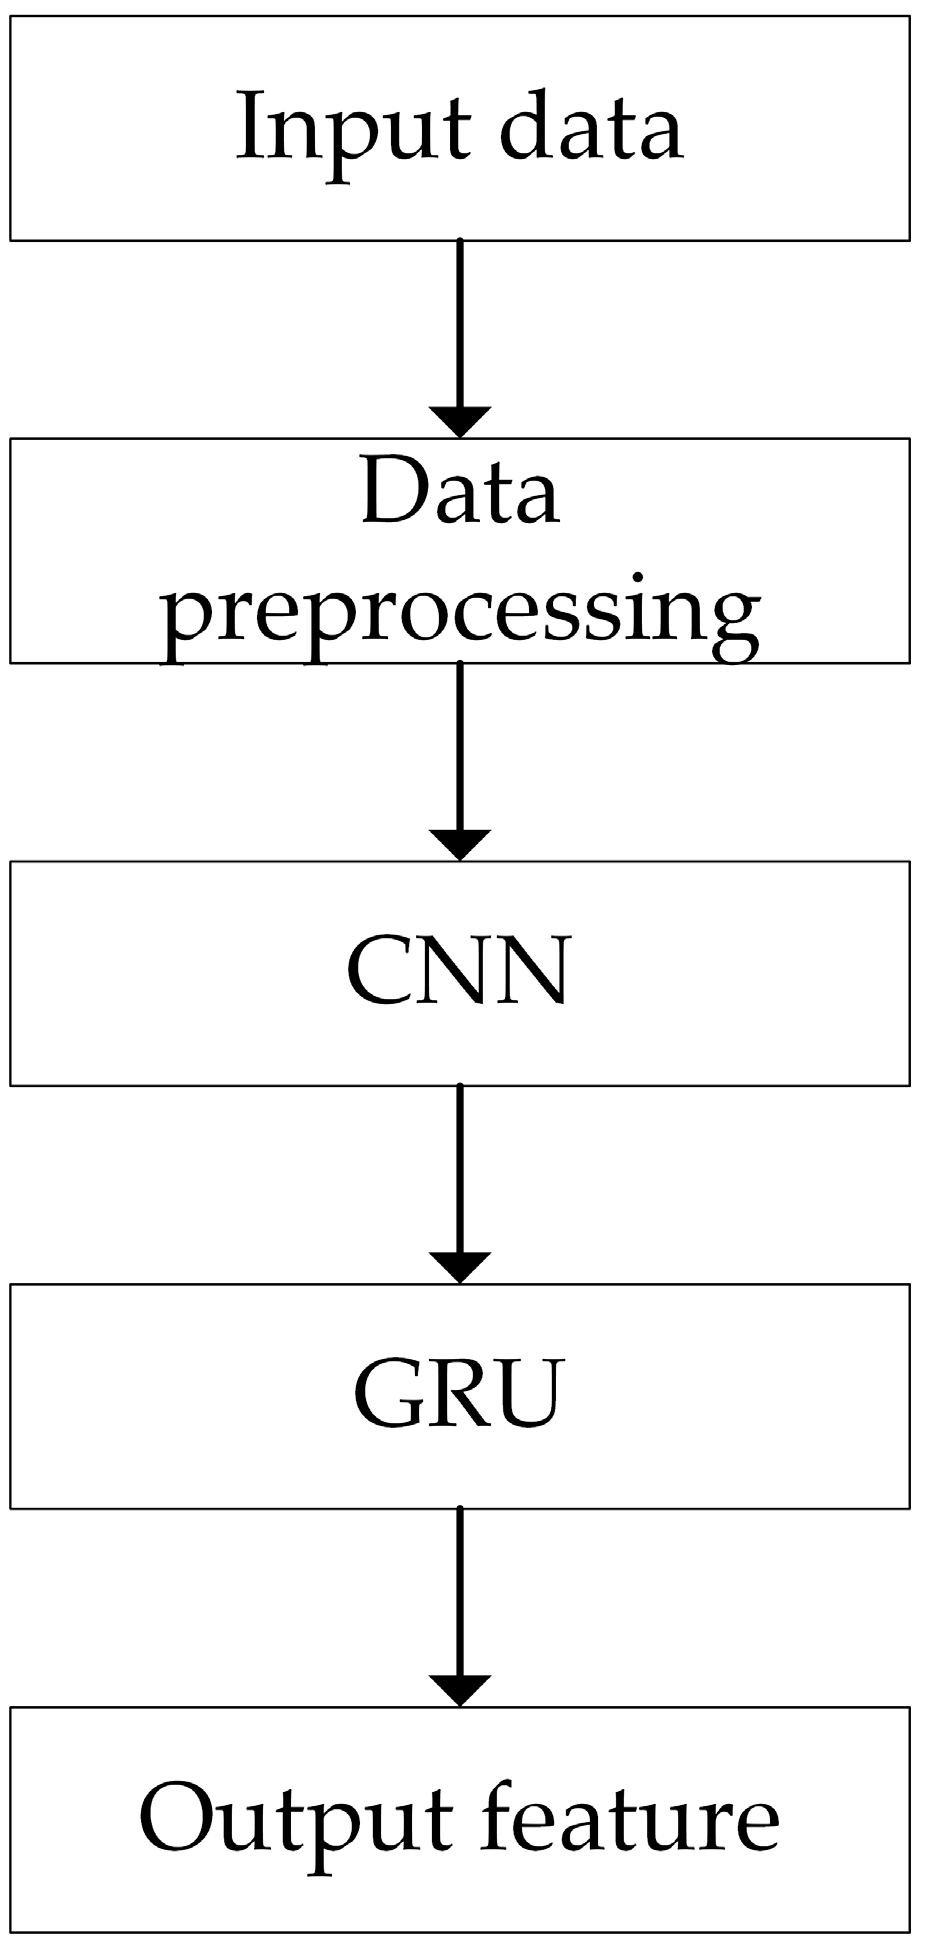
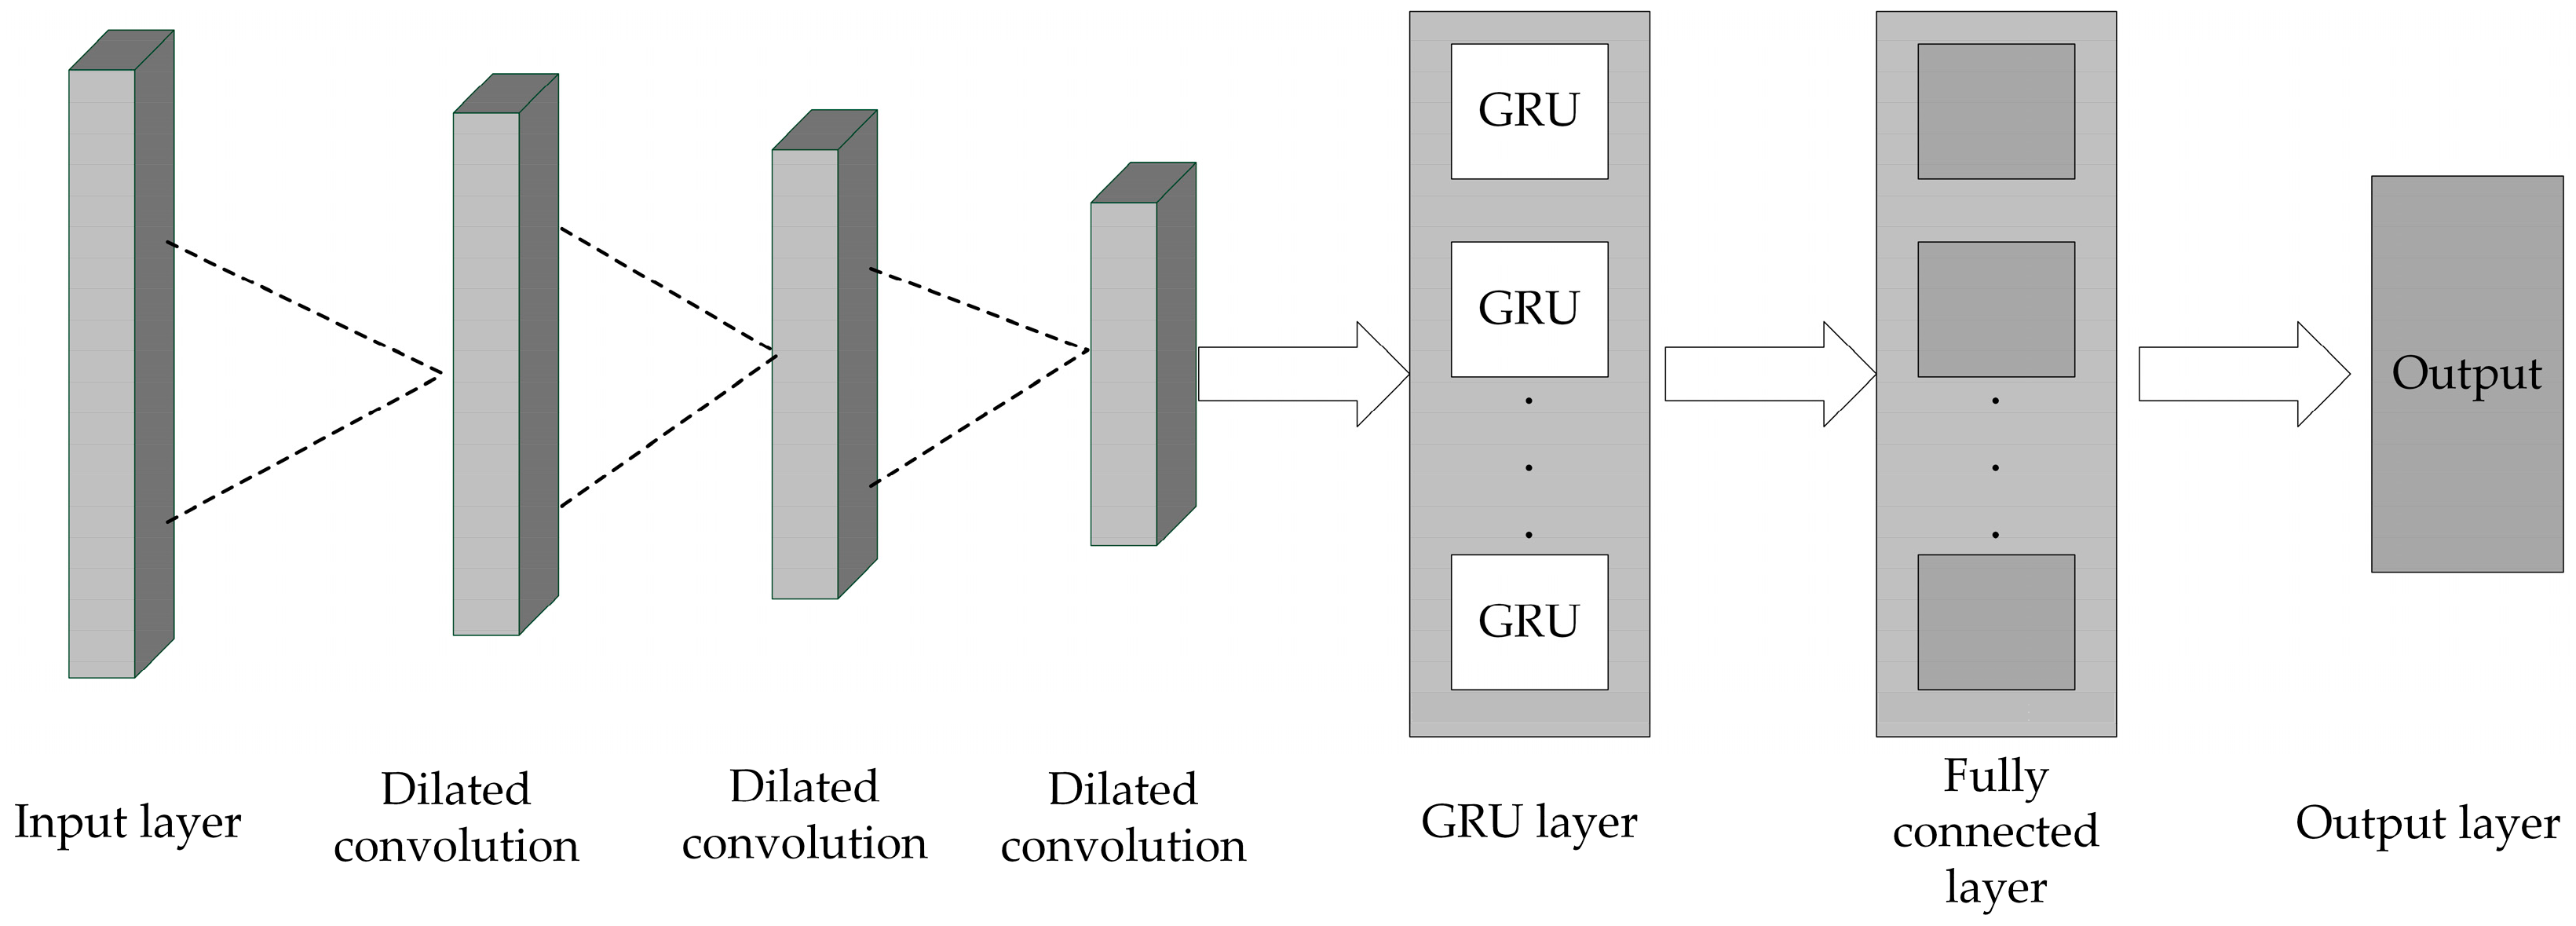
The DC-GRU model’s workflow starts with the preprocessing of the dataset. The preprocessed data are then input into the CNN model to extract spatial features. Subsequently, these spatial features are fed into the GRU to extract temporal features. The detailed implementation process is illustrated in Figure 6, and the architecture of the CNN-GRU model is depicted in Figure 7.
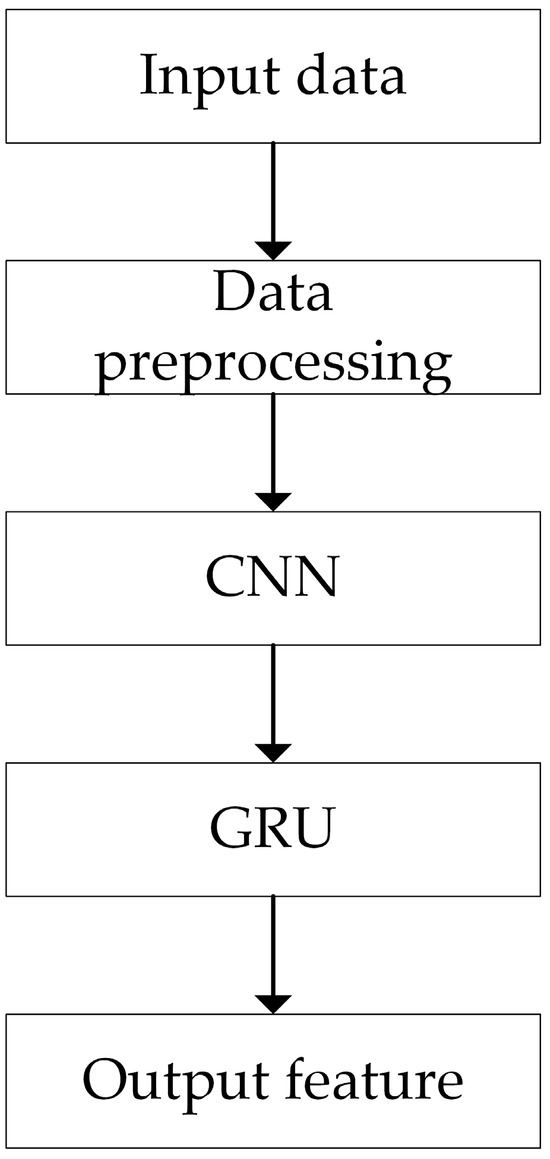
Figure 6.
Structural flowchart.
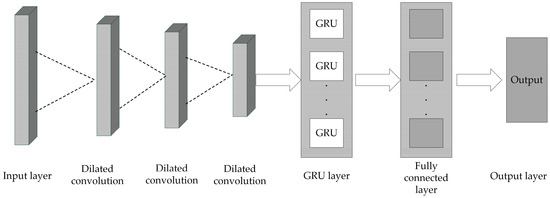
Figure 7.
DC-GRU model.
3.4. CA Module
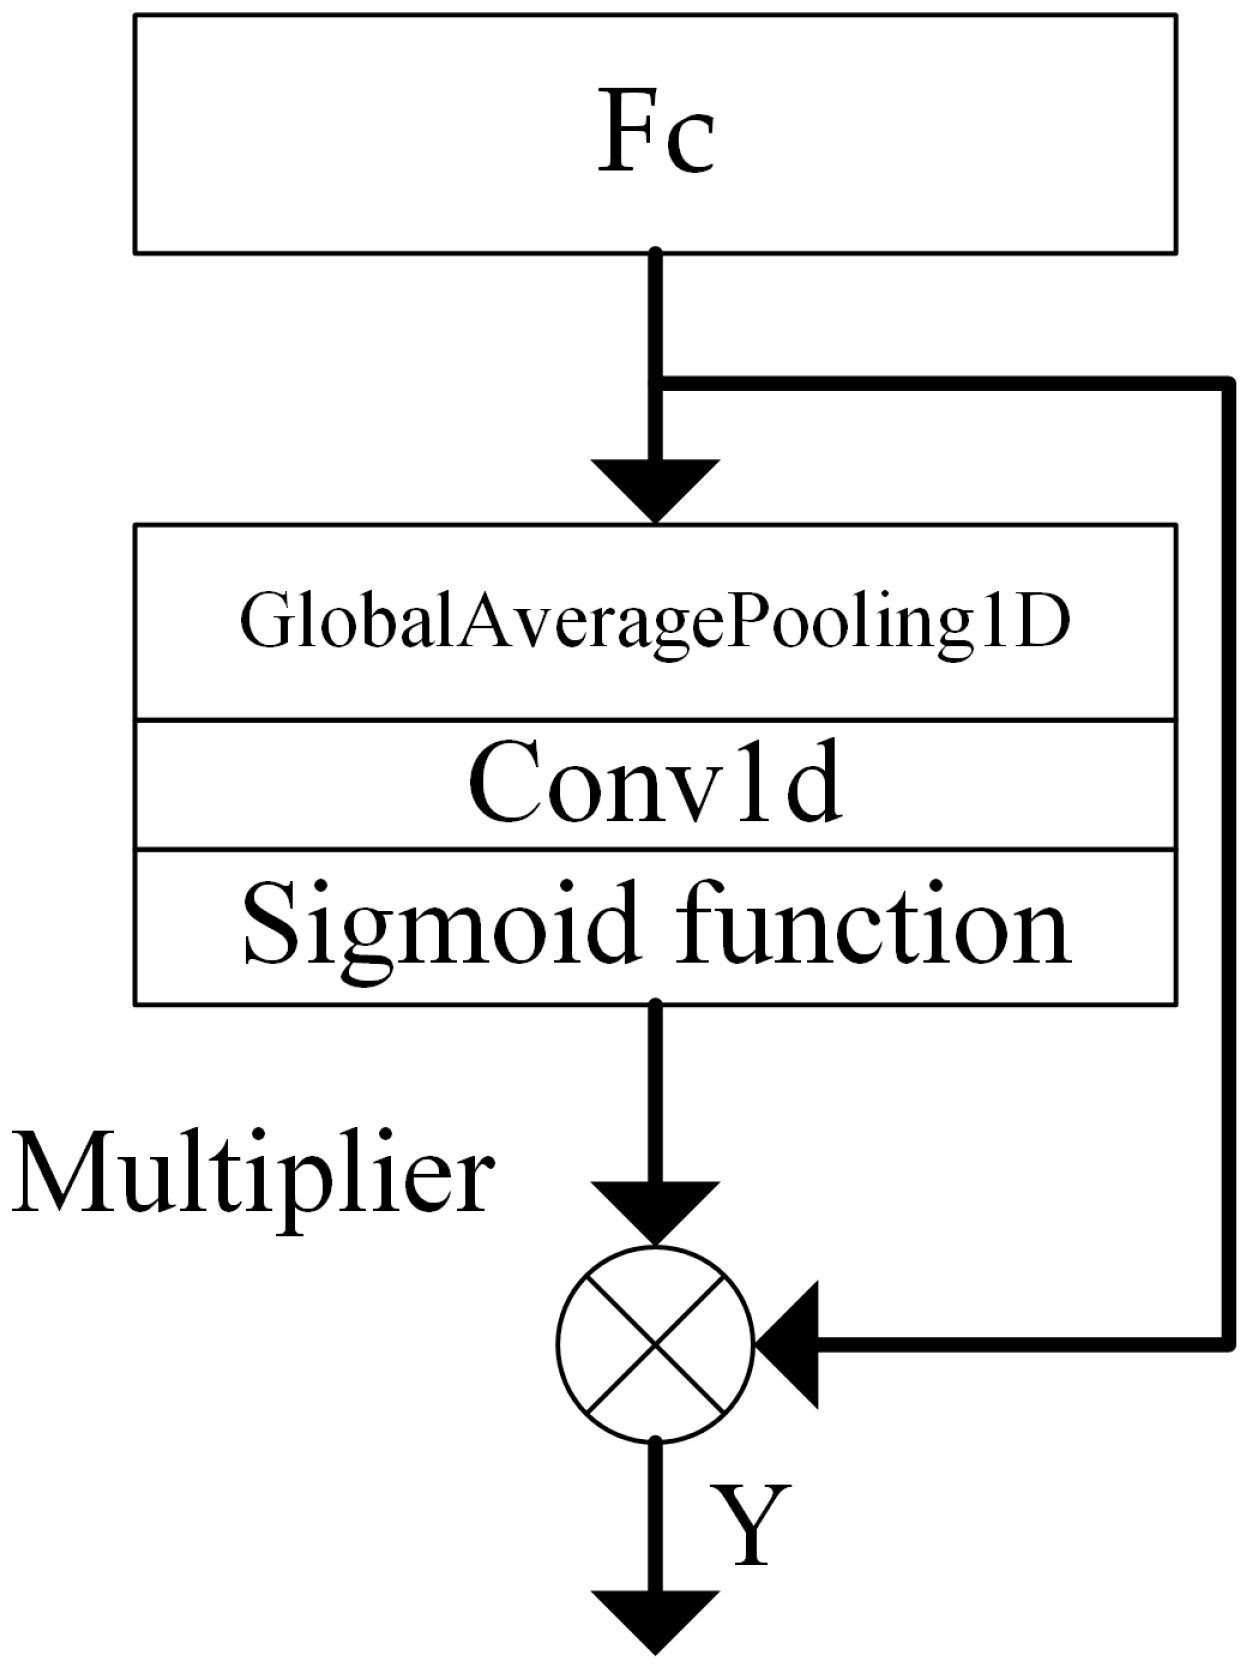
Due to the fact that different traffic data may exhibit the same features, the importance of these features for traffic classification varies. The existing traffic anomaly detection algorithms do not consider the extent to which traffic features in different channels influence the classification results. To address this issue, the CA (channel attention) module is employed, as depicted in Figure 8.

Figure 8.
CA module.
The CA module can adaptively determine the convolution kernel k through one-dimensional convolution, thereby avoiding the need for manual adjustment of the convolution kernel. The adaptive calculation of the convolution kernel k is as follows:
where C is the channel dimension, γ = 2, b = 1, with odd representing the odd number.
4. Experiments
4.1. Experimental Environment
The experiments in this study were conducted on a Windows operating system using the TensorFlow deep learning framework. The specific hardware and software environment are detailed in Table 1.

Table 1.
Experimental environment.
4.2. Datasets and Evaluation Indicators
The CIC-IDS-2017 dataset was used for training and validation. This dataset contains traffic data from 3 July 2017 to 7 July 2017, including normal traffic and 14 types of attacks. The experiment considered normal traffic (BENIGN) and nine types of attacks. The ratio of the training set to the test set was 7:3.
The CIC-IDS-2017 dataset contains a total of 79 identifiers, with 78 features, and the last identifier was used to mark whether the data represent normal or abnormal behavior.
The confusion matrix was used as the evaluation metric, as shown in Table 2. In the confusion matrix, TP (True Positive) is the number of abnormal traffic cases correctly identified as abnormal; TN (True Negative) is the number normal traffic cases correctly identified as normal; FP (False Positive) is the number of abnormal traffic cases incorrectly identified as normal; and FN (False Negative) is the number of normal traffic cases incorrectly identified as abnormal.
Table 2.
Confusion matrix.
Accuracy, precision, recall, and F1 score were used to evaluate the performance of the model. The formulas are as follows:
4.3. Data Preprocessing
In processing network traffic data, non-numeric features are present, which are not suitable for direct input into anomaly detection models. To address this issue, one-hot encoding was employed to convert these non-numeric features into numeric ones, making them compatible with the model. Additionally, there may be significant differences in the scales of different features. Such disparities can affect classification performance, necessitating the normalization of feature values. Normalization ensures that all features are on a comparable scale, thereby enabling more equitable comparisons within the model.
For instance, in the publicly available KDDCUP99 dataset, the features ‘service’, ‘flag’, and ‘protocol_ty’ are non-numeric and thus require one-hot encoding to be converted into binary numeric values. When the ‘protocol_type’ feature, which includes three attributes—TCP, UDP, and ICMP—is one-hot encoded, the results are 100, 010, and 001, respectively. The ‘service’ feature comprises 70 attributes, and, after one-hot encoding, is transformed into a 70-dimensional binary vector. The ‘flag’ feature contains 11 attributes, and its one-hot encoding yields an 11-dimensional binary vector.
Moreover, significant differences in the ranges of feature values can lead to slow convergence of the anomaly detection model, increasing experimental time and ultimately affecting detection performance. Therefore, feature normalization is necessary. In the CIC-IDS-2017 dataset, for example, the feature ‘Total Length of Fwd Packets’ ranges from [0, 181,012], while the feature ‘Flow IAT Max’ ranges from [−1, 120,000,000], indicating substantial disparities. To mitigate the issues arising from these differences, normalization is performed to unify the range of each feature within the interval [0, 1]. This process stabilizes the model and accelerates convergence, thereby saving experimental time and enhancing detection performance. In this study, mean–variance normalization, as defined by Equation (10), was utilized. By computing the mean and standard deviation of each feature, the values were transformed to follow a standardized distribution. Consequently, regardless of their original range, the feature values were effectively mapped to a common numerical interval, providing a more reliable foundation for model training and prediction.
4.4. Model Parameter Settings
To address the potential issues of gradient explosion or vanishing gradients in deep convolutional neural networks (CNNs), experiments were conducted on CNNs with different numbers of layers (from one to five) to compare their accuracies. All other parameters were kept constant in the experiments except for the number of convolutional layers. The experimental results are shown in Figure 9.
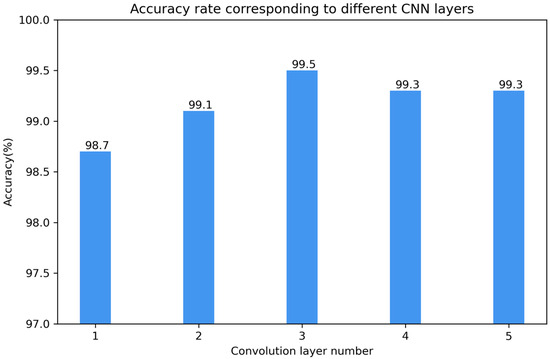
Figure 9.
Accuracy corresponding to different numbers of convolutional layers.
From the results in the figure, it can be concluded that the performance was poorest when the number of convolutional layers was one, and it was best when the number was three, with an accuracy of 99.5%. Therefore, this model uses a network structure with three convolutional layers.
Although dilated convolution can enlarge the receptive field and capture more contextual information without increasing the number of parameters, a common problem known as the ‘grid effect’ may occur when the dilation rate of dilated convolution is large. This effect is when the convolutional kernel covers only part of the input feature map, leading to discontinuities in the output feature map in terms of spatial arrangement. This discontinuity may cause information loss or fragmentation, affecting the model’s performance. To address this issue, we used Hybrid Dilated Convolution [19] (HDC) and determined the dilation rates for dilated convolution based on three-layer convolution. HDC possesses three characteristics. Firstly, the pattern of the dilation rate has a zigzag configuration. Secondly, the dilation rates of sequentially arranged HDC must not share a common factor greater than 1. Lastly, HDC satisfies the formula:
where ri represents the dilation rate of the i-th layer. Mi represents the largest dilation rate of the i-th layer.
The dilation rates were set to satisfy the equation for dilation rates of 1, 2, and 3, and 1, 2, and 5. Experiments were conducted by setting the dilation rates to 1, 2, and 3, and 1, 2, and 5, while keeping the other conditions constant. The experimental results are shown in Figure 10. From Figure 10, it can be seen that when the dilation rates were set to 1, 2, and 3, the accuracy reached 99.5%, which is significantly better than when the dilation rates were 1, 2, and 5.
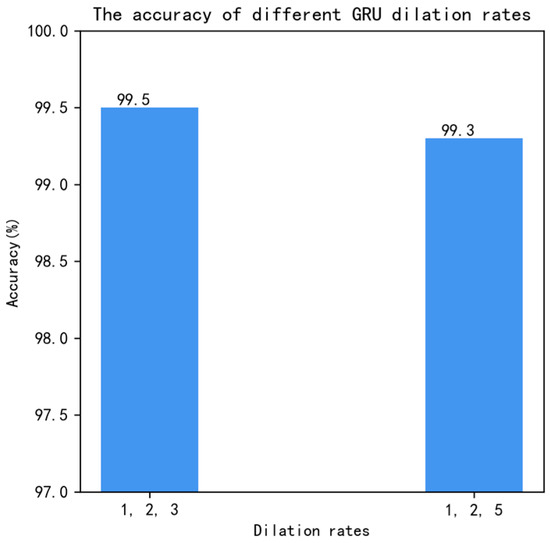
Figure 10.
Dilation rates.
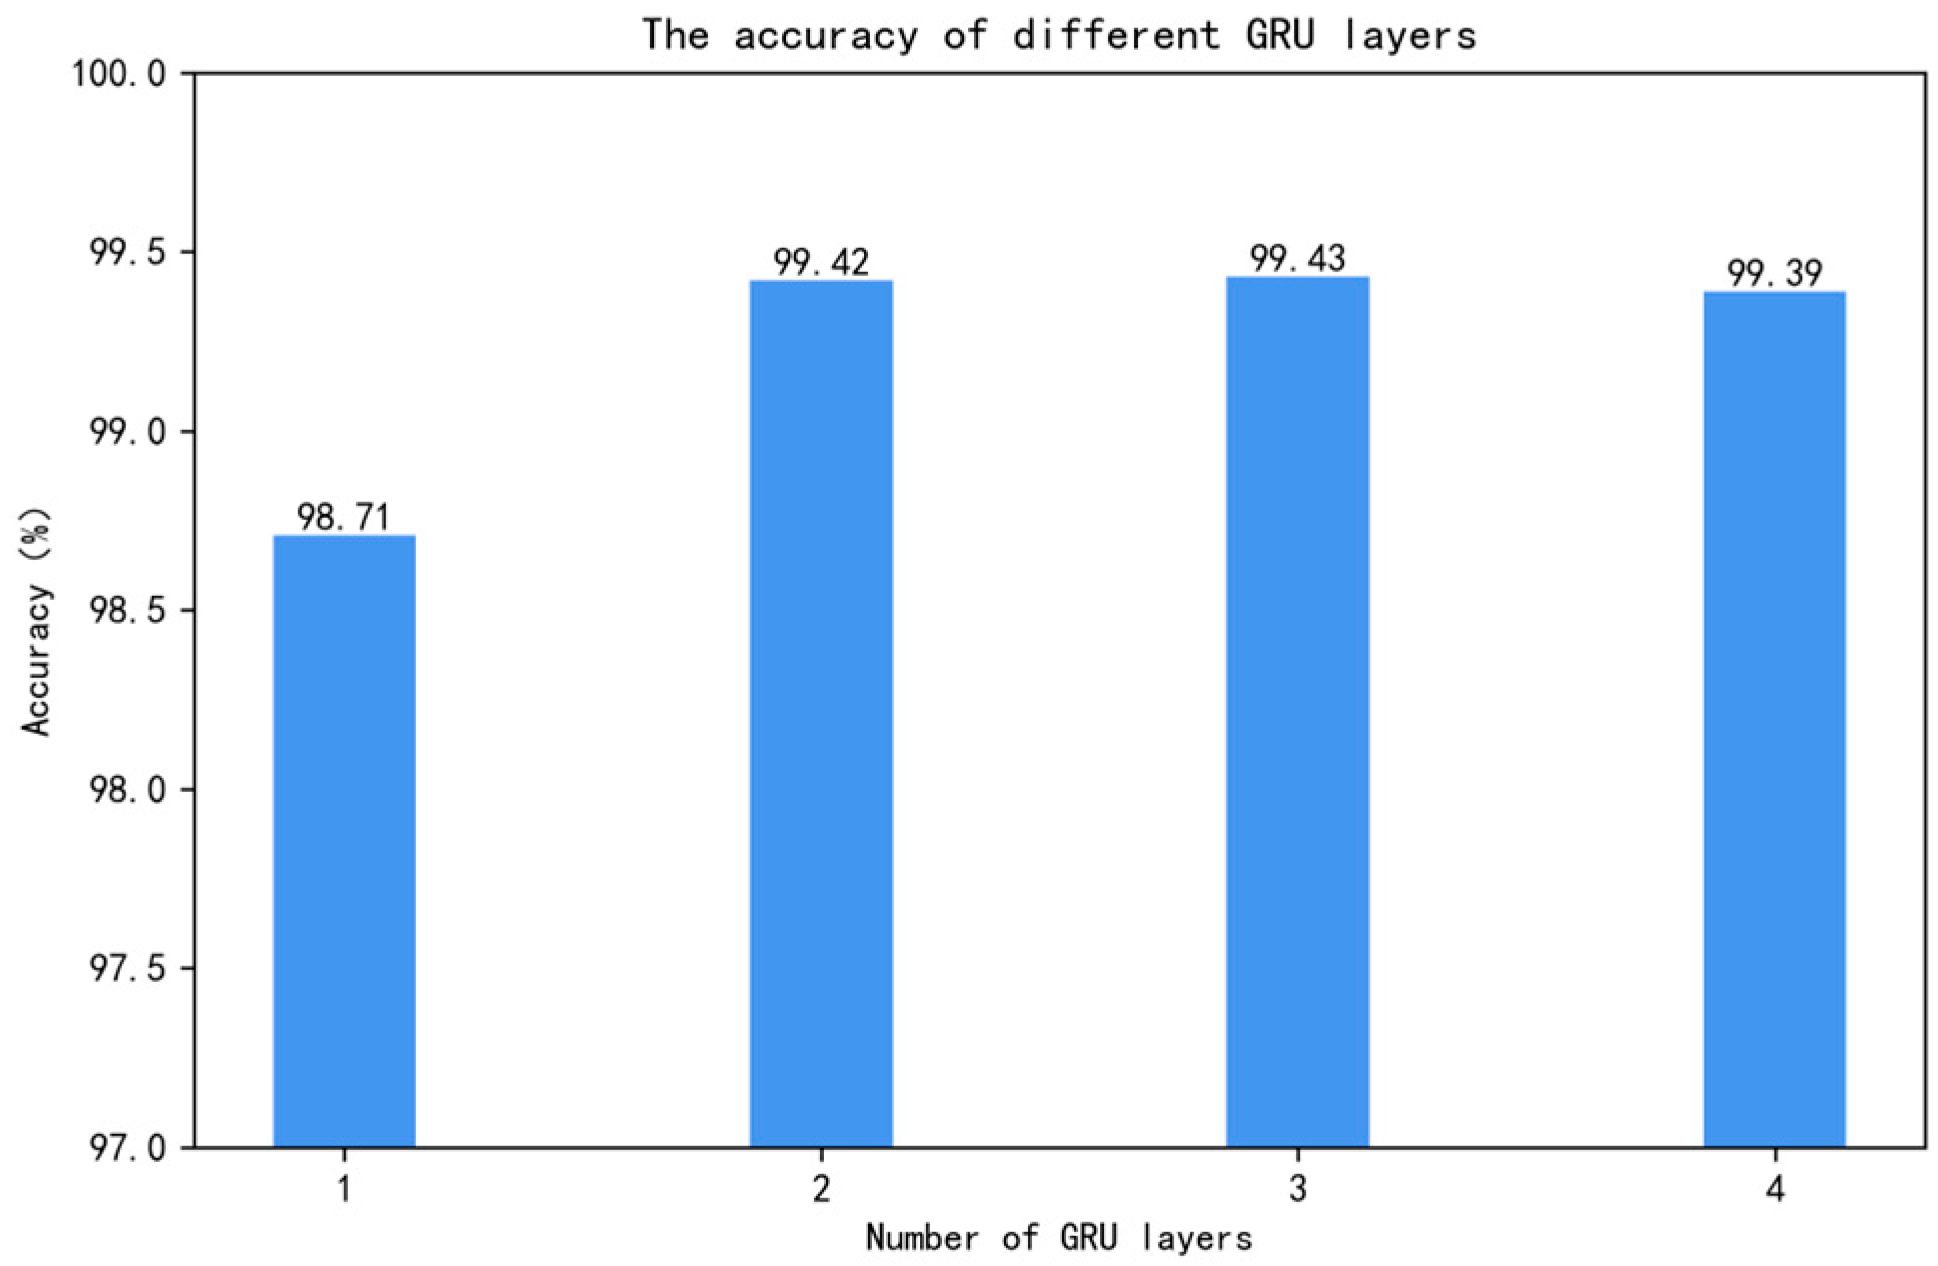
In deep learning models, the number of layers in a neural network can significantly impact the final classification performance, a factor that is particularly pronounced when using GRU networks. Therefore, to determine the optimal number of layers, all other parameters were kept constant in the experiments, and only the number of GRU layers was adjusted. Different layer configurations of GRU were combined with the DC-1D (one-dimensional dilated convolution) structure, specifically including GRUs with 1, 2, 3, and 4 layers. This combination allowed for the exploration of the GRU’s ability to handle complex features and maintain sequence information while observing its impact on overall model performance. Each layer configuration underwent the same training and validation process to ensure comparability of the results. The experimental results are shown in Figure 11.

Figure 11.
Accuracy corresponding to different numbers of GRU layers.
Considering that the computational cost and efficiency of deep learning models are crucial factors in model design and selection, the slight difference in accuracy between using a two-layer GRU and a three-layer GRU became a critical decision point. Although the three-layer GRU provided slightly higher accuracy, it also resulted in increased computational cost and complexity. Therefore, after balancing accuracy and computational cost, the decision to use a two-layer GRU as the final model was based on a comprehensive consideration of performance and efficiency. This choice not only maintained high accuracy but also ensured the model’s efficiency and practicality.
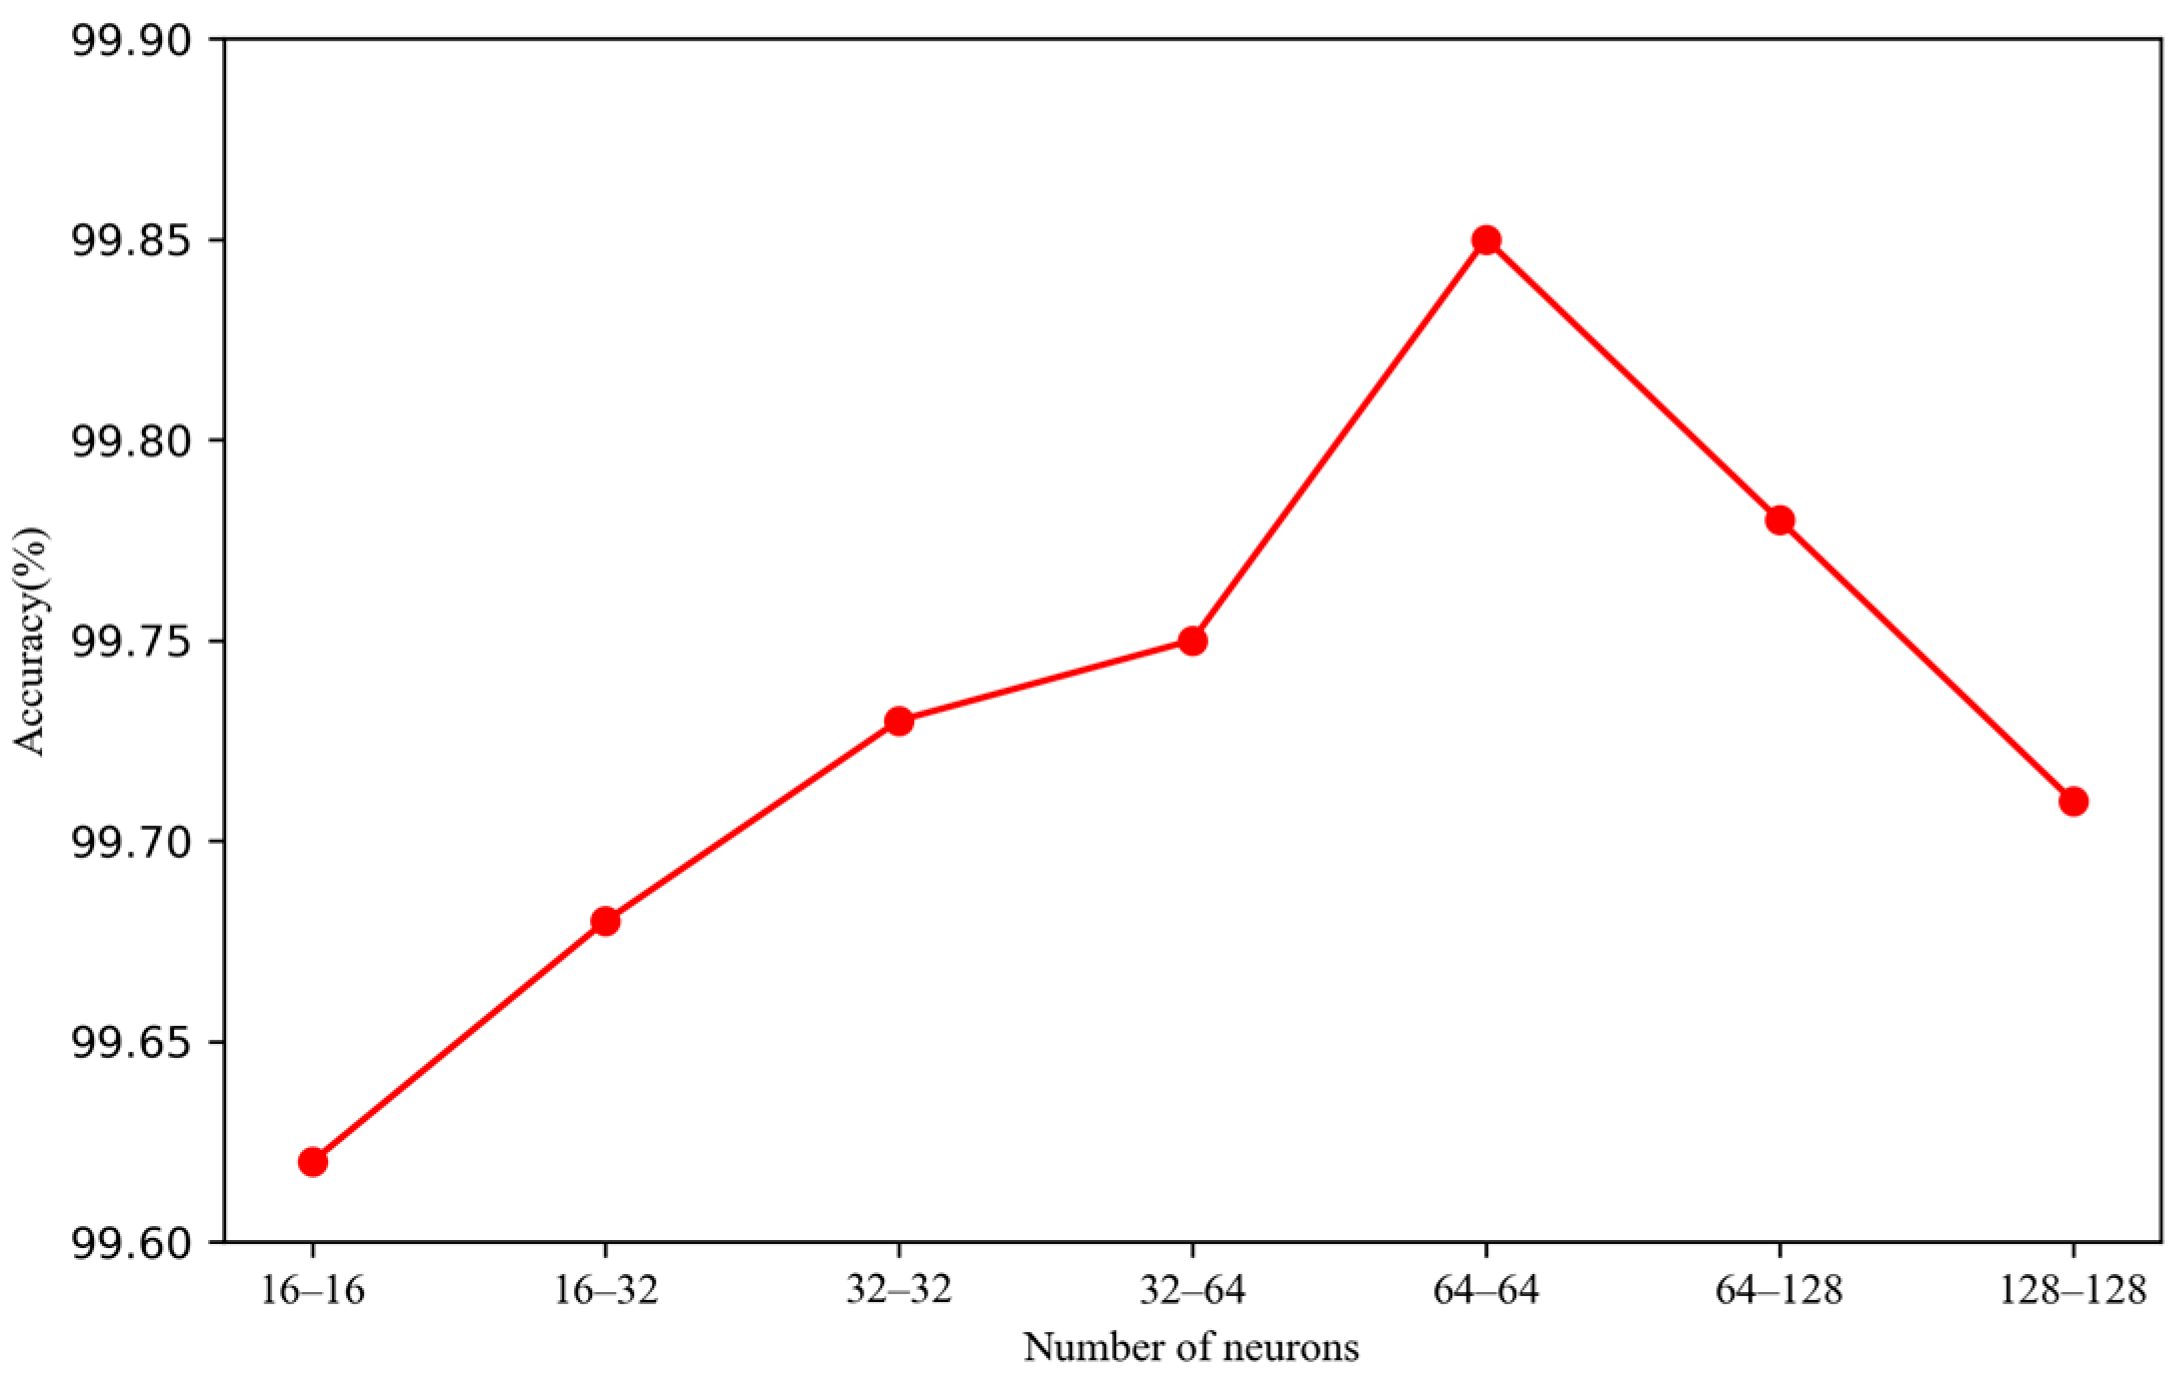
Since the selection of GRU neurons also affects model performance, experiments were conducted to determine the optimal number of neurons. The two-layer GRU was set to 16, 32, 64, and 128 neurons, the experimental results for which are shown in Figure 12. The results indicate that the highest accuracy was achieved when the number of neurons was set to 64-64.

Figure 12.
Number of neurons.
Through the above parameter design experiment, we designed the structure of a DC-GRU. The overall structure consists of three one-dimensional dilated convolutions with dilation rates of 1, 2, and 3. Generally speaking, in order to achieve better accuracy, researchers tend to design network models with greater depth to obtain higher-level features. However, the deeper the layers, the more parameters involved. Theoretically, the more parameters, the better the model’s fitting capacity, but this also increases the risk of overfitting. Based on multiple experiments, the convolution kernel size and the number of convolution kernels in this study were set to 3 and 64, respectively.
In the GRU section, it was found during the experiments that appropriately increasing the network depth can enhance the model’s predictive capability. In this study, two GRU layers with an output dimension of 64 were used.
4.5. Model Effect Verification
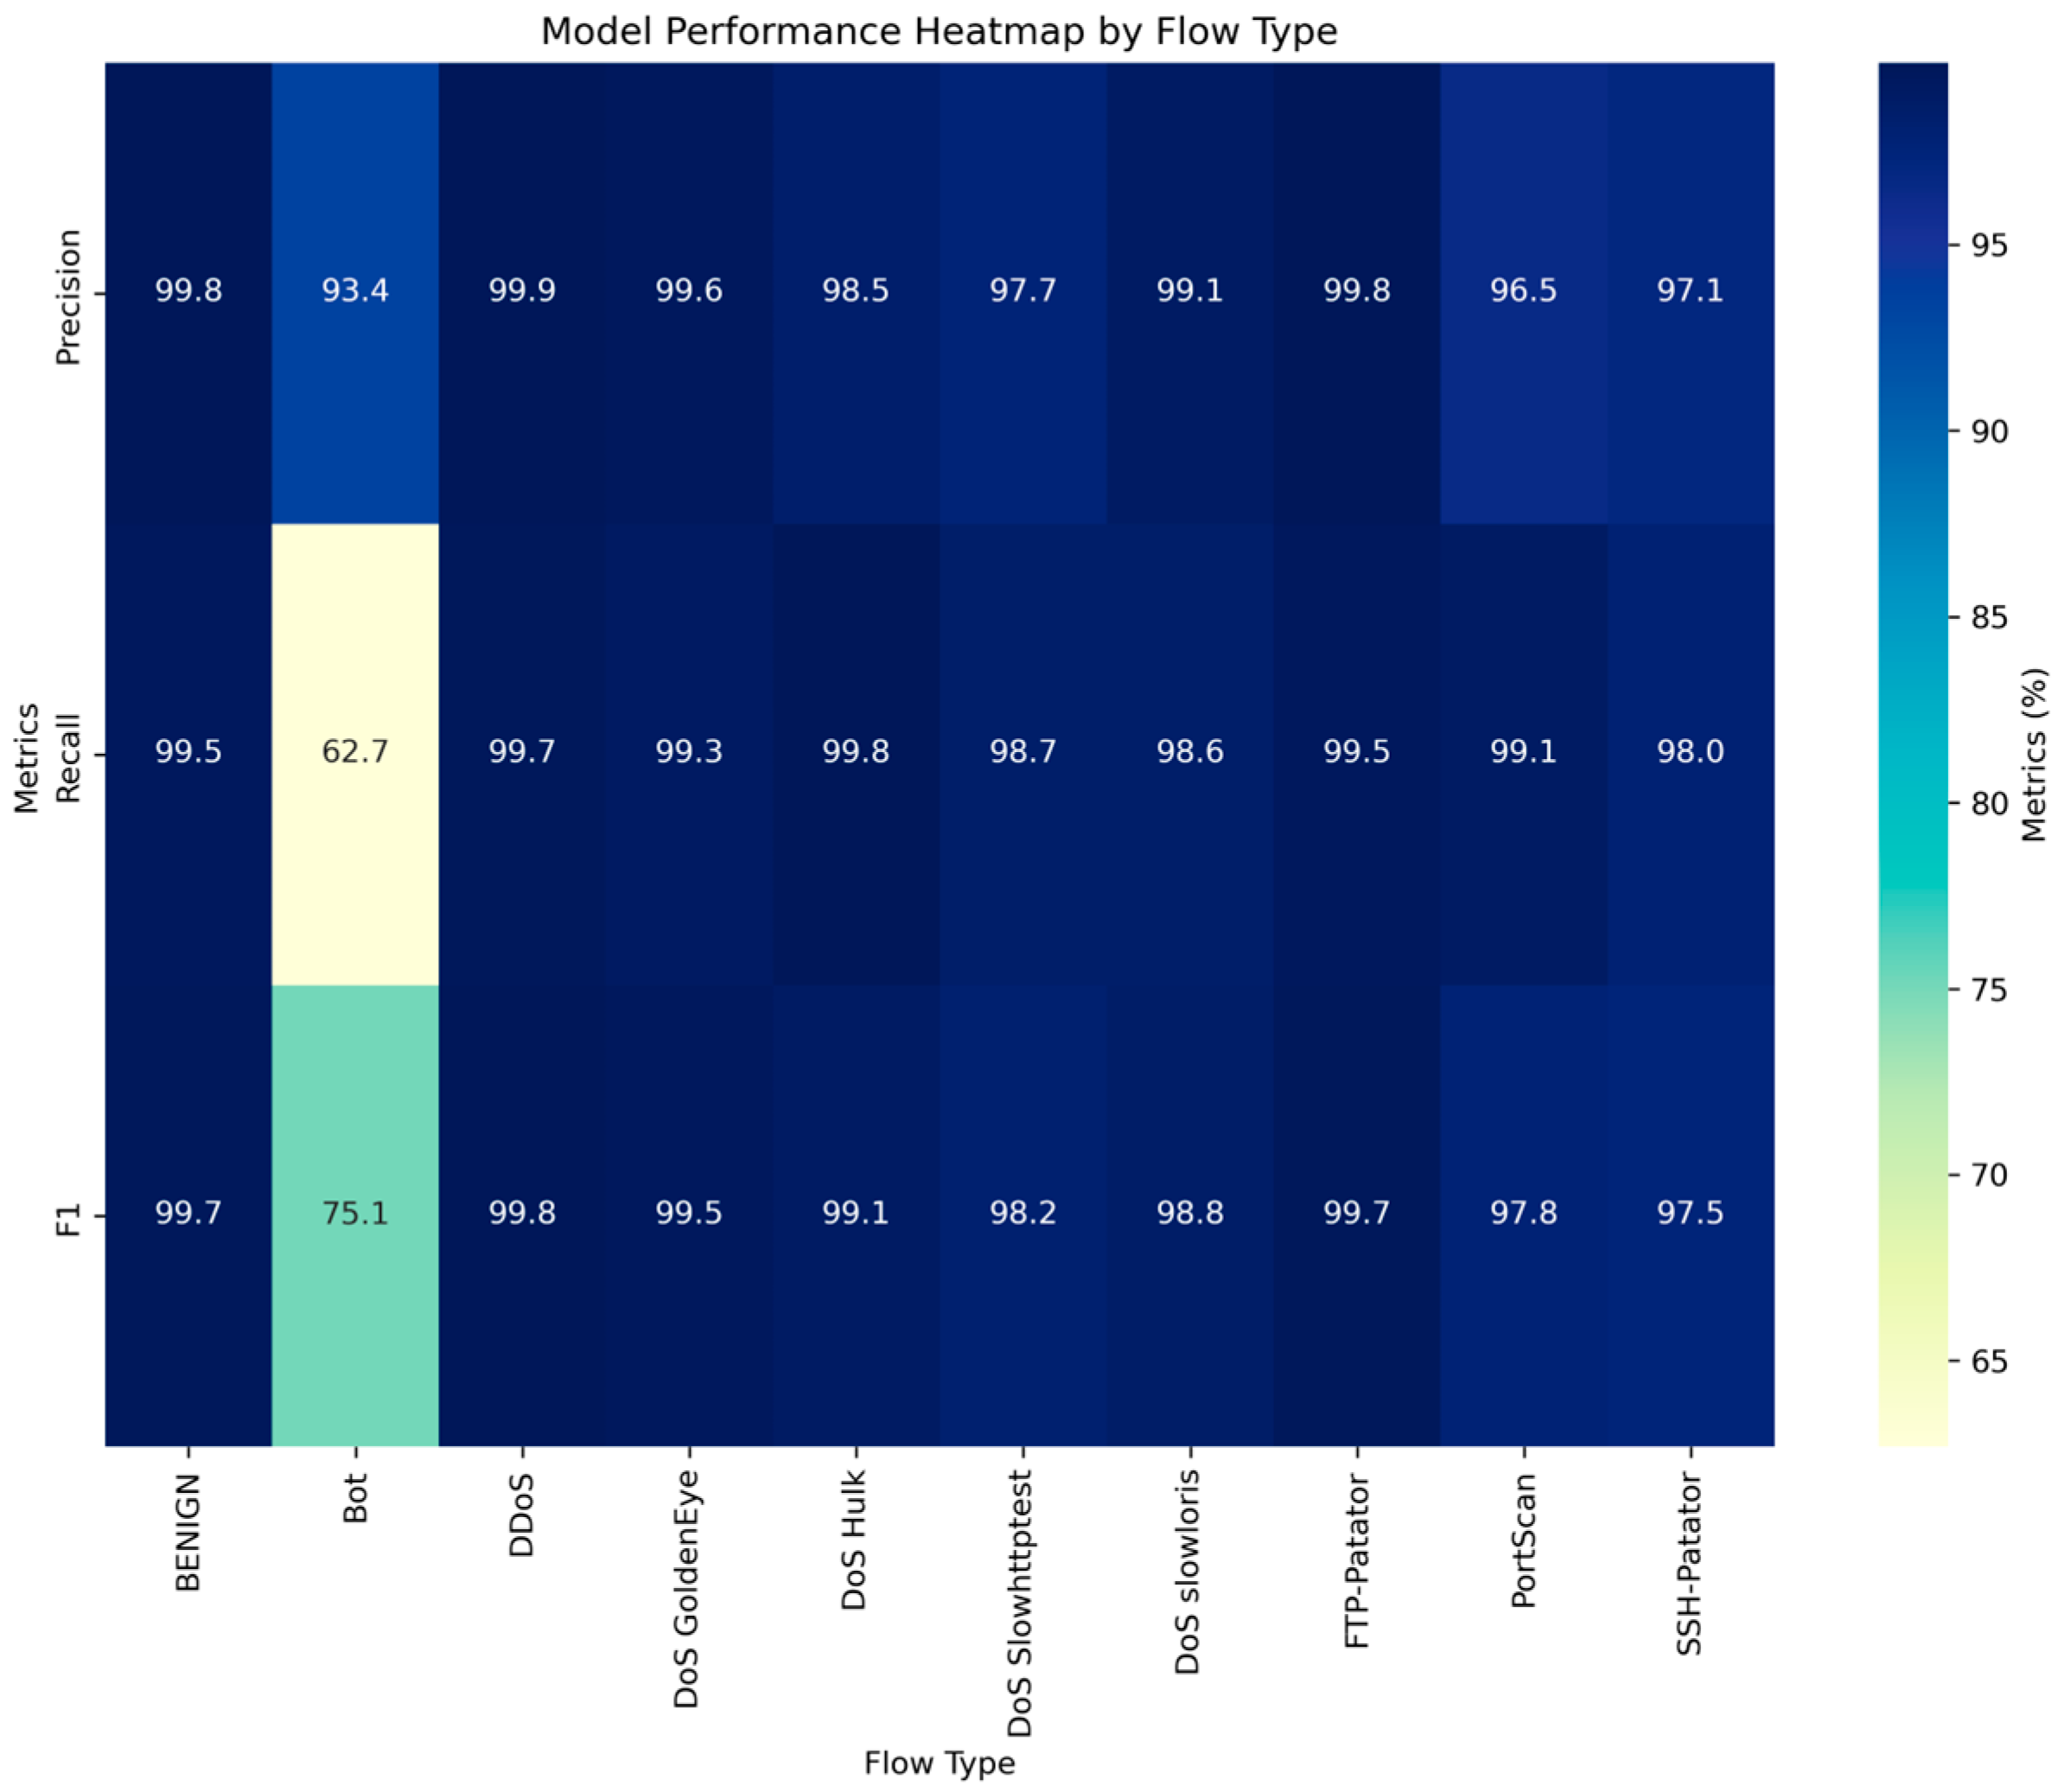
During the experiment, the model converged when the epoch was set to 10, and at this point, the accuracy of the test set reached 99.5%. Table 3 displays the precision, recall, and F1 score values for various attack types in the CIC-IDS-2017 dataset.
Table 3.
Precision, recall, and F1 values for the CIC-IDS-2017 dataset.
As can be observed in Table 3, the precision of DCGCANet for 10 types of network behaviors was above 90%, and for Bot types with fewer data, it also exceeded 92%. The recall rate and F1 score also remained at high levels, sufficiently demonstrating the effectiveness of DCGCANet in traffic classification.
To more intuitively demonstrate the model’s performance, a heatmap comparing the precision, recall, and F1 score for various attack types was generated, as shown in Figure 13.

Figure 13.
Model performance heatmap by flow type.
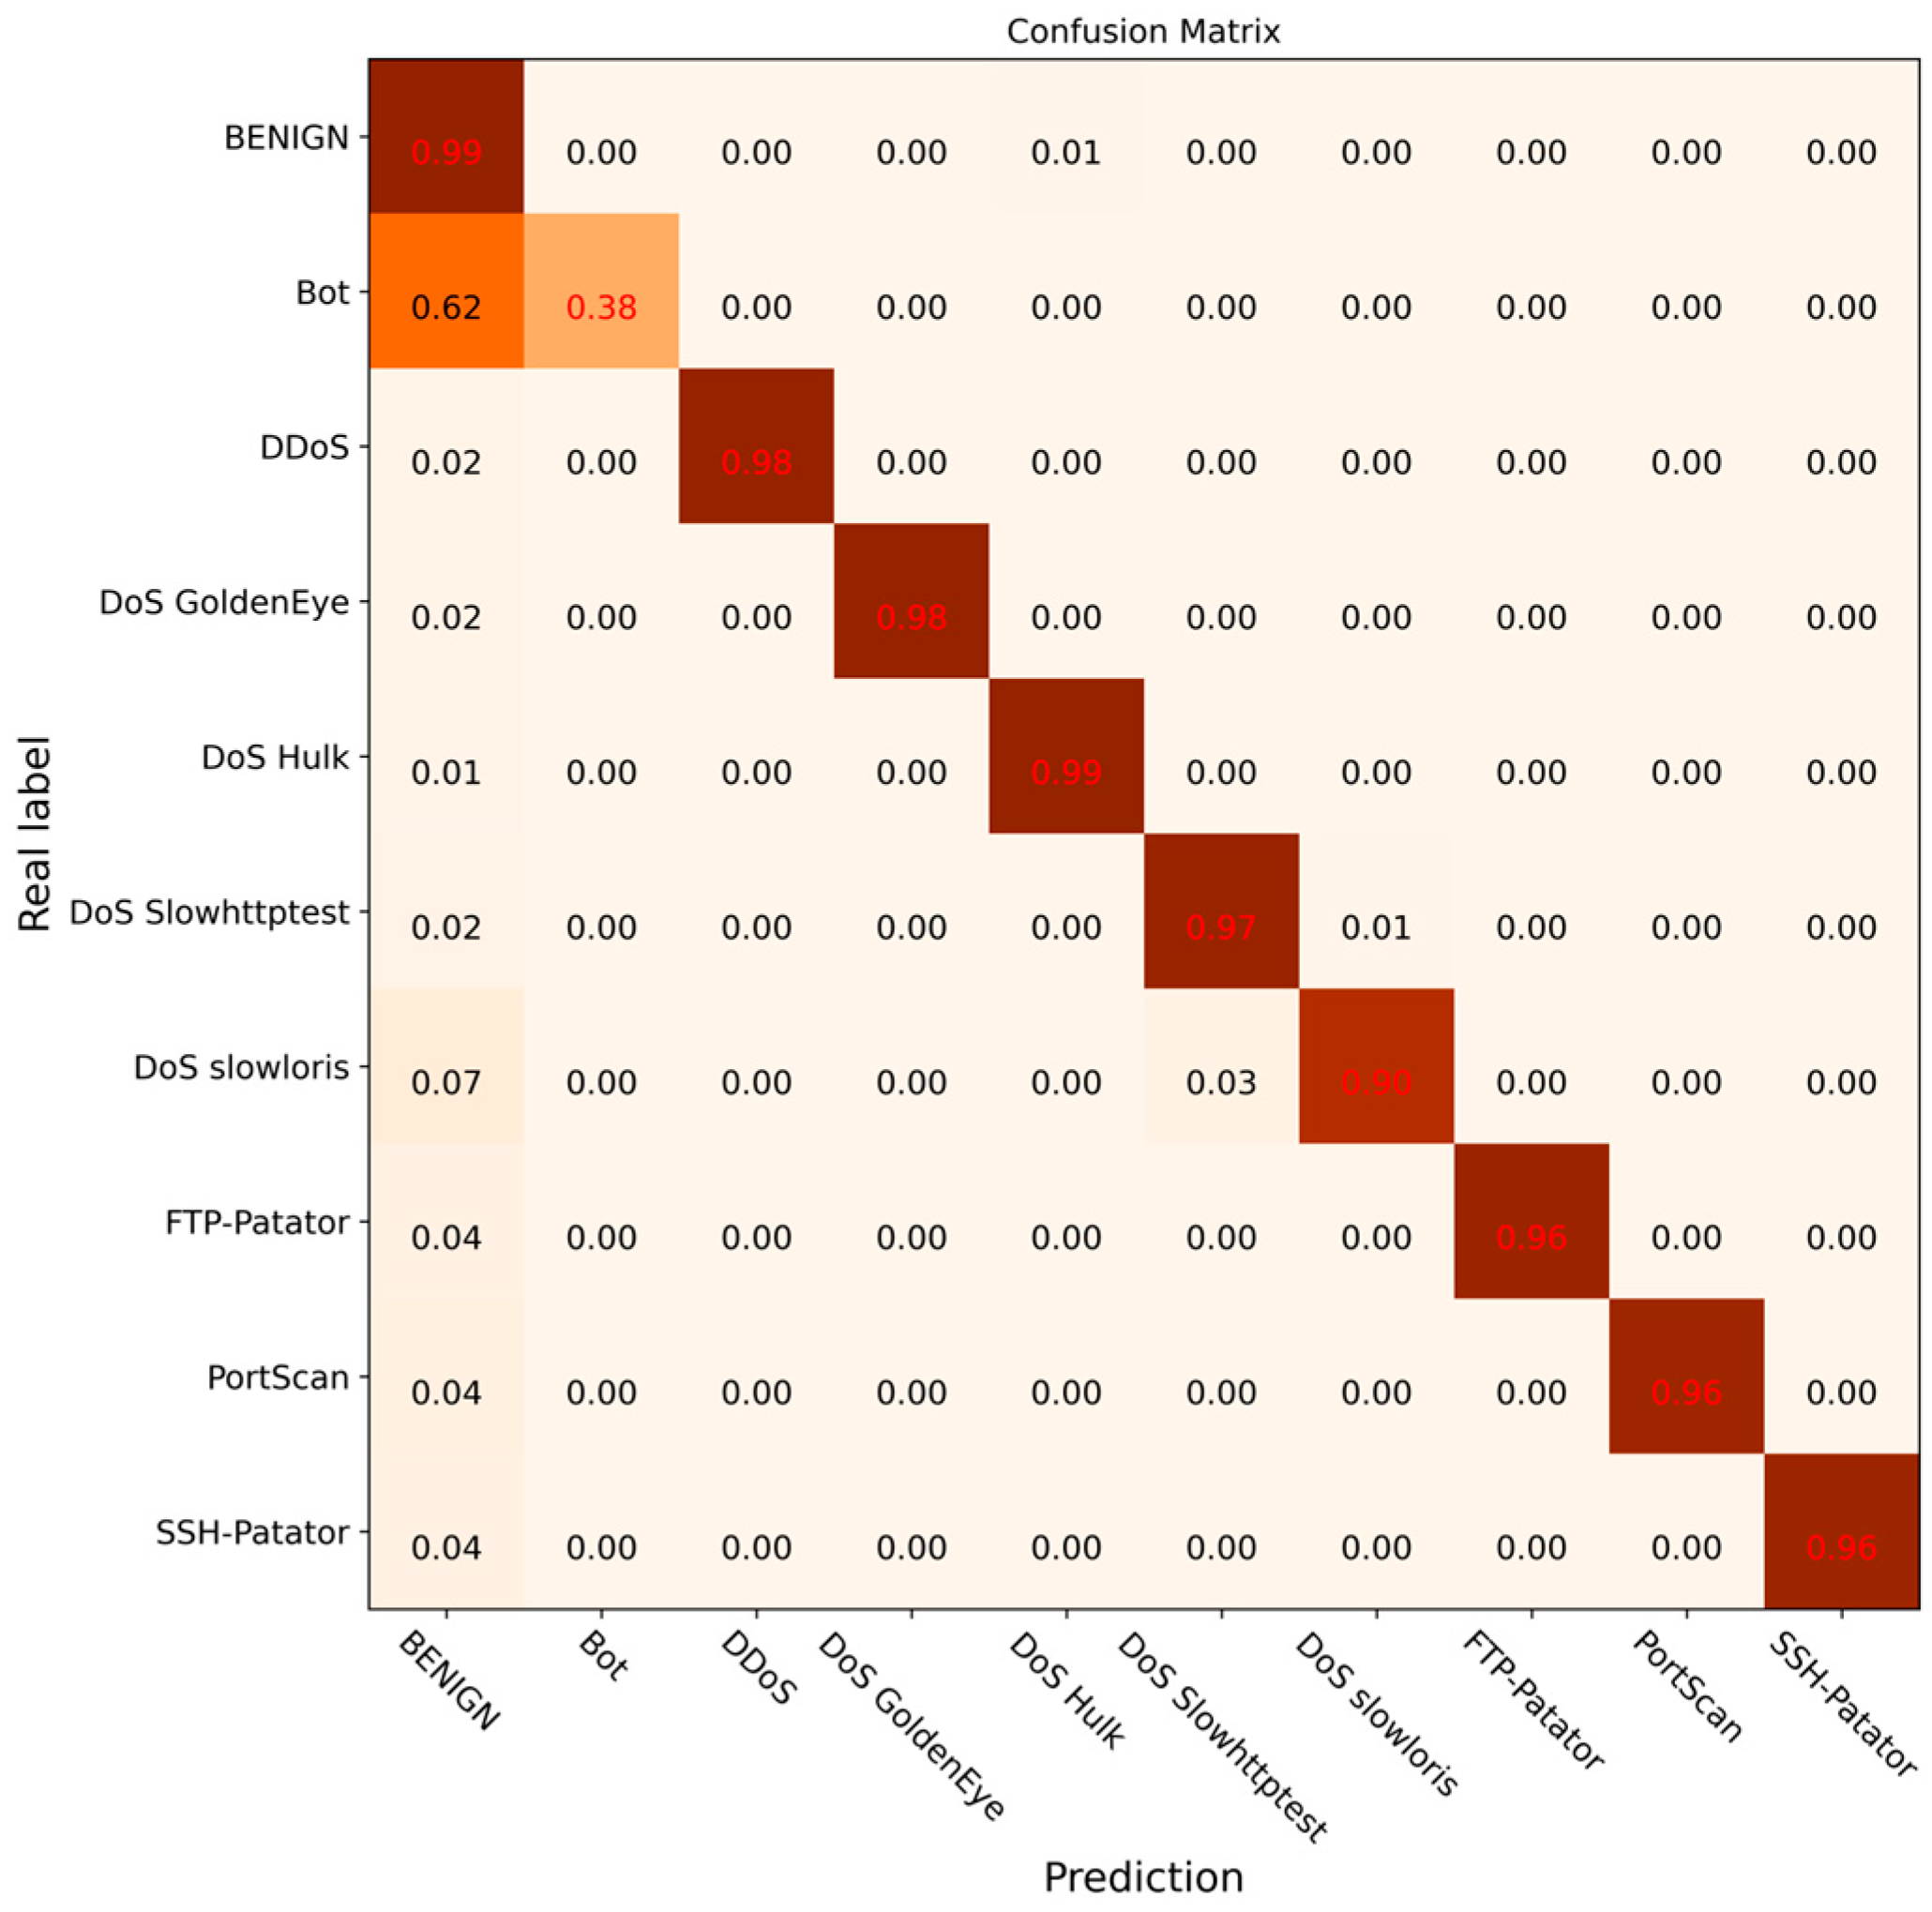
To further verify the effectiveness of the DCGCANet model and its components, ablation experiments were carried out under the same experimental environment. The experimental results are shown in Figure 14, Figure 15, Figure 16 and Figure 17. In this experiment, different modules or models were disabled separately to verify the impact and effectiveness of the proposed model through comparison. Figure 14 shows the confusion matrix results for the CNN-1D model, Figure 15 presents the results for the DC-GRU model, Figure 16 displays the results for the combined DC and CA modules, and Figure 17 illustrates the experimental results for the DCGCANet model.

Figure 14.
Confusion matrix of classification results for CNN-1D.

Figure 15.
Confusion matrix of DC-GRU classification results.

Figure 16.
Confusion matrix of classification results of CA module.
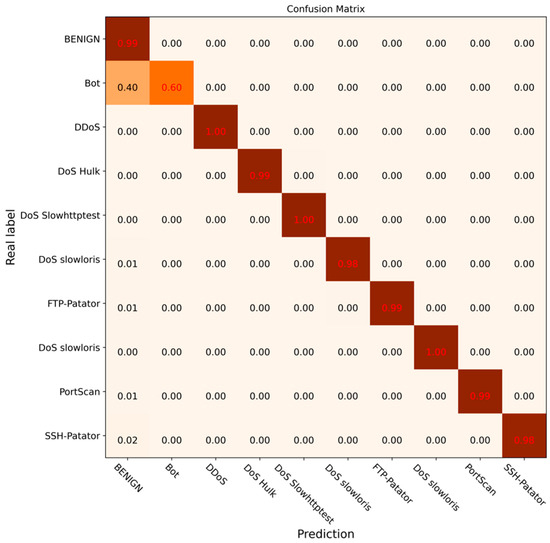
Figure 17.
Confusion matrix of classification results of DCGCANet.
From the results of the ablation experiments, it can be clearly seen that both the DC-GRU model and the CA (channel attention) module significantly improved recognition of abnormal traffic. Specifically, the DC-GRU model, with its unique dilated convolution structure, was found to capture key features in data more effectively, thereby providing a more accurate feature representation for the detection of abnormal traffic. On the other hand, the CA module, by weighting the features of different channels, enhanced the focus of the model on important features, further improving the accuracy of abnormal traffic detection. More importantly, when these two modules were combined, their complementarity resulted in a greater improvement in the overall accuracy of the model.
To better illustrate our DCGCANet model’s ability to detect abnormal traffic, comparisons were made between the DCGCANet model and several algorithms—KNN, Multi-Layer Perceptron (MLP), Random Forests (RFs), CNNs, AFM-ICNN-1D, and CNN-GRU [20]—using the CIC-IDS-2017 dataset under the same experimental conditions. The results of these comparisons are presented in Table 4.
Table 4.
Experimental results of different models.
As shown in the comparison table evaluating multiple models on accuracy, the model presented in this paper demonstrated a significant advantage despite requiring longer detection times. Specifically, our model achieved an accuracy of 99.6%, showing substantial improvements over traditional and state-of-the-art methods like KNN, ID3, MLP, RF, CNNs, and the recently developed AFM-ICNN-1D model.
As shown in Table 4, traditional machine learning algorithms such as kNN, RFs, and ID3 also achieve satisfactory detection results. However, to reduce dimensionality and improve accuracy, feature selection is necessary in machine learning methods. The method proposed in this study demonstrated superior performance in the area of feature selection.
Methods such as CNN, AFM-ICNN-1D, and CNN-GRU suffer from a certain amount of information loss due to pooling operations. In contrast, this method replaces pooling with dilated convolution and incorporates channel attention. This allows the model to assign different weights to features in different channels based on their importance, thereby enhancing the model’s ability to capture critical information and improve overall representation capability. However, due to the high complexity of the model, an increased time cost was incurred to improve the detection performance of the model.
An improvement of 3.3% in accuracy over KNN indicates a strong capability in handling complex datasets, while an increase of 1.3% compared to ID3 demonstrates high efficiency in classification decisions. Compared to MLP, an accuracy improvement of 23% was observed. Additionally, our model showed improvements of 2.9% and 4.3% over RFs and CNN, respectively, proving its excellent performance in detecting network traffic anomalies. Furthermore, significant improvements are observed in precision, recall, and F1 score, verifying the comprehensiveness and reliability of the proposed model.
To verify the generalization ability of the DCGCANet, we used the four subsets P1 to P4 of CIC-IDS2017 as the test set, and the DCGCANet was compared with the LSTM model on these datasets. The results are presented in Table 5.
Table 5.
Precision, recall and F1 values for different subsets of CIC-IDS-2017 dataset.
From the comparison results presented in Table 5, it can be observed that the precision, recall, and F1 values of the proposed DCGCANet on the four subsets of CIC-IDS2017 were above 99%, and these experimental results are significantly better than those of the LSTM model. Therefore, it can be concluded that the DCGCANet possesses a superior generalization ability. This is attributed to the DCGCANet model’s emphasis on important channel features through channel weighting, which enhances the representational capability of the model and leads to improved generalization ability.
To further verify the generalization ability of the model, the KDD Cup99 dataset was used for validation, and the results are shown in Table 6. The KDD Cup99 dataset contains normal behavior and four types of anomalous behaviors: Normal traffic (Normal), Denial of Service attack (DOS), Probe attack (Probe), Remote-to-Login attack (R2L), and User-to-Root attack (U2R).
Table 6.
The detection effect of the proposed method on the NSL-KDD dataset.
As shown in Table 6, the accuracy and detection rates for all metrics of the five attack types in the KDD Cup99 dataset were above 90% using the proposed model. The model demonstrated an excellent detection performance on both the CIC-IDS-2017 and KDD Cup99 datasets, indicating strong generalization capability.
5. Discussion
Since deep learning methods are capable of extracting useful features and capturing the relationships and regularities in features, the complexity associated with traditional feature engineering is reduced. Consequently, this paper proposes a network traffic anomaly detection model, DCGCANet, based on dilated convolution and channel attention. A continuous stacked one-dimensional dilated convolution structure was designed to effectively improve the accuracy, recall rate, and F1 score of abnormal traffic detection. Moreover, the CA module processes the features according to their varying importance, enhancing recognition accuracy compared to traditional intrusion detection algorithms. When compared with traditional machine learning methods and existing deep learning methods, the DCGCANet model demonstrates superior detection performance and higher accuracy in detecting different types of attack methods.
To address the issue of information loss caused by pooling operations in traditional convolutional neural networks and the neglect to consider the importance of different features, we propose an improved deep learning model. This model integrates one-dimensional dilated convolution and channel attention mechanisms to more effectively capture and process network traffic data.
Initially, a model based on one-dimensional dilated convolution was constructed. Unlike traditional convolution operations, dilated convolution expands the receptive field without requiring pooling, thereby capturing broader contextual information and avoiding information loss. This approach is particularly suitable for handling data with complex features or long-range dependencies, such as network traffic data.
Furthermore, a GRU model was incorporated to extract the temporal features of the traffic data. To enhance the model’s performance, a channel attention mechanism was introduced. This mechanism dynamically weights features across different channels, enabling the model to focus on those that significantly impact the classification task. By emphasizing critical features and suppressing less important information, the classification accuracy and computational efficiency were improved.
The proposed model not only overcomes the limitations of traditional convolutional neural networks in handling complex data but also significantly enhances overall performance in classification tasks.
In future work, experiments will be conducted on additional datasets to verify the generalization ability of the DCGCANet model across various types of abnormal traffic and to further enhance the model’s performance. Given the impact of data imbalance on experimental outcomes, improving the detection accuracy for small sample data has become a key focus of future research. Therefore, future studies should explore more efficient few-shot learning techniques, advanced data augmentation methods, and refined feature extraction strategies to enhance the model’s performance when dealing with imbalanced and small sample datasets.
Additionally, future research and development efforts will focus on optimizing the structure of the DC-GRU model to reduce its computational resource requirements. This includes exploring more efficient network architecture designs, such as employing more lightweight convolutional layers or implementing parameter sharing strategies, aiming to reduce the number of model parameters and computational complexity. These improvements will help enhance the model’s practicality and scalability, making it more suitable for deployment in resource-constrained environments. Additionally, network traffic data are significantly affected by data imbalance. In future work, the model structure will be optimized or techniques for handling imbalanced data will be employed to mitigate the impact of data imbalance. Strategies such as incorporating ensemble learning, data augmentation, SMOTE, or cost-sensitive learning methods will be considered to achieve this goal.
Author Contributions
Conceptualization, C.J., H.Y. and W.D.; methodology, C.J., H.Y. and W.D.; formal analysis, C.J., H.Y. and W.D.; investigation, H.Y.; writing—original draft preparation, H.Y.; writing—review and editing, C.J., H.Y. and W.D. All authors have read and agreed to the published version of the manuscript.
Funding
This research was supported by the Basic Scientific Research Project of the Liaoning Provincial Department of Education, ‘Research on Key Methods of Internet of Things Security Situation Awareness in Open Pit Mines’, of China (project number: LJKMZ20220677).
Data Availability Statement
The data presented in this study are available on request from the corresponding author due to specify the reason for the restriction.
Conflicts of Interest
The authors declare no conflicts of interest.
References
- Anderson, J.P.J.T.R.; James, P. Computer Security Threat Monitoring and Surveillance; Anderson Company: Washington, DC, USA, 1980. [Google Scholar]
- Lu, X.; Liu, P.; Lin, J. Network traffic anomaly detection based on information gain and deep learning. In Proceedings of the 2019 3rd International Conference on Information System and Data Mining, Houston, TX, USA, 6–8 April 2019; pp. 11–15. [Google Scholar]
- Gao, S.G.; Li, S.M.; Li, Q.Y.; Yu, J.W. Convolutional neural network web anomaly traffic detection method based on DAPA. Inf. Technol. Netw. Secur. 2020, 39, 8–12. (In Chinese) [Google Scholar]
- Hang, M.; Chen, W.; Zhang, R.J. Abnormal flow detection based on improved one-dimensional convolutional neural network. Comput. Appl. 2021, 41, 433. (In Chinese) [Google Scholar]
- Stiawan, D.; Heryanto, A.; Bardadi, A.; Rini, D.P.; Subroto, I.M.I.; Idris, M.Y.B.; Abdullah, A.H.; Kerim, B.; Budiarto, R. An approach for optimizing ensemble intrusion detection systems. IEEE Access 2020, 9, 6930–6947. [Google Scholar] [CrossRef]
- Xu, B.; Chen, S.; Zhang, H.; Wu, T. Incremental k-NN SVM method in intrusion detection. In Proceedings of the 2017 8th IEEE International Conference on Software Engineering and Service Science (ICSESS), Beijing, China, 24–26 November 2017; pp. 712–717. [Google Scholar]
- Halim, Z.; Yousaf, M.N.; Waqas, M.; Sulaiman, M.; Abbas, G.; Hussain, M.; Ahmad, I.; Hanif, M.J.C. An effective genetic algorithm-based feature selection method for intrusion detection systems. Comput. Secur. 2021, 110, 102448. [Google Scholar] [CrossRef]
- Singh, S. Poly logarithmic naive bayes intrusion detection system using linear stable PCA feature extraction. Wirel. Pers. Commun. 2022, 125, 3117–3132. [Google Scholar] [CrossRef]
- Gu, J.; Lu, S. An effective intrusion detection approach using SVM with naïve Bayes feature embedding. Comput. Secur. 2021, 103, 102158. [Google Scholar] [CrossRef]
- Li, Y.; Zhang, B. An Intrusion detection Algorithm based on Deep CNN. Comput. Appl. Softw. 2020, 37, 324–328. (In Chinese) [Google Scholar]
- Khan, R.U.; Zhang, X.; Kumar, R. Analysis of ResNet and GoogleNet models for malware detection. J. Comput. Virol. Hacking Tech. 2019, 15, 29–37. [Google Scholar] [CrossRef]
- Wang, Z.; Wang, Z.; Yi, F.; Zeng, C. Attack traffic detection based on LetNet-5 and GRU hierarchical deep neural network. In Proceedings of the International Conference on Wireless Algorithms, Systems, and Applications, Nanjing, China, 25–27 June 2021; pp. 327–334. [Google Scholar]
- Chen, X.Y. Network intrusion detection based on convolutional neural networks with LSTM. Inf. Technol. Netw. Secur. 2021, 40, 42–46. (In Chinese) [Google Scholar]
- Ma, W.; Zhang, Y.; Guo, J. Abnormal traffic detection method based on LSTM and improved residual neural network optimization. J. Commun. 2021, 42, 23–40. (In Chinese) [Google Scholar]
- Xu, H.; Ma, Z.; Yi, H.; Zhang, L. Network Traffic Anomaly Detection Technology Based on Convolutional Recurrent Neural Network. Netinfo Secur. 2022, 21, 54–62. (In Chinese) [Google Scholar]
- Sun, H.; Chen, M.; Weng, J.; Liu, Z.; Geng, G. Anomaly detection for in-vehicle network using CNN-LSTM with attention mechanism. IEEE Trans. Veh. Technol. 2021, 70, 10880–10893. [Google Scholar] [CrossRef]
- Jia, Z.; Yao, Y.; Wang, Q.; Wang, X.; Liu, B.; Jiang, Z. Trojan traffic detection based on meta-learning. In Proceedings of the Computational Science–ICCS 2021: 21st International Conference, Krakow, Poland, 16–18 June 2021; Proceedings, Part II 21, 2021. pp. 167–180. [Google Scholar]
- Ji, C.P.; Yu, H.F.; Dai, W. Network Traffic Anomaly Detection based on Dilated Convolution and Channel Attention. In Proceedings of the 4th IFSA Winter Conference on Automation, Robotics & Communications for Industry 4.0/5.0, (ARCI’ 2024), Innsbruck, Austria, 7–9 February 2024; pp. 90–97. [Google Scholar]
- Li, C.; Qiu, Z.; Cao, X.; Chen, Z.; Gao, H.; Hua, Z. Hybrid dilated convolution with multi-scale residual fusion network for hyperspectral image classification. Micromachines 2021, 12, 545. [Google Scholar] [CrossRef] [PubMed]
- Zhang, X.J.; Wang, H.B. Research on intrusion detection algorithm based on CNN-GRU. J. Tianjin Univ. Technol. 2022, 38, 37–42. (In Chinese) [Google Scholar]


Disclaimer/Publisher’s Note: The statements, opinions and data contained in all publications are solely those of the individual author(s) and contributor(s) and not of MDPI and/or the editor(s). MDPI and/or the editor(s) disclaim responsibility for any injury to people or property resulting from any ideas, methods, instructions or products referred to in the content. |
© 2024 by the authors. Licensee MDPI, Basel, Switzerland. This article is an open access article distributed under the terms and conditions of the Creative Commons Attribution (CC BY) license (https://creativecommons.org/licenses/by/4.0/).