Article

Adsorption and Diffusion Properties of Gas in Nanopores of Kerogen: Insights from Grand Canonical Monte Carlo and Molecular Dynamics Simulations

1
Research Institute of Exploration & Development, Xinjing Oilfield Company, PetroChina, Karamay 834000, China
2
School of Emergency Management and Safety Engineering, China University of Mining and Technology, Beijing 100083, China
3
Academy for Advanced Interdisciplinary Studies, Southern University of Science and Technology, Shenzhen 518055, China
4
Research Institute of Engineering Technology, Xinjing Oilfield Company, PetroChina, Karamay 834000, China
*
Author to whom correspondence should be addressed.
Processes 2024, 12(7), 1438; https://doi.org/10.3390/pr12071438
Submission received: 21 May 2024 / Revised: 4 July 2024 / Accepted: 5 July 2024 / Published: 9 July 2024
(This article belongs to the Special Issue Production of Energy-Efficient Natural Gas Hydrate)

Abstract

:
Investigating the adsorption and diffusion processes of shale gas within the nanopores of kerogen is essential for comprehending the presence of shale gas in organic matter of shale. In this study, an organic nanoporous structure was constructed based on the unit structure of Longmaxi shale kerogen. Grand canonical Monte Carlo and molecular dynamics simulation methods were employed to explore the adsorption and diffusion mechanisms of pure CH4, CO2, and N2, as well as their binary mixtures with varying mole fractions. The results revealed that the physical adsorption characteristics of CH4, CO2, and N2 gases on kerogen adhered to the Langmuir adsorption law. The quantity of adsorbed gas molecules increased with rising pressure but decreased with increasing temperature. The variation in the heat of adsorption was also analyzed. Under identical temperature and pressure conditions, the adsorption of CH4 increased with higher mole fractions of CH4, whereas it decreased with greater mole fractions of CO2 and N2. Notably, CO2 molecules exhibited a robust interaction with kerogen molecules compared to the adsorption properties of CH4 and N2. Furthermore, the self-diffusion coefficient of gas within kerogen nanopores gradually decreased with increasing pressure or decreasing temperature. The diffusion capacity of gas molecules followed the descending order N2 > CH4 > CO2 under the same pressure and temperature conditions.

1. Introduction

With the ongoing surge in global energy consumption, there has been a heightened focus on the exploration and development of oil and natural gas in recent years. Shale gas, an unconventional resource, has emerged as a focal point in the global quest for natural gas resources. Its exploration and utilization are pivotal for future energy needs [1,2]. Simultaneously, shale gas plays a crucial role in the overall landscape of oil and natural gas development and is a cornerstone in national strategic energy reserves, garnering significant attention worldwide [3,4].
Shale gas refers to the natural gas stored in shale formations, characterized by its richness in organic matter (e.g., kerogen) and clay minerals (e.g., montmorillonite, illite, kaolinite, chlorite, etc.). While a small portion of gas dissolves in the formation water, the majority of free gas is present in large pores and natural cracks, with a significant amount of adsorbed gas stored in the nanopores of clay mineral and kerogen particles [5,6,7]. The development of nanopores in shale reservoirs results in an exceptionally large specific surface area for shale. Consequently, the adsorption capacity of shale gas can range from 20% to 80% [8,9]. Understanding the diffusion process of desorbed gas in pores is crucial for shale gas migration as pressure decreases. The complexity of shale gas diffusion arises from the presence of numerous nanopores formed by clay minerals and organic matter. Consequently, the adsorption properties of shale gas are influenced not only by the physical and chemical properties of clay minerals but also by external conditions such as pressure, temperature, and water content [7,10,11,12]. Previous research on shale gas adsorption characteristics has predominantly relied on isotherm adsorption experiments [11,13] and isotherm adsorption models [14,15,16]. Previous studies have developed new adsorption models based on extensive experimental data, offering more realistic representations of shale gas adsorption in actual scenarios [17,18]. However, due to the limitations of experimental tests, the variation in adsorption amounts has not been fully explained at the molecular level, particularly concerning kerogen nanopores. The diffusion characteristics of shale gas have primarily been investigated through experimental tests of diffusion coefficients, revealing variations under different temperature and pressure conditions [19,20]. Mathematical models based on Fick’s law have been established to describe shale gas diffusion, considering the effects of reservoir conditions, gas types, and other factors [21,22]. Despite analyzing the diffusion properties of shale gas in nanopores through mathematical models, these approaches fall short of providing a comprehensive micro-scale explanation for the variation in diffusion coefficients and diffusion flux of shale gas. Accurately revealing the adsorption patterns and mechanisms of shale gas in the nanopores of shale from a molecular level remains challenging. With the rapid development of computer technology, molecular simulation methods have become a powerful tool for studying the properties of fluids in confined spaces. These methods can provide insights into adsorption structures and dynamic processes at the molecular level, which are difficult to observe and detect experimentally. Grand canonical Monte Carlo (GCMC) and molecular dynamics (MD) simulations have been used to provide insights into the mineral and kerogen structures, microscopic adsorption [23,24,25], diffusion [26,27], flow [28], and transport properties of fluids [29,30,31]. For example, Julien Collenll et al. [32] established the structure of type II kerogen based on the proportions of various elements. The GCMC and MD methods were used to study the pore size distribution and diffusion properties of fluids in kerogen systems. Philippe Ungerer et al. [33] employed molecular simulation methods to create the molecular structure of type I, II, and III kerogen based on their C/H and C/O ratios, investigating the thermodynamics properties and maturities of various types of kerogen. Such simulations offer a reliable foundation for understanding the interaction between kerogen and gas fluids in natural gas reservoirs. The Longmaxi formation in the Sichuan Basin serves as the primary shale exploration and development block in China. While numerous studies have investigated the physical and geochemical characteristics as well as the pore evolution of shale samples in this region over the past few years, few studies have delved into the microscopic mechanisms of shale gas adsorption and diffusion within the organic matter of Longmaxi shale.
In this study, the adsorption and diffusion properties of shale gas in the kerogen nanopores of Longmaxi shale were investigated using GCMC and MD simulations. A three-dimensional model comprising five kerogen molecules was constructed for the analysis. The investigation focused on the adsorption and diffusion of pure CH4, CO2, and N2, along with their binary mixtures at various mole fractions. Calculations were conducted to determine the adsorption amount, isosteric heat, self-diffusion coefficient, and radial distribution function. The microscopic adsorption and diffusion properties of these gases in kerogen were thoroughly analyzed.

2. Simulation Method

2.1. Kerogen Model

Utilizing the average molecular structure as a reference [34], the simulation model for shale gas adsorption and diffusion was constructed based on the Longmaxi kerogen molecule (Type II kerogen: O/C = 0.092; H/C = 0.77) [35]. This molecular structure predominantly consists of aromatic hydrocarbons, including benzene rings, hydroxyl groups, methylene, methyl, hydroxyl groups, and various other functional groups. Alkene and carbonyl groups serve as the structural units linking each aromatic hydrocarbon. It has been found that kerogen functional groups containing nitrogen (N) and oxygen (O) elements increase the CH4 adsorption capacity, while functional groups containing methyl groups have a weak impact on CH4 adsorption capacity [36]. In this study, the chemical formula of kerogen is C206H158O19N4S4. The kerogen molecular structure was generated, and the initial model underwent annealing optimization from a high temperature to a low temperature to achieve the lowest energy configuration. A snapshot of the kerogen structure is depicted in Figure 1a.
Firstly, the initial three-dimensional model was optimized. Subsequently, an annealing simulation was employed to achieve an optimized model. Throughout the molecular mechanics and annealing molecular dynamics optimization, the total energy of the model underwent gradual changes. As a result, the final dimensions of the three-dimensional model were established at 3.184 nm × 3.184 nm × 3.184 nm. A visual representation of the three-dimensional model is depicted in Figure 1b. Throughout the molecular dynamics optimization process, the density of kerogen exhibited fluctuations, hovering around 1.035 g/cm3. This value is close to the density of 1.01 g/cm3 reported in a previous study once energy stabilization was achieved [37].

2.2. Simulation Details

COMPASS (condensed-phase optimized molecular potentials for atomistic simulation studies), widely employed in previous studies for organics, was chosen for the models [38]. To investigate the adsorption behavior of pure CH4, CO2, and N2, along with their binary mixtures at different mole fractions in the nanopores of kerogen, GCMC was employed. The interactions between gas molecules and kerogen are governed by Van der Waals and electrostatic interactions [39]. The Metropolis sampling method was applied to determine the formation, migration, and rotation of molecules. Electrostatic long-range effects were calculated using the Ewald summation method, while Van der Waals interactions were handled with an atom-based method. First, the steepest descent algorithm was used to obtain the energy-minimized stable configuration. Then, the adsorption simulation was conducted under constant pressure and temperature conditions, with a total of 3 × 10⁷ simulation steps. The first half of the simulation process ensured adsorption equilibrium, while the latter half focused on ensemble averaging and calculating parameters such as the adsorption capacity, adsorption energy, and heat of adsorption. The cutoff distance was set at 1.25 nm. The simulated temperatures were set to 303.15 K, 333.15 K, 348.15 K, and 363.15 K. The maximum simulated pressure was 30 MPa, and the adsorption and diffusion simulations were performed point by point to account for the actual temperature and pressure conditions of the shale reservoir. The detailed composition, temperature, and pressure conditions are shown in Table 1.
A molecular dynamics simulation was employed to calculate the position, velocity, and energy of particles at various simulation times. Utilizing the configuration obtained from the adsorption simulations, the molecular dynamics method was applied to simulate the diffusion of shale gas within the kerogen system. The gas diffusion process used the same force field parameters and interaction forces between gases as those employed in the adsorption process. The adsorption configuration was employed for isothermal–isobaric simulations, with initial velocities randomized. The simulation utilized the Nosé–Hoover thermostat and Parrinello–Rahman barostat with temporal constants set to 1.0 ps and 4.0 ps, respectively. The total simulation time was set to 2 ns, with a time step of 1 fs, ensuring that the mean squared displacement exhibited a genuinely linear trend over time. Periodic boundary conditions were maintained throughout the entire simulation.

3. Results and Discussion

3.1. Pore Volume and Special Surface Area

The pore structure of kerogen significantly influences the adsorption and storage of shale gas. To quantify the pore volume and specific surface area, a three-dimensional model with probe molecules (CH4, CO2, and N2) was analyzed [40,41]. The molecular diameters of CH4, CO2, and N2 are 3.80 Å, 3.30 Å, and 3.64 Å, respectively. The resulting pore volume and specific surface area of the kerogen model with different probe molecules are presented in Table 2.

3.2. Gas Fugacity

Gas fugacity represents the effective pressure exerted by a gas in a non-ideal system. It is used to account for the deviations of real gases from ideal gas behavior. The Peng–Robinson (PR) equation of state [42] was employed to calculate the fugacity at different temperatures and pressures, as illustrated in Figure 2. The critical parameters, including critical temperature, critical pressure, critical volume, acentric factor, and molar mass, are detailed in Table 3.

3.3. Adsorption Isotherm of Pure Component

The adsorption curves of CH4, CO2, and N2 in the kerogen model were fitted using the Langmuir adsorption model [44], as depicted in Equation (1).
V = V L P P L + P
where V is the adsorption capacity; VL is the Langmuir volume, which reflects the maximum adsorption capacity; PL is the Langmuir pressure, indicating the pressure for the half-maximal adsorption capacity; and P is the equilibrium pressure.
The adsorption isotherms of CH4, CO2, and N2 in the kerogen model are illustrated in Figure 3. As observed in Figure 3, the adsorption capacity of different gases increased with the rise in pressure, with CO2 exhibiting a significantly larger adsorption rate and capacity compared to CH4 and N2. The adsorption capacity approached saturation as the pressure reached 30 MPa. The descending order of adsorption capacity for gases was found to be CO2 > CH4 > N2. Moreover, the adsorption capacity decreased with an increase in temperature under constant pressure conditions. This suggests that elevated temperatures negatively impact gas adsorption. The rationale behind this observation lies in the increased thermal motion of gas molecules with rising temperatures, leading to a higher average kinetic energy of gas molecules. This heightened kinetic energy may facilitate an easier escape from the kerogen surface, consequently reducing the gas adsorption capacity. In addition, the molecular diameter of CO2 (approximately 3.3 Å) is slightly smaller than that of CH4 (approximately 3.8 Å), which makes CO2 molecules more easily able to enter and diffuse within the nanopores of kerogen. The smaller molecular diameter increases the opportunities for CO2 to come into contact with the adsorbent surface, thereby enhancing adsorption capacity. Meanwhile, the CO2 molecule is linear, whereas CH4 is a tetrahedral molecule. The shape of the CO2 molecule makes it easier to find suitable positions for adsorption in the narrow pores of the kerogen structure. Through a comparison between the simulation results and the Langmuir model fitting outcomes, the Langmuir adsorption parameters (VL and PL) and the average relative errors were determined and are presented in Table 4. Table 4 indicates that the Langmuir adsorption model achieved a fitting precision exceeding 0.99, with fitting errors less than 1.3%. These results affirm that the adsorption properties of gas in kerogen adhere to the Langmuir adsorption law.

3.4. Isosteric Heat of Gas Adsorption

Figure 4a illustrates the variation in the isosteric heat of CH4 adsorption under different pressure and temperature conditions. The observed trend indicates that the isosteric heat of CH4 adsorption decreases with an increase in temperature. This suggests that the interaction between CH4 molecules and kerogen diminishes as the temperature rises, leading to a decrease in the adsorption capacity of CH4 molecules. In Figure 4b, a comparison of the isosteric heat of CH4, CO2, and N2 adsorption under different pressures is presented. It is evident that the isosteric heat of CO2 adsorption is significantly higher than that of CH4 and N2. Furthermore, the values of the isosteric heat of CH4, CO2, and N2 adsorption are all less than 42 kJ/mol [45], indicating that the adsorption of gas molecules in kerogen systems falls under the category of physical adsorption.

3.5. Energy Distribution

Figure 5 illustrates the energy distribution curves of CO2, CH4, and N2 in kerogen models. The curves display a single-peak distribution, with the maximum energy distribution values for CO2, CH4, and N2 being −26.96 kJ/mol, −17.35 kJ/mol, and −13.17 kJ/mol, respectively. This result indicates that CO2, CH4, and N2 primarily adsorb onto distinct sites within the kerogen models. In kerogen pores, CO2, CH4, and N2 molecules compete for adsorption space and sites. Notably, the energy distribution range of CO2 is considerably broader than that of CH4 and N2. This difference leads to a reduction in adsorption space and sites for CH4 and N2, consequently resulting in a decrease in the adsorption capacity of CH4 and N2. Additionally, it suggests that the adsorption of N2 on kerogen is not as stable as that of CH4 and CO2.

3.6. Adsorption Isotherm of Binary Components

Figure 6 depicts the adsorption capacity of CH4, CO2, and N2 within the nanopores of kerogen with varying mole fractions of CO2 and N2. At low pressures, the adsorption capacity of CH4, CO2, and N2 increases with increasing pressure. However, at 10 MPa, the adsorption of CH4 shows minimal changes with further pressure increases, indicating a negligible impact of pressure on CH4 adsorption. Similarly, at 5 MPa and 20 MPa, the adsorption of CO2 and N2, respectively, exhibits minimal changes with further pressure increases. Under identical temperature and pressure conditions, the adsorption of CH4 increases with the increasing mole fraction of CH4, suggesting that the adsorption of CH4 decreases with an increase in the content of N2 (or CO2). This observation indicates that the lower the mole fraction of CH4 in the binary component mixture, the lower the CH4 adsorption in kerogen pores. Furthermore, the adsorption capacity of CH4 in a CH4 and N2 mixed system is significantly higher than that in a CH4 and CO2 mixed system, indicating that the adsorption capacity of CH4 is greater than that of N2 but less than that of CO2.

3.7. Self-Diffusion Coefficient

The diffusion behaviors of shale gas in kerogen nanopores are characterized by the self-diffusion coefficient, calculated using the Einstein equation (Equation (2)) [46].
D s = lim t 1 6 N t i = 1 N r i ( t ) r i ( 0 ) 2
where D s is the self-diffusion coefficient, N is the number of particles, t is the time interval, r ( t ) is the position of the gas molecule at time t, and r i ( t ) r i ( 0 ) 2 is the mean square displacement (MSD) of molecules. The relationship between MSD and time is typically fitted to a straight line, and the self-diffusion coefficient is proportional to 1/6 of the slope of MSD versus time.
In Figure 7, it is evident that the self-diffusion coefficient of gas molecules decreases with an increase in pressure. At lower pressures, the reduction in the self-diffusion coefficient is relatively pronounced, but as pressure increases further, the decrease becomes more gradual. This observation is attributed to elevated pressure causing an increased number of gas molecules in the kerogen nanopores and a higher probability of collisions between molecules. The increasing motion resistance due to reduced available space results in a decrease in the self-diffusion coefficient. Beyond a certain pressure threshold, the velocity of gas molecules stabilizes gradually, leading to a less pronounced decline in the diffusion coefficient. With an increase in temperature, the irregular motion of gas molecules intensifies, resulting in a larger self-diffusion coefficient. Consequently, the interaction between gas molecules becomes the primary factor controlling molecular diffusion. At the same temperature, the self-diffusion coefficient of fluids follows the descending order: N2 > CH4 > CO2. This trend can be explained by classical diffusion theory, where the diffusion coefficient is inversely proportional to the square root of the molecular mass. CO2 molecules have a large mass and hence a smaller self-diffusion coefficient. However, at the same temperature, CH4, CO2, and N2 possess the same average kinetic energy. Due to their lighter mass, N2 molecules move faster in the nanopores of kerogen, resulting in a higher diffusion rate for N2. Moreover, smaller N2 molecules can more easily pass through narrow pores, whereas larger CH4 and CO2 molecules may encounter restrictions. Additionally, lighter N2 molecules regain their velocity faster after collisions, thus diffusing more rapidly within the nanopores of kerogen. This behavior is attributed to stronger interactions between CO2 molecules and kerogen compared to CH4, which reduces the movement of CO2 molecules and thereby lowers their diffusion coefficient.

3.8. Radial Distribution Function

The radial distribution function is employed to characterize the distribution of gas molecules around kerogen structures and assess their interactions with kerogen. The radial distribution function is defined as the ratio of local density to average bulk density [47], and it is commonly employed to characterize the microstructure of particles. In Figure 8, the radial distribution functions of gas molecules are compared with atoms (C, H, O, N, and S) in kerogen. The peak values between gas molecules and O, N, and C atoms in kerogen are notably larger than those between gas molecules and H and S atoms, indicating weaker interactions between gas molecules and H and S atoms. A significant peak is observed between gas molecules and N atoms, suggesting the presence of N-H bonds in kerogen, which leads to stronger interactions between gas molecules and N-H bonds. Furthermore, the first peak of radial distribution functions between CO2 and O occurs at 0.335 nm, and it is sharper and larger than those between CH4-O and CH4-N, indicating strong adsorption of CO2 on sites with oxygen-containing functional groups. This observation is consistent with the snapshots of gas molecule distributions on the surface of local kerogen structures (Figure 8d–f), suggesting the superior adsorption capability of CO2 in kerogen, significantly exceeding that of CH4 and N2.

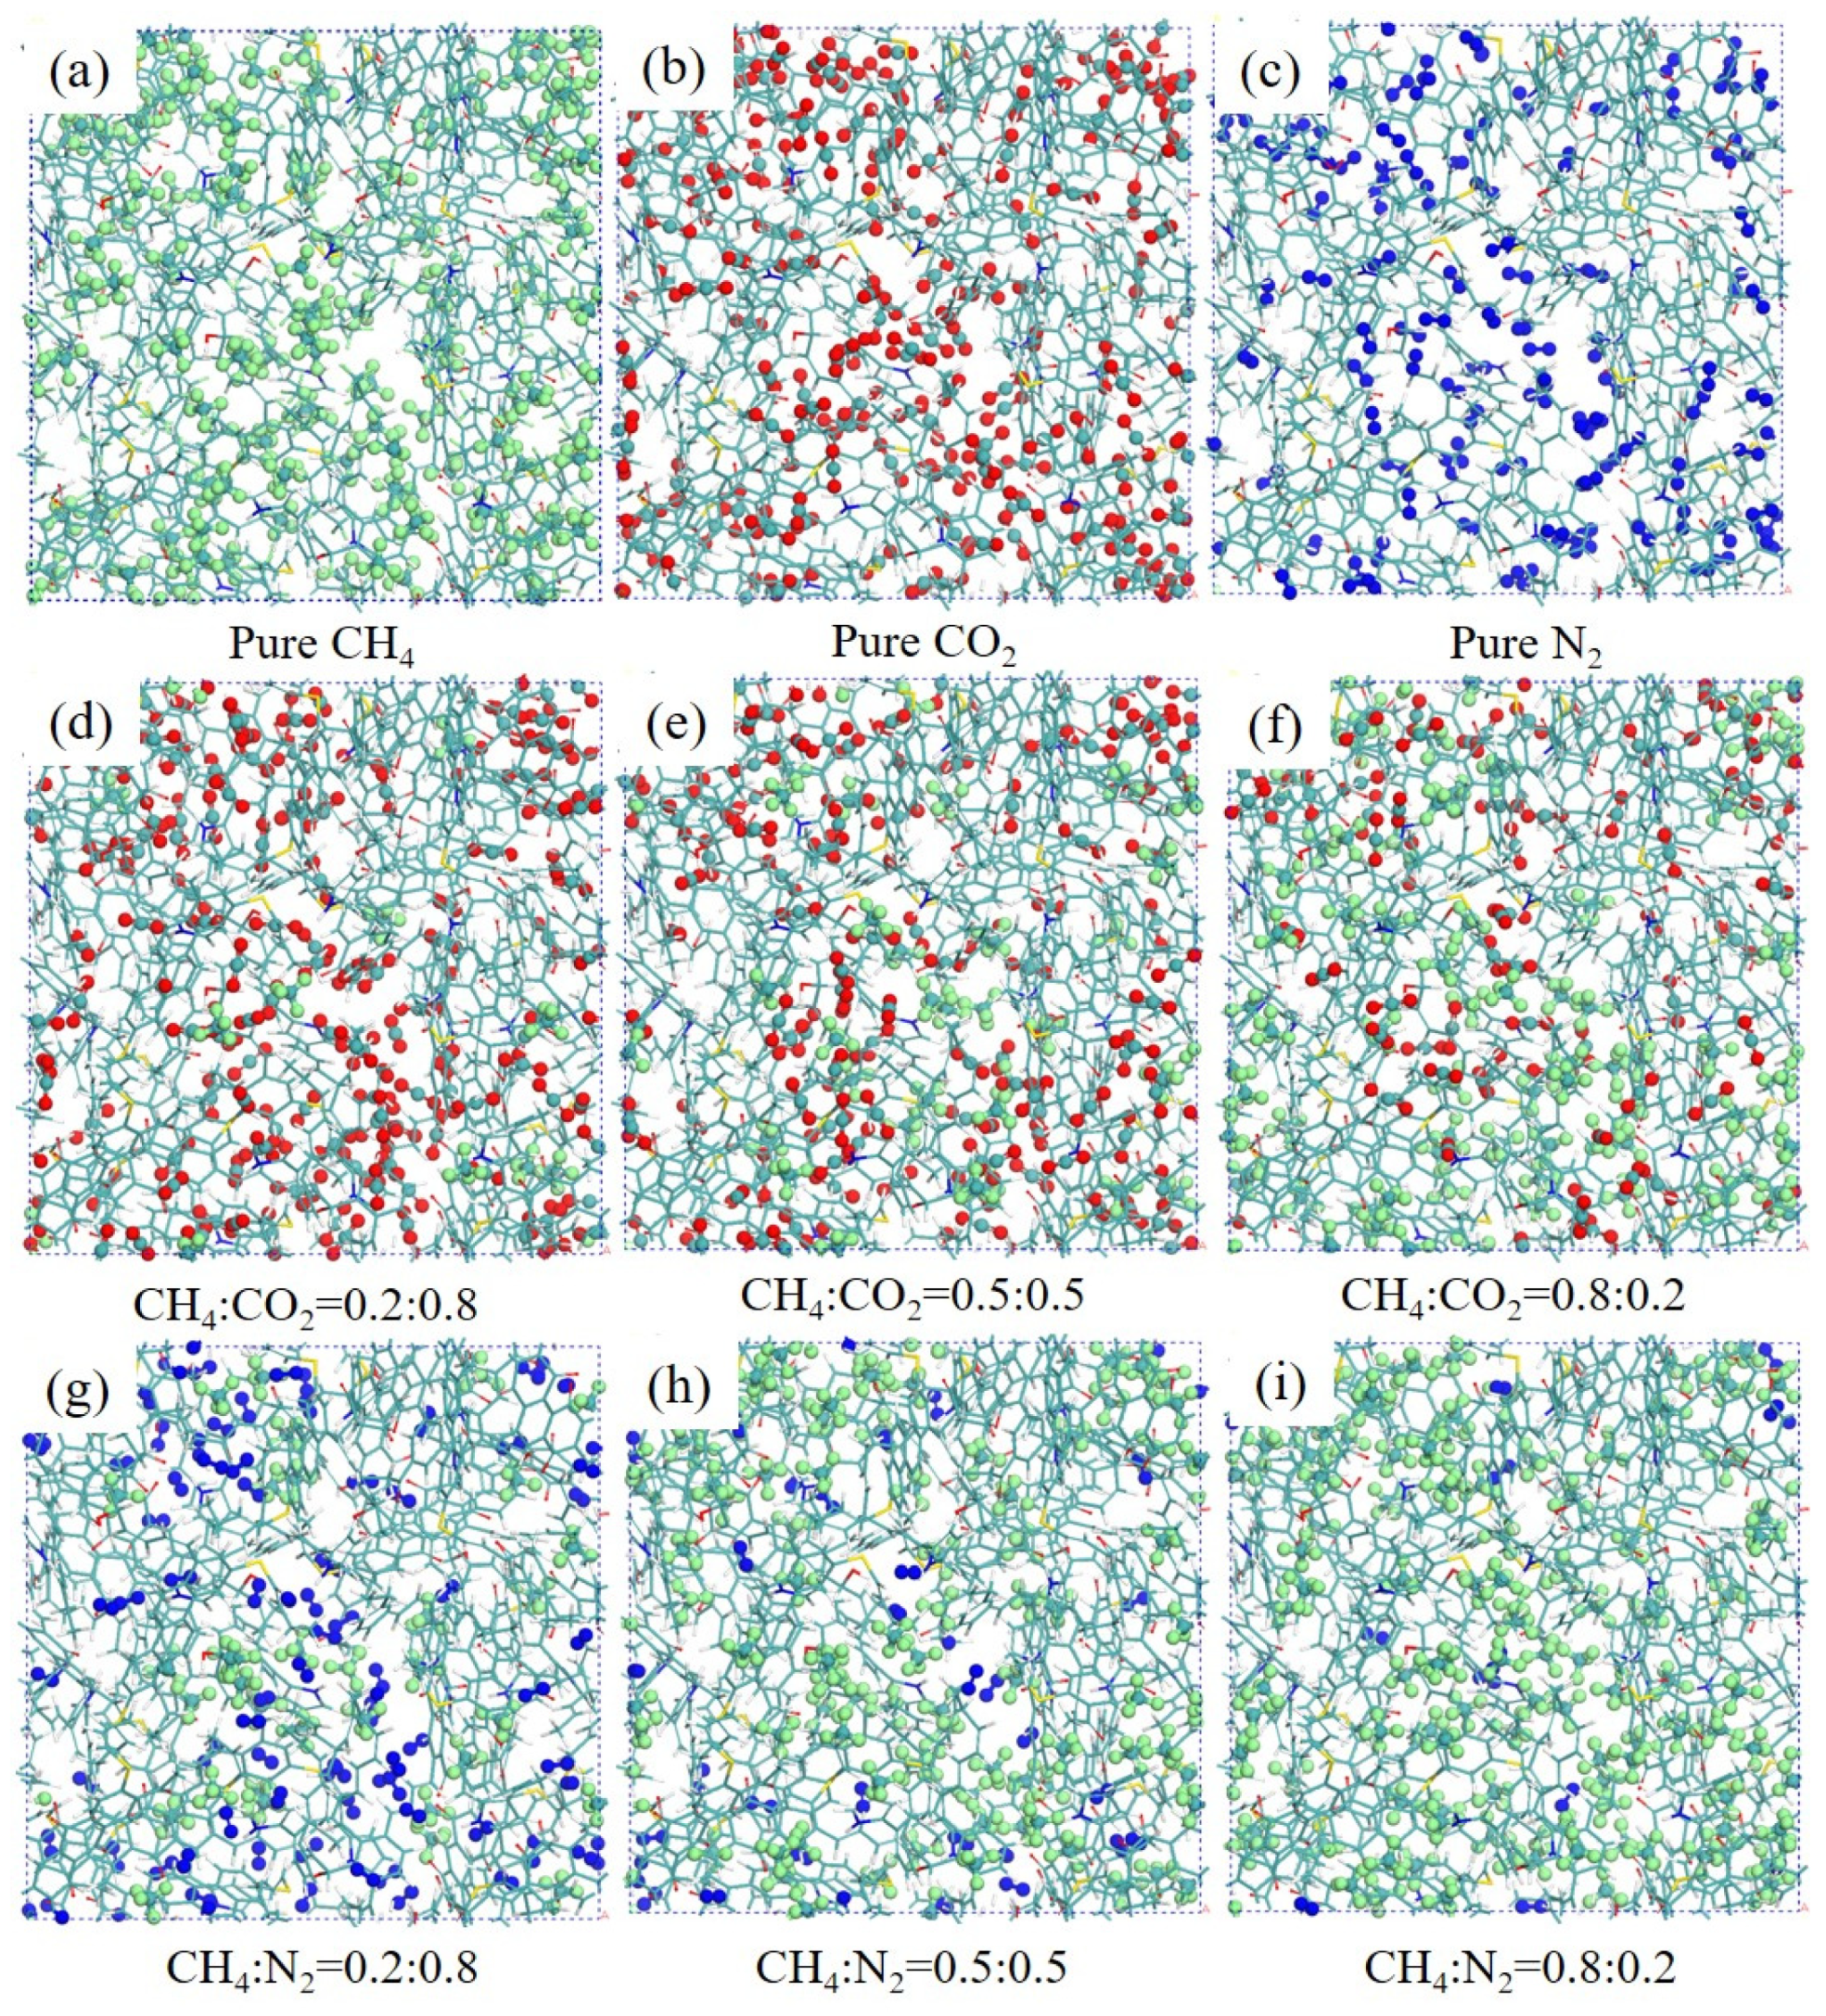
3.9. Distribution of CH4, CO2, and N2 in Kerogen Models

The distribution characteristics of CH4, CO2, and N2 in the kerogen model were analyzed. Figure 9 shows the snapshots of pure CH4 (a), CO2 (b), and N2 (c) distributions in the nanopores of kerogen, demonstrating that gas molecules predominantly occupy the nanopores of the kerogen model. This observation provides a visual explanation for the previously noted trend in adsorption capacity, where, under the same temperature and pressure conditions, the adsorption capacity of gases in the kerogen nanopores follows the order CO2 > CH4 > N2. Figure 9d–i depict the distribution of binary components (CH4/CO2 and CH4/N2) at three different mole fractions in the nanopores of kerogen. The results reveal that as the mole fraction of CH4 increases, the number of CH4 molecules in kerogen nanopores also increases. However, even at high mole fractions of CH4, CO2 continues to occupy a significant portion of the available space. Specifically, when the mole fraction of the two components is 1:1 in the binary mixture, the adsorption amount of CO2 is notably greater than that of CH4. These findings indicate a stronger adsorption capacity of CO2 compared to CH4 in kerogen nanopores, with CO2 exerting a more significant influence on the adsorption behavior of CH4. Similarly, the results demonstrate that the adsorption capacity of N2 in kerogen nanopores is lower than that of CH4. CO2 molecules that are injected into a shale gas reservoir can competitively adsorb with CH4 in kerogen nanopores, thereby promoting the release of CH4 molecules. This process effectively enhances the recovery rate of shale gas. While CH4 adsorption is relatively stable, theoretical approaches can be explored to partially desorb CH4 through stronger additives or optimized displacement conditions to minimize its retention in kerogen. In summary, understanding the differential adsorption mechanisms of CO₂ and CH4 in kerogen nanopores is crucial for optimizing extraction strategies, thereby improving the efficiency and economics of shale gas recovery.

4. Conclusions

The adsorption and diffusion of CH4, CO2, and N2, including their binary mixtures with varying mole fractions in kerogen nanopores, were investigated using GCMC and MD methods. The results exhibit a strong correlation (0.99) with the Langmuir adsorption model. Gas adsorption capacity shows an increase with pressure and a decrease with temperature. Specifically, the adsorbed amount of CH4 decreases as the mole fraction of CO2 and N2 in the gas phase increases. Below 15 MPa, the adsorption capacity of all gas molecules increases rapidly. N2 exhibits adsorption at higher energy sites on kerogen, resulting in reduced adsorption stability and lower capacity compared to CH4 and CO2. The presence of oxygen-containing functional groups enhances gas adsorption. At identical temperature and pressure conditions, the diffusion capacity of gas follows the order N2 > CH4 > CO2, ranging from 2 × 10⁻¹⁰ m2/s to 5 × 10⁻¹⁰ m2/s. These findings contribute to understanding the mechanisms of gas storage in kerogen nanopores, particularly in advancing strategies for the CO2 displacement of CH4 in shale gas extraction.

Author Contributions

Conceptualization, Y.L.; Software, X.L.; Investigation, X.L., Q.Z., N.W., Y.Q., Y.Z. and C.Y.; Resources, S.X., Q.Z., N.W., Y.Q. and Y.Z.; Data curation, C.Y.; Writing—original draft, S.X.; Writing—review & editing, Y.L.; Supervision, Y.L. All authors have read and agreed to the published version of the manuscript.

Funding

This work is supported by the Shenzhen Science and Technology Program (RCBS20221008093233048), Guangdong Basic and Applied Basic Research Foundation (2022A1515010093), Center for Computational Science and Engineering at Southern University of Science and Technology.

Data Availability Statement

The data presented in this study are available on request from the corresponding author.

Conflicts of Interest

Author Shouheng Xiao, Qiang Zheng, Ning Wang, Youyin Zhang and Chuanjun Yi were employed by the company Research Institute of Exploration & Development, Xinjing Oilfield Company. Author Yun Qiao was employed by the company Research Institute of Engineering Technology, Xinjing Oilfield Company. The remaining authors declare that the research was conducted in the absence of any commercial or financial relationships that could be construed as a potential conflict of interest.

Nomenclature

GCMCGrand canonical Monte Carlo
MDMolecular dynamics
RDFRadial distribution function
MSDMean square displacement
DsSelf-diffusion coefficient (m2/s)
NNumber of particles
tTime interval (s)
ri(t)Position of the i-th gas molecule at time t
r i ( t ) r i ( 0 ) 2 Mean square displacement of molecules
VAdsorption capacity
VLLangmuir volume, the maximum adsorption capacity
PLLangmuir pressure, the pressure for half-maximal adsorption capacity
PEquilibrium pressure
TTemperature (K)
ρ(r)Local density
ρ0Average bulk density
CH4Methane
CO2Carbon dioxide
N2Nitrogen
TcCritical temperature (K)
PcCritical pressure (MPa)
VcCritical volume (m3/mol)
wAcentric factor
MMolar mass (g/mol)
ΔHIsosteric heat of adsorption (kJ/mol)

References

  1. Wang, Q.; Chen, X.; Jha, A.N.; Rogers, H. Natural gas from shale formation—The evolution, evidences and challenges of shale gas revolution in United States. Renew. Sustain. Energy Rev. 2014, 30, 1–28. [Google Scholar] [CrossRef]
  2. Etminan, S.R.; Javadpour, F.; Maini, B.B.; Chen, Z. Measurement of gas storage processes in shale and of the molecular diffusion coefficient in kerogen. Int. J. Coal Geol. 2014, 123, 10–19. [Google Scholar] [CrossRef]
  3. Mcglade, C.; Speirs, J.; Sorrell, S. Unconventional gas—A review of regional and global resource estimates. Energy 2013, 55, 571–584. [Google Scholar] [CrossRef]
  4. Hughes, J.D. Energy: A reality check on the shale revolution. Nature 2013, 494, 307–308. [Google Scholar] [CrossRef]
  5. Gasparik, M.; Bertier, P.; Gensterblum, Y.; Ghanizadeh, A.; Krooss, B.M.; Littke, R. Geological controls on the methane storage capacity in organic-rich shales. Int. J. Coal Geol. 2014, 123, 34–51. [Google Scholar] [CrossRef]
  6. Fang, H.; Zou, H.; Lu, Y. Mechanisms of shale gas storage: Implications for shale gas exploration in China. AAPG Bull. 2013, 97, 1325–1346. [Google Scholar]
  7. Zhang, T.; Ellis, G.S.; Ruppel, S.C.; Milliken, K.; Yang, R. Effect of organic-matter type and thermal maturity on methane adsorption in shale-gas systems. Org. Geochem. 2012, 47, 120–131. [Google Scholar] [CrossRef]
  8. Curtis, J.B. Fractured shale-gas systems. AAPG Bull. 2002, 86, 1921–1938. [Google Scholar]
  9. Montgomery, S.L.; Jarvie, D.M.; Bowker, K.A.; Pollastro, R.M. Mississippian Barnett Shale, Fort Worth basin, north-central Texas: Gas-shale play with multi–trillion cubic foot potential. AAPG Bull. 2005, 90, 963–966. [Google Scholar] [CrossRef]
  10. Liu, D.; Yuan, P.; Liu, H.; Li, T.; Tan, D.; Yuan, W.; He, H. High-pressure adsorption of methane on montmorillonite, kaolinite and illite. Appl. Clay Sci. 2013, 85, 25–30. [Google Scholar] [CrossRef]
  11. Duan, S.; Gu, M.; Du, X.; Xian, X. Adsorption Equilibrium of CO2 and CH4 and Their Mixture on Sichuan Basin Shale. Energy Fuels 2016, 30, 2248–2256. [Google Scholar] [CrossRef]
  12. Hu, H.; Zhang, T.; Wiggins-Camacho, J.D.; Ellis, G.S.; Lewan, M.D.; Zhang, X. Experimental investigation of changes in methane adsorption of bitumen-free Woodford Shale with thermal maturation induced by hydrous pyrolysis. Mar. Pet. Geol. 2015, 59, 114–128. [Google Scholar] [CrossRef]
  13. Wang, Z.; Li, Y.; Guo, P.; Meng, W. Analyzing the Adaption of Different Adsorption Models for Describing the Shale Gas Adsorption Law. Chem. Eng. Technol. 2016, 39, 1921–1932. [Google Scholar] [CrossRef]
  14. Ji, L.; Zhang, T.; Milliken, K.L.; Qu, J.; Zhang, X. Experimental investigation of main controls to methane adsorption in clay-rich rocks. Appl. Geochem. 2012, 27, 2533–2545. [Google Scholar] [CrossRef]
  15. Guo, S. Experimental study on isothermal adsorption of methane gas on three shale samples from Upper Paleozoic strata of the Ordos Basin. J. Pet. Sci. Eng. 2013, 110, 132–138. [Google Scholar] [CrossRef]
  16. Luo, X.; Wang, S.; Wang, Z.; Jing, Z.; Lv, M.; Zhai, Z.; Han, T. Adsorption of methane, carbon dioxide and their binary mixtures on Jurassic shale from the Qaidam Basin in China. Int. J. Coal Geol. 2015, 150, 210–223. [Google Scholar] [CrossRef]
  17. Bi, H.; Jiang, Z.; Li, J.; Li, P.; Chen, L.; Pan, Q.; Wu, Y. The Ono–Kondo model and an experimental study on supercritical adsorption of shale gas: A case study of on Longmaxi shale in southeastern Chongqing, China. J. Nat. Gas Sci. Eng. 2016, 35, 114–121. [Google Scholar] [CrossRef]
  18. Chareonsuppanimit, P.; Mohammad, S.A.; Robinson, R.L., Jr.; Gasem, K.A. High-pressure adsorption of gases on shales: Measurements and modeling. Int. J. Coal Geol. 2012, 95, 34–46. [Google Scholar] [CrossRef]
  19. Kim, C.; Jang, H.; Lee, J. Experimental investigation on the characteristics of gas diffusion in shale gas reservoir using porosity and permeability of nanopore scale. J. Pet. Sci. Eng. 2015, 133, 226–237. [Google Scholar] [CrossRef]
  20. Liu, G.; Zhao, Z.; Sun, M.; Li, J.; Hu, G.; Wang, X. New insights into natural gas diffusion coefficient in rocks. Pet. Explor. Dev. 2012, 39, 597–604. [Google Scholar] [CrossRef]
  21. Javadpour, F. Nanopores and Apparent Permeability of Gas Flow in Mudrocks (Shales and Siltstone). J. Can. Pet. Technol. 2009, 48, 16–21. [Google Scholar] [CrossRef]
  22. Wu, K.; Li, X.; Wang, C.; Yu, W.; Chen, Z. Model for Surface Diffusion of Adsorbed Gas in Nanopores of Shale Gas Reservoirs. Ind. Eng. Chem. Res. 2015, 54, 3225–3236. [Google Scholar] [CrossRef]
  23. Rezlerová, E.; Brennan, J.K.; Lísal, M. Methane and carbon dioxide in dual-porosity organic matter: Molecular simulations of adsorption and diffusion. AICHE J. 2021, 67, e16655. [Google Scholar] [CrossRef]
  24. Zhang, C.; Yao, Y.; Swennen, R.; Zhang, Y. Re-evaluating the methane adsorption behavior in shale kerogen: Unifying experiment and molecular simulation. Phys. Fluids 2024, 36, 022002. [Google Scholar] [CrossRef]
  25. Tesson, S.; Firoozabadi, A. Methane adsorption and self-diffusion in shale kerogen and slit nanopores by molecular simulations. J. Phys. Chem. C 2018, 122, 23528–23542. [Google Scholar] [CrossRef]
  26. Dawass, N.; Vasileiadis, M.; Peristeras, L.D.; Papavasileiou, K.D.; Economou, I.G. Prediction of Adsorption and Diffusion of Shale Gas in Composite Pores Consisting of Kaolinite and Kerogen using Molecular Simulation. J. Phys. Chem. C 2023, 127, 9452–9462. [Google Scholar] [CrossRef]
  27. Yuan, S.; Gang, H.-Z.; Liu, Y.-F.; Zhou, L.; Irfan, M.; Yang, S.-Z.; Mu, B.-Z. Adsorption and Diffusion Behaviors of CO2 and CH4 Mixtures in Different Types of Kerogens and Their Roles in Enhanced Energy Recovery. Sustainability 2022, 14, 14949. [Google Scholar] [CrossRef]
  28. Wang, S.; Feng, Q.; Javadpour, F.; Yang, Y.-B. Breakdown of fast mass transport of methane through calcite nanopores. J. Phys. Chem. C 2016, 120, 14260–14269. [Google Scholar] [CrossRef]
  29. Li, Y.; Chen, M.; Tang, H.; Han, S.; Song, H.; Wang, P.; Zhao, Y.; Zhu, J. Insights into Carbon Dioxide Hydrate Nucleation on the External Basal Surface of Clay Minerals from Molecular Dynamics Simulations. ACS Sustain. Chem. Eng. 2022, 10, 6358–6369. [Google Scholar] [CrossRef]
  30. Li, Y.; Chen, M.; Liu, C.; Song, H.; Yuan, P.; Zhang, B.; Liu, D.; Du, P. Effects of Layer-charge Distribution of 2:1 Clay Minerals on Methane Hydrate Formation: A Molecular Dynamics Simulation Study. Langmuir 2020, 36, 3323–3335. [Google Scholar] [CrossRef] [PubMed]
  31. Li, Y.; Chen, M.; Song, H.; Yuan, P.; Liu, D.; Zhang, B.; Bu, H. Methane Hydrate Formation in the Stacking of Kaolinite Particles with Different Surface Contacts as Nanoreactors: A Molecular Dynamics Simulation Study. Appl. Clay Sci. 2020, 186, 105439. [Google Scholar] [CrossRef]
  32. Collell, J.; Ungerer, P.; Galliero, G.; Yiannourakou, M.; Montel, F.; Pujol, M. Molecular Simulation of Bulk Organic Matter in Type II Shales in the Middle of the Oil Formation Window. Energ. Fuel 2014, 28, 7457–7466. [Google Scholar] [CrossRef]
  33. Ungerer, P.; Collell, J.; Yiannourakou, M. Molecular Modeling of the Volumetric and Thermodynamic Properties of Kerogen: In fluence of Organic Type and Maturity. Energ. Fuel 2015, 29, 91–105. [Google Scholar] [CrossRef]
  34. Yao, S.; Jiao, K.; Li, M. Advances in research of coal and kerogen nanostructure. Adv. Earth Sci. 2012, 27, 367–378. [Google Scholar]
  35. Liu, X.; Luo, D.; Xiong, J.; Liang, L. Construction of the average molecular modeling of the kerogen from Longmaxi formation. Chem. Ind. Eng. Prog. 2017, 36, 530–537. [Google Scholar]
  36. Wang, Z.H.; Li, Y.; Meng, W.J.; Guo, P.; Luo, Q.; Ran, Z.L. Density functional theory study on the adsorption of methane on kerogen with different functional groups. Appl. Ecol. Env. Res. 2017, 15, 861–869. [Google Scholar] [CrossRef]
  37. Wang, Q.; Pan, S.; Bai, J.; Chi, M.; Cui, D.; Wang, Z.; Liu, Q.; Xu, F. Theoretical study of structural and spatial properties of kerogen. Energ. Fuel 2019, 33, 9559–9569. [Google Scholar] [CrossRef]
  38. Sun, H.; Ren, P.; Fried, J.R. The COMPASS Forcefield: Parameterization and Validation for Polyphosphazenes. Comput. Theor. Polym. Sci. 1998, 8, 229. [Google Scholar] [CrossRef]
  39. Mosher, K.; He, J.; Liu, Y.; Rupp, E.; Wilcox, J. Molecular simulation of methane adsorption in micro- and mesoporous carbons with applications to coal and gas shale systems. Int. J. Coal Geol. 2013, 109, 36–44. [Google Scholar] [CrossRef]
  40. Connolly, M.L. Analytical molecular surface calculation. J. Appl. Crystallogr. 1983, 6, 548–558. [Google Scholar] [CrossRef]
  41. Zeitler, T.R.; Allendorf, M.D.; Greathouse, J.A. Grand Canonical Monte Carlo Simulation of Low-Pressure Methane Adsorption in Nanoporous Framework Materials for Sensing Applications. J. Phys. Chem. C 2011, 116, 3492–3502. [Google Scholar] [CrossRef]
  42. Peng, D.Y.; Robinson, D.B. A New Two-Constant Equation of State. Ind. Eng. Chem. Fundam. 1976, 15, 92–94. [Google Scholar] [CrossRef]
  43. Smith, J.M.; Ness, H.C.V.H.C. Introduction to Chemical Engineering Thermodynamics; McGraw-Hill: New York, NY, USA, 2001. [Google Scholar]
  44. Langmuir, I. The Adsorption of Gases on Plane Surfaces of Glass, Micaand and Platinum. J. Chem. Phys. 2015, 40, 1361–1403. [Google Scholar]
  45. Fu, X.; Shen, W.; Yao, T. Physical Chemistry, 4th ed.; Higher Education: Beijing, China, 1993. [Google Scholar]
  46. Allen, M.P.; Tildesley, D.J. Computer Simulation of Liquids; Clarendon: Oxford, UK, 1987. [Google Scholar]
  47. Park, S.H.; Sposito, G. Monte Carlo Simulation of Total Radial Distribution Functions for Interlayer Water in Li-, Na-, and K-Montmorillonite Hydrates. J. Steroid Biochem. 2000, 104, 177–182. [Google Scholar] [CrossRef]
Figure 1. Snapshots of the unit structure of kerogen (a). Three-dimensional model (b). The atoms of C, H, O, N, and S are shown in gray, white, red, yellow, and blue, respectively.
Processes 12 01438 g001
Figure 2. Fugacity of CH4, CO2, and N2 under various temperature and pressure conditions.
Processes 12 01438 g002
Figure 3. The adsorption capacity of CH4 under different temperatures (a) and a comparison of CH4, CO2, and N2 at 333.15 K (b).
Processes 12 01438 g003
Figure 4. Isosteric heat of adsorption CH4 under different temperature and pressure conditions (a) and comparison of CH4, CO2, and N2 at 333.15 K (b).
Processes 12 01438 g004
Figure 5. The energy distribution of CH4 under different temperatures (a) and a comparison of CH4, CO2, and N2 at 333.15 K (b).
Processes 12 01438 g005
Figure 6. Adsorption capacities of CH4 (a) and CO2 (b) in nanopores of kerogen at different mole fractions of CH4/CO2. Adsorption capacities of CH4 (c) and N2 (d) in nanopores of kerogen at different mole fractions of CH4/N2.
Processes 12 01438 g006
Figure 7. The self-diffusion coefficient of CH4 under different temperatures (a) and a comparison of CH4, CO2, and N2 at 333.15 K (b).
Processes 12 01438 g007
Figure 8. Radial distribution function between CH4 (a), CO2 (b), and N2 (c) and various atoms of kerogen. Snapshots showing distribution of CH4 (d), CO2 (e), and N2 (f) molecules on surface of local kerogen structure.
Processes 12 01438 g008
Figure 9. Snapshots of pure CH4 (a), CO2 (b), and N2 (c) and binary component (CH4/CO2 and CH4/N2) distributions in nanopores of kerogen, illustrating three different CH4 mole fractions (di).
Processes 12 01438 g009
Table 1. Composition, temperature, and pressure conditions of kerogen system.
SystemTemperaturePressure
Pure CH4303.15 K5 MPa, 10 MPa, 15 MPa, 20 MPa, 25 MPa, 30 MPa
333.15 K
348.15 K
363.15 K
Pure CO2333.15 K
Pure N2333.15 K
CH4:CO2 = 0.2:0.8333.15 K2.5 MPa, 5 MPa, 10 MPa, 15 MPa,
20 MPa, 25 MPa, 30 MPa
CH4:CO2 = 0.4:0.6
CH4:CO2 = 0.5:0.5
CH4:CO2 = 0.6:0.4
CH4:CO2 = 0.8:0.2
CH4:N2 = 0.2:0.8333.15 K2.5 MPa, 5 MPa, 10 MPa, 15 MPa,
20 MPa, 25 MPa, 30 MPa
CH4:N2 = 0.4:0.6
CH4:N2 = 0.5:0.5
CH4:N2 = 0.6:0.4
CH4:N2 = 0.8:0.2
Table 2. Pore volume and special surface area of kerogen model with different probe molecules.
Probe MoleculePore Volume Å3/ucSpecial Surface Area Å2/uc
CH47086.274379.37
CO28285.234881.91
N27459.884549.75
Table 3. Critical parameters of CH4, CO2, and N2 [43].
Critical ParametersCH4CO2N2
Critical temperature/K190.560304.140126.190
Critical pressure/MPa4.5997.3773.396
Critical volume/cm398.60094.34090.100
Acentric factor KJ/(Kg°C)0.0110.2240.037
Molar mass/g/mol16.04044.01028.010
Table 4. Fitting parameters (VL and PL) and errors of the Langmuir model.
ParametersCH4CO2N2
303.15 K333.15 K 348.15 K363.15 K333.15 K333.15 K
VL (mmol/g)7.0486.5696.5486.4217.4136.576
PL (MPa)2.1702.8853.7044.3291.5046.480
R20.99880.99720.99940.99860.99800.9979
ARE1.02%1.3%0.66%0.89%0.85%1.26%
Note: The R2 value shows the goodness of fit, and ARE is the average relative error.
Disclaimer/Publisher’s Note: The statements, opinions and data contained in all publications are solely those of the individual author(s) and contributor(s) and not of MDPI and/or the editor(s). MDPI and/or the editor(s) disclaim responsibility for any injury to people or property resulting from any ideas, methods, instructions or products referred to in the content.

