Abstract
Pipeline leakage seriously threatens the efficient and safe gas drainage in coal mines. To achieve the accurate detection and localization of gas drainage pipeline leakages, this study proposes a gas drainage pipeline leakage detection and localization approach based on the pressure gradient method. Firstly, the basic law of gas flow in the drainage pipeline was analyzed, and a pipeline network resistance correction formula was deduced based on the pressure gradient method. Then, a drainage pipeline model was established based on the realizable turbulence model, and the pressure and flow velocity distribution during pipeline leakage under different leakage degrees, leakage locations, and pipeline negative pressures were simulated and analyzed, thus verifying the feasibility of the pipeline leakage detection and localization method. It is concluded that the positioning errors of pipeline leakage points under different leakage degrees, different leakage positions, and different pipeline negative pressures were 0.88~1.08%, 0.88~1.49%, and 0.68~0.88%, respectively. Finally, field tests were conducted in the highly located drainage roadway 8421 of the Fifth Mine of Yangquan Coal Industry Group to verify the accuracy of the proposed pipeline leakage detection and localization method, and the relative error was about 8.2%. The results show that with increased pipeline leakage hole diameters, elevated pipeline negative pressures, and closer leakage positions to the pipeline center, the relative localization error was smaller, the localization accuracy was higher, and the stability was greater. The research results could lay the foundation for the fault diagnosis and localization of coal mine gas drainage pipeline networks and provide technical support for safe and efficient coal mine gas drainage.
1. Introduction
The occurrence conditions of coal seams in China are extremely complex. With the continuous increase in mining depth in recent years, the gas content and gas pressure of the working seam gradually increased, and the risks of gas emission quantity and coal and gas outburst grew continuously [1,2,3]. Gas accidents remain the greatest threat to coal mine safety.
Relevant policies and regulations clearly stipulate that coal mines with high gas contents and outburst risks must be equipped with a ground permanent gas extraction system or downhole temporary gas extraction system. Coal mine gas control practice in China shows that coal mine gas drainage is an effective and key measure to achieve coal seam gas control, effectively reduce coal seam gas content, and eliminate coal mine gas accidents [4,5,6,7,8]. The gas drainage pipeline network composed of drainage pipelines is an important part of coal mine gas drainage systems. Most of the gas drainage pipelines at the coal mine site are laid in the return airways with harsh environments and poor maintenance, and the pipeline surface and the flange connection between pipelines are susceptible to factors such as roadway deformation, flooding, and corrosion, leading to pipeline corrosion damage, and bending deformation that, in turn, cause pipeline leakage [9,10]. In the case of gas leakage, the negative pressure in the gas drainage pipeline sucks in ambient air, thus decreasing the gas concentration and increasing oxygen content, which not only reduces the gas drainage efficiency, but also increases the risk of gas explosion. Therefore, gas drainage pipeline leakage detection and localization is an important prerequisite for safe and efficient gas drainage.
At present, insufficient attention is devoted to the leakage detection problem of underground gas drainage pipelines in China, with most of the mines still relying on manual inspection [11]. However, the length and complexity of the drainage pipeline gradually increased with the continuous increase in the mining depth, resulting in practical problems such as long detection time, large manpower consumption, and low efficiency. Therefore, the accurate fault diagnosis and localization of gas drainage pipelines using gas drainage multivariate information attracted the attention of researchers, and certain results were achieved.
Early pipeline leakage detection and localization technologies mainly focused on natural gas and oil transportation. According to previous data, the existing pipeline leakage detection and localization methods can be divided into two major categories: software-based methods and hardware-based methods [12,13,14,15]. Yin et al. [16] proposed a pipeline leakage detection algorithm based on the acoustic propagation characteristics of transverse and longitudinal waves to achieve non-destructive pipeline leakage detection and localization. Thang et al. [17] proposed a reliable method to detect leaks and recognize their various sizes in a gas pipeline based on the spectral portrait of acoustic emission (AE) signals. He et al. [18] proposes an improved model-based pipeline leakage detection and localization method based on compressed sensing (CS) and an event-triggered (ET) particle filter (ET-PF). Zhou et al. [19] proposed a gas extraction pipeline leakage diagnosis and location method based on the Simulated Annealing (SA) and Particle Swarm Optimization (PSO) collaborative optimization Back Propagation neural network. Zuo et al. [20] analyzed the research progress of pipeline leakage detection technology based on optical fiber sensing technology firstly and proposes an algorithm for monitoring gas pipeline leakage based on distributed optical fiber acoustic sensing (DAS) system. The algorithm can obtain the time domain signal characteristics of pipeline leakage to identify leaks, locate the leak points through frequency domain. Zhang et al. [21] proposed a novel hybrid technique based on the real-time transient modeling method and negative pressure wave method. An experimental bench for straight pipelines is set up to evaluate the performance of the proposed hybrid technique, and corresponding experimental test programs for gas leakage detection and location are designed and conducted. A mathematical model for the transient flow in pipelines was established and solved under different boundary conditions. Liu et al. [22] found that when negative pressure wave (NPW) signals are used to locate pipeline leaks, noise will increase the error of location estimation. Thus, an adaptive noise reduction method based on variational mode decomposition (ANR-VMD) was proposed to improve the accuracy of leak location. In terms of leakage detection and localization of coal mine gas drainage pipelines, She et al. [23] proposed a mathematical model for the gas flow state and leakage diagnosis of underground gas drainage pipelines. By experimentally studying the leakage characteristics of the main pipeline from the flow rate, oxygen concentration, and negative pressure aspects, Pei [11] proposed a multi-parameter comprehensive diagnosis method for main gas drainage pipeline leakage monitoring and a localization algorithm based on pressure distribution state. Lei et al. [24] proposed a method to evaluate the leakage and blockage state of the gas drainage pipeline based on the descending curve slope of the pipeline pressure square. Mao et al. [25] verified the principle of the pressure gradient method for pipeline leakage detection and used the on-site pipeline segmentation negative pressure monitoring method to conduct leakage detection analysis on the mine gas drainage system. Zhang et al. [26] combined the flow balance method, negative pressure wave method, and wavelet noise reduction principle to propose a leakage localization method for underground main drainage pipelines based on the transient model and verified its accuracy through simulation analysis. Guo et al. [27] employed ultrasonic detection to detect the turbulence generated at the underground gas pipeline leakage and achieved underground drainage pipeline leakage localization by detecting the strength and source of the ultrasonic signal. Based on the OpenFOAM platform, Cai et al. [28] proposed a multi-factor gas drainage pipeline leakage and diffusion model capable of analyzing the leakage and diffusion characteristics within the pipeline and verified its practicality using data measured at the coal mine site. Zhao et al. [29] established a leakage diagnostic method for gas extraction pipelines based on the pressure gradient method and built a gas drainage pipeline network experimental platform for single pipeline blockage and leakage tests investigating the effect of main pipeline leakage on the negative pressure of branch pipelines and discussing the influence of the negative pressure changes of the temporary pumping station on the parallel pipelines. Cui et al. [30] proposed a cellular automata (CA) model to locate gas drainage pipeline leakages. With the rapid development of computer science and technology, machine learning methods were partially applied in pipeline leakage detection. Rodolfo Pinheiro da Cruz et al. [31] proposed a technique that combines acoustic sensors and machine learning algorithms to identify and locate leaks in low-pressure gas pipelines. Ullah Niamat et al. [32] proposed a machine learning-based platform for using acoustic emission (AE) sensor channel information to detect leaks of various pinhole sizes. Based on the principle of negative pressure wave leak detection, Lin [33] proposes a variety of deep learning methods for pipeline leakage detection. A negative pressure wave leakage detection method based on wavelet threshold denoising and deep belief network (Wavelet-DBN) is adopted to further improve the accuracy of oil pipeline leakage detection.
At present, some achievements were made in coal mine gas drainage pipeline leakage detection and localization methods. However, the existing studies on accurate identification and localization of gas drainage pipeline leakages are not mature, warranting further in-depth research. Moreover, inside the gas drainage pipeline is a negative pressure environment, and the gas flow state in the pipeline is relatively complex. The gas flow state of the pipeline should be considered to further improve the accuracy of leakage detection and localization.
In light of the above, this study employs the pressure gradient method of the steady-state model to address the issue. Firstly, the basic law of gas flow in the drainage pipeline is thoroughly analyzed. Then, a method for calculating the pipeline network resistance is proposed based on the pressure gradient method. Further, the feasibility of the pressure gradient method for gas drainage pipeline leakage detection and localization under negative pressure is verified via numerical simulation, and the accuracy of the proposed method is verified via downhole field tests. The research results could lay the theoretical foundation for the fault diagnosis and localization of coal mine gas drainage pipeline networks and provide technical support for safe and efficient coal mine gas drainage.
2. Analysis of the Basic Law of Gas Flow in the Drainage Pipeline
2.1. Basic Equations of Gas Flow in the Pipeline
2.1.1. Pipeline Gas Flow Continuity Equation
Regarding the gas flow in the drainage pipeline, this study ignores the effects of changes in the vertical upward body forces on the average flow velocity in the pipeline and considers it a one-dimensional linear flow. Thus, the pipeline fluid continuity differential equation is expressed in Equation (1) [34]:
where is the flow velocity (m/s); is the time (); is the pipeline length (); and is the density of the gas mixture ().
2.1.2. Pipeline Gas Flow Energy Equation
According to the law of conservation of energy, the energy of the gas remains constant as it flows through the pipeline, and its energy equation is expressed in Equation (2) [35]:
where is the amount of heat emitted per unit mass of the gas to the outside world (); is the internal energy of the gas (); is the enthalpy of the gas (); and is the height of the pipeline ().
2.1.3. Pipeline Gas Flow Motion Equation
According to the law of conservation of momentum, the resultant force acting on the system from the external is the momentum change rate of the system, and the motion equation of the drainage pipeline built based on the principle of fluid dynamics is expressed in Equation (3):
where is the gravitational acceleration (); is the friction coefficient; is the gas pressure in the pipeline (); is the pipeline diameter (); and is the angle between the pipeline and the horizontal plane ().
2.2. Pipeline Network Resistance Calculation Based on the Pressure Gradient Method
According to the fluid mechanics energy equation and dimensional analysis theory, the pipeline frictional resistance reflected by the wind flow pressure energy loss can be expressed as follows whether the flow is laminar or turbulent:
where is the pipeline pressure loss (); is the frictional resistance coefficient of the pipeline (dimensionless); is the pipeline length (); is the inner diameter of the circular pipes or equivalent diameter of non-circular pipes (); is the density of the gas in the pipeline (); and is the average gas flow velocity in the pipeline ().
Substituting into (4) yields:
where Q is the gas flow in the pipeline ().
The frictional resistance coefficient of steel pipes is calculated as:
The general correction formula for the frictional resistance of steel pipes is:
By converting the units of and pipeline inner diameter d to and cm and considering the little effect of temperature on the kinematic viscosity, the general correction formula for the frictional resistance of steel pipes can be simplified as:
where is the kinematic viscosity of the gas at standard temperature and pressure (STP; ); is the local frictional resistance correction coefficient (1.1); is the gas flow in the pipeline at STP (); is the absolute temperature (K) of the gas in the pipeline at time t; T0 is the absolute temperature at STP (); is the gas density at STP (); p is the absolute pressure of the gas in the pipeline (Pa); and is the atmospheric pressure at STP ().
2.3. Principle of Pipeline Leakage Detection and Localization Based on the Pressure Gradient Method
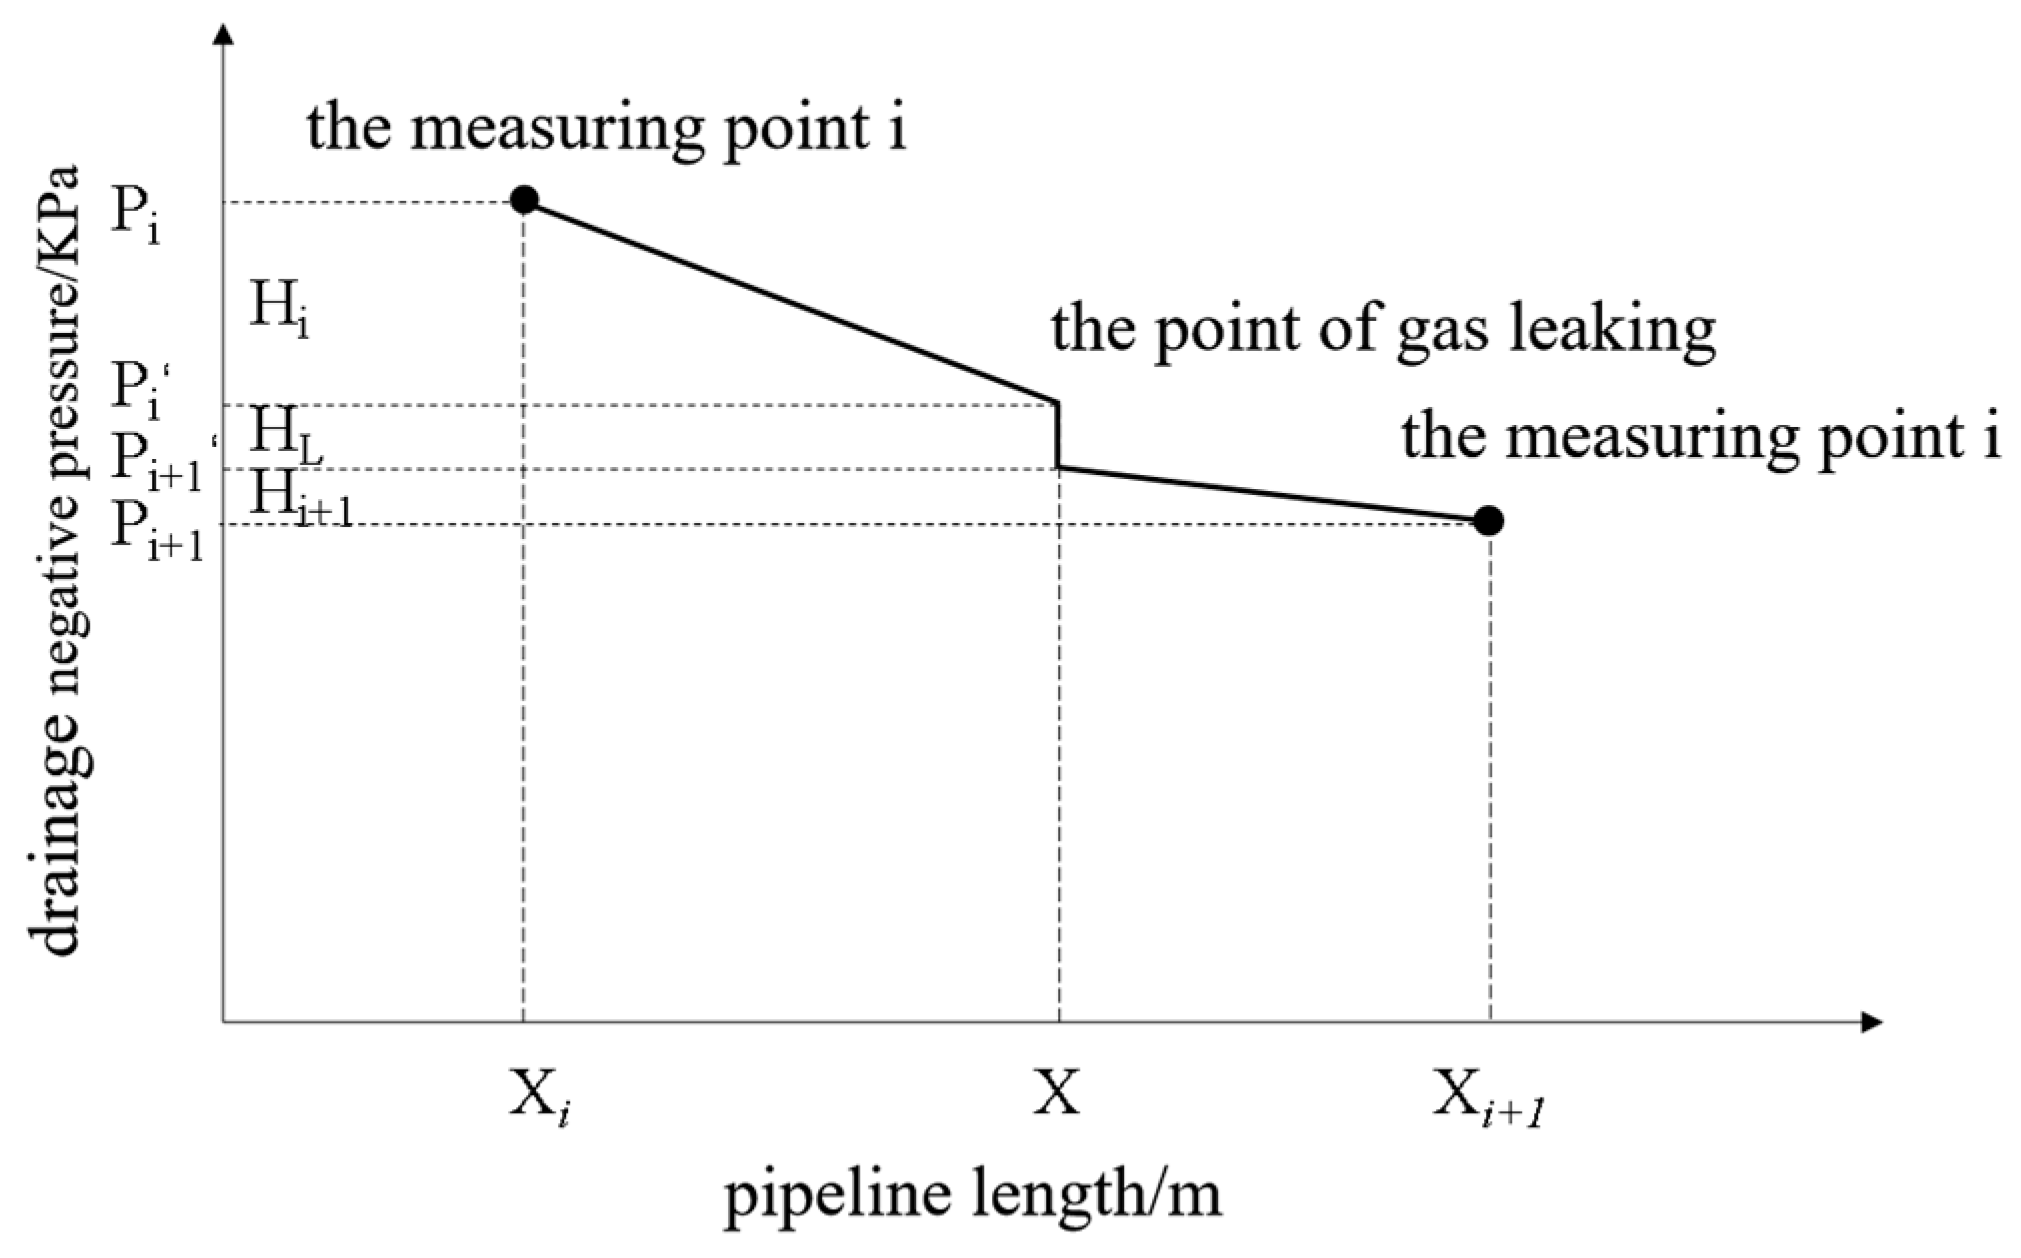
This study assumes that the gas flow in the pipeline is a steady-state one. That is, the flow parameters at any point along the pipeline are only related to the position of that point and not to time. The pressure gradient method comparatively analyzes the gradient of pressure curve variations before and after pipeline leakage and locates the leakage by seeking the maximum gradient. Under stable flow conditions, the pressure inside the pipeline can be approximately considered to vary linearly along the pipeline. In the case of a sudden leakage, the external gas instantaneously enters the pipeline due to the negative pressure in it, causing a sharp pressure rise at the leakage point. As the steady state is reached again, the pressure distribution in the drainage pipeline will present an obvious polyline abrupt change, as shown in Figure 1, with the turning point indicating the pipeline leakage point.

Figure 1.
Schematic diagram of the pressure gradient method-based localization.
According to the abrupt change characteristics of the pressure gradient before and after the pipeline leakage in Figure 1, the gas drainage negative pressure and other drainage parameters of the ith and (i + 1)th measuring points at a certain time, the following equation is used to calculate the pipeline length X from the leakage point to the pump:
where is the local resistance coefficient at the leakage point; and is the horizontal elevation of the leakage point (m).
3. Results and Discussion
3.1. Numerical Simulation Study on the Leakage Detection and Localization Method Based on the Pressure Gradient Method
In this section, COMSOL Multiphysics 3.5 numerical simulation software is used to study the gas flow patterns in the underground coal mine gas drainage pipeline under different working conditions.
The simulation parameters affect the reliability of the simulation results. Therefore, the following points should be taken into account when selecting the simulation parameters:
(1) Because the extraction pipeline is affected by the compressibility of the fluid and the temperature transfer, the flow law of the fluid in the pipeline is extremely complex. It is difficult to accurately describe the internal flow law of the gas extraction pipeline, and the secondary influence of the field environment of the gas extraction pipeline on the simulation results should be ignored. Therefore, it is assumed that the gas extraction pipeline is a steady flow of one-dimensional incompressible gas, and the influence of temperature on the pipeline is not considered.
(2) Considering the high accuracy of large flow monitoring, an 800 mm diameter extraction pipeline was selected. In order to eliminate the influence of turbulent flow in the surrounding area of leakage point, the length of pipeline cannot be too short. Considering that 30~50 m is used as an extraction unit in a coal mine, it is necessary to select a pipeline with a length of at least 100 m.
(3) The velocity inlet was set to 13 m/s, and the pressure outlet was set to the relative pressure of −40,000 Pa, which is in line with the actual situation of coal mine gas extraction.
(4) The degree of pipeline leakage, the location of the leakage point, and the pipeline pressure are important factors affecting the results of gas leakage detection, which represent the main causes of gas leakage, the location of gas leakage, and the condition of the extraction pipeline, respectively. The degree of pipeline leakage can be characterized by the radius of the leakage hole. The radius of 0.03 m, 0.05 m, and 0.08 m is reasonable. The location of the leakage point is set to 30 m, 50 m, and 70 m from the head of pipeline in turn, which is reasonable under simulation conditions. The leakage point pressure outlet is set to the relative pressure of −40,000 Pa, −60,000 Pa, and −80,000 Pa, which is in line with the actual situation of the main pipeline of coal mine gas extraction.
3.1.1. Gas Drainage Pipeline Model Establishment
The following assumptions are made to study the fluid motion in the downhole gas drainage main pipeline under different working conditions:
(1) Inside the gas drainage pipeline is assumed to be a steady-state flow of a one-dimensional incompressible gas;
(2) The effect of temperature on the pipeline is not considered, and the gas flow in the pipeline is an isothermal one.
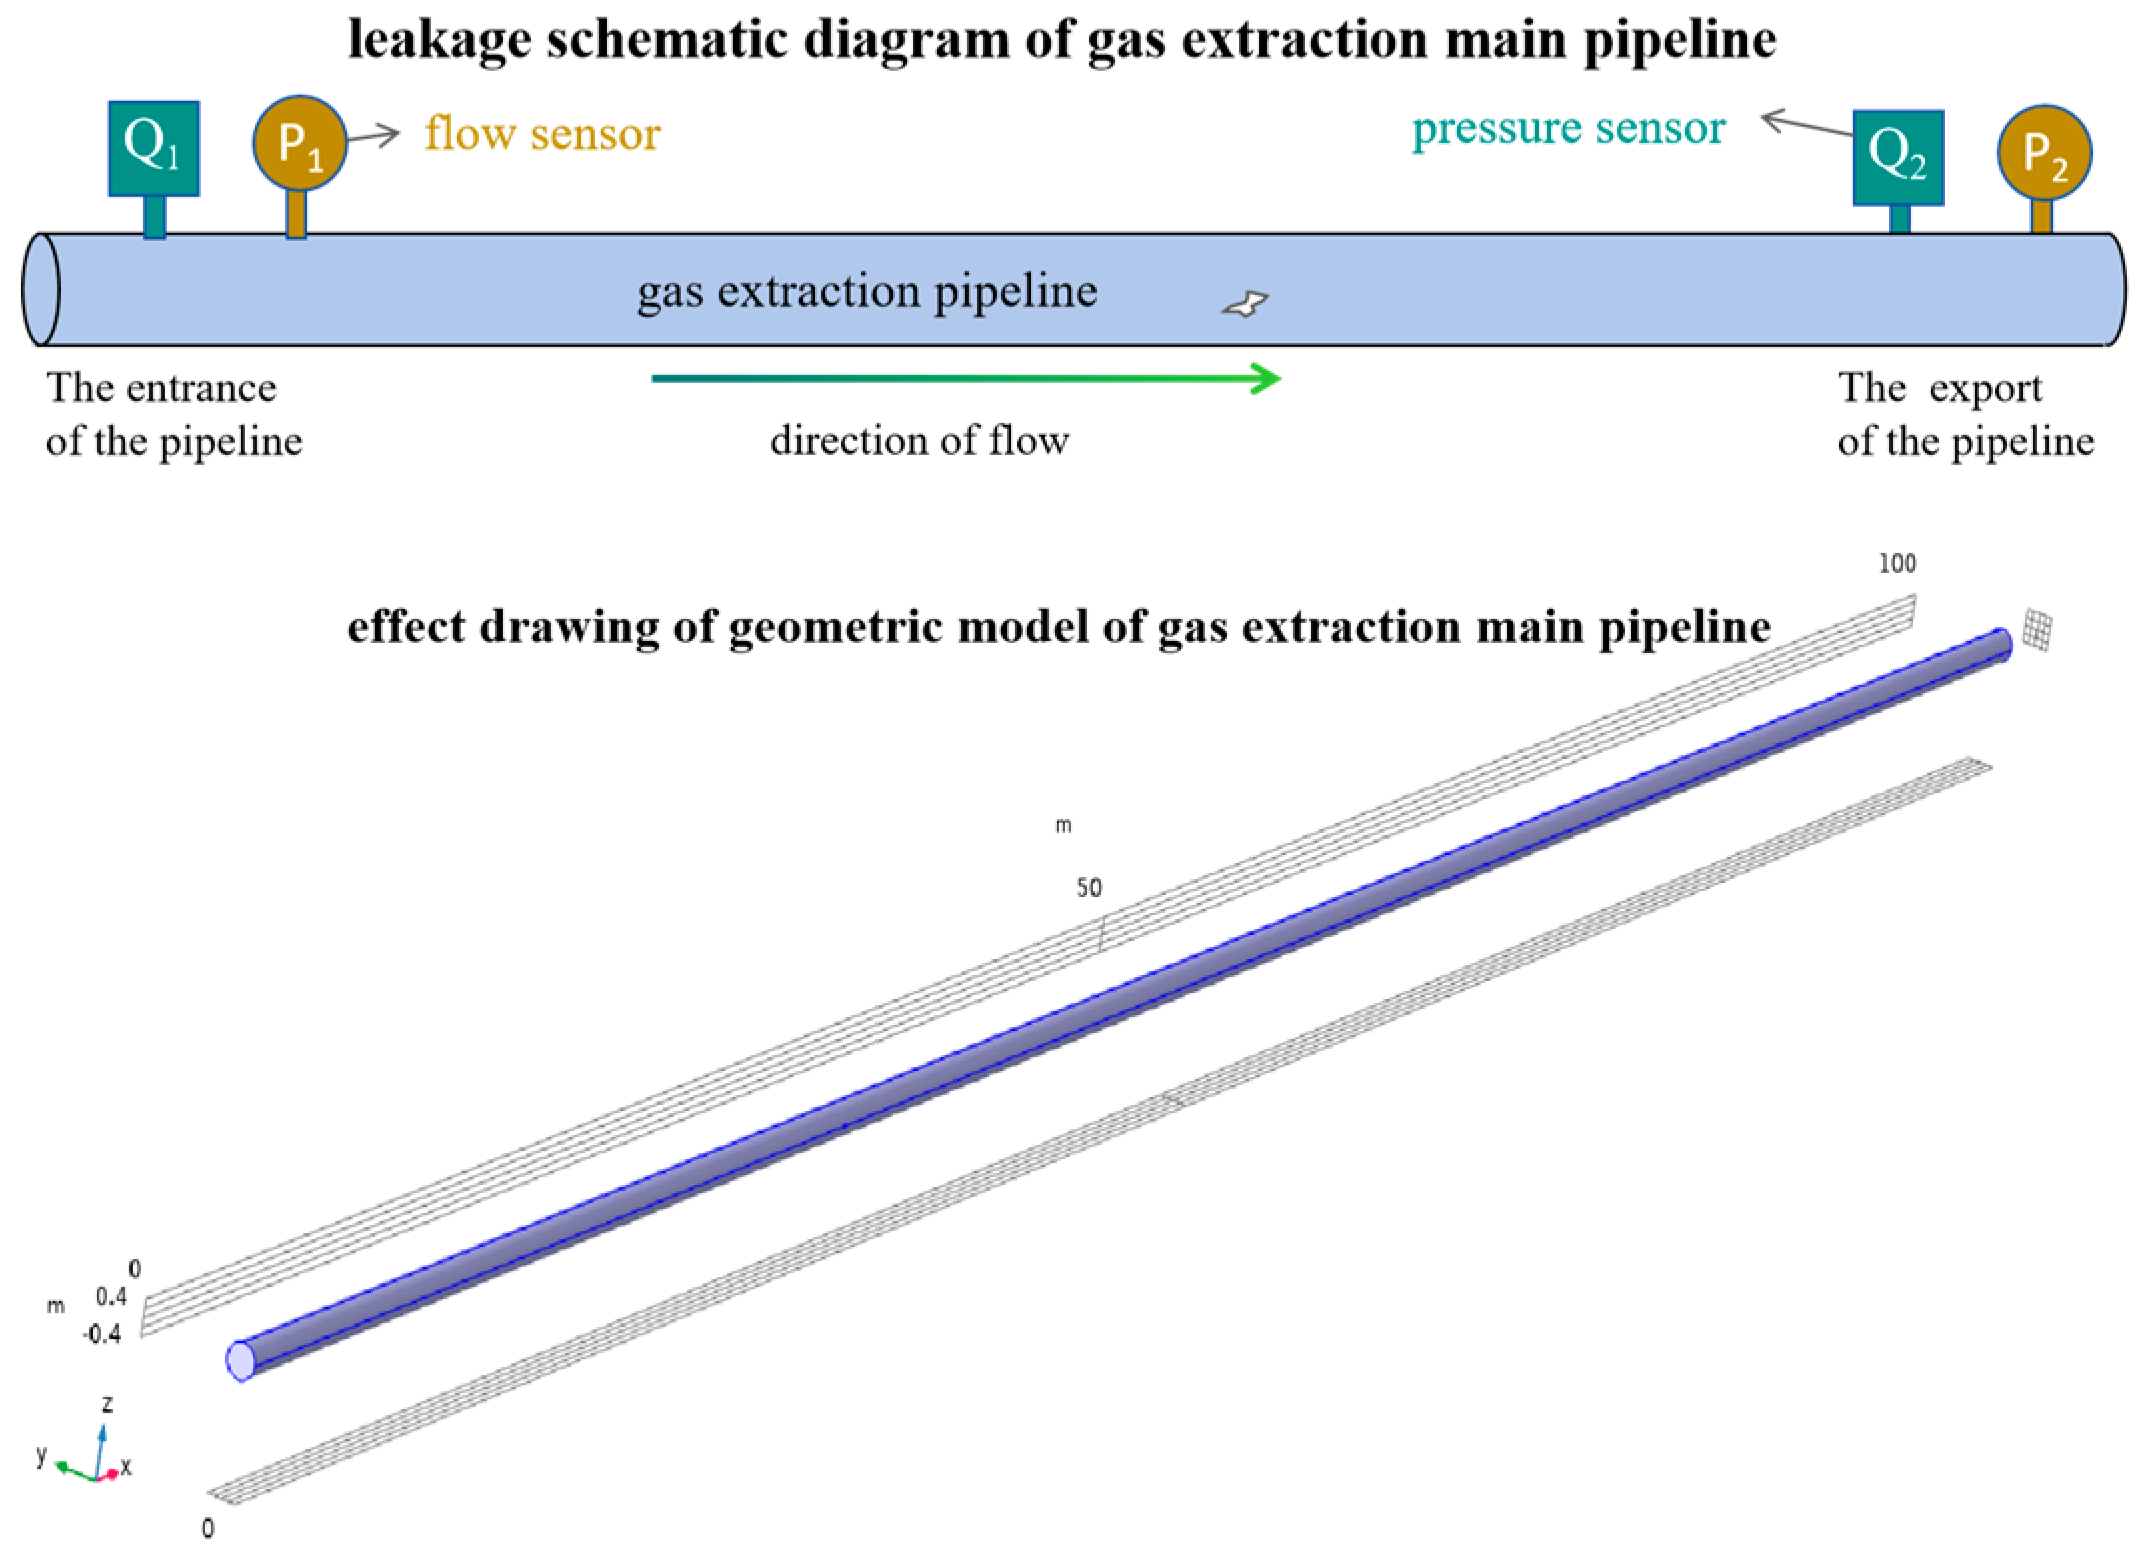
To simulate the fluid motion in the drainage pipeline under different working conditions, a three-dimensional simulation pipeline with a length of 100 m and a diameter of 800 mm was established based on the realizable turbulence model, with methane gas (CH4) as the material inside the pipeline. The simulation model obeys the laws of conservation of energy, mass, and momentum. The schematic and geometric renderings of the drainage pipeline leakage model are shown in Figure 2.
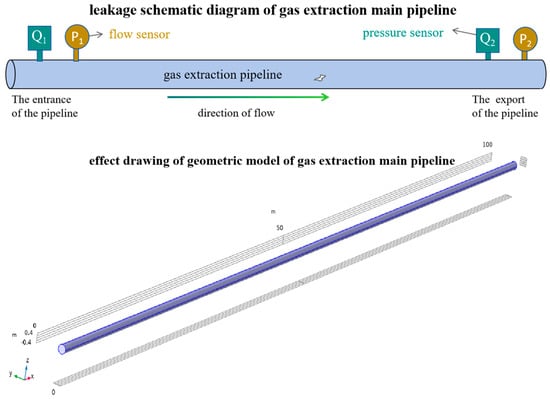
Figure 2.
Drainage pipeline leakage model schematic and geometric renderings.
The realizable turbulence model can be expressed as follows:
where is the gas density (); is turbulent kinetic energy generated by the average velocity gradient (); is the turbulent kinetic energy generated by buoyancy (); is the influence factor of the fluctuation expansion on the total dissipation rate; is the simulated frontal area (); is the inflow velocity (); , , , , and are empirical constants; is the turbulent kinetic energy (); and is the turbulence dissipation rate.
3.1.2. Meshing and Boundary Condition Establishment
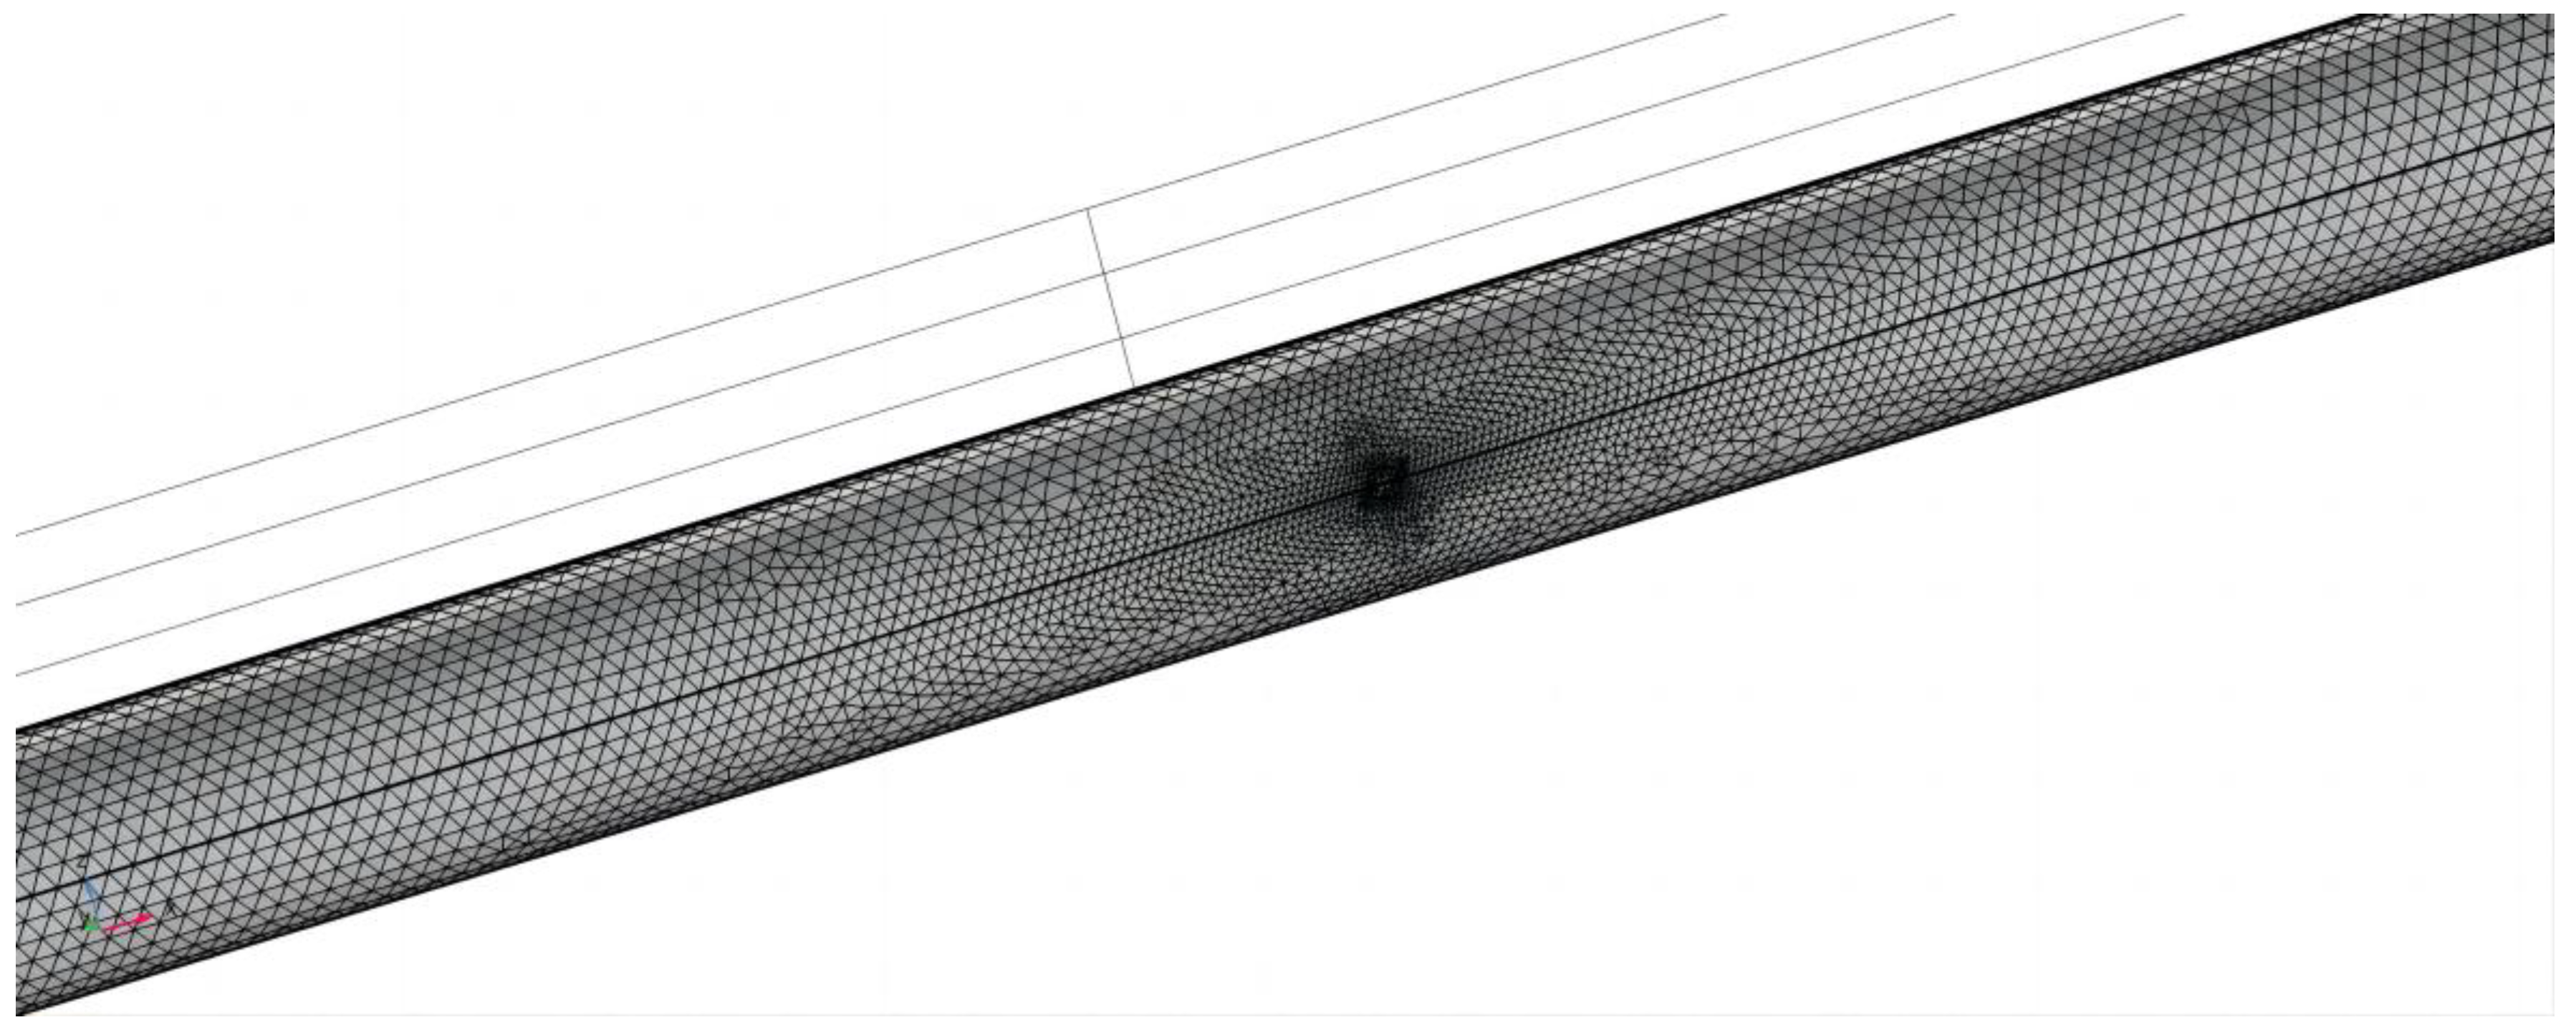
The model simulates the operation of the underground gas drainage main pipeline in different working conditions. According to the actual situation on site, a negative pressure is set inside the pipeline. The inlet of the pipeline is set as a speed inlet, the outlet of the pipeline is set as a pressure outlet, and the middle leakage point is set to a pressure outlet. The boundaries of the model are set as walls, and the pipe roughness is set to 0.0005. The model adopts free mesh triangulation for meshing, and the size of the physical field control mesh cell is selected as regular, resulting in 1,459,933 cells. The partial diagram of the meshing effect of the model is shown in Figure 3.
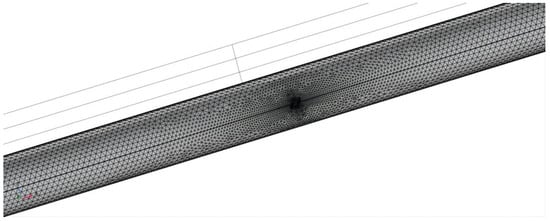
Figure 3.
Partial diagram of pipeline leakage model meshing.
3.2. Drainage Pipeline Leakage Numerical Simulation Result Analysis
To verify the applicability and feasibility of the pressure gradient method under different working conditions and summarize the effects of these conditions, pipeline leakages under different working conditions (leakage degree, leakage position, and pipeline negative pressure) are numerically simulated, and a control model is established.
3.2.1. Effect of Leakage Degree on Pipeline Fluid Motion State
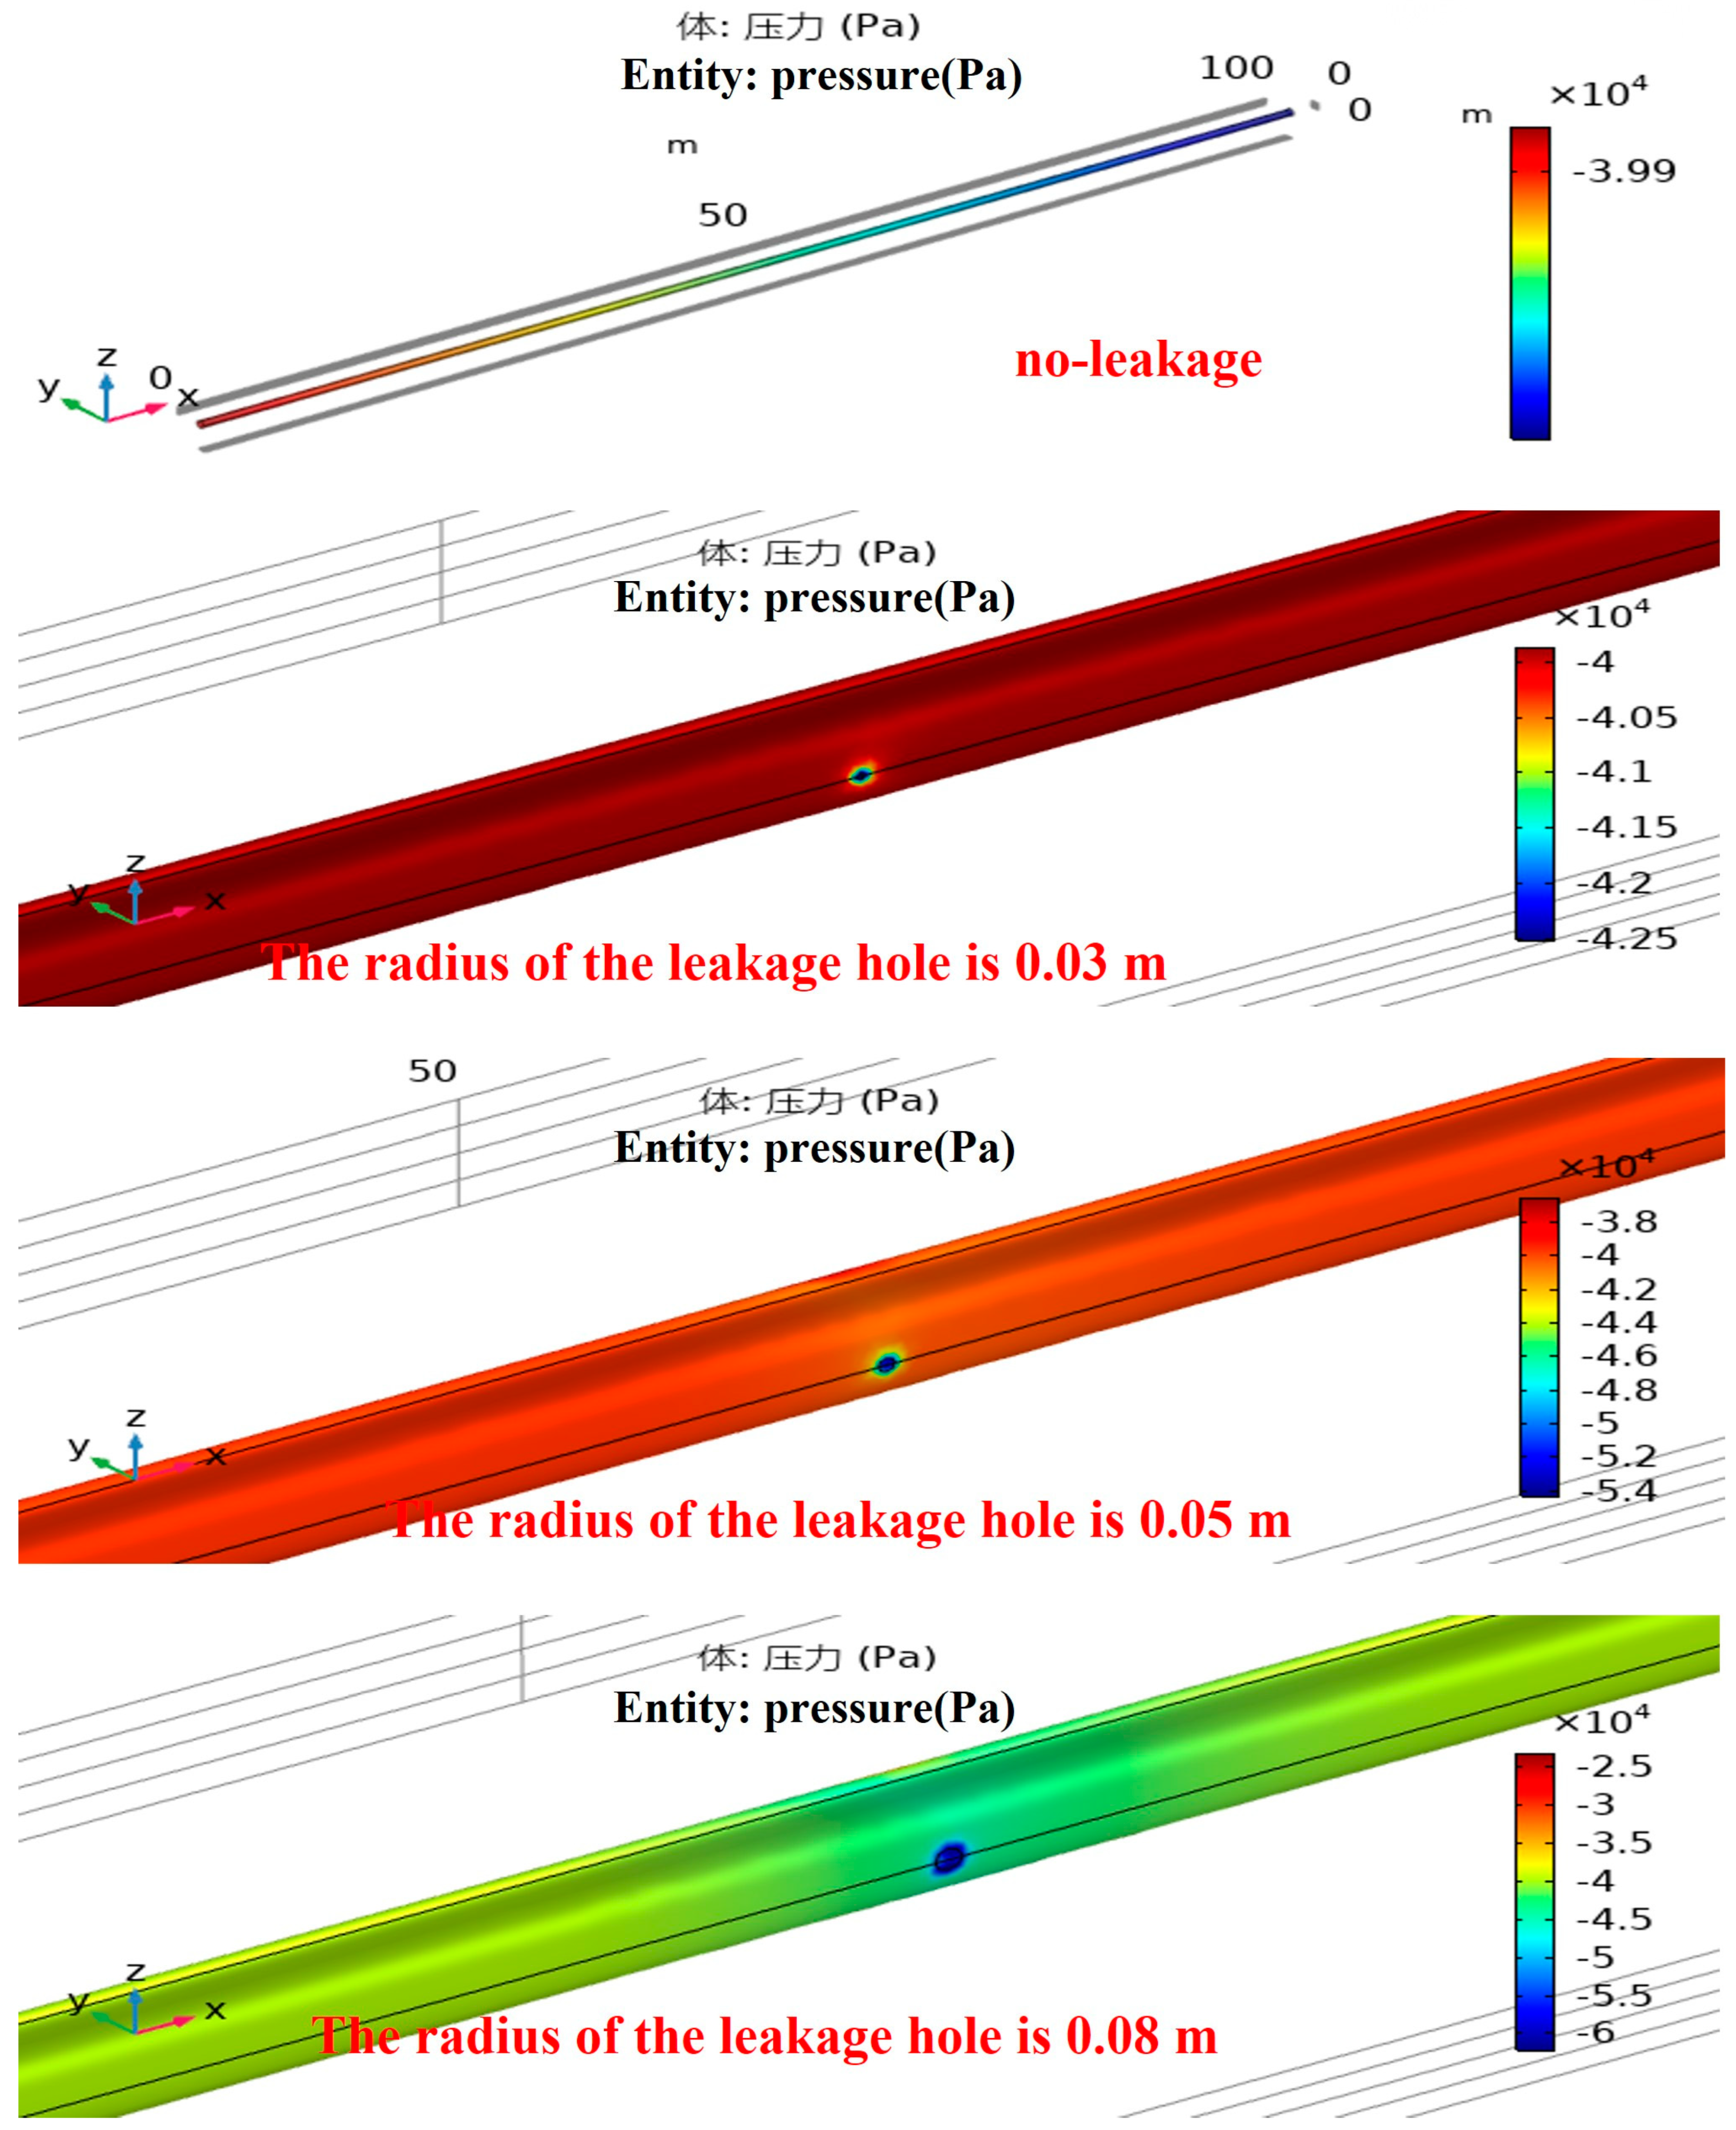
A negative pressure gas drainage pipeline model is set up with a pipeline length of 100 m, a pipeline diameter of 800 mm, an inlet speed of 13 m/s, an outlet pressure of −40,000 Pa relative pressure, an inlet pressure of 0 Pa at the leakage point, and a leakage point at 50 m (pipeline center). The leakage hole radius is set to 0.03 m, 0.05 m, and 0.08 m in turn, which are compared with the no-leakage condition. The specific simulation results are shown in Figure 4 and Figure 5.
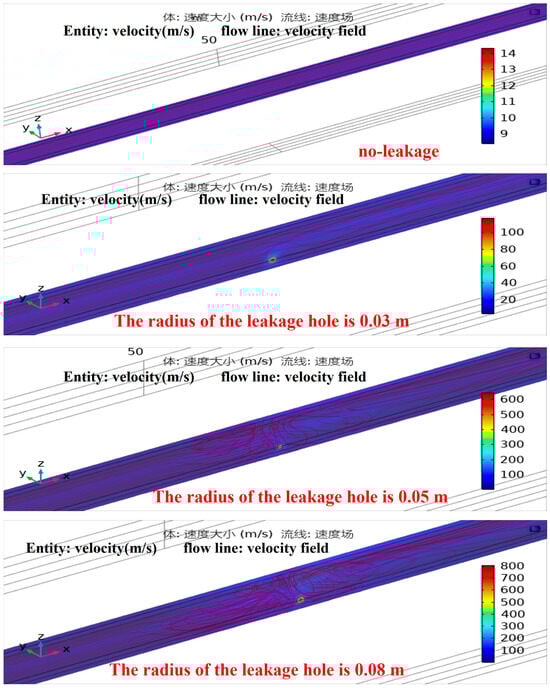
Figure 4.
Cloud diagram of flow velocity in the pipeline under different leakage degrees.

Figure 5.
Cloud diagram of pressure in the pipeline under different leakage degrees.
Figure 4 shows that the gas drainage pipeline in normal operation tends to have a constant flow velocity and evenly distributed flow lines within. With the increase in the leakage hole diameter, the flow lines in the pipeline become increasingly chaotic. Thus, with increased pipeline leakage degrees, the sudden velocity and pressure changes at the leakage point are more significant, and the turbulence effect is enhanced. Figure 5 shows that the pressure in the pipeline under normal operation decreases uniformly along the pipeline line. In the case of leakage, the pressure at the leakage point decreases significantly, and the decrements are larger as the pipeline leakage degree increases.
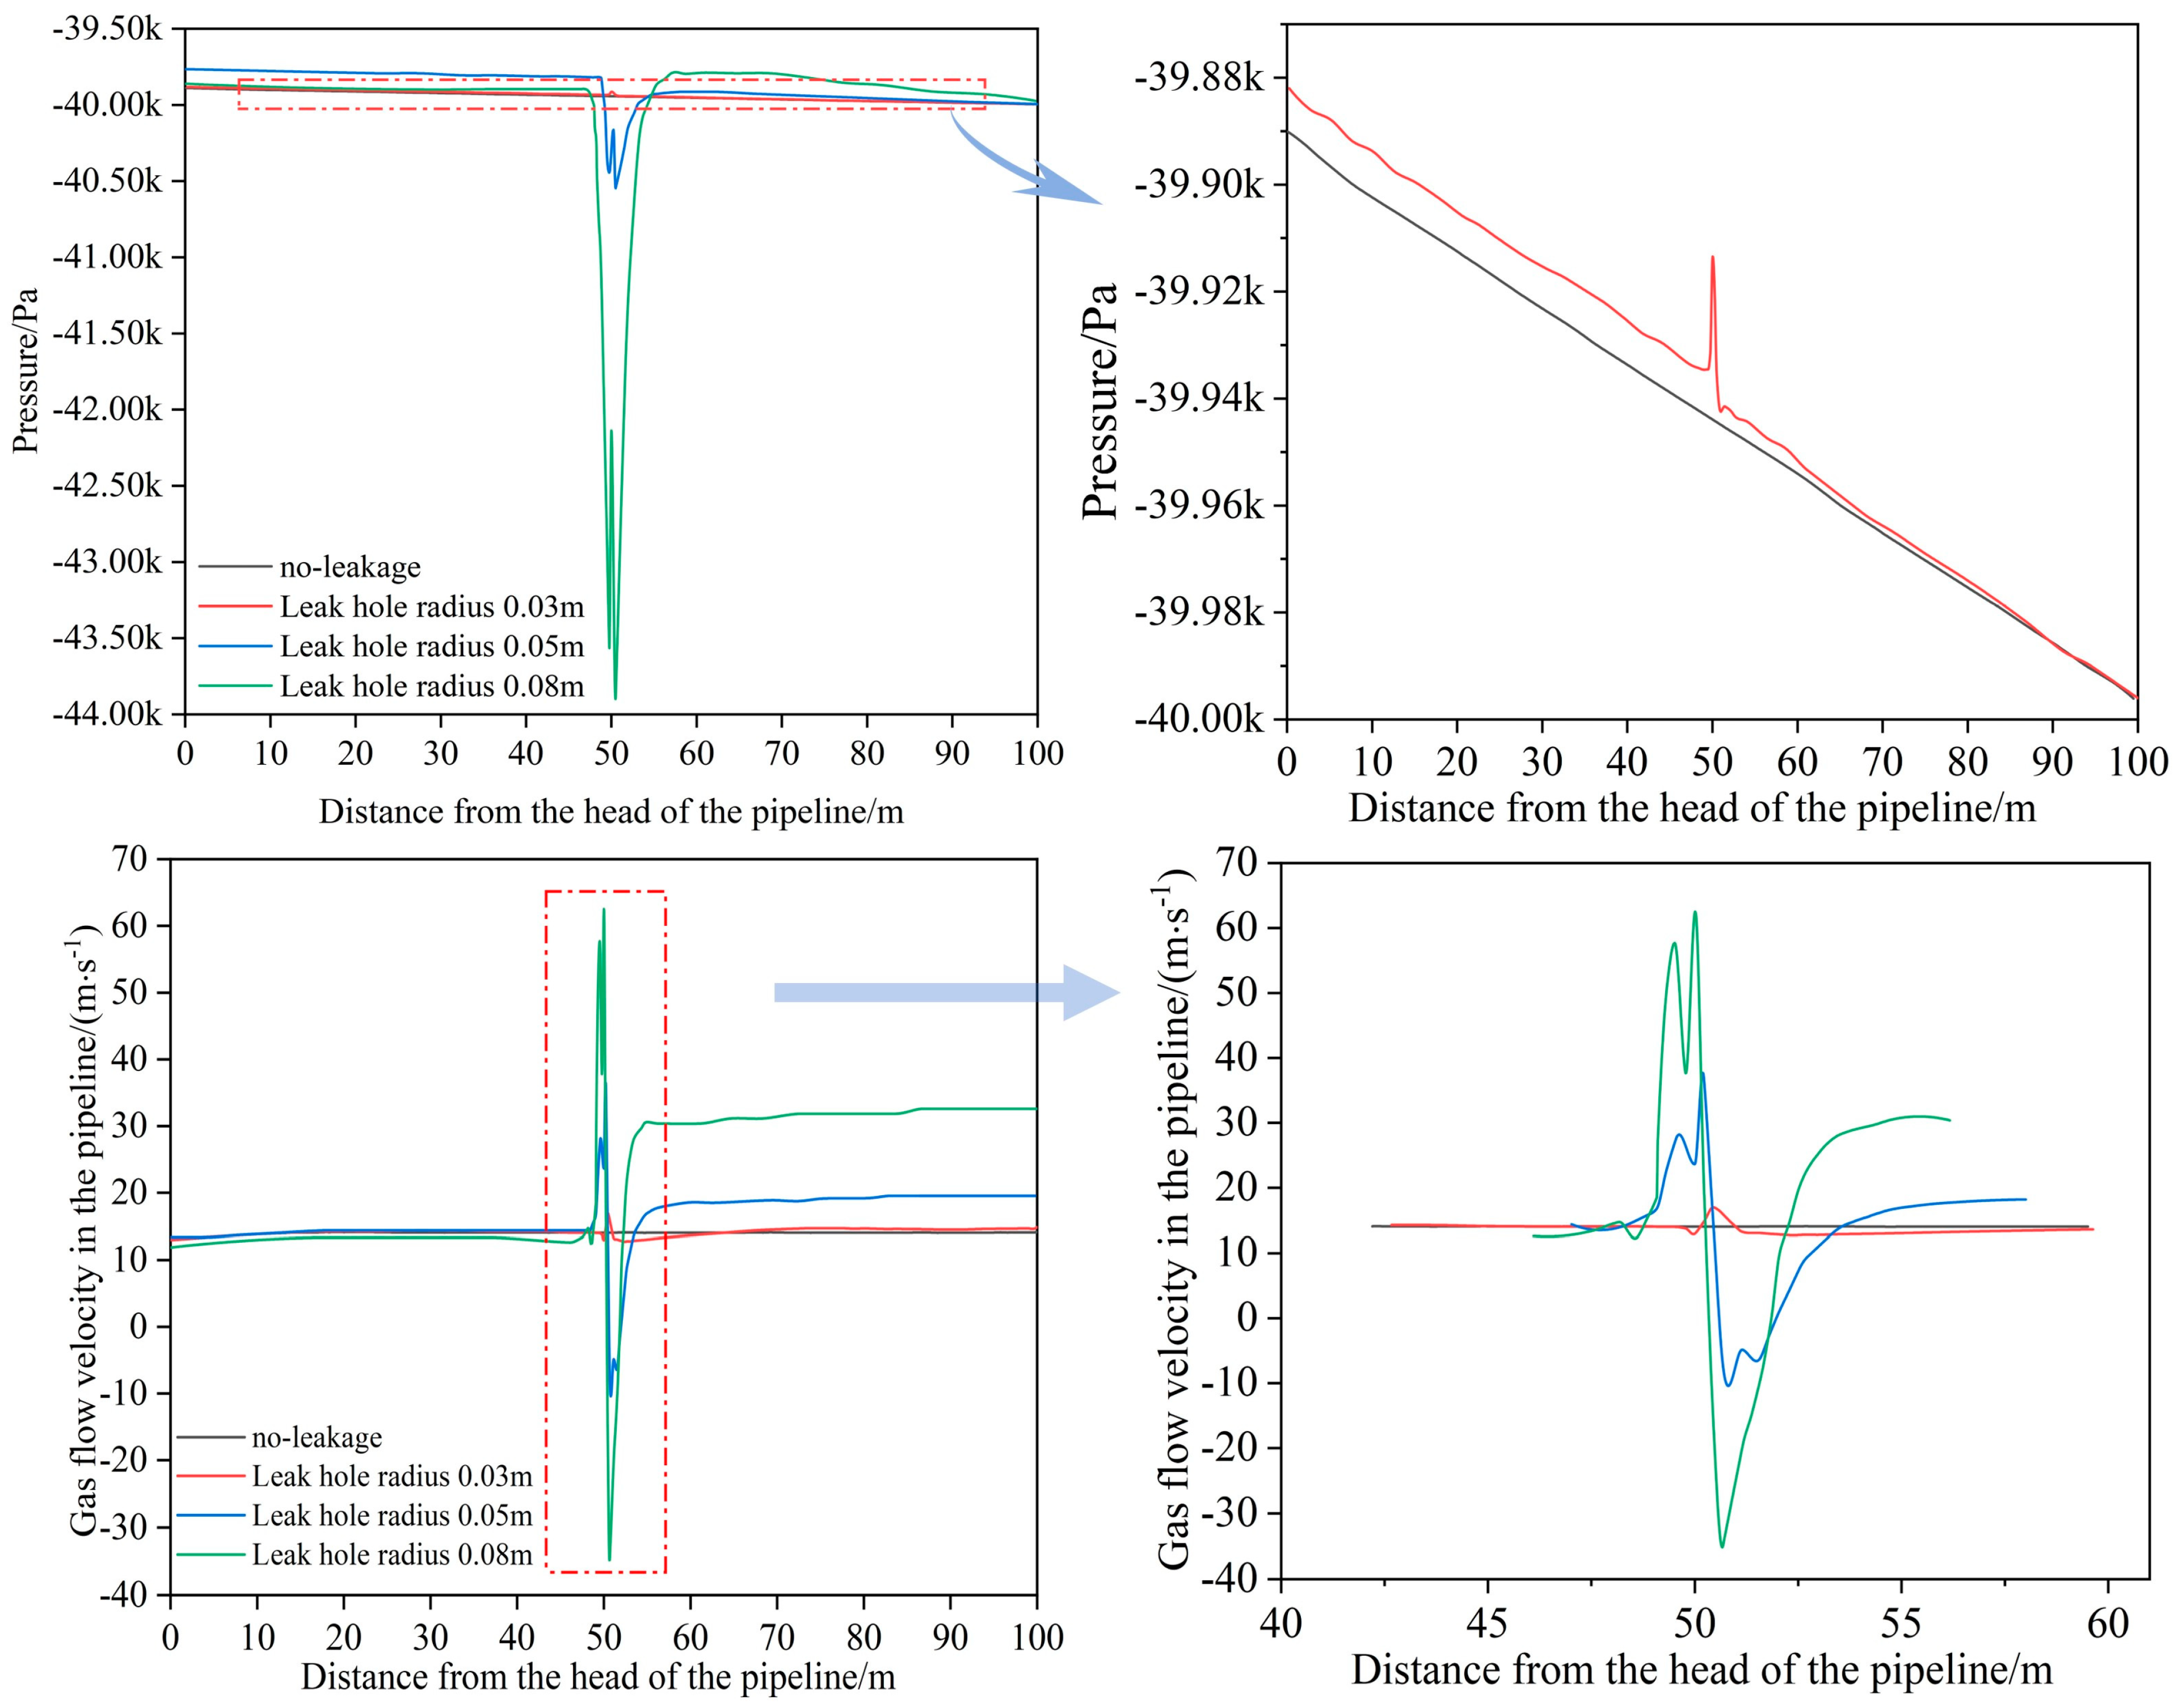
Based on the simulation results, the pressure distribution curve along the pipeline and the axial flow velocity distribution curve under different leakage degrees are plotted in Figure 6. It can be observed from Figure 6 that as the pipeline leakage degree increases, the turbulence in the pipeline surges, and the pressure distribution along the pipeline axis shows a complex trend from uniform decline to upward surge and downward plunge, with the pressure downstream the leakage point gradually increasing. In the case of leakage, the originally stable flow velocity along the pipeline fluctuates (starting from the leakage point), and the abrupt velocity changes at the leakage point increase with the increase in the leakage degree. However, the overall curve of velocity along the pipeline tends to be relatively stable.
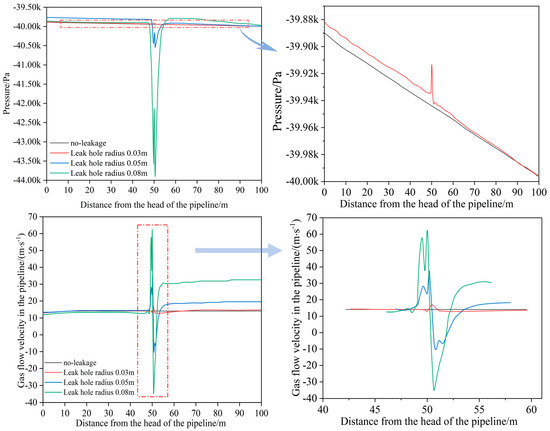
Figure 6.
Pressure distribution and axial flow velocity distribution curves along the pipeline under different leakage degrees.
3.2.2. Effect of Leakage Position on Pipeline Fluid Motion State
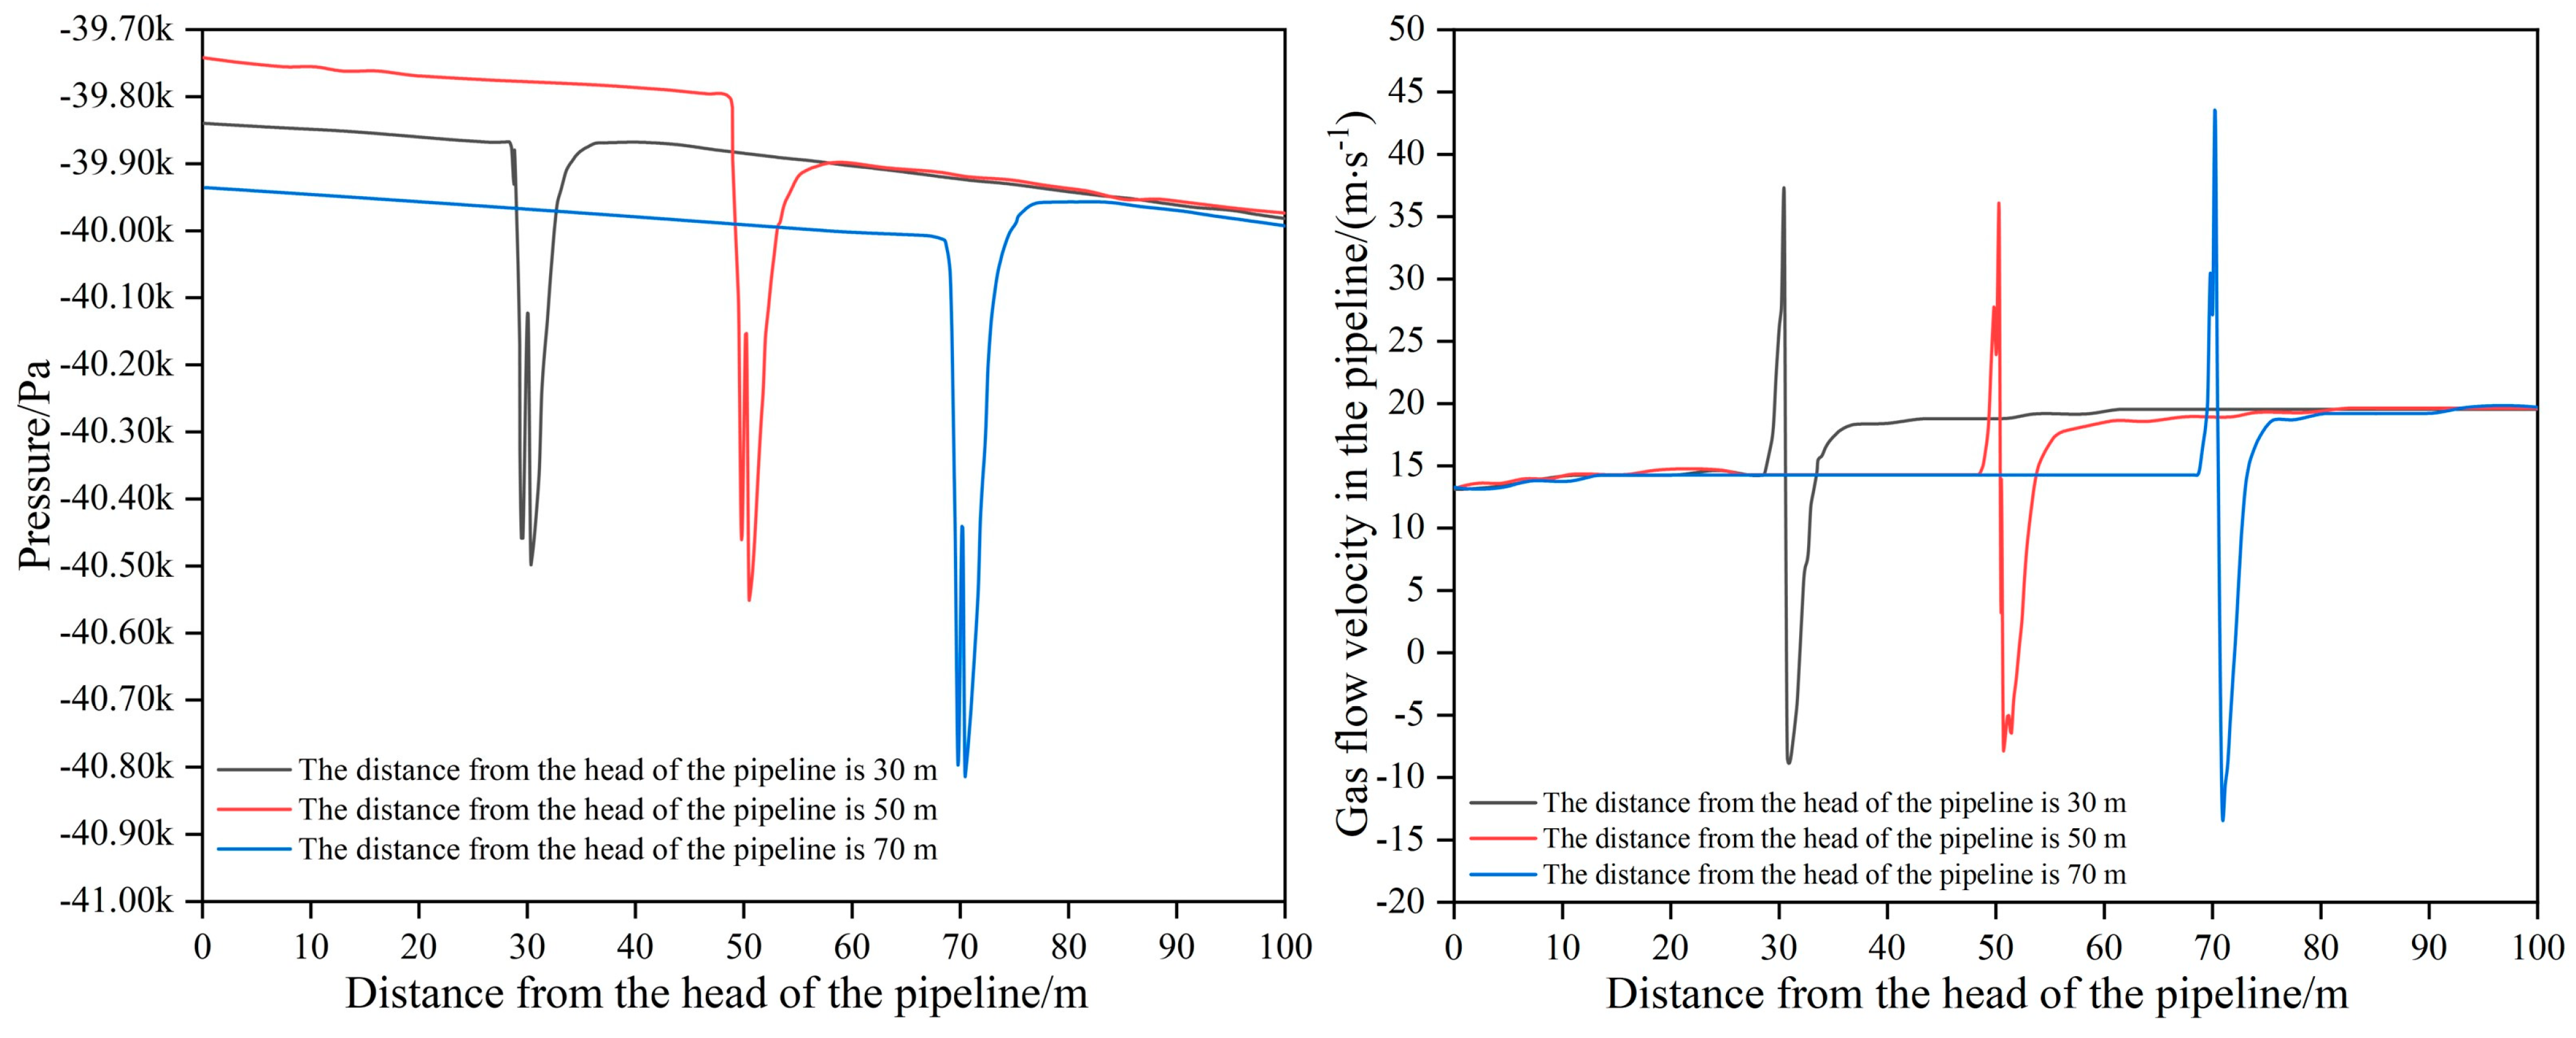
A negative pressure gas drainage pipeline model is set up with a pipeline length of 100 m, a pipeline diameter of 800 mm, an inlet speed of 13 m/s, an outlet pressure of −40,000 Pa relative pressure, an inlet pressure of 0 Pa at the leakage point, and a leakage hole radius of 0.05 m. The leakage position is set to 30 m, 50 m, and 70 m, in turn, from the start point of the pipeline. Based on the simulation results, the pipeline axial pressure and axial flow velocity distribution curves with different leakage positions are plotted, as shown in Figure 7.
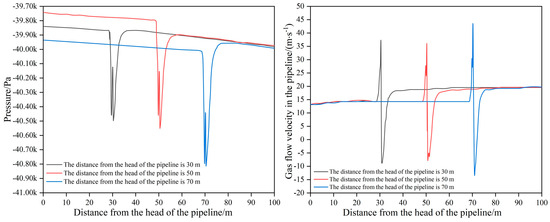
Figure 7.
Pipeline axial pressure and axial flow velocity distribution curves with different leakage positions.
With the same leakage degree, the pipeline leakage position (upstream, midstream, and downstream) has little effect on the distribution of the transversal pressure and velocity in the pipeline, all of which show abrupt changes at the leakage point. Among them, the pressure decays sharply at the leakage point, while the pressure elsewhere shows a uniform decline trend, which is consistent with the fluid dynamics law that the pipeline fluid decays under the influence of frictional resistance, viscous resistance, etc. The velocity curves with different pipeline leakage positions all trend upward and then downward. Elsewhere in the pipeline, the flow velocity rises slowly as the negative pressure drives external gas into the pipeline.
3.2.3. Effect of Negative Pressure on Pipeline Leakage Fluid Motion State
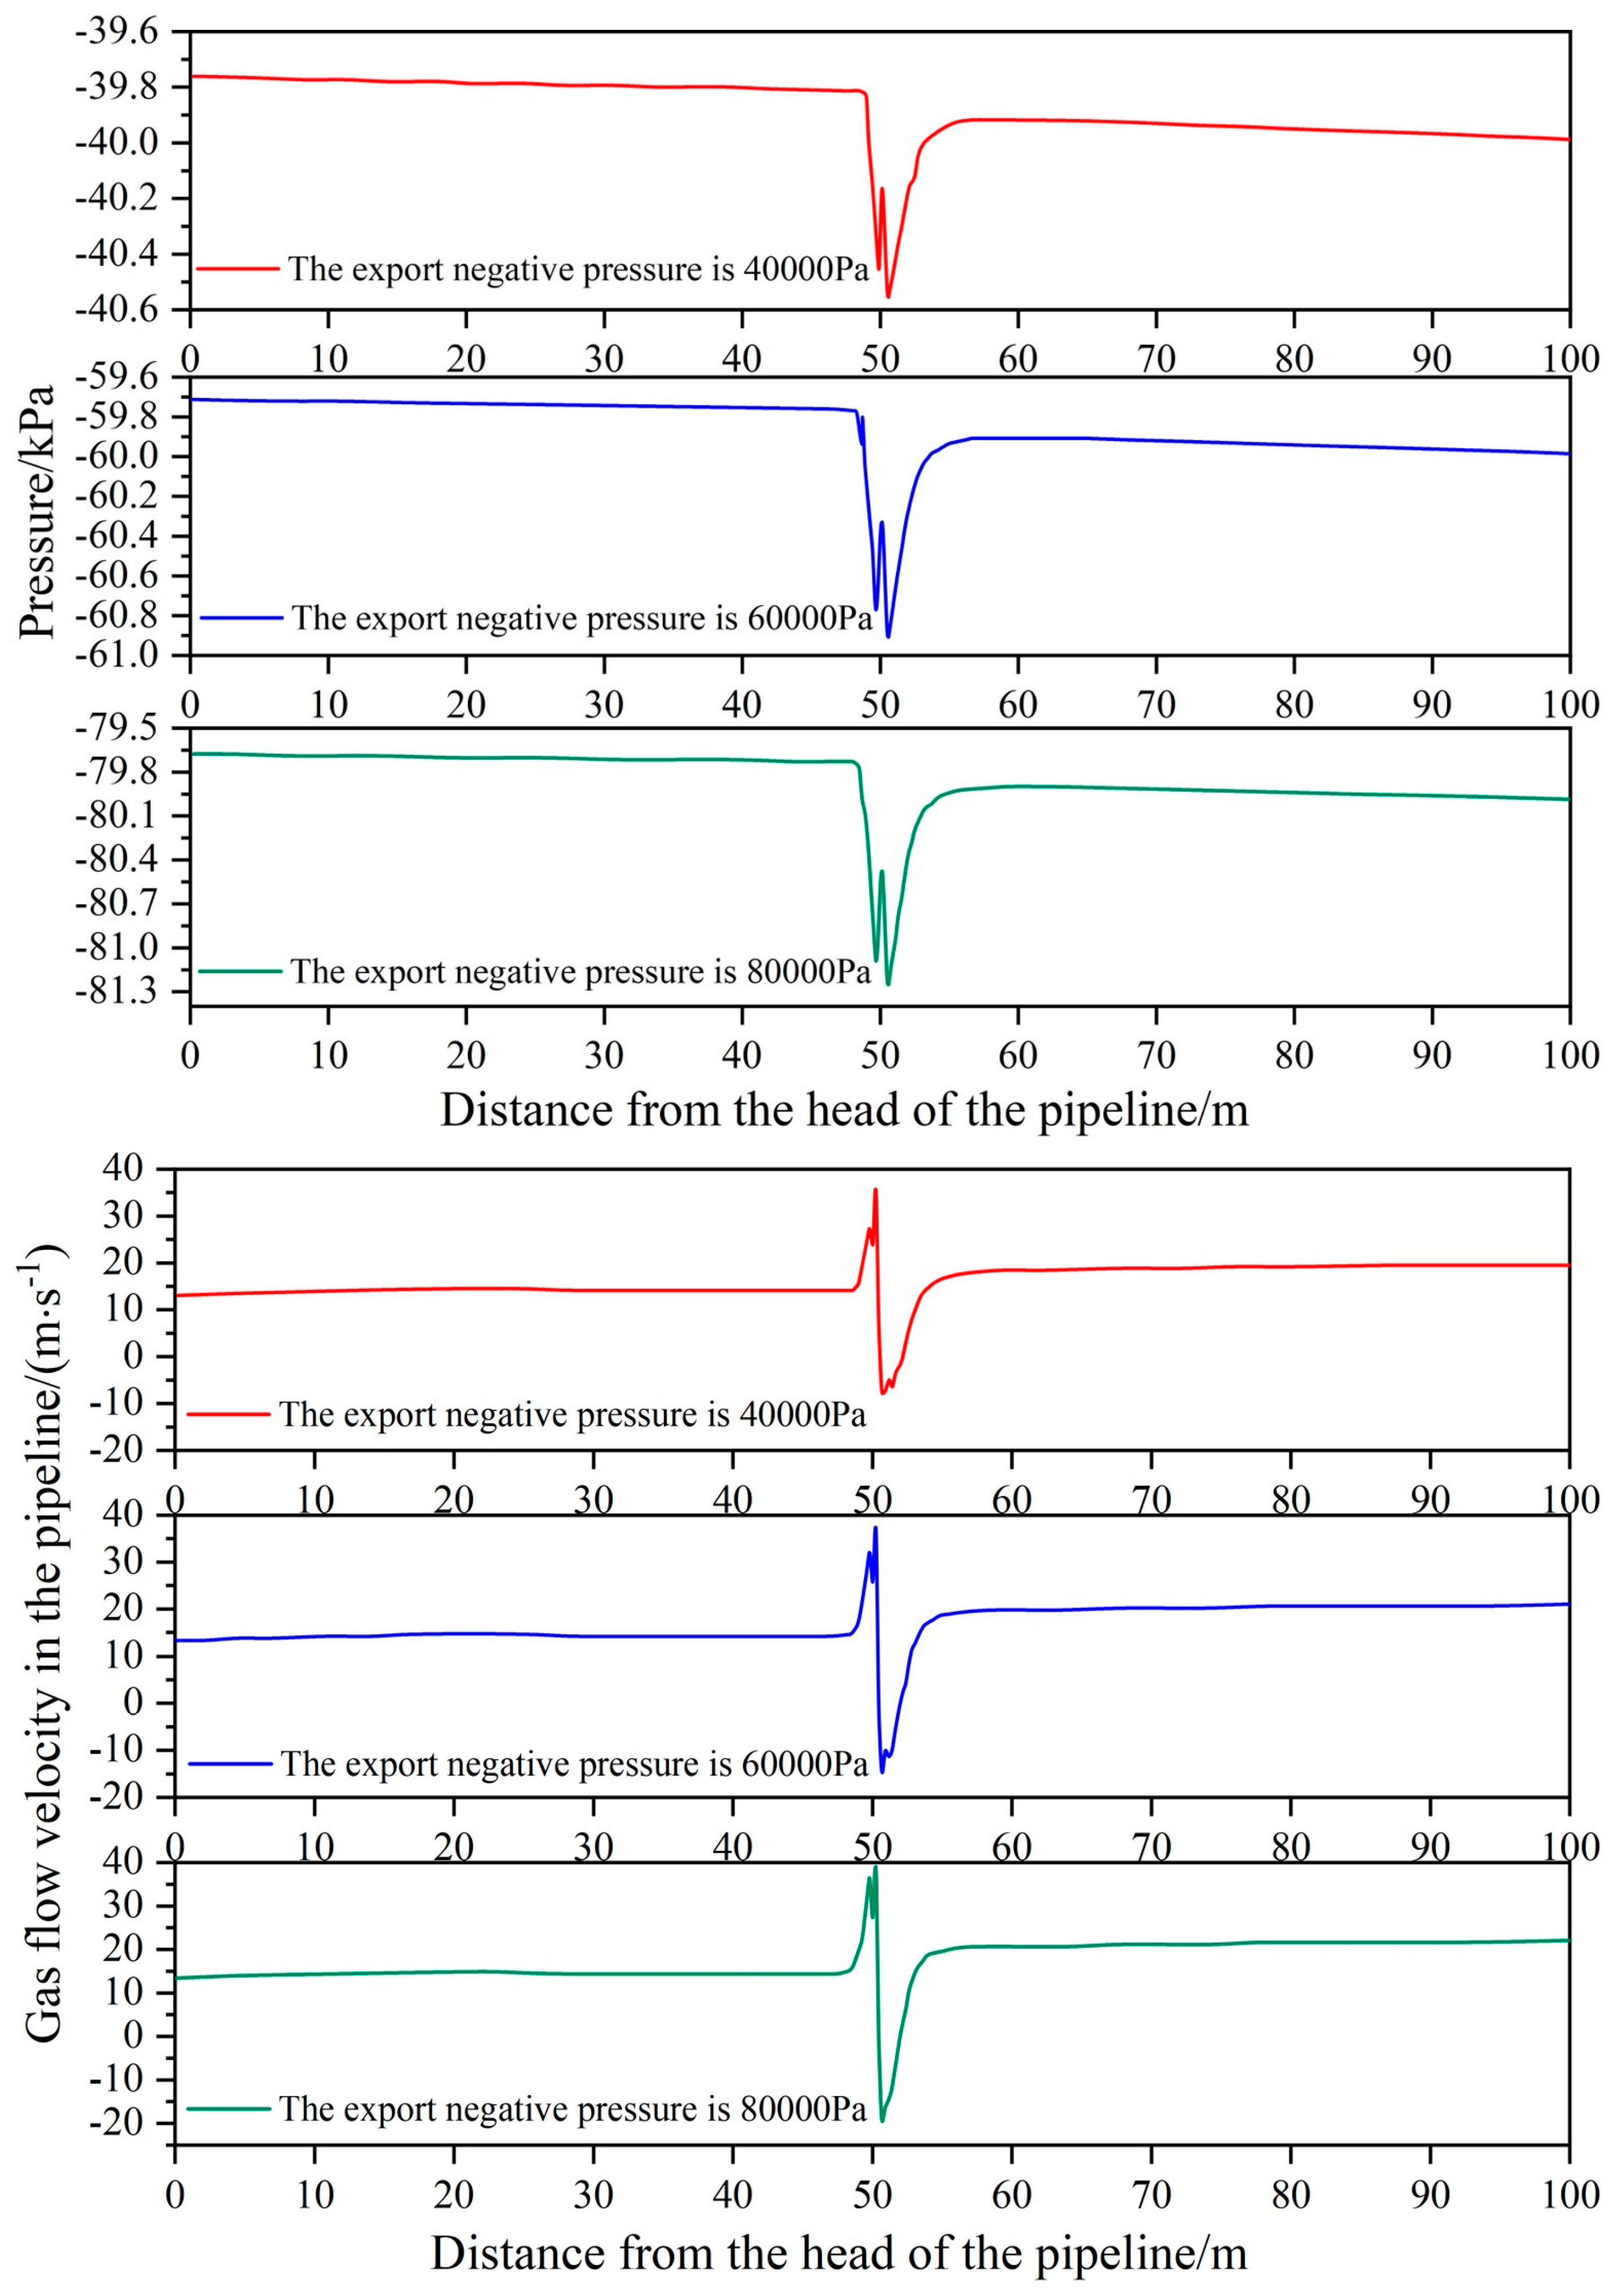
A negative pressure gas drainage pipeline model is set up with a pipeline length of 100 m, a pipeline diameter of 800 mm, an inlet speed of 13 m/s, an inlet pressure of 0 Pa at the leakage point, a leakage hole radius of 0.05 m, and a leakage position of 50 m from the start point of the pipeline. The leakage point is set as a pressure outlet, and the relative pressure is set to −40,000 Pa, −60,000 Pa, and −80,000 Pa in turn. Based on the simulation results, the distribution curves of axial pressure and axial flow velocity during pipeline leakage under different drainage negative pressures are plotted in Figure 8.
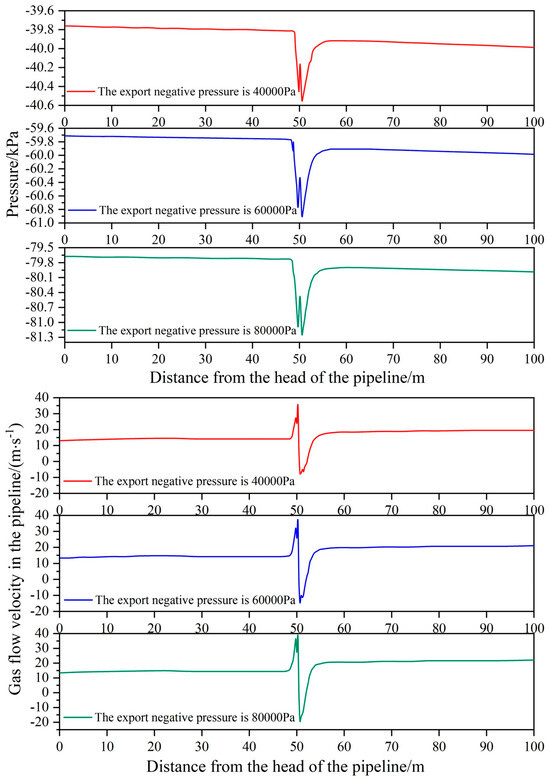
Figure 8.
Distribution curves of axial pressure and axial flow velocity during pipeline leakage under different drainage negative pressures.
Figure 8 shows that with other boundary conditions being consistent, decreasing the relative negative pressure (outlet pressure) of the pipeline causes abrupt changes in the transversal pressure and velocity distribution curves at the leakage point. As the relative pressure of the pipeline decreases, the absolute values of the sudden pressure and flow velocity change at the leakage point increase.
3.3. Accuracy Analysis of Gas Drainage Pipeline Leakage Detection and Localization Based on the Pressure Gradient Method
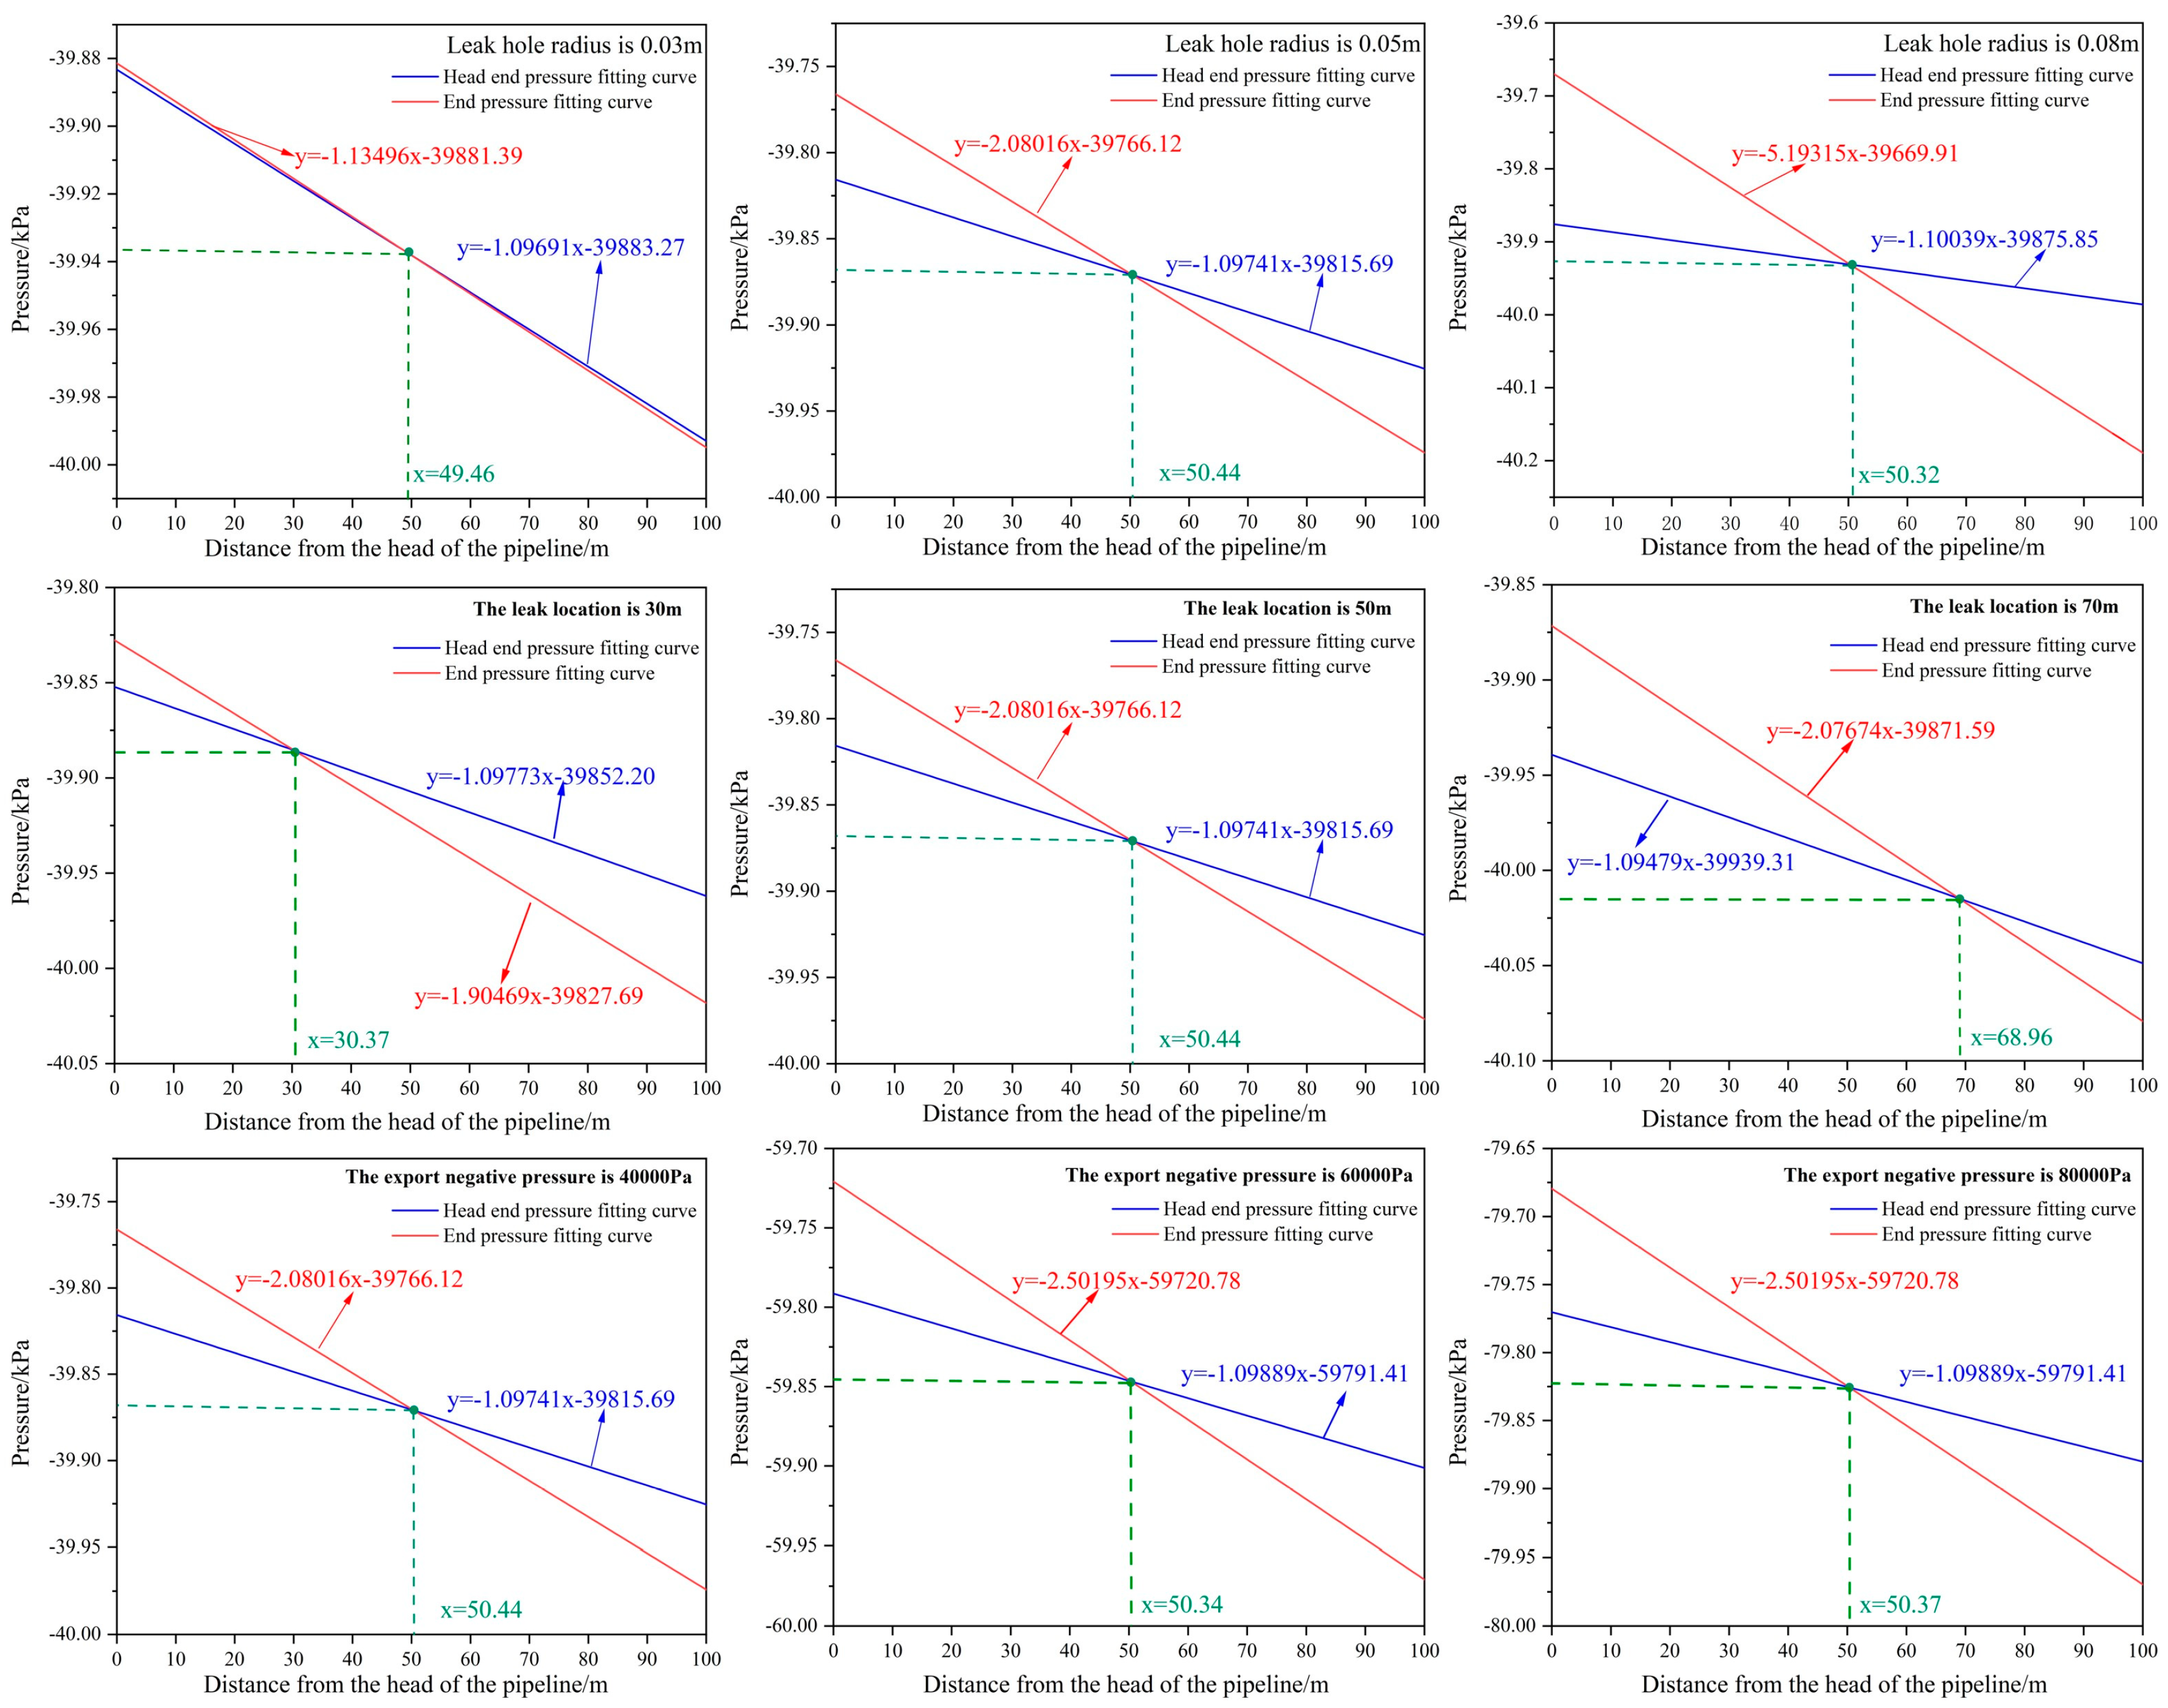
To verify the accuracy of drainage pipeline leakage detection and localization based on the pressure gradient method, the pressure data at the starting and end points of the pipeline at the same position are recorded under different working conditions (leakage degree, leakage position, and pipeline negative pressure) for fitting to derive the theoretical leakage point as the intersection point of the fitting equations of the starting and end points. The relative error between the theoretical leakage point and the actual leakage point is analyzed. The fitting curves are shown in Figure 9.
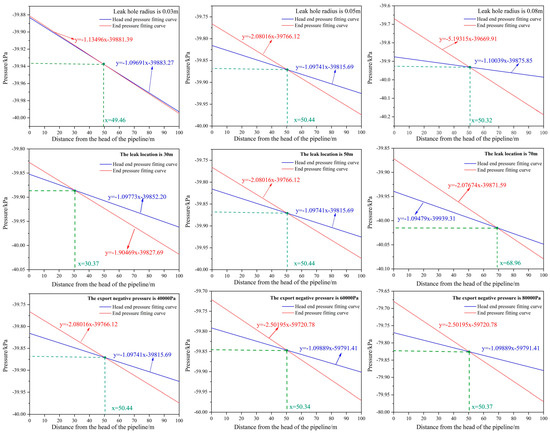
Figure 9.
Starting and end point pressure fitting curves under different working conditions.
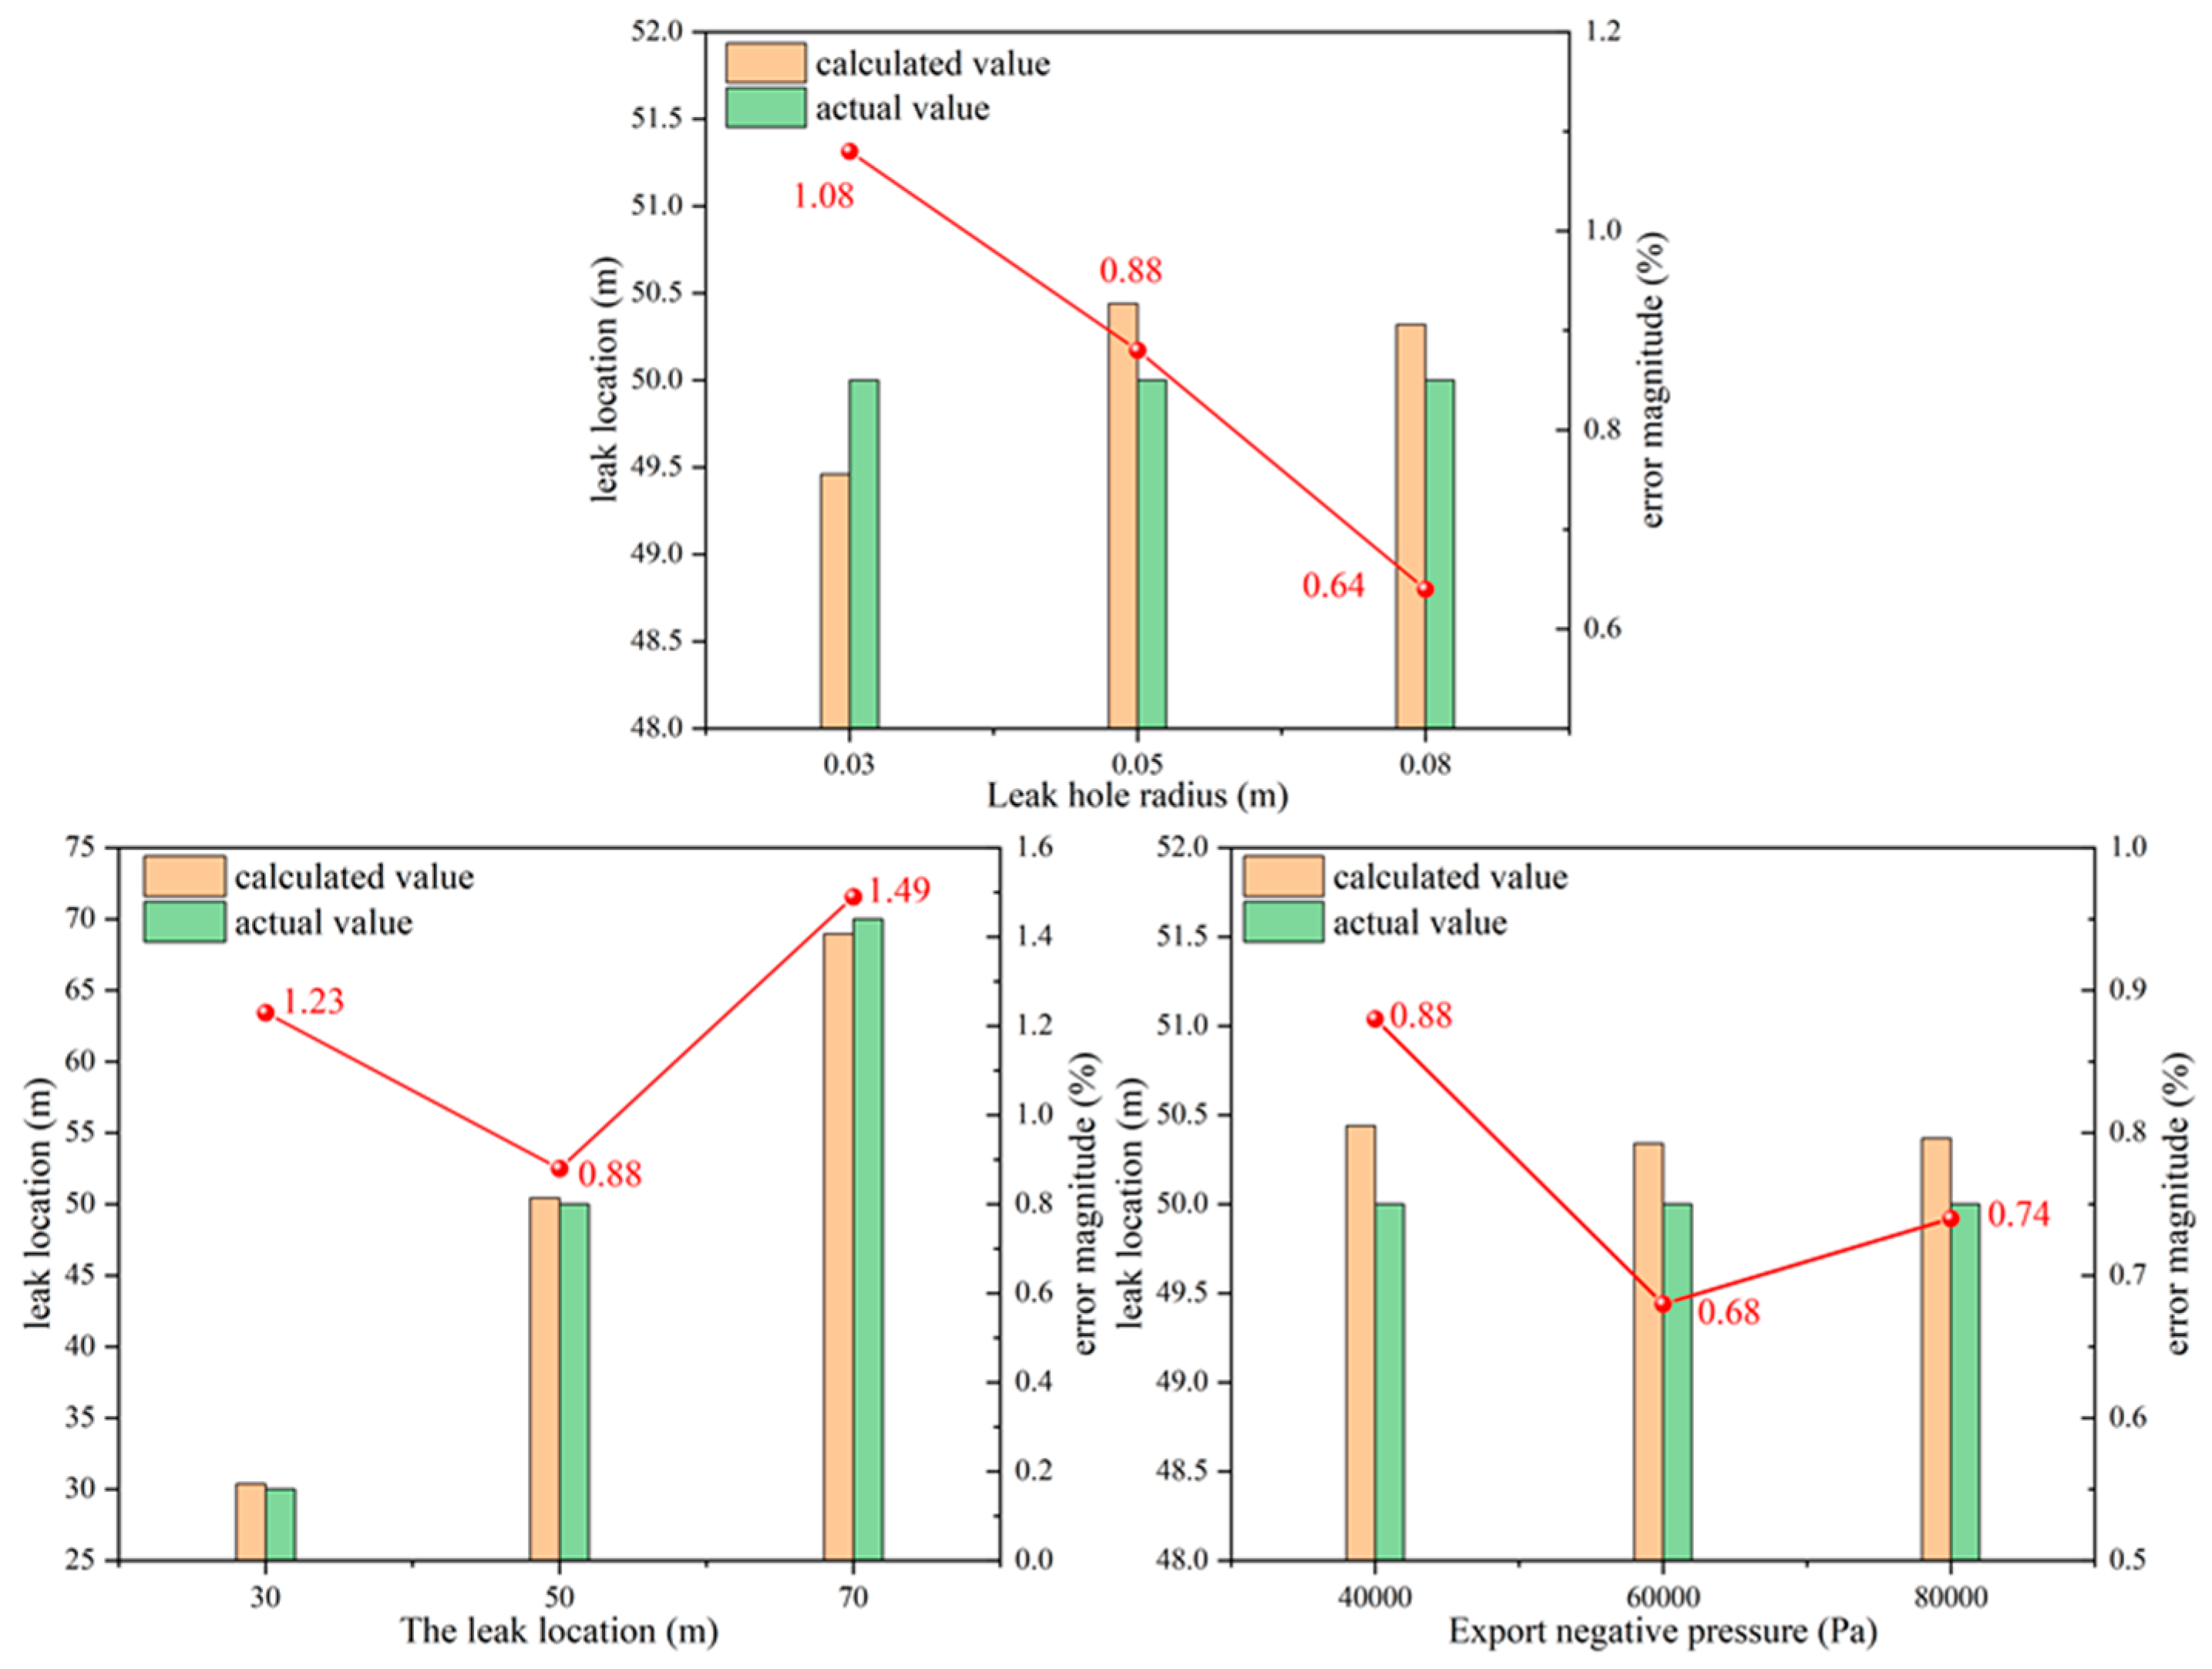
According to the comparative analysis between the actual leakage point and the theoretical leakage point obtained by fitting with the pressure data at the starting and end points of the pipeline at the same position under different working conditions (leakage degree, leakage position, and pipeline negative pressure), the relative error is derived, as shown in Figure 10.
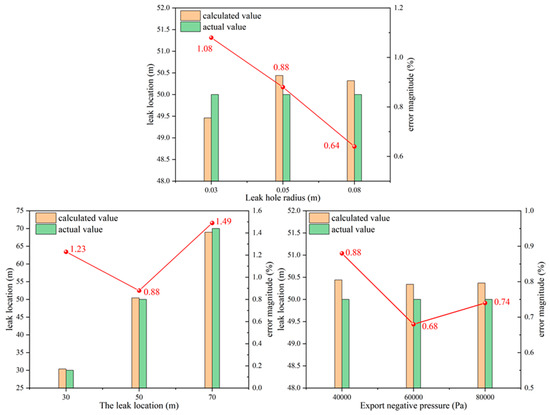
Figure 10.
Leakage localization errors under different working conditions.
Figure 10 shows that the localization error under different leakage degrees is between 0.88% and 1.08%. Thus, changes in the size of the leakage point have a relatively large impact on the steady-state pipeline leakage detection and localization method. Moreover, the amount of pipe leakage is greater with the expansion of the leakage hole, leading to a smaller relative error of localization. That is, pipeline leakage detection and localization perform better as the pipeline leakage degree increases. The localization error with different leakage positions is between 0.88% and 1.49%. Thus, changes in the leakage position have a relatively significant impact on the steady-state pipeline leakage detection and localization method. Leakage points closer to the middle of the pipeline can better reduce the influence of the pipeline’s starting and end points on the flow within. Therefore, the localization is more accurate when the leakage points are closer to the middle point of the pipeline. The localization error under different pipeline negative pressures is between 0.68% and 0.88%. Thus, the negative pressure at the pipeline outlet has relatively little effect on the steady-state leakage detection and localization method.
In order to further clarify the influence of leakage degree, leakage position, and pipeline negative pressure on the accuracy of leakage location by pressure gradient method, the statistical method was used to analyze the sample error between the theoretical value and the calculated value of simulation data by SPSS software (version 27). The results show that the standard deviations of the positioning error values under different leakage degrees, leakage locations, and pipeline negative pressure conditions are 0.22%, 0.31%, and 0.11%, respectively. The degree of leakage is negatively correlated with the positioning error, and the correlation coefficient is 0.998; that is, the greater the degree of leakage, the smaller the positioning error. The leakage position is positively correlated with the positioning error, and the correlation coefficient is 0.425; that is, the farther the leakage point is, the larger the positioning error is. The negative pressure of the pipeline is negatively correlated with the positioning error, and the correlation coefficient is 0.640; that is, the larger the negative pressure of the pipeline, the smaller the positioning error. The significance between different leakage degrees, leakage positions, pipeline negative pressures, and their corresponding positioning error values is 0.72, 0.55, and 0.04, respectively. It shows that the degree of leakage has the greatest influence on the positioning accuracy, and the influence of pipeline negative pressure on the positioning accuracy is not significant.
The above analyses indicate that without changing the other conditions of the gas extraction pipeline, merely changing the pipeline leakage hole diameter, leakage position, or pipeline negative pressure can impact the accuracy of the steady-state leakage detection and localization method. The influence of the leakage hole diameter is greater than that of the leakage position, and the influence of the leakage position is greater than that of the pipeline negative pressure. Since the leakage detection and localization errors under the influence of the three factors are within acceptable ranges, it is feasible and relatively accurate to use the pressure gradient method to detect and locate pipeline leakages.
3.4. On-Site Test Result Analysis of Leakage Detection and Localization Based on the Pressure Gradient Method
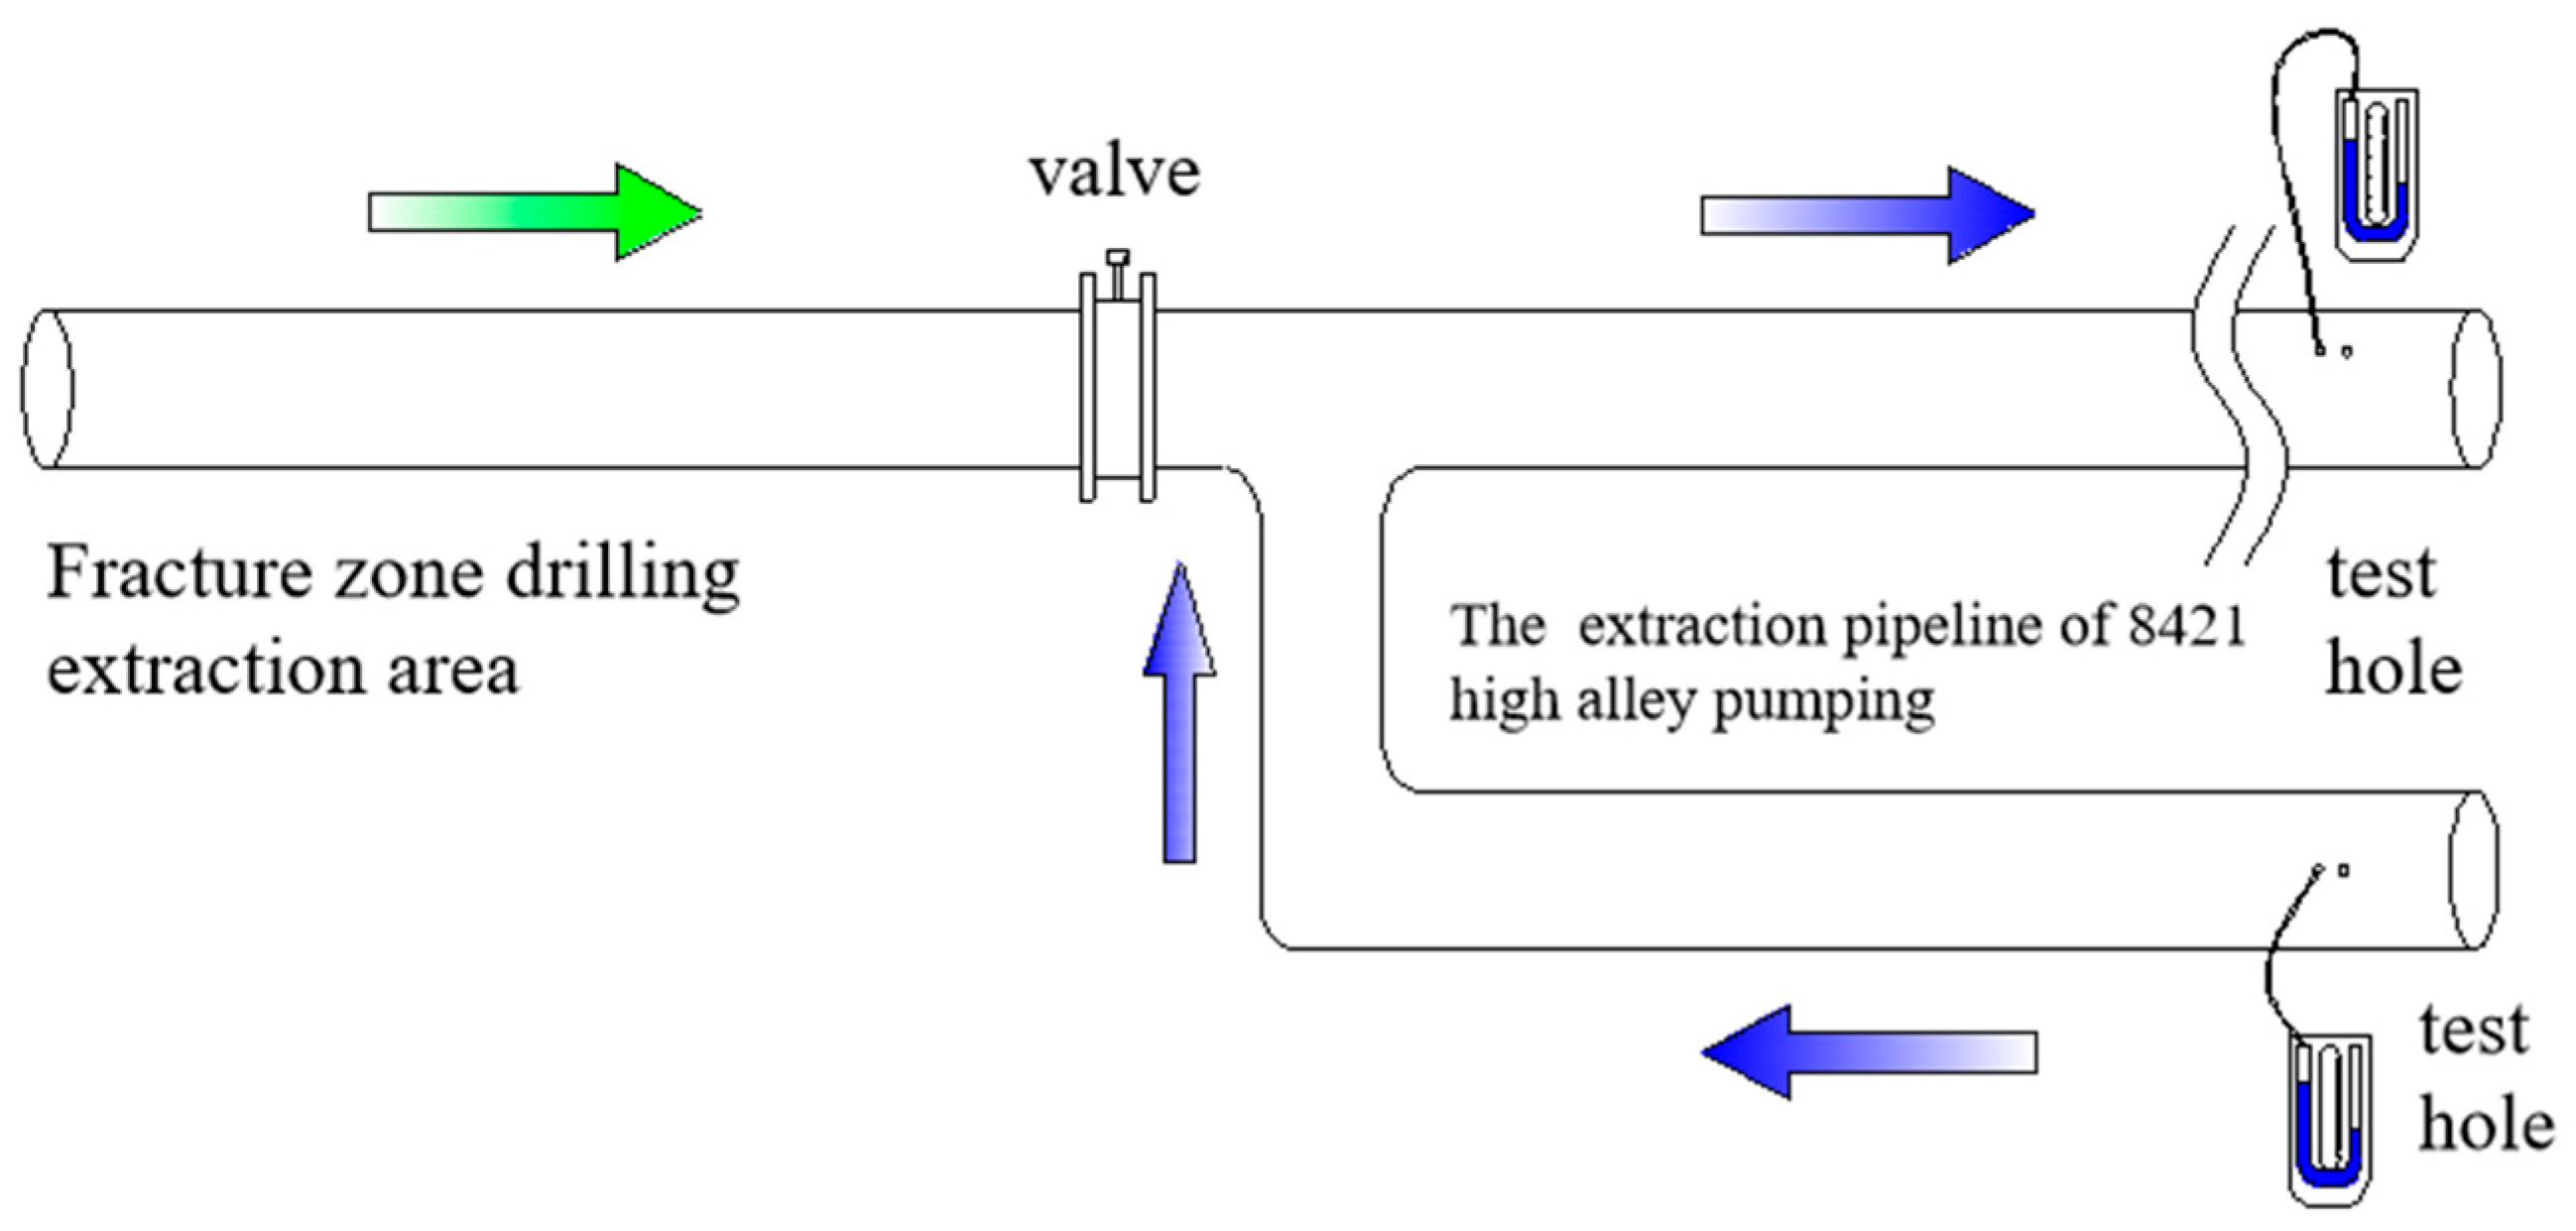
The proposed pipeline leakage detection and localization method is subjected to downhole field application tests in the 8421 highly located drainage roadway of the Fifth Mine of the Yangquan Coal Industry Group and its connected Xiaonanzhuang Pumping Station. The total length of the 8421 highly located drainage roadway is about 7542 m, and the pipeline diameter is 700 mm. Through downhole field investigations, the drainage pipeline of about 1685 m long with manual detection holes at the starting and end points was selected for the test. Figure 11 is the schematic diagram. Equation (10) is used to calculate the negative pressure loss of the pipeline in the test, and the required parameters are listed in Table 1. The application effect is analyzed based on the steady-state pressure gradient method, and the pipeline localization errors are compared.

Figure 11.
8421 highly located drainage roadway inspection schematic diagram.

Table 1.
Parameters required for calculating the resistance loss of the 8421 highly located drainage roadway pipeline.
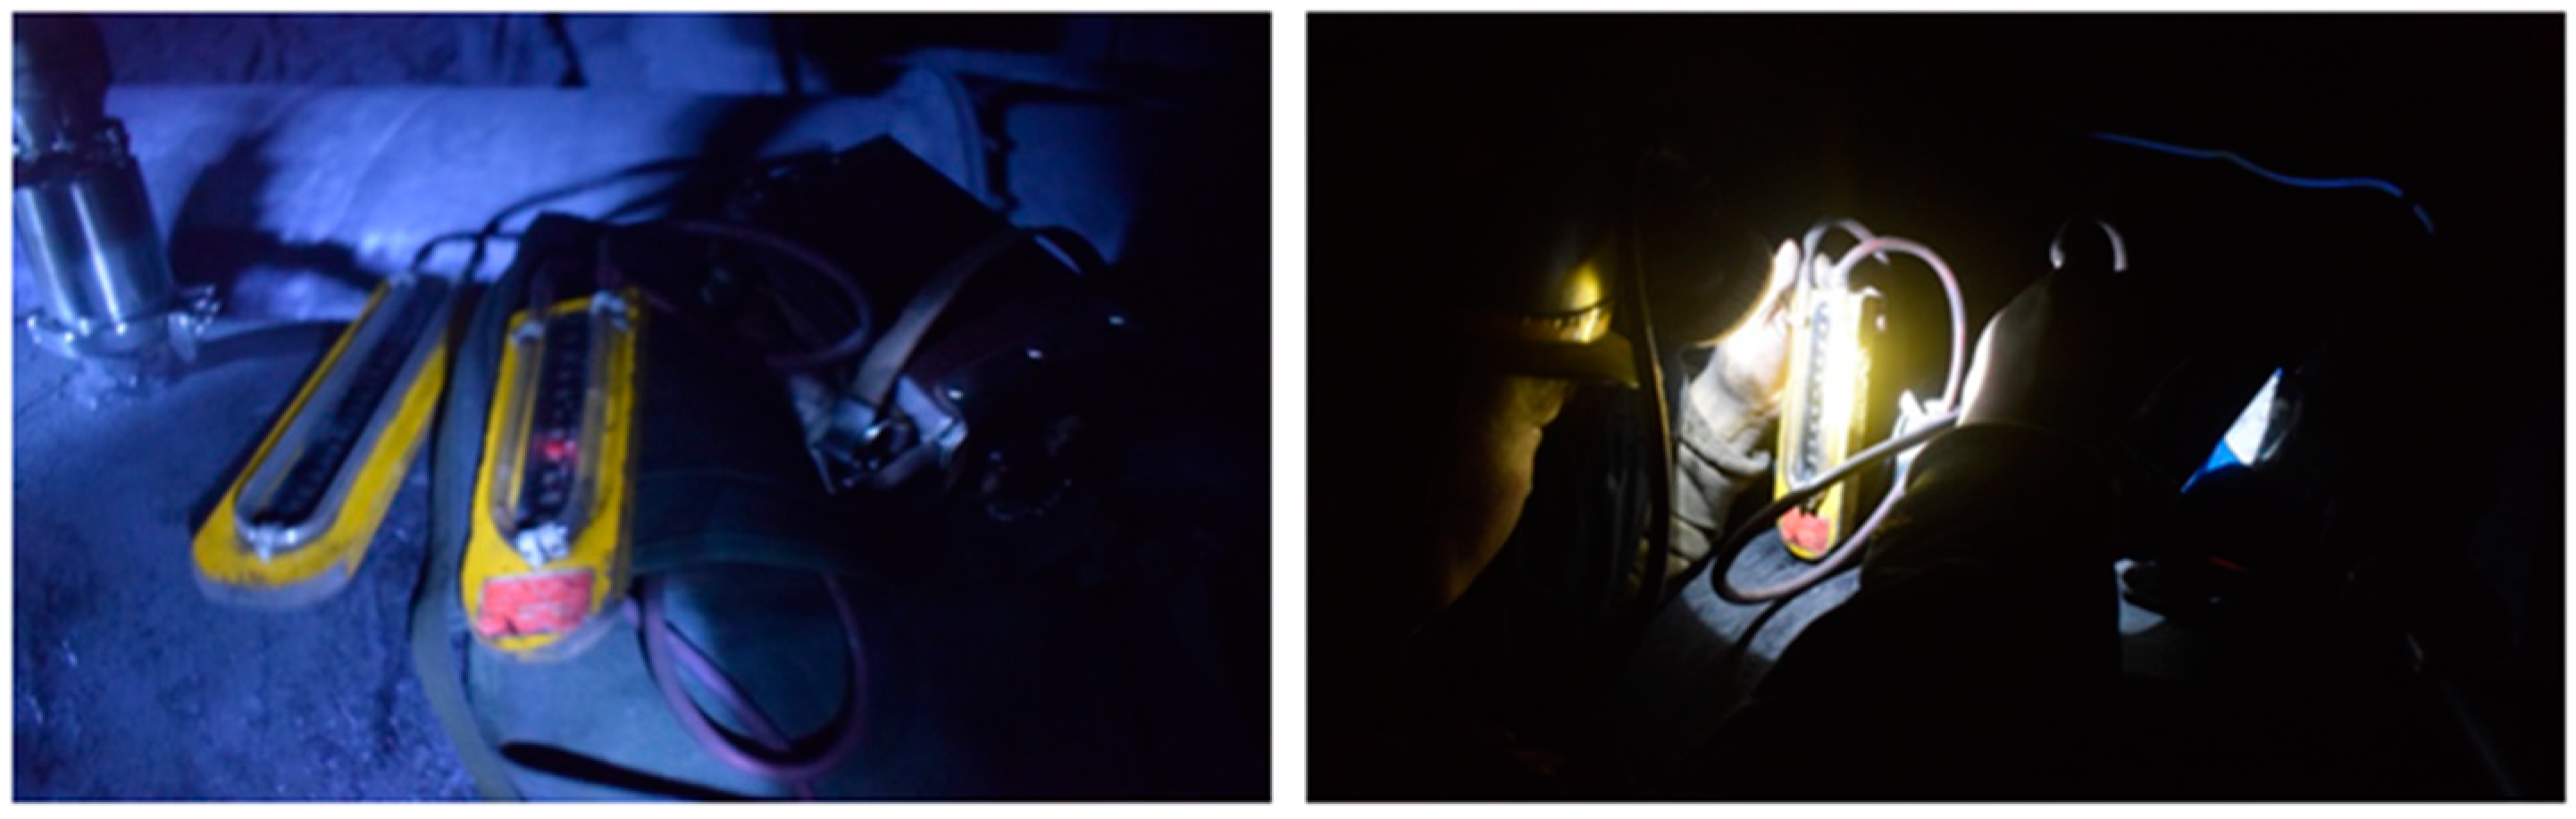
As shown in Figure 11, a pair of detection holes are designed at the starting and end points of the 8421 highly located drainage roadway, and a U-type differential pressure gauge is used to detect the negative pressure and flow at the starting and end points of the pipeline. The downhole test site is shown in Figure 12. When the valve is closed, the 8421 highly located drainage roadway can be approximated as a leak-free negative pressure pipeline. When the valve is opened, the pipeline connecting the fracture zone extraction area starts to work. Since the gas concentration in the fracture zone is low, the leaked-in gas can be approximated as air. In this way, pipeline leakage can be simulated without damaging the on-site pipeline or affecting the normal operation of the drainage pipeline.

Figure 12.
The downhole test site.
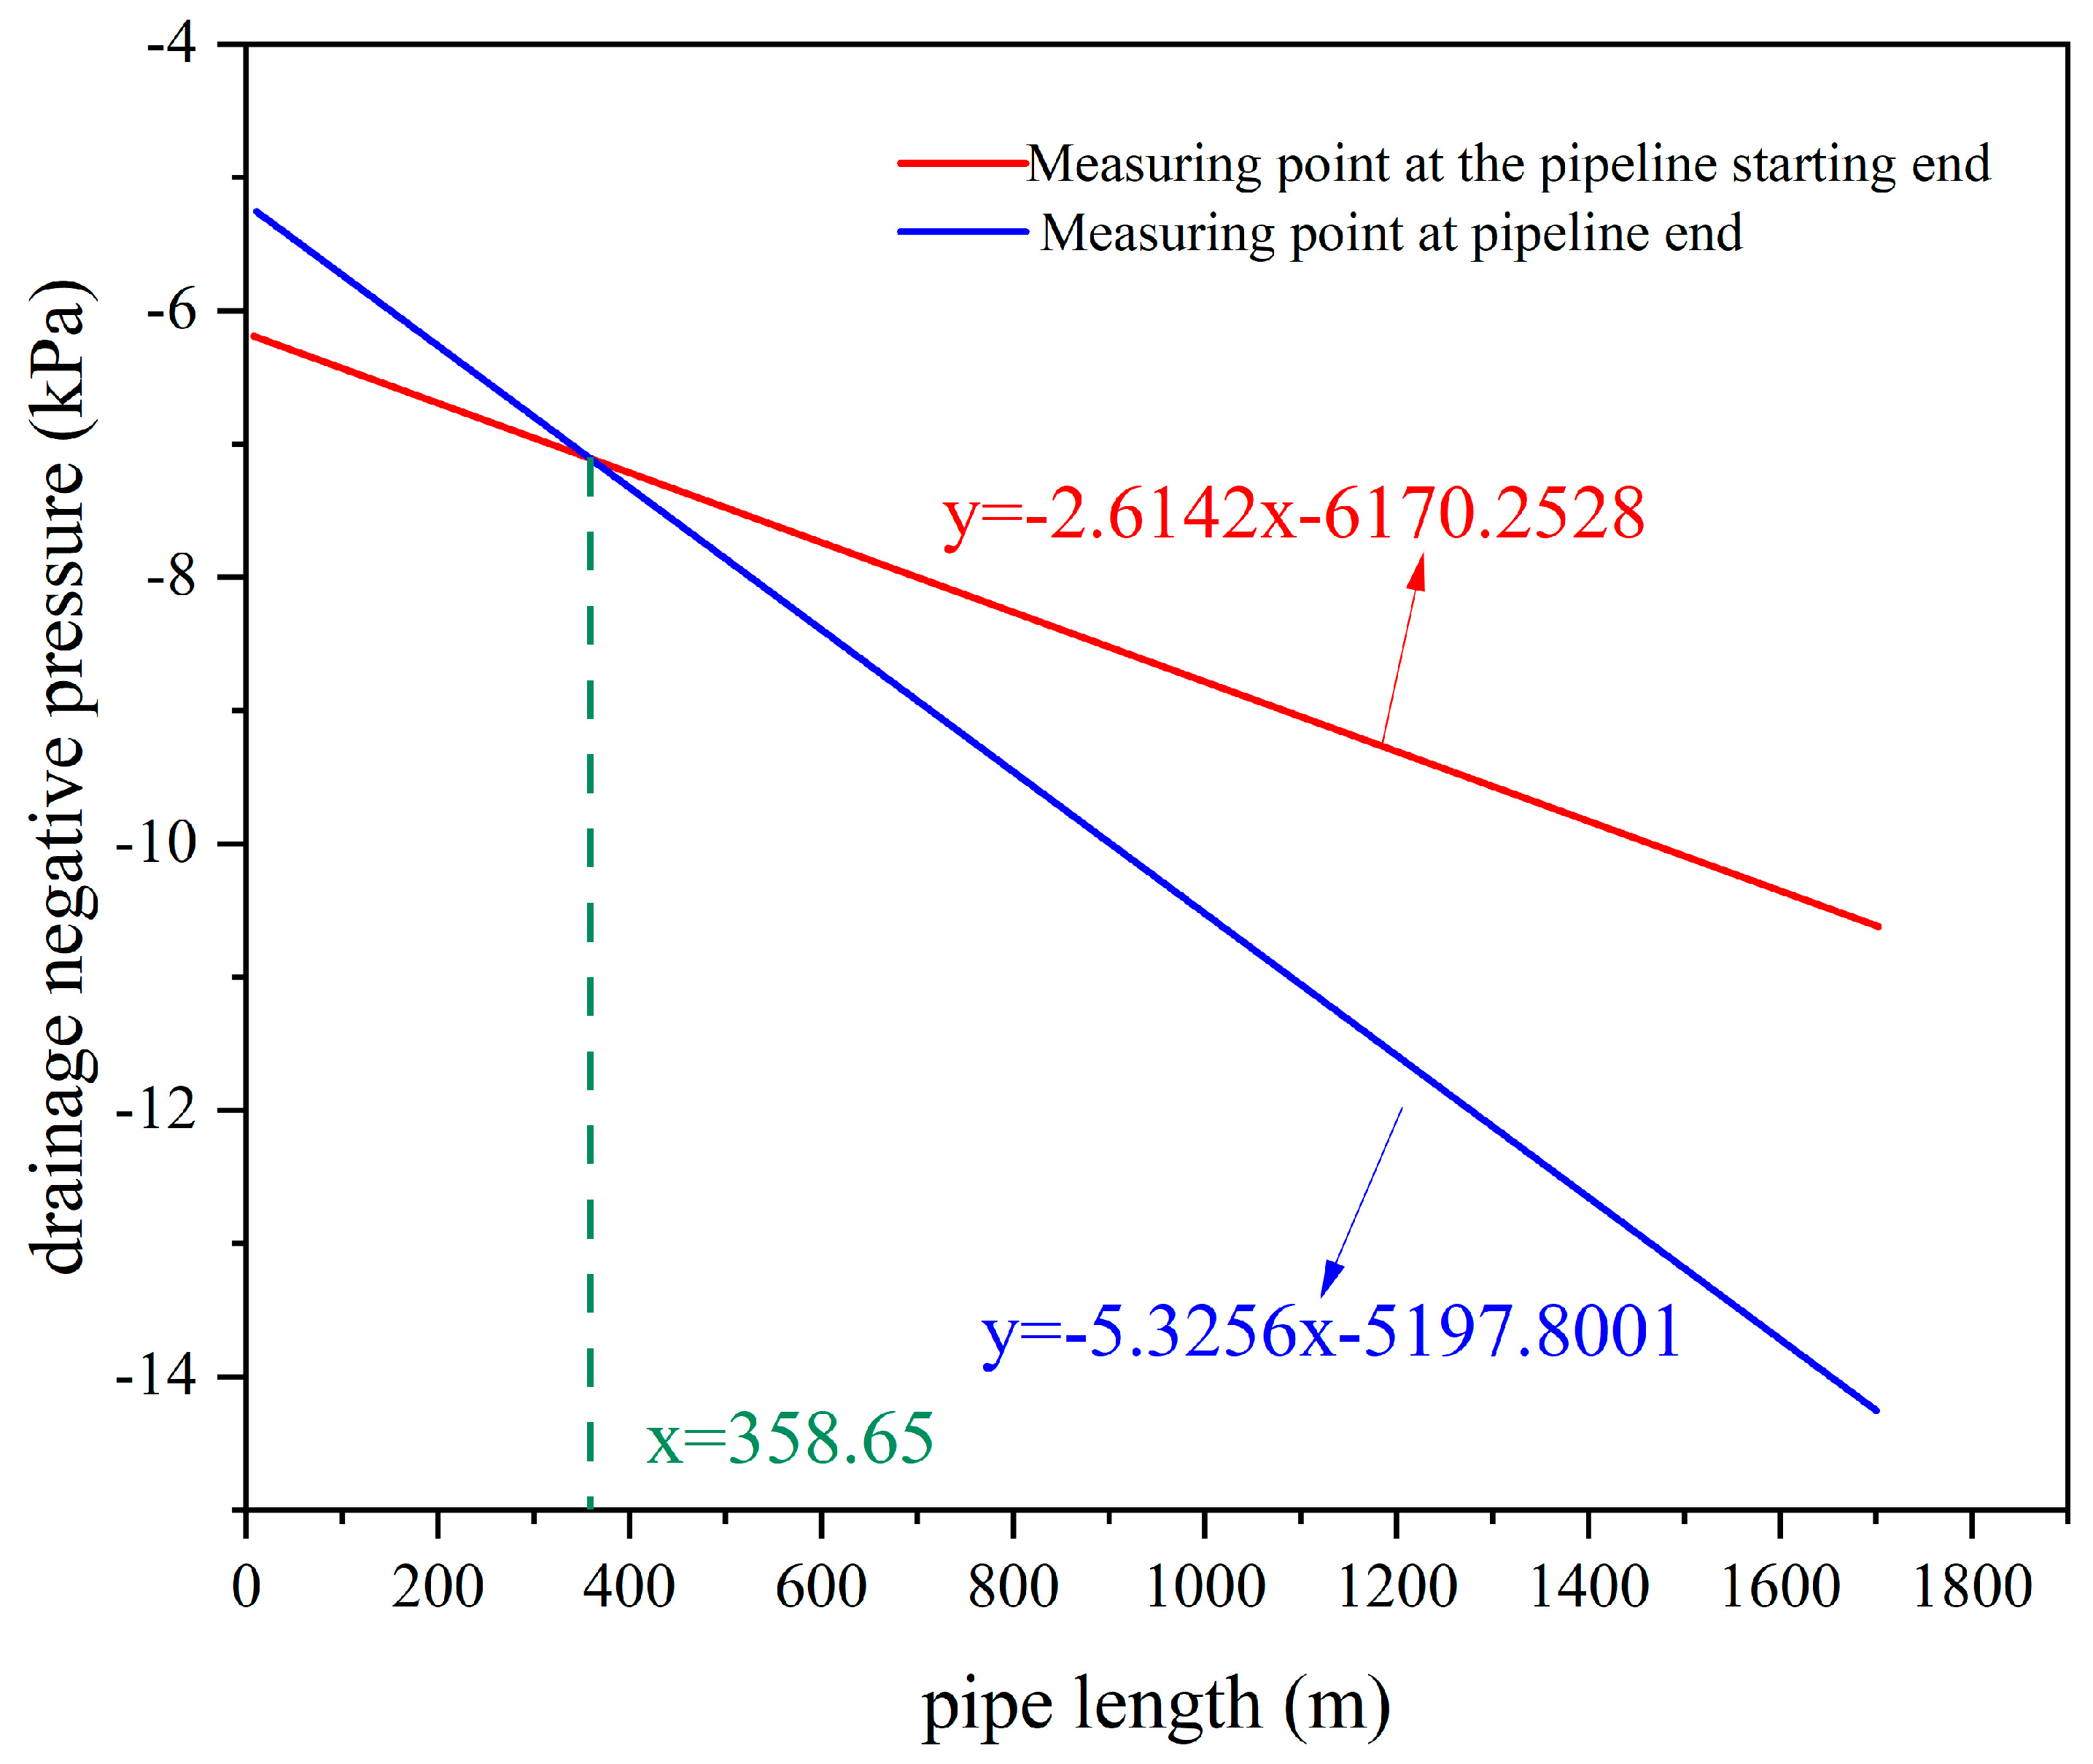
According to the field measurement data, the pressure loss curves at the starting and end points of the 8421 highly located drainage roadway pipeline are calculated, with that of the starting point being y = −2.6142x − 6170.2528 and that of the end point being y = −5.3256x − 5197.8001. The intersection of the two lines is the calculated leakage point. The calculated leakage point is at 358.65 m, as shown in Figure 13.
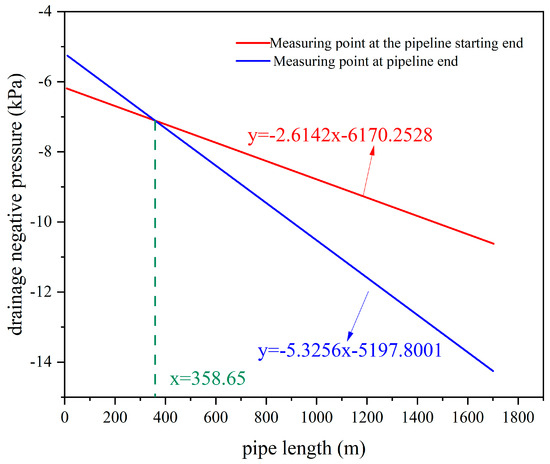
Figure 13.
Negative pressure distribution curves at the starting and end points of the 8421 highly located drainage roadway pipeline.
In this downhole drainage pipeline leakage detection test on a 1685 m pipeline, the leakage position calculated based on the pressure gradient method is about 358 m away from the detection point at the starting point of the pipeline, which has an absolute error of about 138 m from the actual leakage position (220 m), and a relative error of about 8.2%. It can be concluded that downhole drainage pipeline leakage detection and localization based on the pressure gradient method has relatively high accuracy. Meanwhile, the following conclusions can be drawn based on the simulation analysis results in Section 3.2: with increased pipeline leakage hole diameters, elevated pipeline negative pressures, and closer leakage positions to the pipeline center, the relative localization error was smaller, the localization accuracy was higher, and the stability was greater.
At present, through simulation and field test, it is proved that the pressure gradient method has good accuracy in leakage detection and location of gas extraction pipeline. However, the accurate estimation method of local resistance at the leakage point and its relationship with parameters, such as leakage volume and leakage position, still need to be further studied and improved.
3.5. Thoughts and Prospects of Pressure Gradient Method Gas Drainage Pipeline Leakage Detection Technology
The advantages of the pressure gradient method pipeline leakage detection and location technology proposed in this study are mainly reflected in the following three aspects: (1) the negative pressure monitoring of the gas extraction pipeline is part of the coal mine safety monitoring system and does not require additional economic costs; (2) real-time continuous monitoring can be realized, and the pipeline can be found in time after air leakage occurs; and (3) the theoretical method is relatively mature, which can help realize the qualitative and quantitative judgment of pipeline leakage.
This technology can be applied to pipelines that transport fluids, such as coal mine gas drainage pipelines in a negative pressure state, ground natural gas pipelines in a positive pressure state, and long-distance water pipelines. The pressure gradient method can be used to detect and locate pipeline faults.
The implementation of the pressure gradient method in the actual pipeline system is limited by the difference of pipeline resistance distribution and the sensitivity of the monitoring parameters in different application scenarios. This method also has room for improvement in accurate monitoring. The main challenge of using the pressure gradient method to carry out pipeline fault diagnosis and location is the accurate monitoring of gas flow in the pipeline and the arrangement spacing of monitoring points. The accurate monitoring of gas flow in the pipeline depends on the hardware level, and the accuracy of micro-flow monitoring is low at this stage. The spacing of monitoring points depends on the balance between the requirement of monitoring accuracy and the economic cost of monitoring.
4. Conclusions
(1) Without leakage, the pressure along the gas drainage pipeline decreases uniformly, and the flow velocity tends to be stable. In the case of leakage, the gas pressure and flow velocity distribution along the axial direction of the pipeline change significantly, and the sudden change point is the leakage point.
(2) During pipeline leakage, the pressure at the leakage point shows an overall decreasing trend, and the pressure decrements are larger with the increase in the leakage degree. The impact of leakage position on the pressure and flow velocity distributions along the pipeline is relatively small. As the drainage negative pressure decreases, the magnitude of pressure and flow velocity changes at the leakage point increases.
(3) The pipeline leakage degree, leakage position, and pipeline negative pressure affect the accuracy of leakage localization based on the pressure gradient method. The leakage degree has the greatest impact on the localization accuracy, followed by the leakage position, and pipeline negative pressure has the least impact. The pipeline leakage localization errors under different leakage degrees, leakage positions, and pipeline negative pressures are 0.88~1.08%, 0.88~1.49%, and 0.68~0.88%, respectively, indicating the relatively high feasibility and accuracy of gas drainage pipeline leakage detection and localization based on the pressure gradient method.
(4) On-site test results from the 1685 m drainage pipeline of the Yangquan Coal Industry Group show that the relative errors of leakage localization based on the pressure gradient method are about 8.2%, demonstrating the relatively high accuracy of underground drainage pipeline leakage detection and localization based on the pressure gradient method.
(5) With increased pipeline leakage degrees, elevated pipeline negative pressures, and closer leakage positions to the pipeline center, the relative localization error based on the pressure gradient method is smaller, the localization accuracy is higher, and the stability is greater.
Author Contributions
Conceptualization, H.Z. and M.S.; methodology, H.Z. and Z.H.; software, Y.Z.; validation, H.Z., Y.Z. and M.S.; formal analysis, L.S.; investigation, Y.L.; resources, Y.Z.; data curation, M.S.; writing—original draft preparation, H.Z.; writing—review and editing, M.S. and H.Z.; visualization, L.S.; supervision, Z.H.; project administration, Z.H.; funding acquisition, H.Z. All authors have read and agreed to the published version of the manuscript.
Funding
This study was supported by the China Coal Research Institute Technology Innovation Fund (2022CX-I-05) and the Special Project for Technology Innovation and Entrepreneurship Foundation of Tiandi Science & Technology Co., Ltd. (2021-2-TD-MS001).
Data Availability Statement
The data presented in this study are available on request from the corresponding author. The data are not publicly available due to containing information that could compromise the privacy of research participants.
Conflicts of Interest
The author Huijie Zhang has received research grants from China Coal Research Institute (the China Coal Research Institute Technology Innovation Fund, Number: 2022CX-I-05). The author Zhonggang Huo has received research grants from Tiandi Science & Technology Co., Ltd. (the Special Project for Technology Innovation and Entrepreneurship Foundation, Number: 2021-2-TD-MS001). All the authors declare no conflicts of interest.
References
- Liu, Y.; Liang, Y.; Li, Q. Cause Analysis of Coal Mine Gas Accidents in China Based on Association Rules. Appl. Sci. 2023, 13, 9266. [Google Scholar] [CrossRef]
- Wang, C.; Yang, S.; Yang, D.; Li, X.; Jiang, C. Experimental analysis of the intensity and evolution of coal and gas outbursts. Fuel 2018, 226, 252–262. [Google Scholar] [CrossRef]
- Zhao, W.; Dong, H.; Yuan, Y.; Wang, K.; Song, Y. Evolution law of coal and gas outburst hole shapes with varying underground stress conditions: Numerical analysis and on-scene evidence. Fuel 2024, 360, 130531. [Google Scholar] [CrossRef]
- Zhou, A.; Xu, Z.; Wang, K.; Wang, Y.; An, J.; Shi, Z. Coal mine gas migration model establishment and gas extraction technology field application research. Fuel 2023, 349, 128650. [Google Scholar] [CrossRef]
- Wang, Z.; Sun, Y.; Wang, Y.; Zhang, J.; Sun, Z. A coupled model of air leakage in gas drainage and an active support sealing method for improving drainage performance. Fuel 2019, 237, 1217–1227. [Google Scholar] [CrossRef]
- Zhang, J.; Liu, Y.; Ren, P.; Han, H.; Zhang, S. A fully multifield coupling model of gas extraction and air leakage for in-seam borehole. Energy Rep. 2021, 7, 1293–1305. [Google Scholar] [CrossRef]
- Liu, T.; Lin, B.; Yang, W.; Liu, T.; Kong, J.; Huang, Z.; Wang, R.; Zhao, Y. Dynamic diffusion-based multifield coupling model for gas drainage. J. Nat. Gas Sci. Eng. 2017, 44, 233–249. [Google Scholar] [CrossRef]
- Shu, L. Study on Gas Extraction Technology for Goaf Using L-Shaped Borehole on the Ground. Appl. Sci. 2024, 14, 1594. [Google Scholar] [CrossRef]
- Yang, P. Cause Analysis and Repair Technology of Gas Leakage in Gas Extraction Pipeline. Master’s Thesis, Xi’an University of Science and Technology, Xi’an, China, 2022. [Google Scholar]
- Han, Q.Z.; Xiang, J.; Shao, H. Research on leakage positioning technology of gas drainage pipelines. China Coal 2011, 37, 90–93. [Google Scholar]
- Pei, W. Experimental Study on the Leak Detectionand Localization System of Main Methane Drainage Pipeline. Master’s Thesis, China University of Mining and Technology, Xuzhou, China, 2014. [Google Scholar]
- Lu, H.; Iseley, T.; Behbahani, S.; Fu, L. Leakage detection techniques for oil and gas pipelines: State-of-the-art. Tunn. Undergr. Space Technol. 2020, 98, 103249. [Google Scholar] [CrossRef]
- Sekhavati, J.; Hashemabadi, S.H.; Soroush, M. Computational methods for pipeline leakage detection and localization: A review and comparative study. J. Loss Prev. Process Ind. 2022, 77, 104771. [Google Scholar] [CrossRef]
- El-Shiekh, T.M. Leak Detection Methods in Transmission Pipelines. Energy Sources Part A Recovery Util. Environ. Eff. 2010, 32, 715–726. [Google Scholar] [CrossRef]
- Tian, X.; Jiao, W.; Liu, T. Intelligent leak detection method for low-pressure gas pipeline inside buildings based on pressure fluctuation identification. J. Civ. Struct. Health Monit. 2022, 12, 1191–1208. [Google Scholar] [CrossRef]
- Yin, S.; Liu, Y.; Han, W. Single-point location algorithm based on an acceleration sensor for pipeline leak detection. Measurement 2020, 163, 108021. [Google Scholar] [CrossRef]
- Bui Quy, T.; Kim, J.-M. Leak detection in a gas pipeline using spectral portrait of acoustic emission signals. Measurement 2020, 152, 107403. [Google Scholar] [CrossRef]
- He, N.; Qian, C.; Li, R.; Zhang, M. An improved pipeline leak detection and localization method based on compressed sensing and event-triggered particle filter. J. Frankl. Inst. 2021, 358, 8085–8108. [Google Scholar] [CrossRef]
- Zhou, J.; Lin, H.; Li, S.; Jin, H.; Zhao, B.; Liu, S. Leakage diagnosis and localization of the gas extraction pipeline based on SA-PSO BP neural network. Reliab. Eng. Syst. Saf. 2023, 232, 109051. [Google Scholar] [CrossRef]
- Zuo, J.; Zhang, Y.; Xu, H.; Zhu, X.; Zhao, Z.; Wei, X.; Wang, X. Pipeline Leak Detection Technology Based on Distributed Optical Fiber Acoustic Sensing System. IEEE Access 2020, 8, 30789–30796. [Google Scholar] [CrossRef]
- Zhang, T.; Tan, Y.; Zhang, X.; Zhao, J. A novel hybrid technique for leak detection and location in straight pipelines. J. Loss Prev. Process Ind. 2015, 35, 157–168. [Google Scholar] [CrossRef]
- Liu, B.; Jiang, Z.; Nie, W. Negative pressure wave denoising based on VMD and its application in pipeline leak location. J. Mech. Sci. Technol. 2021, 35, 5023–5032. [Google Scholar] [CrossRef]
- She, X.Z.; Hou, Q.; Yang, L. Leak Detection Technology in Underground Gas Extraction Pipe Network. Saf. Coal Mines 2013, 44, 75–77. [Google Scholar]
- Lei, B.W.; Li, X.; Liu, Z. Research on Diagnosis Method for Gas Drainage Pipeline Network Running State Based on Pressure Measurement. Min. Saf. Environ. Prot. 2017, 44, 32–35+52. [Google Scholar]
- Mao, J.R.; Liu, X.; Wang, S. Leak Detection Analysis and Maintenance of Gas Extraction Pipeline Based on Pressure Gradient Method. J. Kunming Metall. Coll. 2020, 36, 15–19+46. [Google Scholar]
- Zhang, Y.Z.; Zhang, L.; Zhang, H.; Li, W.; Liu, Y.; Sang, C. Research on leakage positioning method of underground gas extraction main pipeline based on transient model. J. Mine Autom. 2021, 47, 55–60. [Google Scholar]
- Guo, S. A Leakage Detection Technology for Gas Drainage Pipeline Based on Ultrasonic Inspection. Min. Saf. Environ. Prot. 2014, 41, 88–91. [Google Scholar]
- Cai, J.; Wu, J.; Yuan, S.; Liu, Z.; Kong, D. Numerical analysis of multi-factors effects on the leakage and gas diffusion of gas drainage pipeline in underground coal mines. Process Saf. Environ. Prot. 2021, 151, 166–181. [Google Scholar] [CrossRef]
- Zhao, C.; He, B.; Wang, Y.; Wu, B. Experimental study on the diagnosis of operation state of gas extraction pipeline based on pressure gradient method. Energy Sources Part A Recovery Util. Environ. Eff. 2021, 1–14. [Google Scholar] [CrossRef]
- Cui, C.; Jiang, S.; He, X.; Wang, K.; Shao, H.; Wu, Z. Experimental study on the location of gas drainage pipeline leak using cellular automata. J. Loss Prev. Process Ind. 2018, 56, 68–77. [Google Scholar] [CrossRef]
- da Cruz, R.P.; da Silva, F.V.; Fileti, A.M. Machine learning and acoustic method applied to leak detection and location in low-pressure gas pipelines. Clean Technol. Environ. Policy 2020, 22, 627–638. [Google Scholar] [CrossRef]
- Ullah, N.; Ahmed, Z.; Kim, J.-M. Pipeline Leakage Detection Using Acoustic Emission and Machine Learning Algorithms. Sensors 2023, 23, 3226. [Google Scholar] [CrossRef]
- Lin, R. Research on Oil Pipeline Leakage Detection Method Based on Deep Learning. Master’s Thesis, Dalian University of Technology, Dalian, China, 2022. [Google Scholar]
- Ren, H. Adaptive Control Model of Gas Drainage Parameters in Coal Mine. Master’s Thesis, China University of Mining and Technology, Xuzhou, China, 2021. [Google Scholar]
- Liu, Z. Experimental Research on the Optimizing Operation Methods of Pipe Network of Gas Extraction in Coal Mine. Ph.D. Thesis, China University of Mining and Technology (Beijing), Beijing, China, 2017. [Google Scholar]

Disclaimer/Publisher’s Note: The statements, opinions and data contained in all publications are solely those of the individual author(s) and contributor(s) and not of MDPI and/or the editor(s). MDPI and/or the editor(s) disclaim responsibility for any injury to people or property resulting from any ideas, methods, instructions or products referred to in the content. |
© 2024 by the authors. Licensee MDPI, Basel, Switzerland. This article is an open access article distributed under the terms and conditions of the Creative Commons Attribution (CC BY) license (https://creativecommons.org/licenses/by/4.0/).