
The Determination of LogP of Anticoagulant Drugs with High-Performance Thin-Layer Chromatography


Abstract
:1. Introduction
2. Material and Methods
2.1. Reagents
2.2. The Chromatographic Procedure
2.3. The Calculation of the Data
2.4. The LogPHPTLC Calculation
3. Results
3.1. The Determination of Rm0 of the Analyzed Compounds
3.2. The Results of the Determination of Lipophilicity
4. Discussion
5. Conclusions
Supplementary Materials
Author Contributions
Funding
Data Availability Statement
Conflicts of Interest
References
- Wardecki, D.; Dołowy, M.; Bober-Majnusz, K. Assessment of Lipophilicity Parameters of Antimicrobial and Immunosuppressive Compounds. Molecules 2023, 28, 2820. [Google Scholar] [CrossRef] [PubMed]
- Klimoszek, D.; Jeleń, M.; Dołowy, M.; Morak-Młodawska, B. Study of the Lipophilicity and ADMET Parameters of New Anticancer Diquinothiazines with Pharmacophore Substituents. Pharmaceuticals 2024, 17, 725. [Google Scholar] [CrossRef] [PubMed]
- Ciura, K.; Dziomba, S.; Nowakowska, J.; Markuszewski, M.J. Thin Layer Chromatography in Drug Discovery Process. J. Chromatogr. A 2017, 1520, 9–22. [Google Scholar] [CrossRef] [PubMed]
- Lipinski, C.A.; Lombardo, F.; Dominy, B.W.; Feeney, P.J. Experimental and Computational Approaches to Estimate Solubility and Permeability in Drug Discovery and Development Settings. Adv. Drug Deliv. Rev. 2001, 46, 3–26. [Google Scholar] [CrossRef] [PubMed]
- Benhaim, D.; Grushka, E. Effect of N-Octanol in the Mobile Phase on Lipophilicity Determination by Reversed-Phase High-Performance Liquid Chromatography on a Modified Silica Column. J. Chromatogr. A 2008, 1209, 111–119. [Google Scholar] [CrossRef] [PubMed]
- Lombardo, F.; Shalaeva, M.Y.; Tupper, K.A.; Gao, F.; Abraham, M.H. ElogPoct: A Tool for Lipophilicity Determination in Drug Discovery. J. Med. Chem. 2000, 43, 2922–2928. [Google Scholar] [CrossRef] [PubMed]
- Nycz-Empel, A.; Bober, K.; Wyszomirski, M.; Kisiel, E.; Zięba, A. The Application of CA and PCA to the Evaluation of Lipophilicity and Physicochemical Properties of Tetracyclic Diazaphenothiazine Derivatives. J. Anal. Methods Chem. 2019, 2019, 8131235. [Google Scholar] [CrossRef] [PubMed]
- Jóźwiak, K.; Szumiło, H.; Soczewiński, E. Lipofilowość, Metody Wyznaczania i Rola w Działaniu Biologicznym Substancji Chemicznych (Lipophilicity, methods of determination and its role in biological effect of chemical substances). Wiadomości Chem. 2001, 55, 1047–1074. [Google Scholar]
- Patel, S.; Singh, R.; Preuss, C.V.; Patel, N. Warfarin. In StatPearls; StatPearls Publishing: Treasure Island, FL, USA, 2023. [Google Scholar]
- Han, H.; Hyun, C. Acenocoumarol, an Anticoagulant Drug, Prevents Melanogenesis in B16F10 Melanoma Cells. Pharmaceuticals 2023, 16, 604. [Google Scholar] [CrossRef]
- Beavers, C.J.; Naqvi, I.A. Clopidogrel. In StatPearls; StatPearls Publishing: Treasure Island, FL, USA, 2023. [Google Scholar]
- Olivier, C.B.; Diehl, P.; Schnabel, K.; Weik, P.; Zhou, Q.; Bode, C.; Moser, M. Third Generation P2Y12 Antagonists Inhibit Platelet Aggregation More Effectively than Clopidogrel in a Myocardial Infarction Registry. Thromb. Haemost. 2014, 111, 266–272. [Google Scholar] [CrossRef]
- Karaźniewicz-Łada, M.; Danielak, D.; Burchardt, P.; Kruszyna, L.; Komosa, A.; Lesiak, M.; Główka, F. Clinical Pharmacokinetics of Clopidogrel and Its Metabolites in Patients with Cardiovascular Diseases. Clin. Pharmacokinet. 2014, 53, 155–164. [Google Scholar] [CrossRef]
- Girreser, U.; Czyrski, A.; Hermann, T.W. Synthesis and Structure Elucidation of a New Isoquinolinium Inner Salt. Tetrahedron Lett. 2009, 50, 4610–4612. [Google Scholar] [CrossRef]
- Czyrski, A.; Hermann, T.; Rubiś, B.; Rybczyńska, M.; Sledź, D. Biopharmaceutical Characterization of Some New Papaverine Decomposition Products. Pharmazie 2011, 66, 165–167. [Google Scholar]
- Czeszak, A.; Resztak, M.; Czyrski, A.; Nowak, I. Determination of Partition Coefficient of Isoquinoline Alkaloids from Chelidonium Majus by Reversed Phase Thin Layer Chromatography. New J. Chem. 2020, 44, 7484–7489. [Google Scholar] [CrossRef]
- Kempińska, D.; Chmiel, T.; Kot-Wasik, A.; Mróz, A.; Mazerska, Z.; Namieśnik, J. State of the Art and Prospects of Methods for Determination of Lipophilicity of Chemical Compounds. TrAC Trends Anal. Chem. 2019, 113, 54–73. [Google Scholar] [CrossRef]
- Martin, Y.C. Exploring QSAR: Hydrophobic, Electronic, and Steric Constants C. Hansch, A. Leo, and D. Hoekman. American Chemical Society, Washington, DC. 1995. Xix + 348 Pp. 22 × 28.5 Cm. Exploring QSAR: Fundamentals and Applications in Chemistry and Biology. C. Hansch and A. Leo. American Chemical Society, Washington, DC. 1995. Xvii + 557 Pp. 18.5 × 26 Cm. ISBN 0-8412-2993-7 (Set). $99.95 (Set). J. Med. Chem. 1996, 39, 1189–1190. [Google Scholar] [CrossRef]
- Available online: www.vcclab.org/lab/alogps/start.html (accessed on 4 March 2024).
- Remko, M.; Broer, R.; Remková, A. A Comparative Study of the Molecular Structure, Lipophilicity, Solubility, Acidity, Absorption and Polar Surface Area of Coumarinic Anticoagulants and Direct Thrombin Inhibitors. RSC Adv. 2014, 4, 8072–8084. [Google Scholar] [CrossRef]
- Remko, M.; Remková, A.; Broer, R. A Comparative Study of Molecular Structure, pKa, Lipophilicity, Solubility, Absorption and Polar Surface Area of Some Antiplatelet Drugs. Int. J. Mol. Sci. 2016, 17, 388. [Google Scholar] [CrossRef] [PubMed]
- Available online: https://www.molinspiration.com/cgi/properties (accessed on 7 March 2024).
- Available online: https://go.drugbank.com/ (accessed on 27 March 2024).
- Czyrski, A.; Kupczyk, B. The Determination of Partition Coefficient of 6-Mercaptopurine Derivatives by Thin Layer Chromatography. Available online: https://www.hindawi.com/journals/jchem/2013/419194/ (accessed on 11 September 2018).
- Pyka, A.; Babuśka, M.; Zachariasz, M. A Comparison of Theoretical Methods of Calculation of Partition Coefficients for Selected Drugs. Acta Pol. Pharm. 2006, 63, 159–167. [Google Scholar]
- Mannhold, R.; Poda, G.I.; Ostermann, C.; Tetko, I.V. Calculation of Molecular Lipophilicity: State-of-the-Art and Comparison of Log P Methods on More than 96,000 Compounds. J. Pharm. Sci. 2009, 98, 861–893. [Google Scholar] [CrossRef]
- Available online: https://docs.chemaxon.com/display/docs/logp-plugin.md (accessed on 7 March 2024).
- Główka, F.K.; Romański, M.; Siemiątkowska, A. Determination of Partition Coefficients N-Octanol/Water for Treosulfan and Its Epoxy-Transformers: An Example of a Negative Correlation between Lipophilicity of Unionized Compounds and Their Retention in Reversed-Phase Chromatography. J. Chromatogr. B Anal. Technol. Biomed Life Sci. 2013, 923–924, 92–97. [Google Scholar] [CrossRef] [PubMed]
- Tetko, I.V.; Tanchuk, V.Y.; Villa, A.E. Prediction of N-Octanol/Water Partition Coefficients from PHYSPROP Database Using Artificial Neural Networks and E-State Indices. J. Chem. Inf. Comput. Sci. 2001, 41, 1407–1421. [Google Scholar] [CrossRef] [PubMed]
- Morak-Młodawska, B.; Jeleń, M.; Martula, E.; Korlacki, R. Study of Lipophilicity and ADME Properties of 1,9-Diazaphenothiazines with Anticancer Action. Int. J. Mol. Sci. 2023, 24, 6970. [Google Scholar] [CrossRef] [PubMed]


| Compound | Rm0 ± SD | logP [15,18] |
|---|---|---|
| Isatin | 0.89 ± 0.03 | 0.83 |
| 2,6-dichloroaniline | 2.06 ± 0.04 | 2.82 |
| p-nitrophenol | 1.30 ± 0.04 | 1.38 |
| 3,4-dichloroaniline | 1.82 ± 0.05 | 2.69 |
| N-(2,4-dichlorophenyl) acetamide | 1.53 ± 0.06 | 2.18 |
| 2,3,9,10-tetramethoxy-12-oxo-12H-indolo[2,1-a] isoquinoline chloride | 2.40 ± 0.04 | 3.28 |
| Compound | Rm0 ± SD |
|---|---|
| Warfarin | 2.26 ± 0.09 |
| Acenocoumarol | 2.20 ± 0.08 |
| Clopidogrel | 2.15 ± 0.07 |
| Prasugrel | 1.36 ± 0.01 |
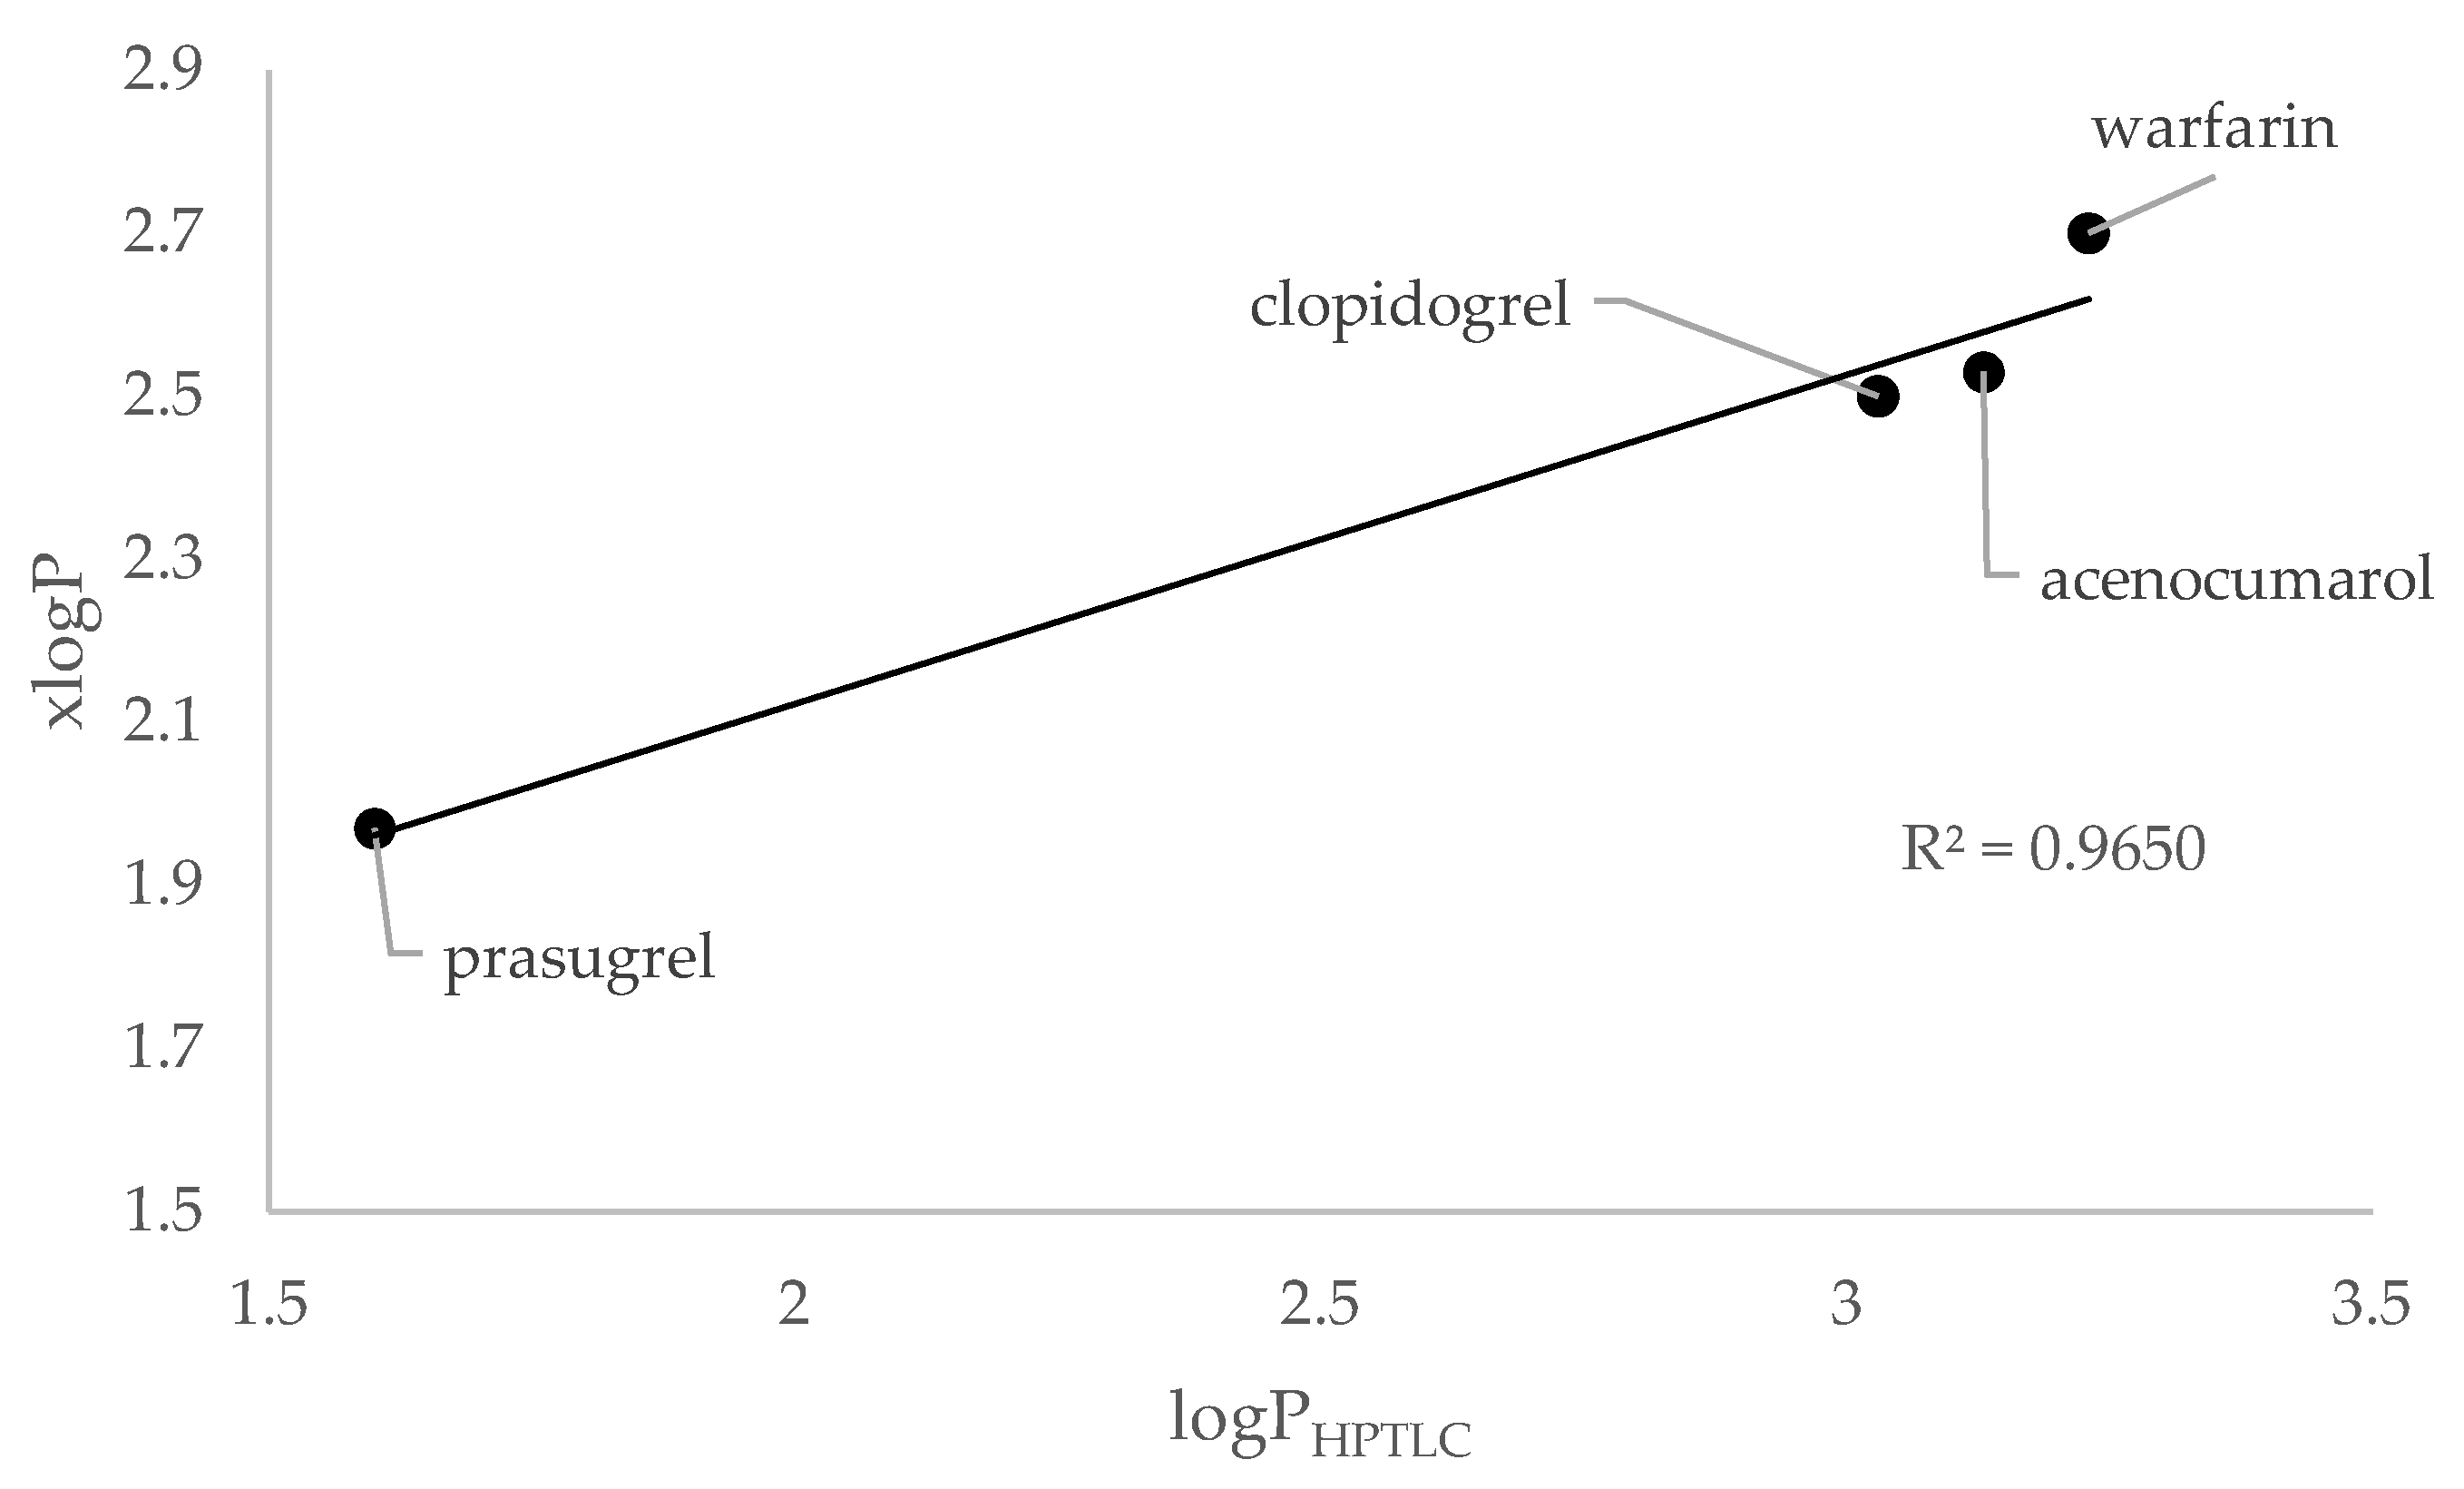
| Compound | LogPHPTLC | ALOGPs a | xlogP (clogP) | miLogP d | Chemaxon e |
|---|---|---|---|---|---|
| Warfarin | 3.23 | 2.41 | 2.70 b | 3.03 | 2.74 |
| Acenocoumarol | 3.13 | 2.53 | 2.53 b | 2.99 | 2.68 |
| Clopidogrel | 3.03 | 3.84 | 2.50 c | 3.60 | 4.03 |
| Prasugrel | 1.60 | 3.67 | 1.97 c | 3.61 | 4.31 |
Disclaimer/Publisher’s Note: The statements, opinions and data contained in all publications are solely those of the individual author(s) and contributor(s) and not of MDPI and/or the editor(s). MDPI and/or the editor(s) disclaim responsibility for any injury to people or property resulting from any ideas, methods, instructions or products referred to in the content. |
© 2024 by the authors. Licensee MDPI, Basel, Switzerland. This article is an open access article distributed under the terms and conditions of the Creative Commons Attribution (CC BY) license (https://creativecommons.org/licenses/by/4.0/).
Share and Cite
Resztak, M.; Czyrski, A. The Determination of LogP of Anticoagulant Drugs with High-Performance Thin-Layer Chromatography. Processes 2024, 12, 1599. https://doi.org/10.3390/pr12081599
Resztak M, Czyrski A. The Determination of LogP of Anticoagulant Drugs with High-Performance Thin-Layer Chromatography. Processes. 2024; 12(8):1599. https://doi.org/10.3390/pr12081599
Chicago/Turabian StyleResztak, Matylda, and Andrzej Czyrski. 2024. "The Determination of LogP of Anticoagulant Drugs with High-Performance Thin-Layer Chromatography" Processes 12, no. 8: 1599. https://doi.org/10.3390/pr12081599