
Reservoir Body Development Characteristics in Deep Carbonate Gas Reservoirs: A Case Study of the Fourth Member of the Dengying Formation, Anyue Gas Field
 , ,
, ,
Abstract
:1. Introduction
2. Methodology
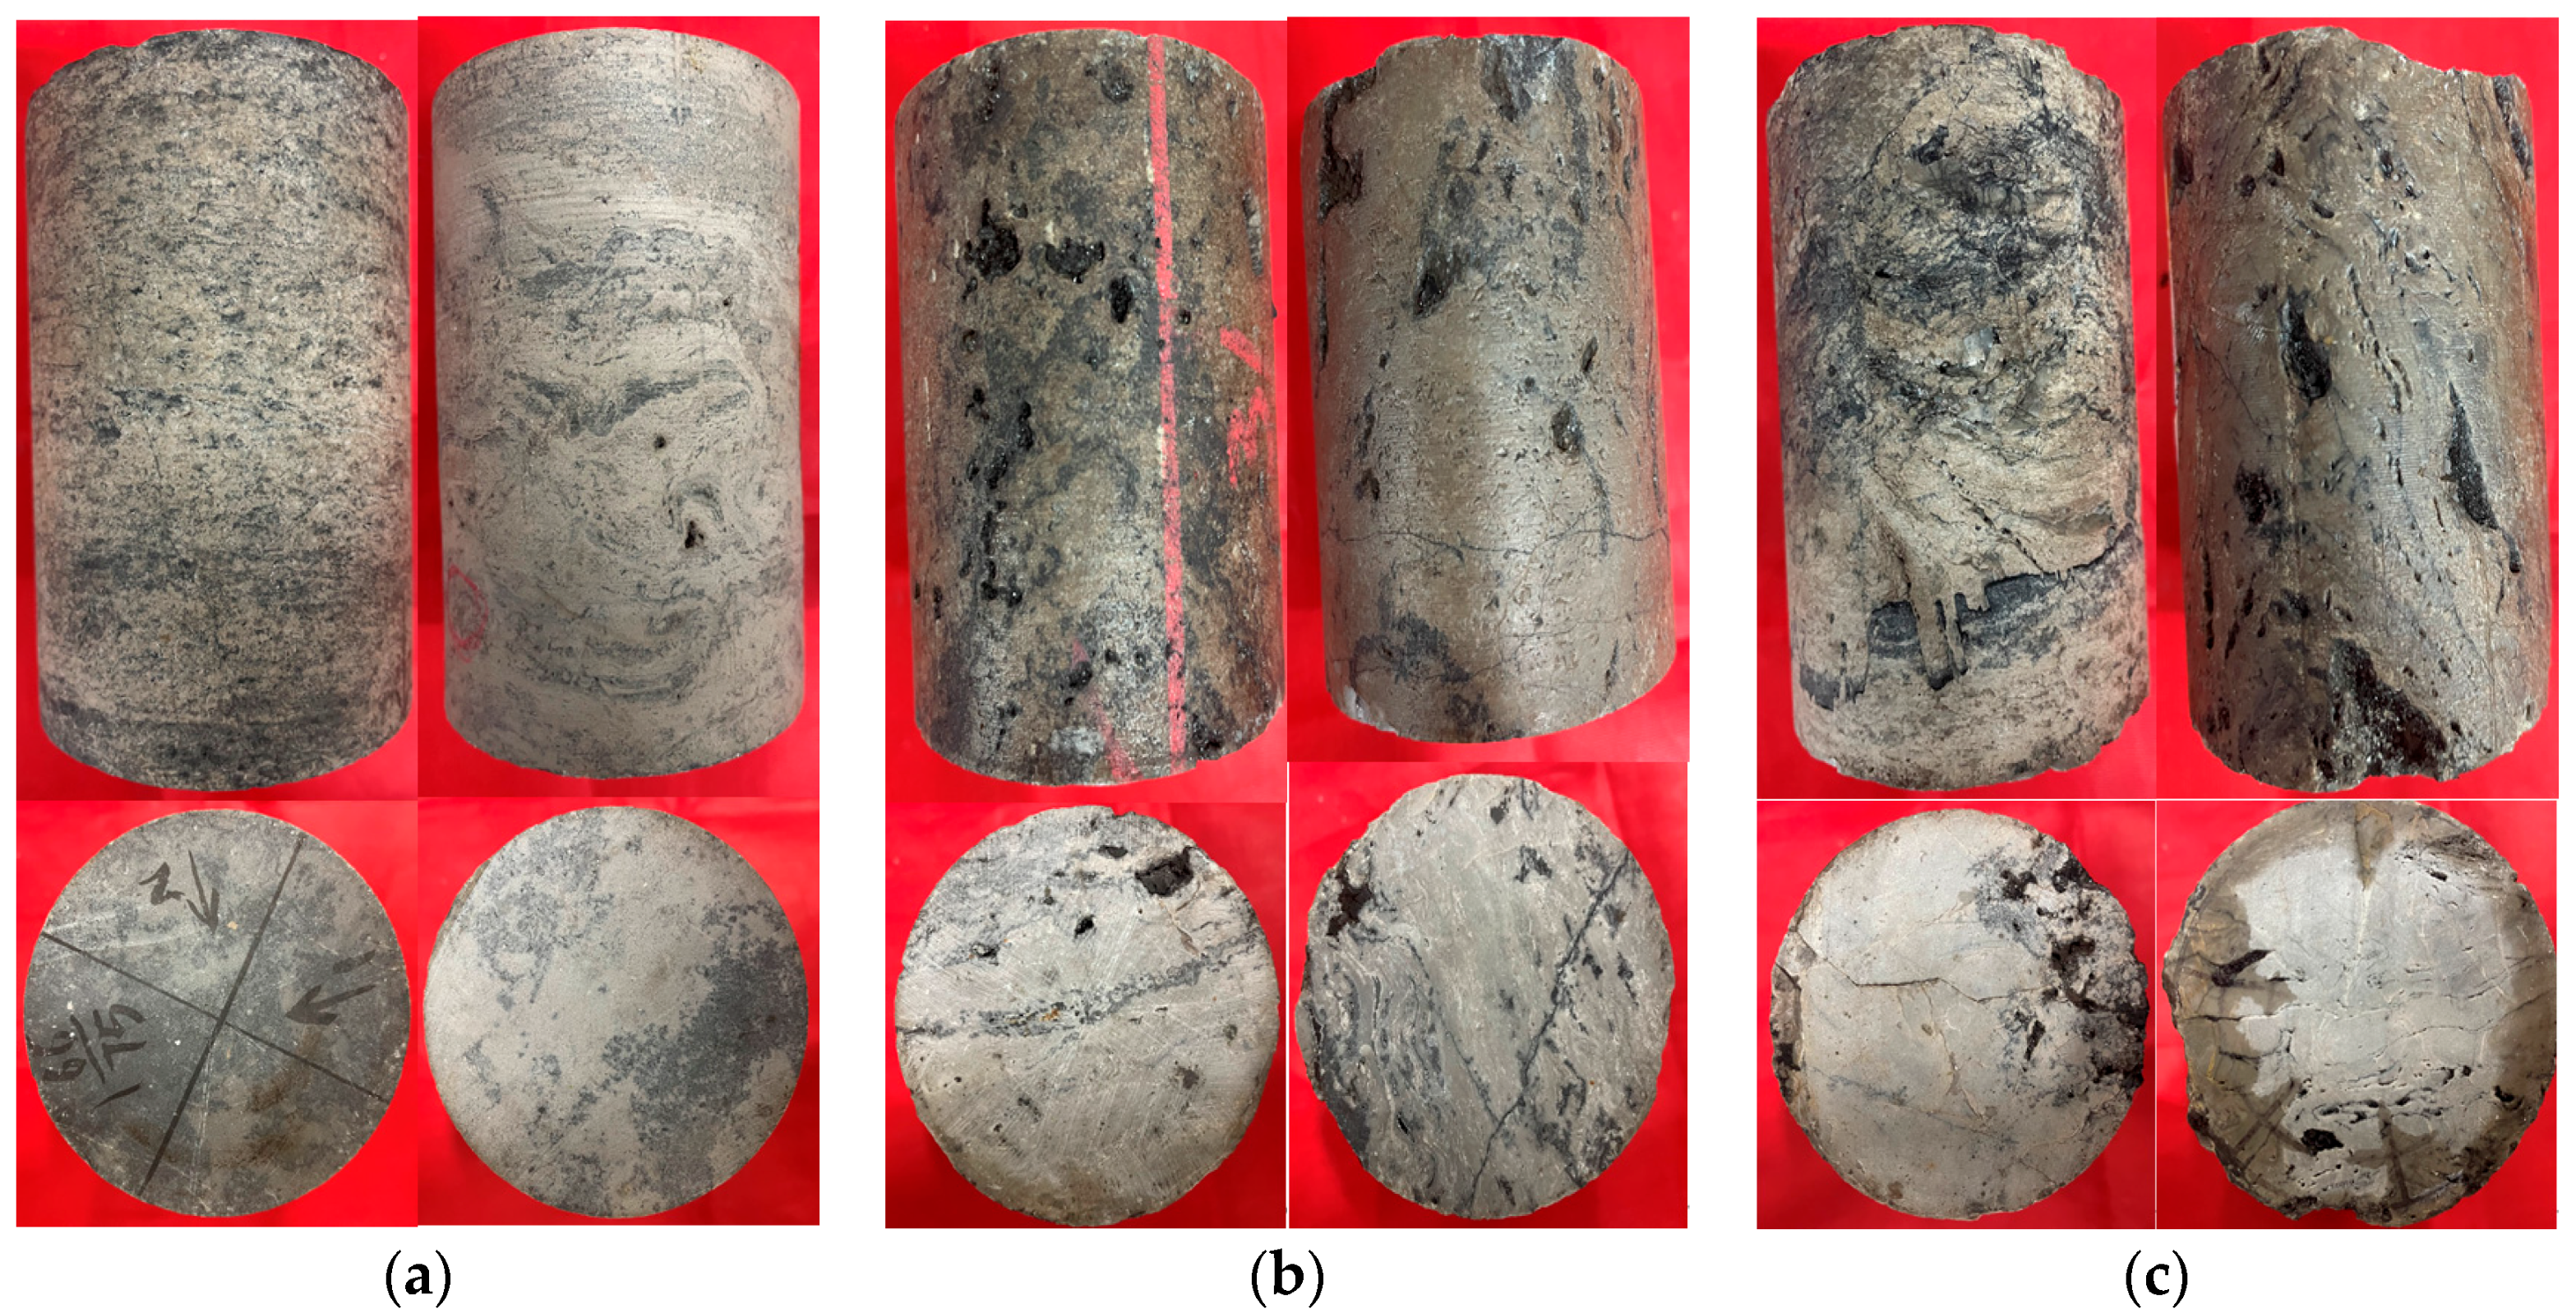
2.1. Material
2.2. Casting Thin Sections
2.3. CT Methods
2.3.1. CT Principles
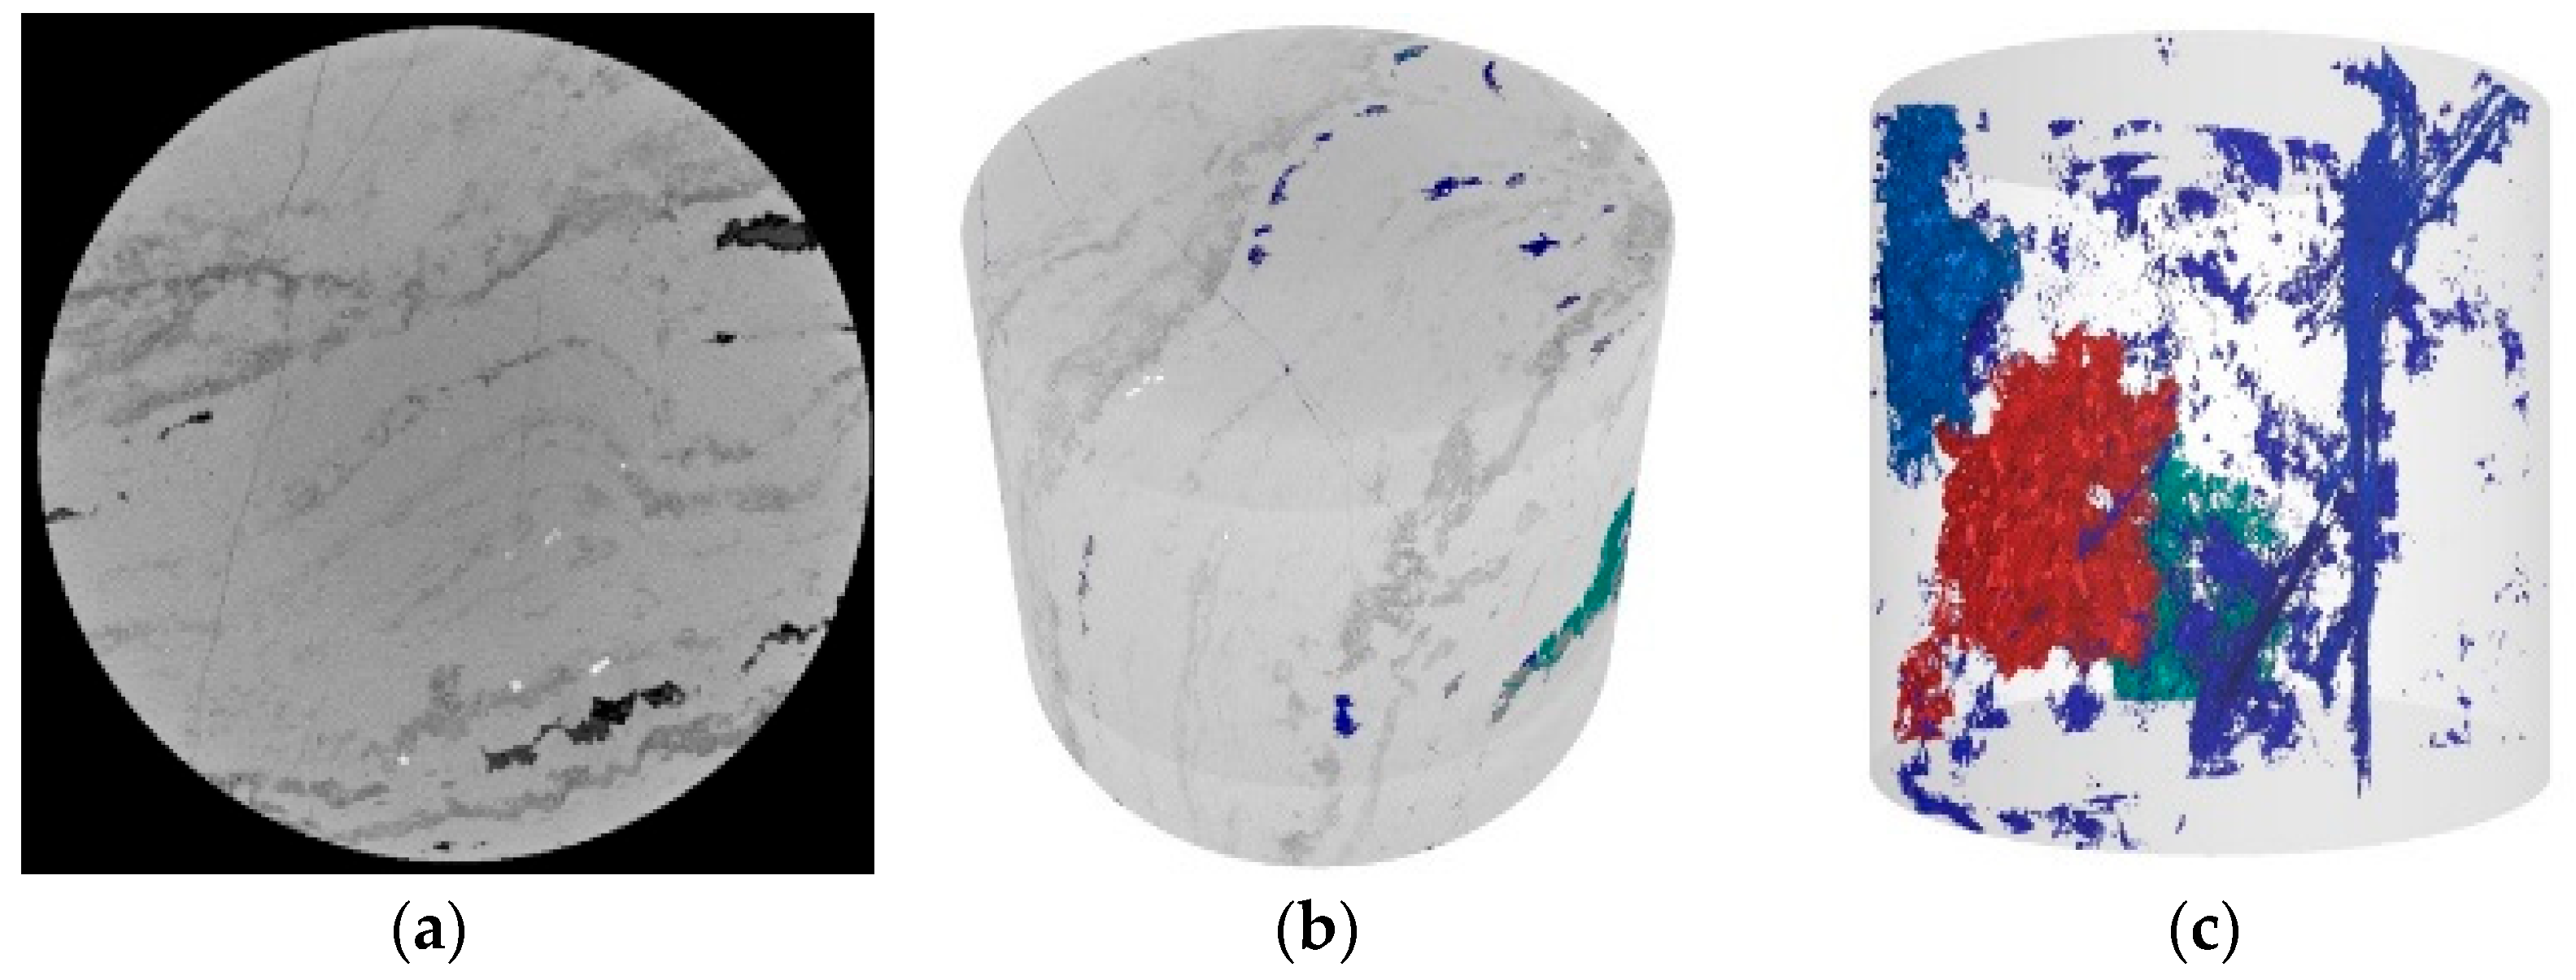
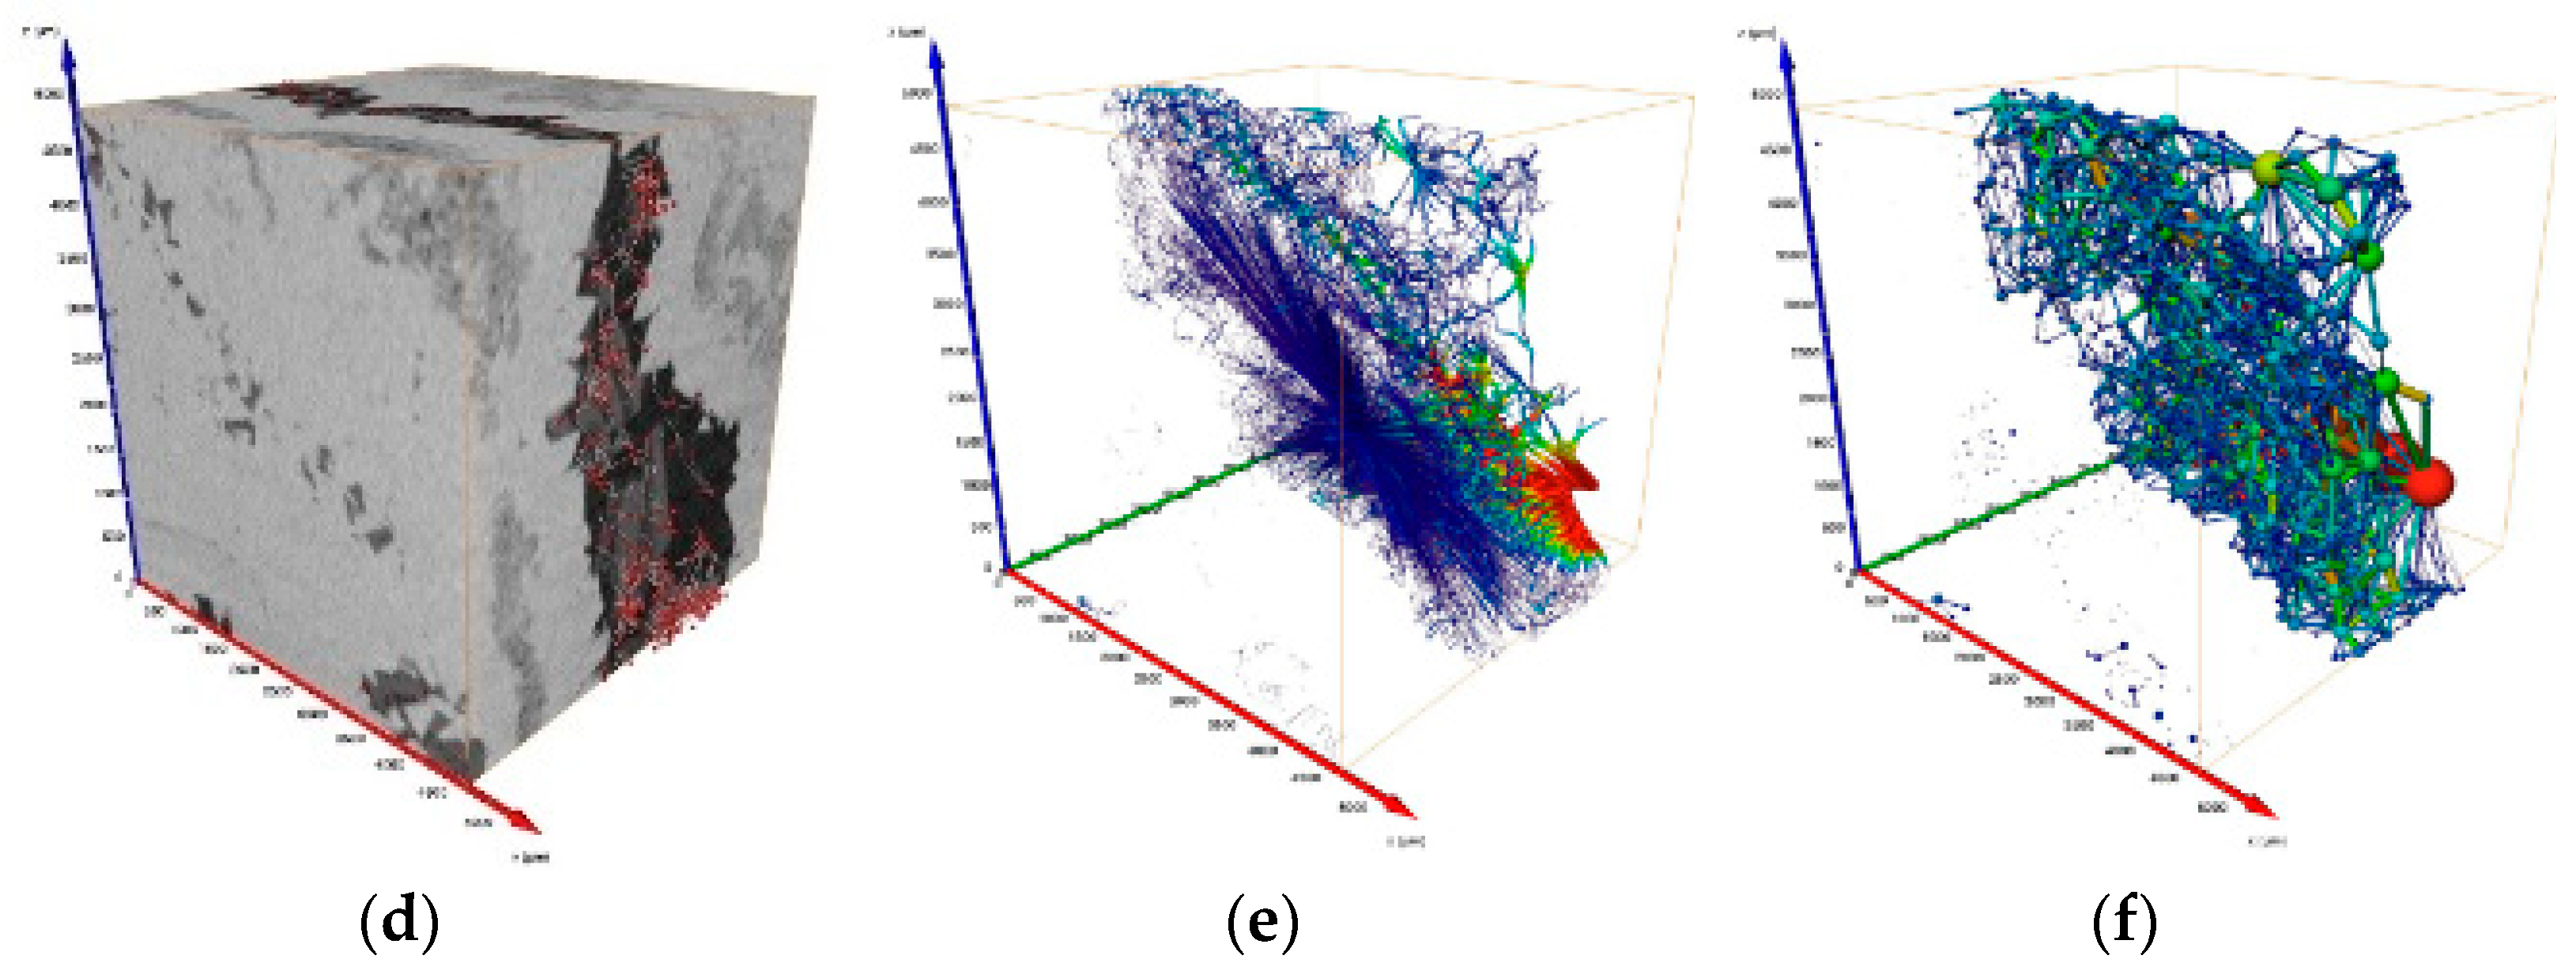
2.3.2. Three-Dimensional Pore–Throat Structure Model
2.4. NMR Methods
2.4.1. NMR Principles
2.4.2. NMR Test under Different Centrifugal Forces
3. Pore–Throat Structure Characteristics of Deep Carbonate Reservoirs
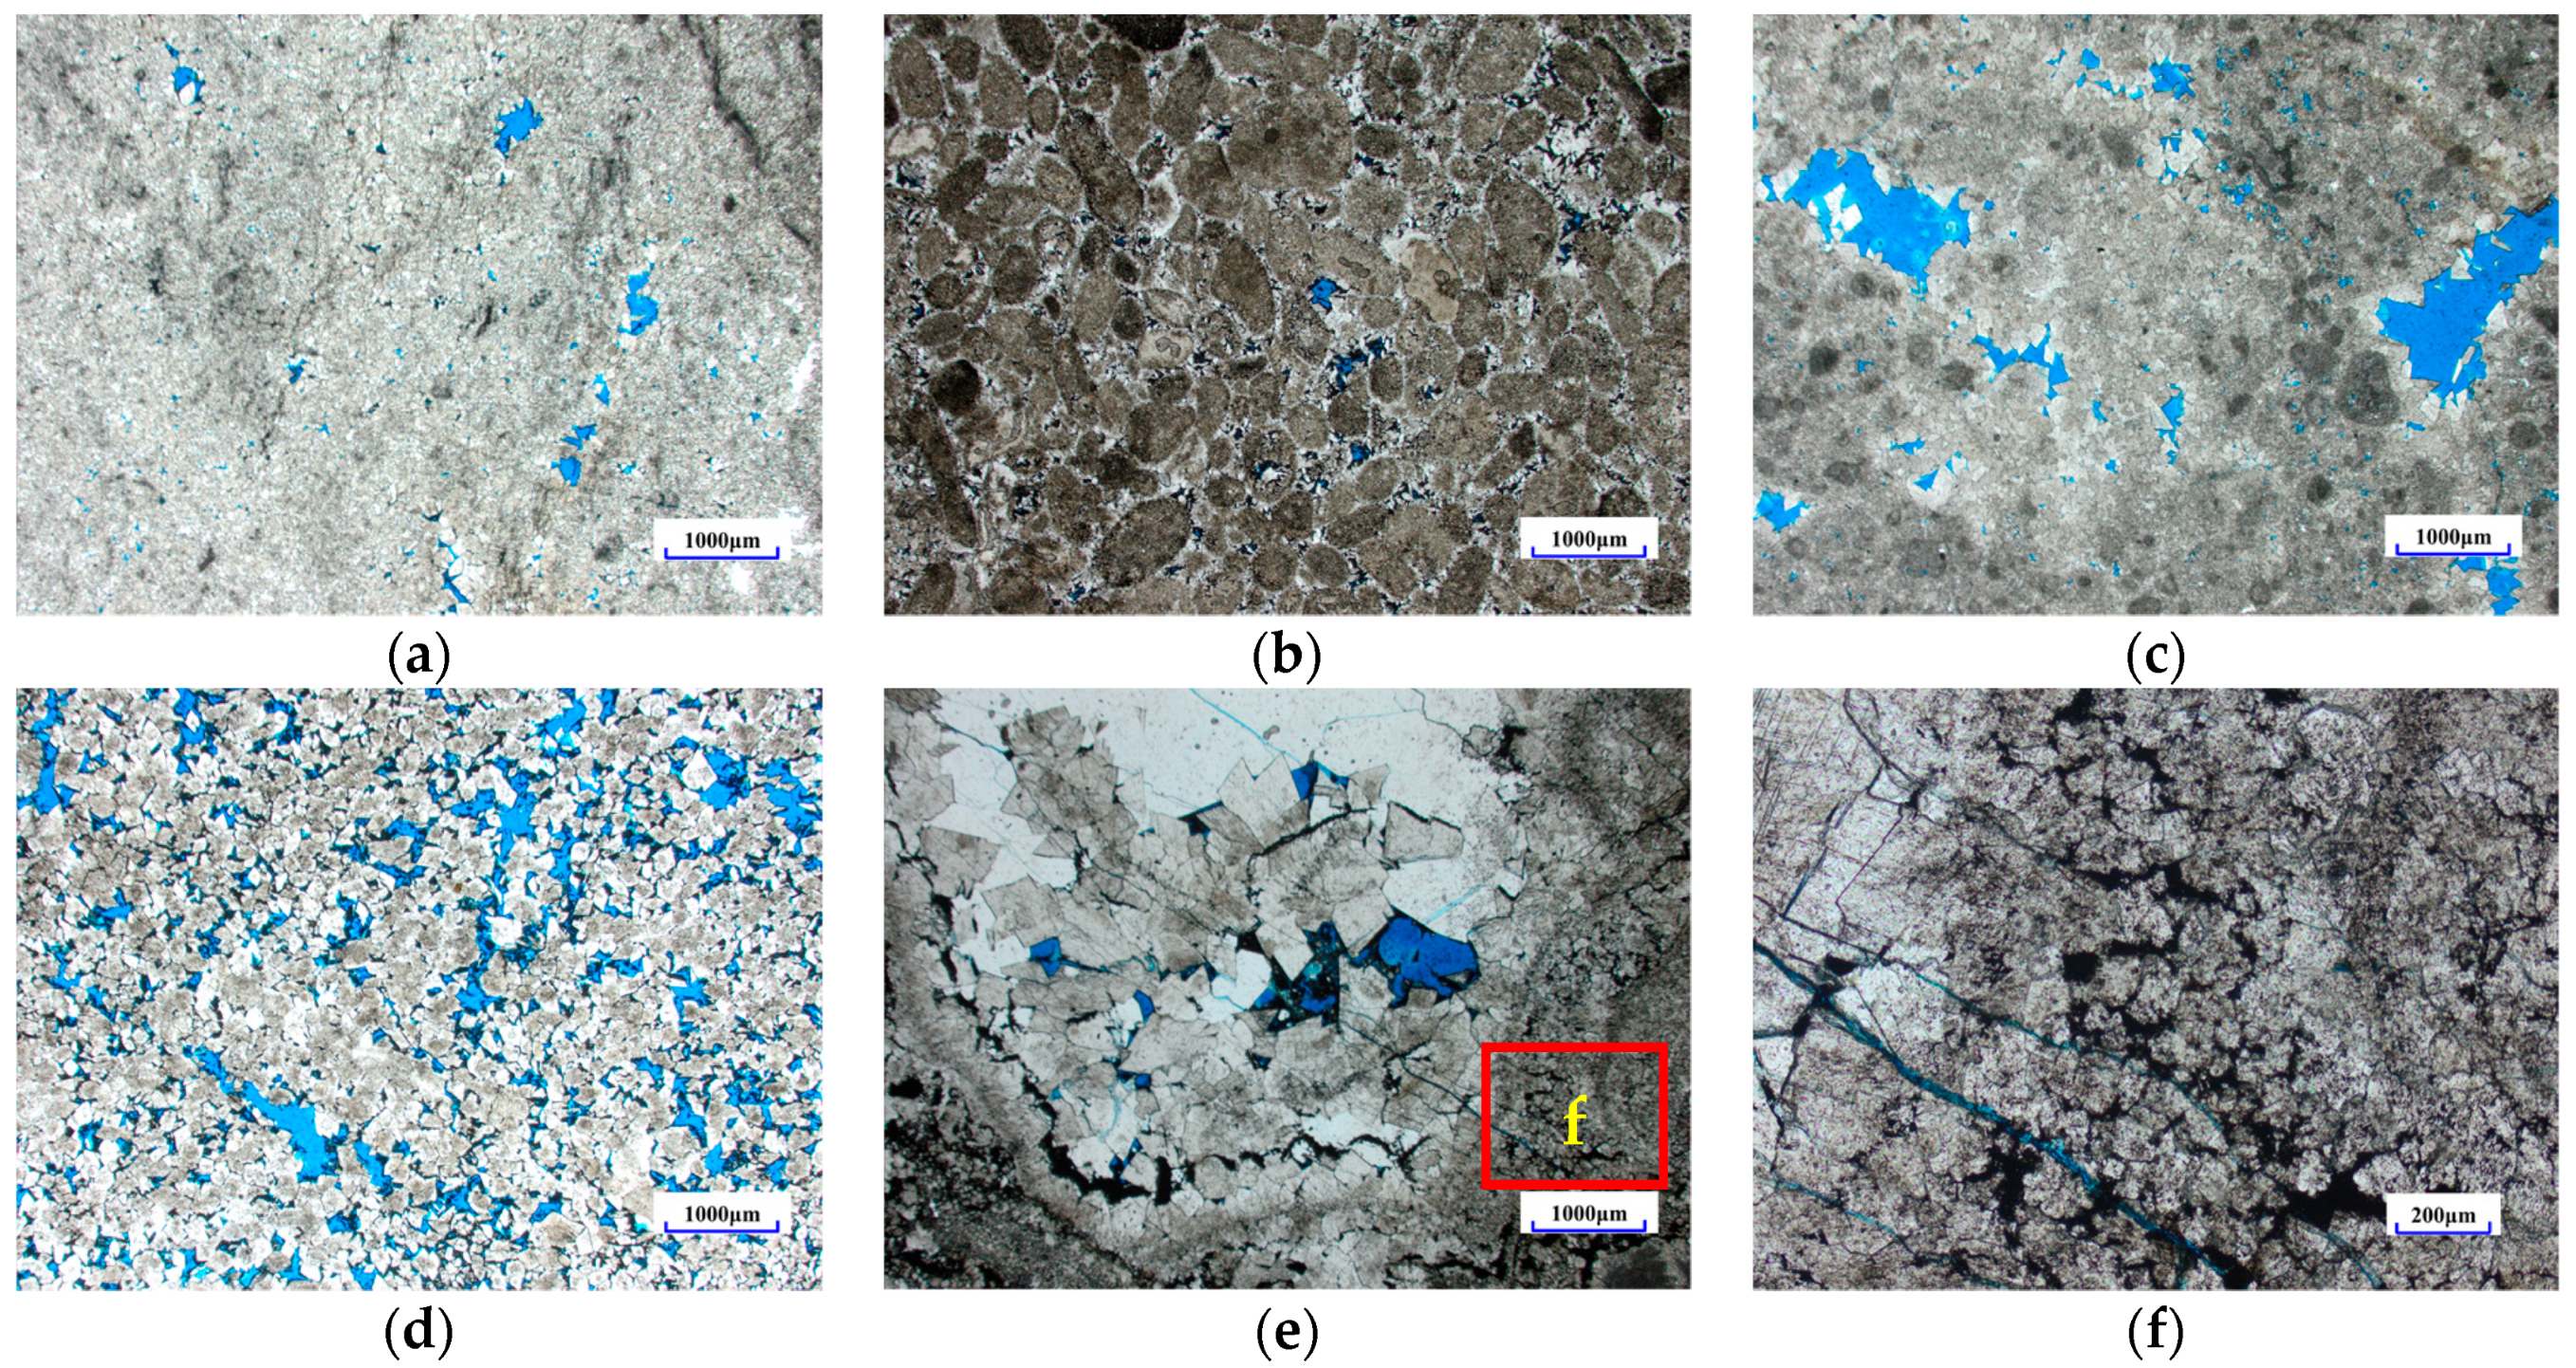
3.1. Observation of Natural Core
3.2. Observation of Casting Thin Sections
4. Characteristics of Cross-Scale Pore–Throat Development in Deep Carbonate Reservoirs
5. Storage Capacity and Seepage Capacity of Deep Carbonate Reservoirs
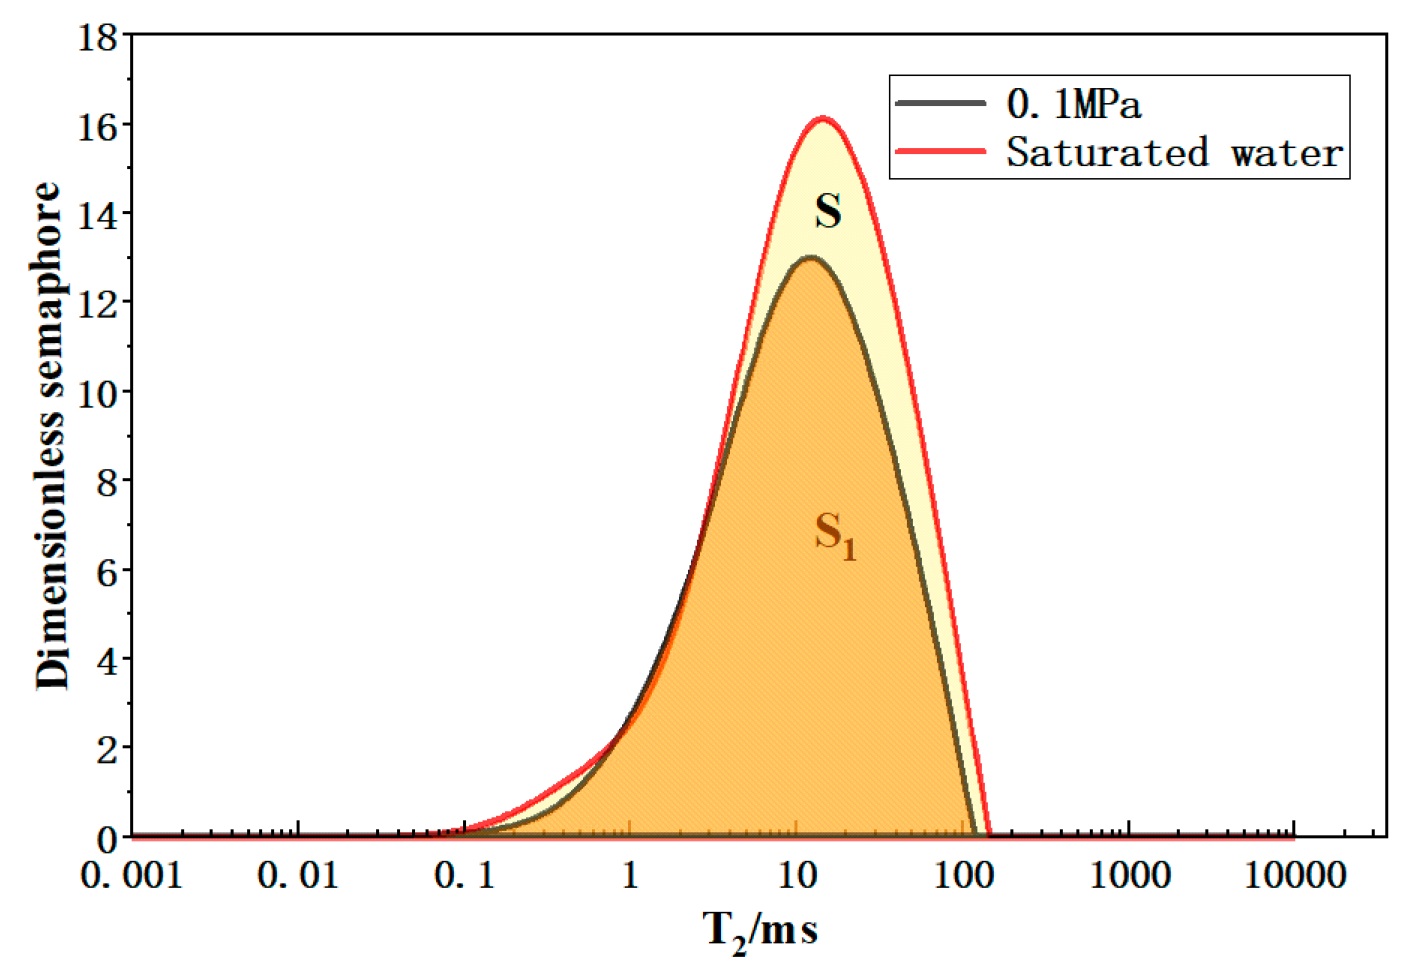
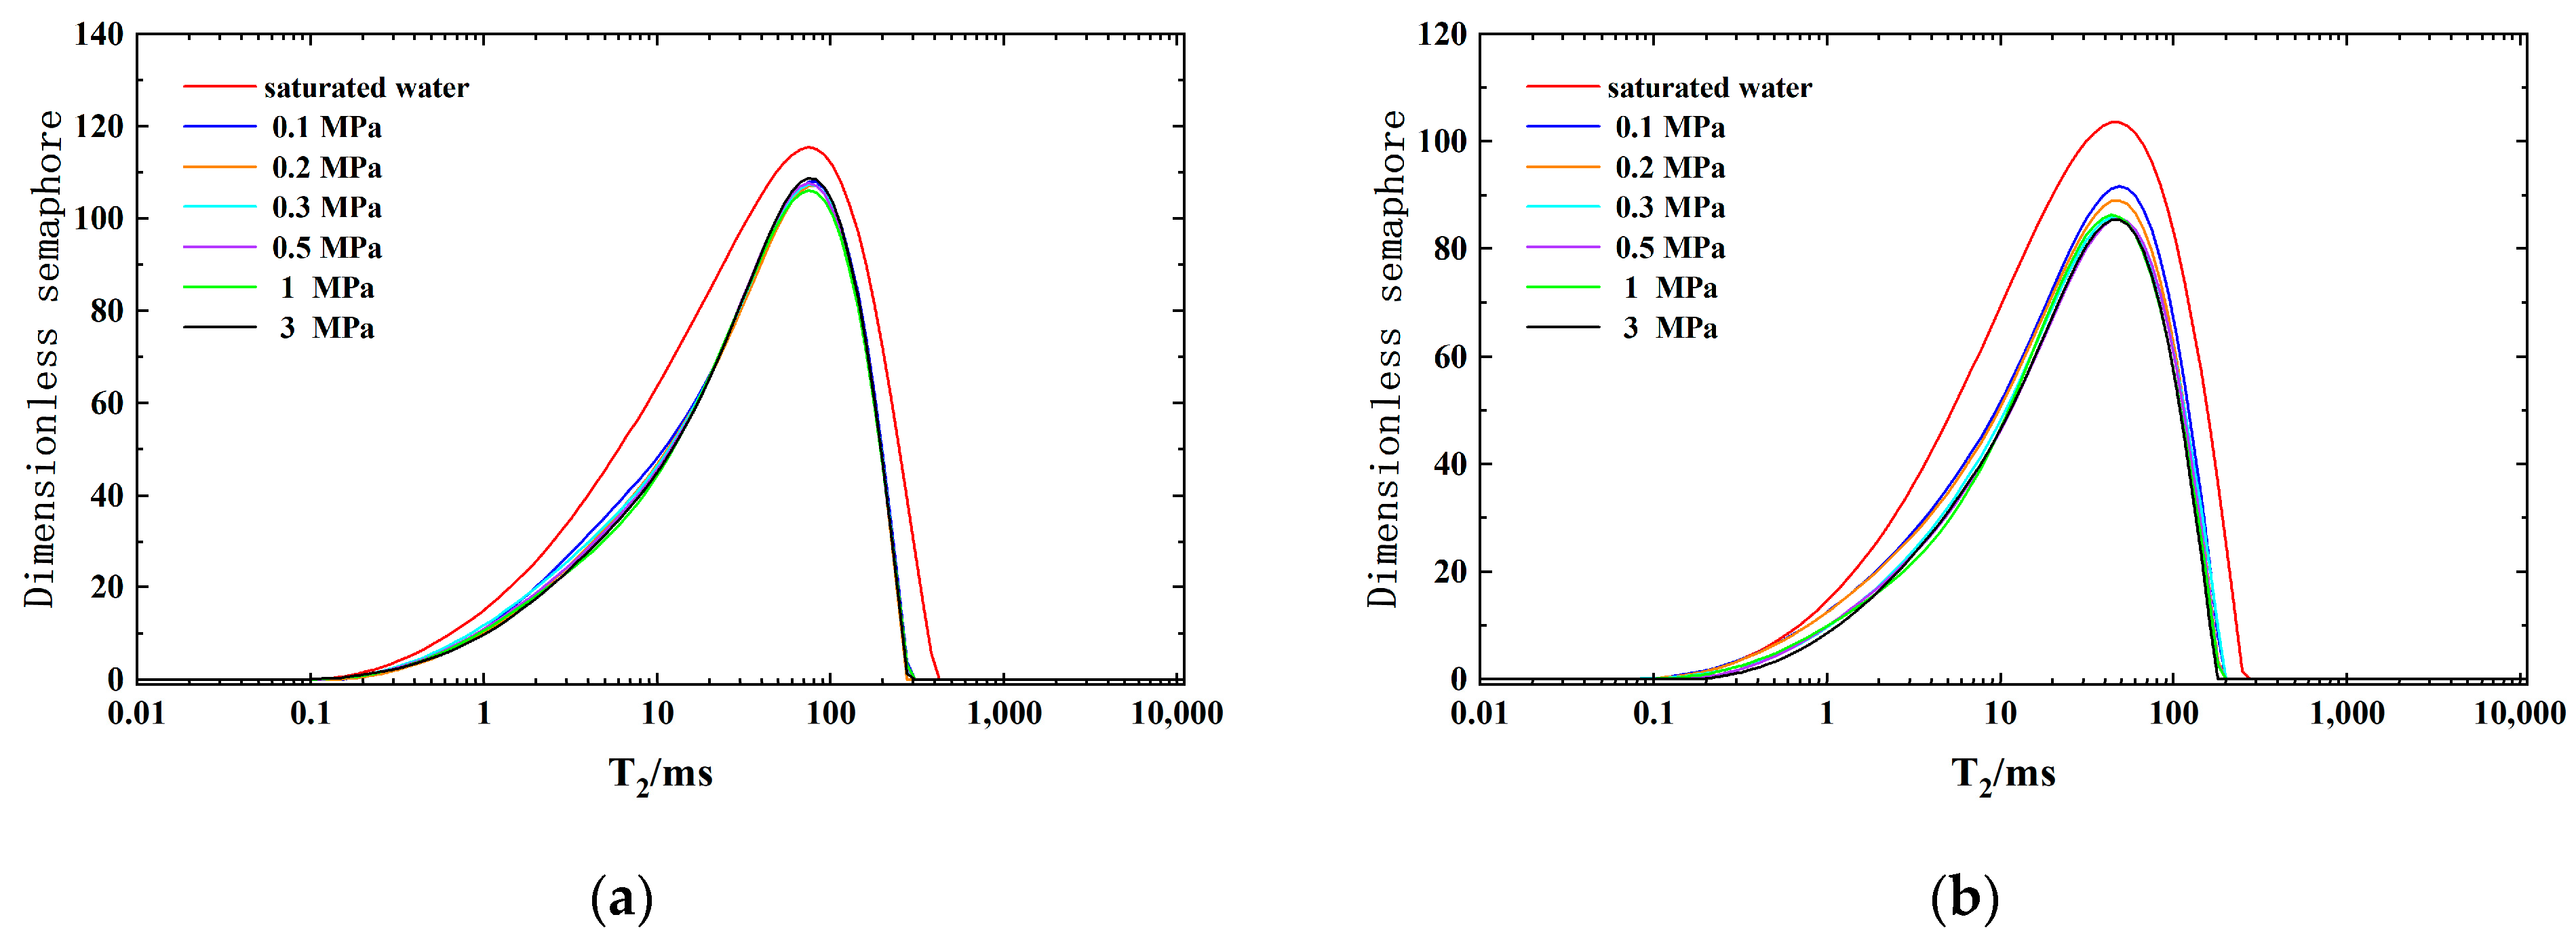
5.1. Analysis of Pore–Type Core Spectrum Characteristics
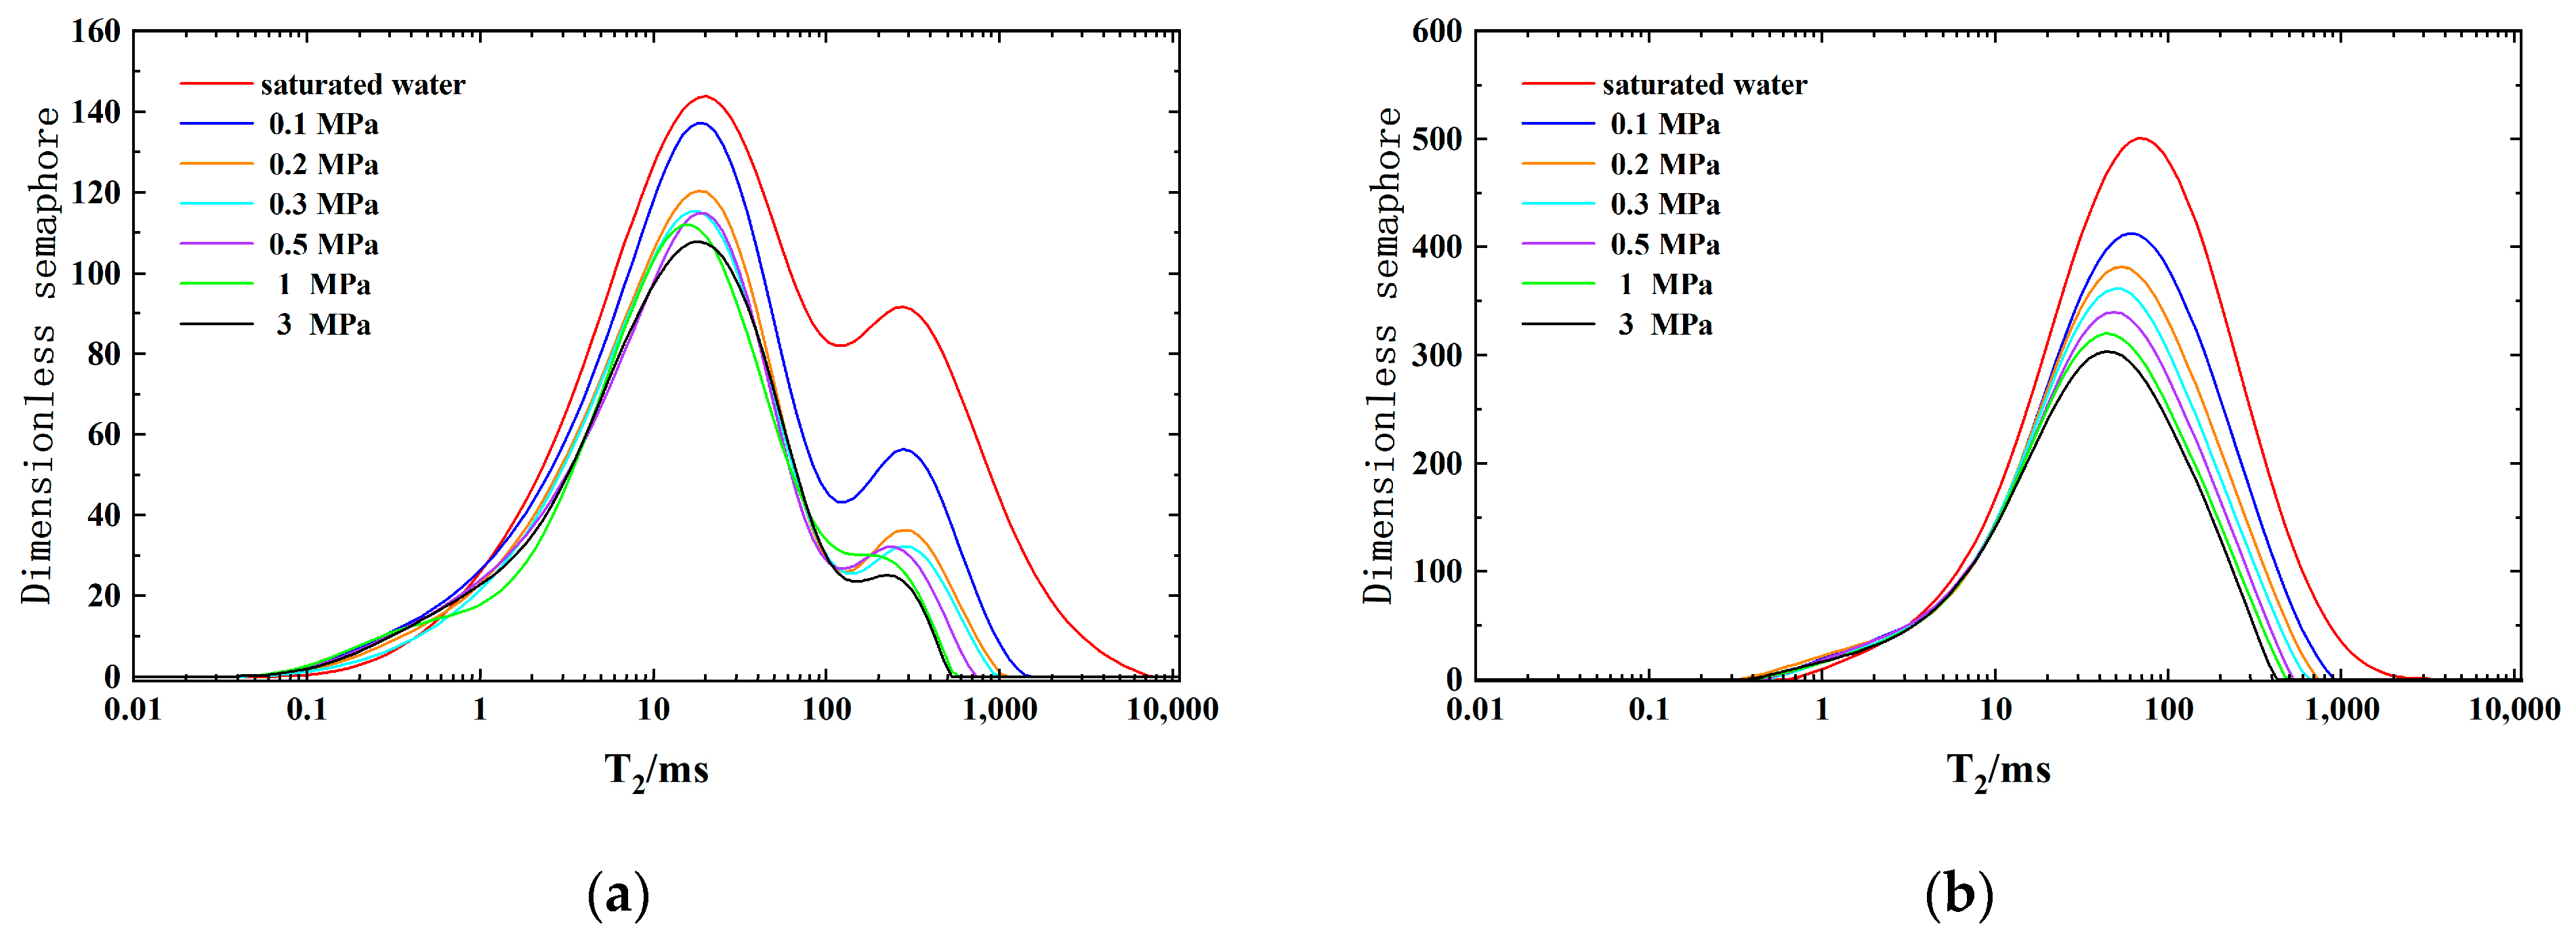
5.2. Analysis of Cavity–Type Core Spectrum Characteristics
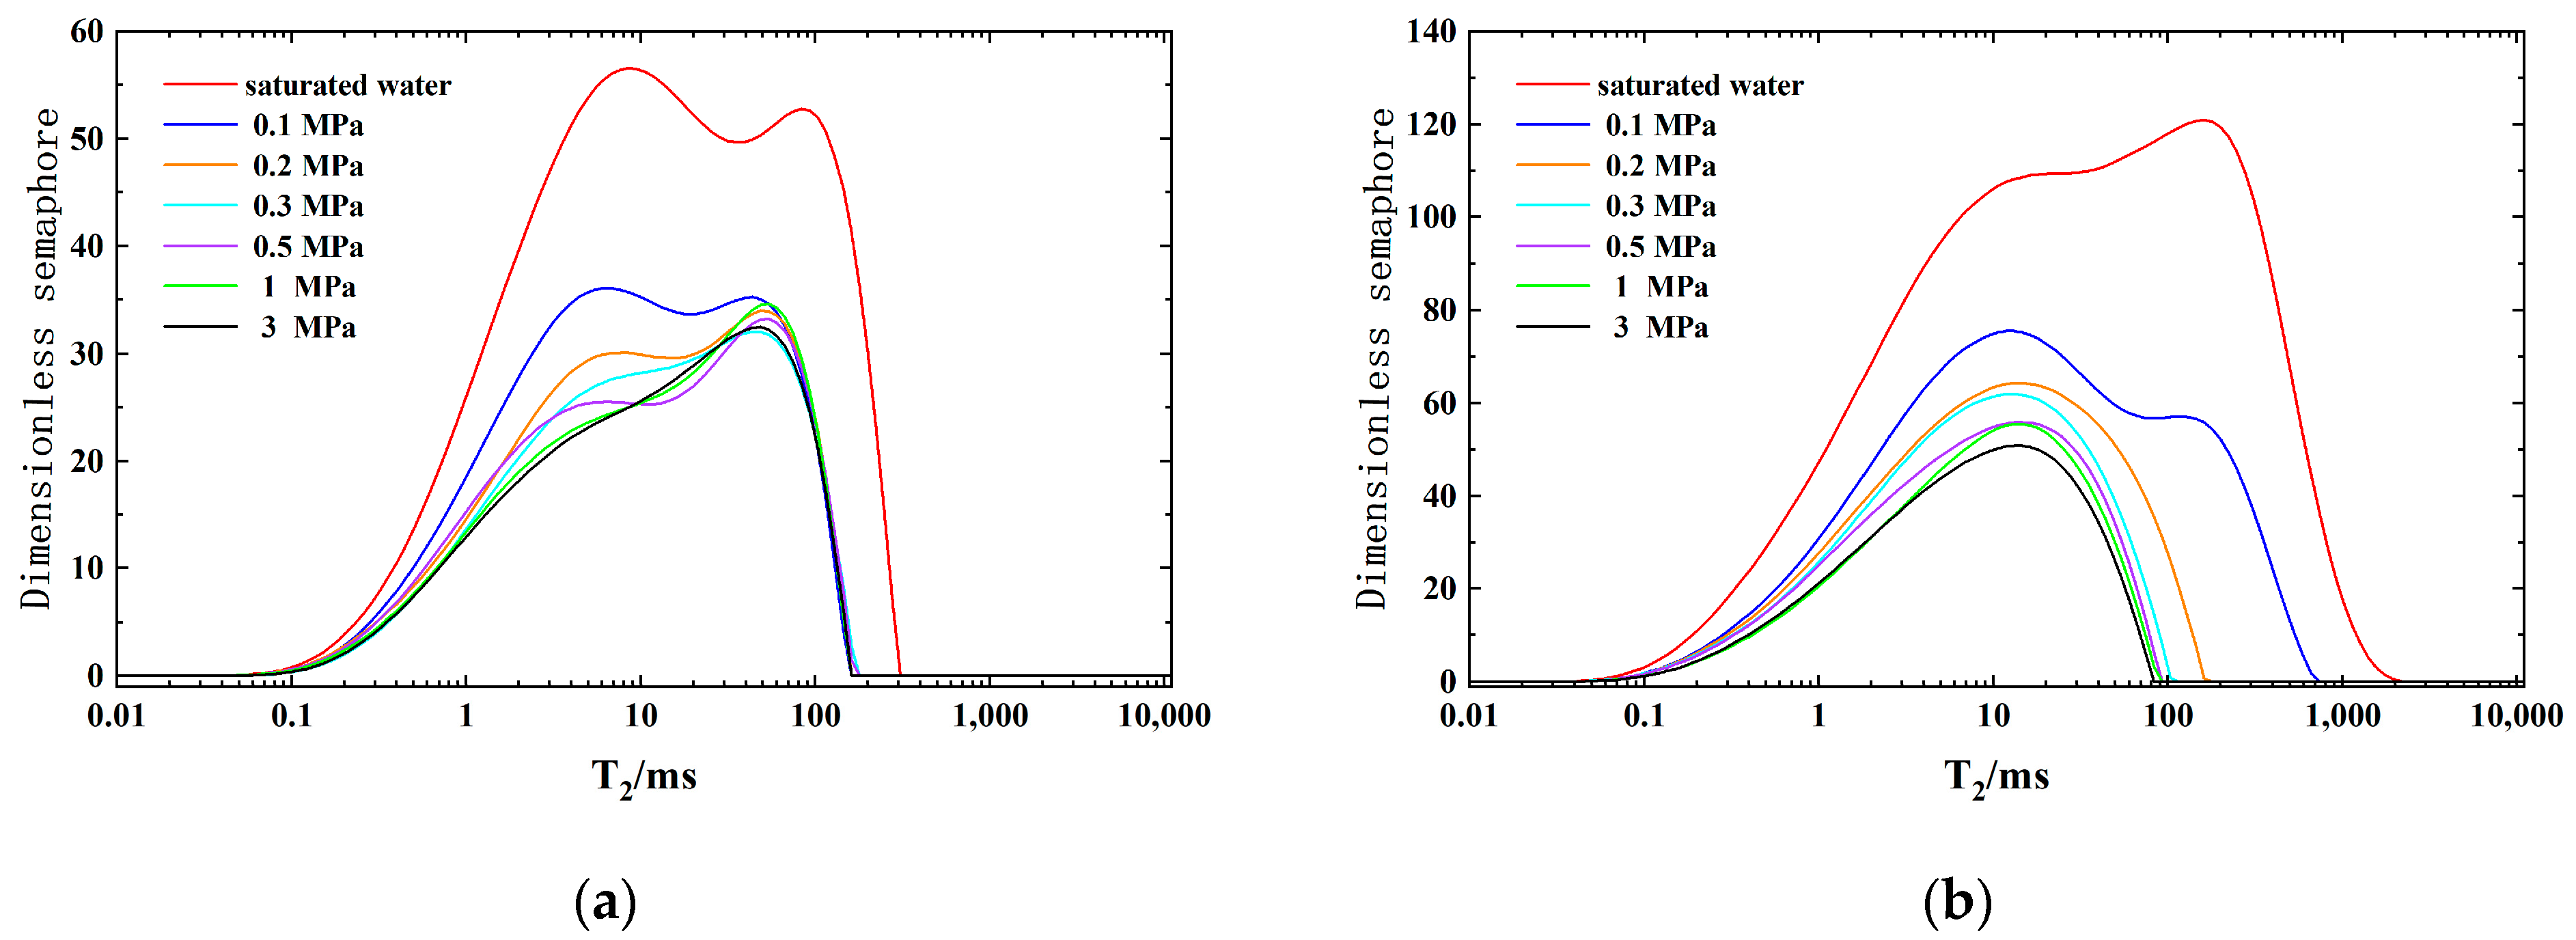
5.3. Analysis of Fracture–Cavity–Type Core Spectrum Characteristics
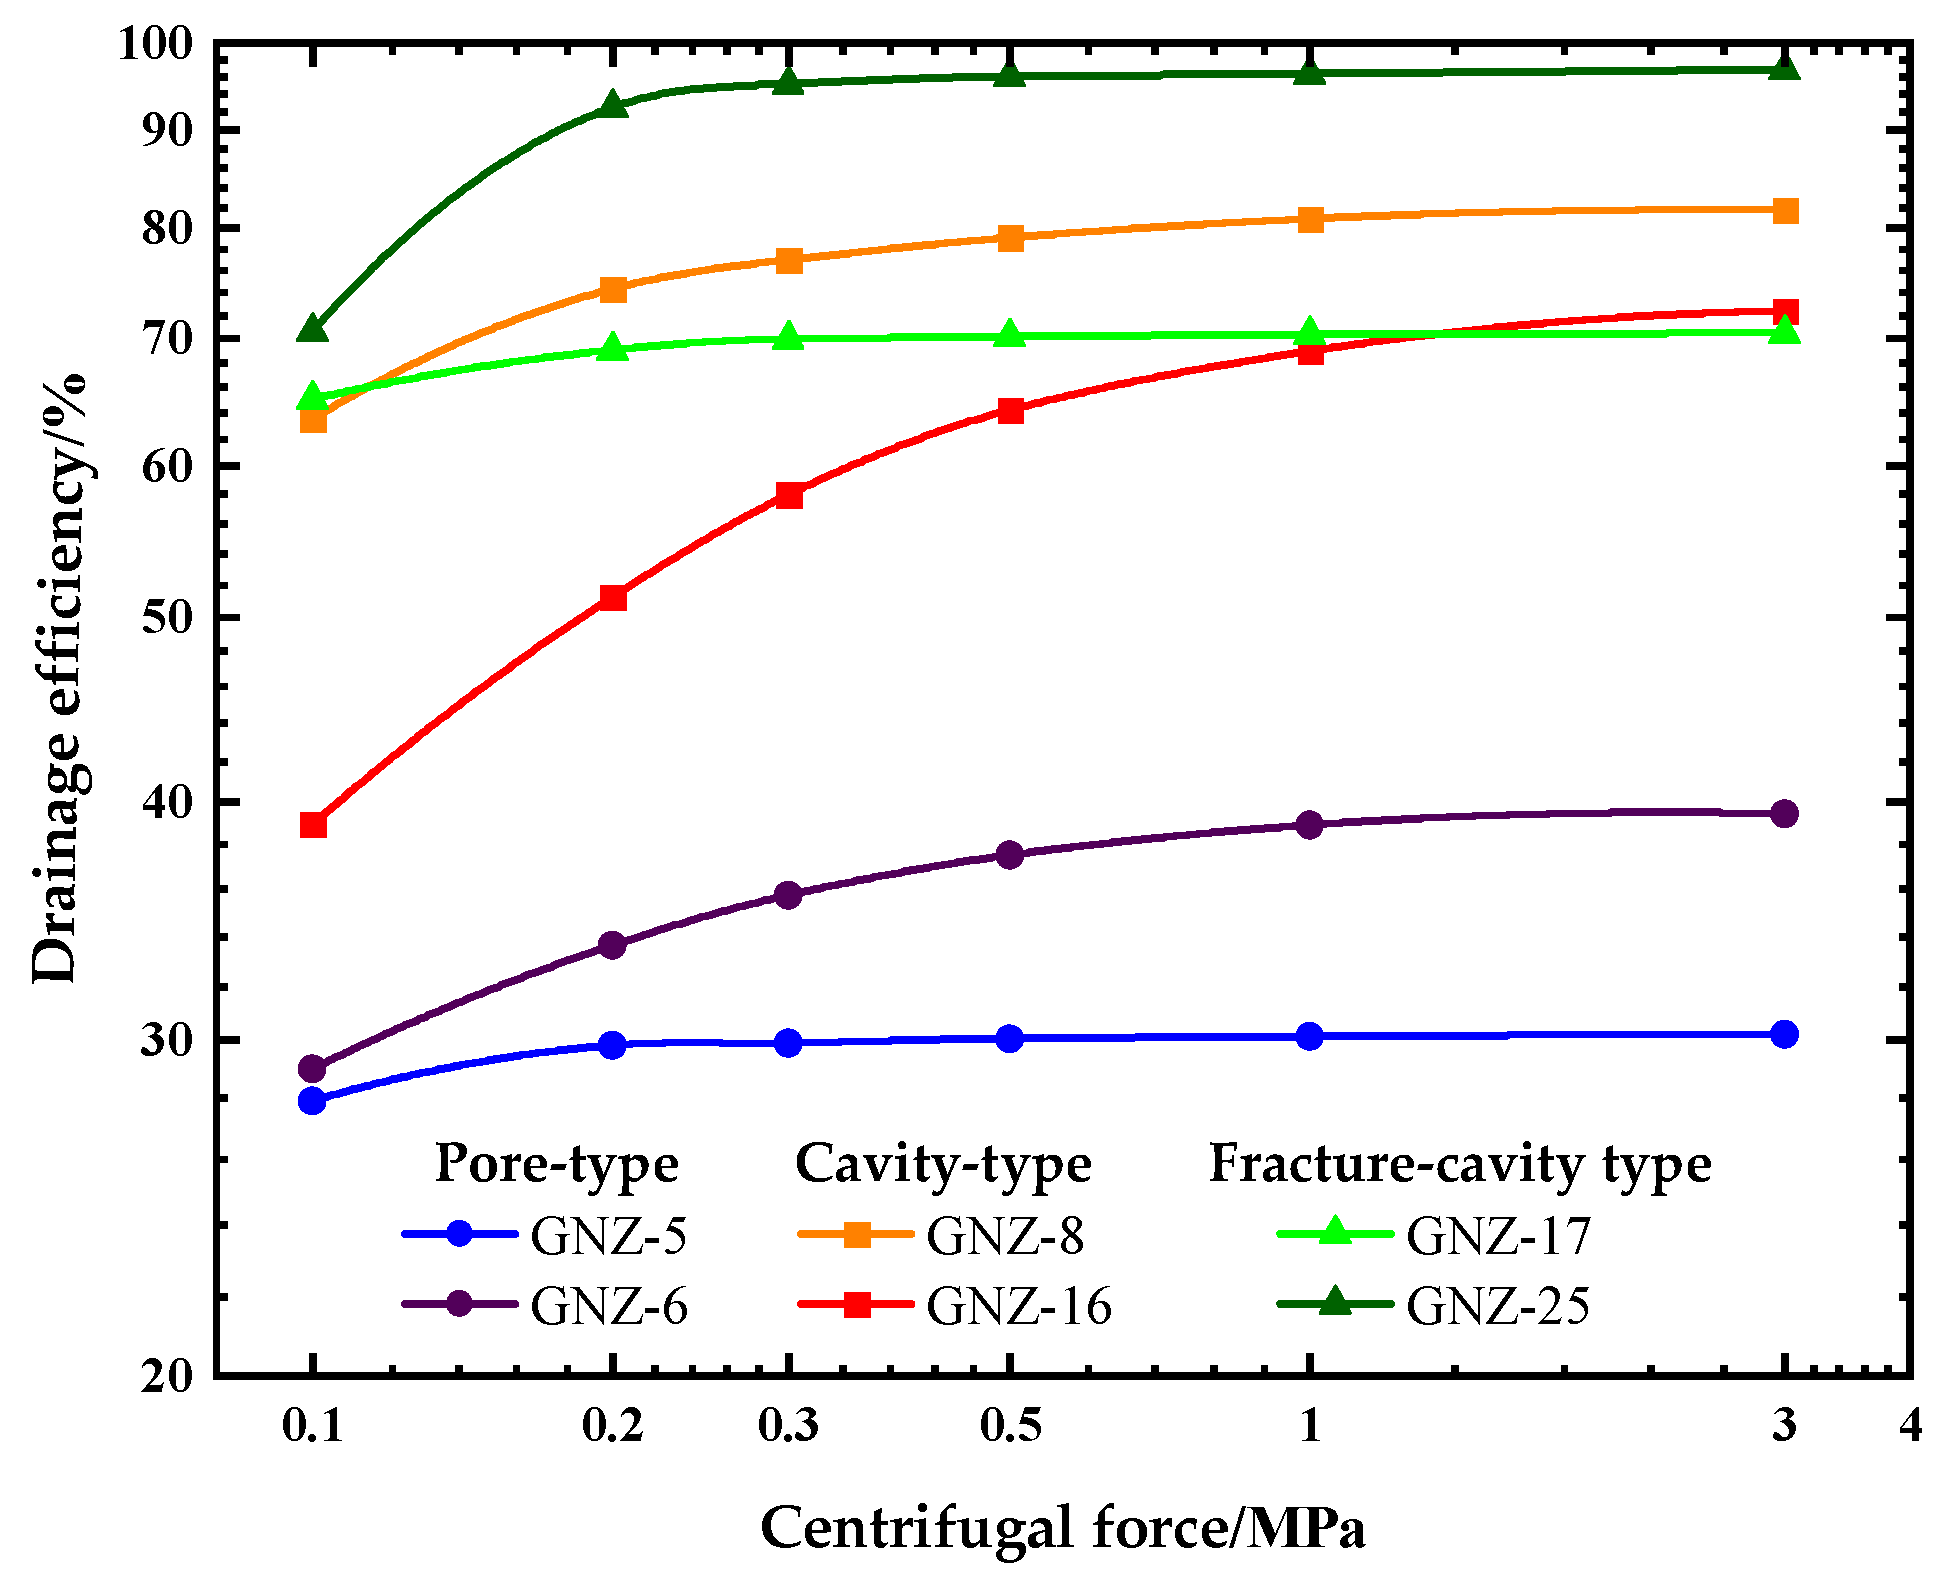
5.4. Characteristics of Drainage Efficiency in Different Types of Cores
6. Suggestions on the Development of Deep Carbonate Gas Reservoirs
7. Conclusions
Author Contributions
Funding
Data Availability Statement
Conflicts of Interest
References
- Zeng, F.; Dong, C.; Lin, C.; Tian, S.; Wu, Y.; Lin, J.; Liu, B.; Zhang, X. Pore structure characteristics of reservoirs of Xihu Sag in East China Sea Shelf Basin based on dual resolution X-ray computed tomography and their influence on permeability. Energy 2022, 239, 122386. [Google Scholar] [CrossRef]
- Guo, Y.; Fu, J.; Wei, X.; Xu, W.; Sun, L.; Liu, J.; Zhao, Z.; Zhang, Y.; Gao, J.; Zhang, Y. Natural gas accumulation and models in Ordovician carbonates, Ordos Basin, NW China. Pet. Explor. Dev. 2014, 41, 437–448. [Google Scholar] [CrossRef]
- Gao, X.; Yang, S.; Tian, L.; Shen, B.; Bi, L.; Zhang, Y.; Wang, M.; Rui, Z. System and multi-physics coupling model of liquid-CO2 injection on CO2 storage with enhanced gas recovery (CSEGR) framework. Energy 2024, 294, 130951. [Google Scholar] [CrossRef]
- Zhu, D.; Wang, Y.; Cui, M.; Zhou, F.; Wang, Y.; Liang, C.; Zou, H.; Yao, F. Acid System and Stimulation Efficiency of Multistage Acid Fracturing in Porous Carbonate Reservoirs. Processes 2022, 10, 1883. [Google Scholar] [CrossRef]
- Hu, J.; Yang, S.; Yang, K.; Deng, H.; Wang, M.; Li, J.; Gao, X. Enhanced Gas Recovery Coupled with CO2 Sequestration in Tight Sandstone Reservoirs with Different Pore–Throat Structures. Energy Fuels 2024, 38, 12005–12023. [Google Scholar] [CrossRef]
- Duan, J.; Zhu, L.; Luo, W. Establishment and Application of a Novel Four-Dimensional Model for Simulation of a Natural Water Flooding Reservoir—A Case Study of Nanpu No. 2 Structure in the BHW Basin. Processes 2023, 11, 189. [Google Scholar] [CrossRef]
- Chen, D.; Sun, Z. A Semi-Analytical Model for Gas-Water Two-Phase Productivity Prediction of Carbonate Gas Reservoirs. Processes 2023, 11, 591. [Google Scholar] [CrossRef]
- Zhao, Y.; Sun, Y.; Liu, S.; Chen, Z.; Yuan, L. Pore structure characterization of coal by synchrotron radiation nano-CT. Fuel 2018, 215, 102–110. [Google Scholar] [CrossRef]
- Guo, X.; Huang, Z.; Zhao, L.; Han, W.; Ding, C.; Sun, X.; Yan, R.; Zhang, T.; Yang, X.; Wang, R. Pore structure and multi-fractal analysis of tight sandstone using MIP, NMR and NMRC methods: A case study from the Kuqa depression, China. J. Pet. Sci. Eng. 2019, 178, 544–558. [Google Scholar] [CrossRef]
- Xu, Y.; Wang, Y.; Yuan, H.; Zhang, D.; Agostini, F.; Skoczylas, F. Pore structure characterization of tight sandstone from Sbaa Basin, Algeria: Investigations using multiple fluid invasion methods. J. Nat. Gas Sci. Eng. 2018, 59, 414–426. [Google Scholar] [CrossRef]
- Zhao, X.; Yang, Z.; Lin, W.; Xiong, S.; Luo, Y.; Wang, Z.; Chen, T.; Xia, D.; Wu, Z. Study on Pore Structures of Tight Sandstone Reservoirs Based on Nitrogen Adsorption, High-Pressure Mercury Intrusion, and Rate-Controlled Mercury Intrusion. J. Energy Resour. 2019, 141, 112903. [Google Scholar] [CrossRef]
- Al-Yaseri, A.; Fatah, A.; Adebayo, A.; Al-Qasim, A.; Patil, P. Pore structure analysis of storage rocks during geological hydrogen storage: Investigation of geochemical interactions. Fuel 2024, 361, 130683. [Google Scholar] [CrossRef]
- Xu, J.; Bu, Z.; Qin, H.; Li, S.; Li, H. Pore–scale modeling of seepage behaviors and permeability evolution in heterogeneous hydrate-bearing sediments and its implications for the permeability model. Geoenergy Sci. Eng. 2023, 221, 211372. [Google Scholar] [CrossRef]
- Gao, Z.; Yang, X.; Hu, C.; Wei, L.; Jiang, Z.; Yang, S.; Fan, Y.; Xue, Z.; Yu, H. Characterizing the pore structure of low permeability Eocene Liushagang Formation reservoir rocks from Beibuwan Basin in northern South China Sea. Mar. Pet. Geol. 2019, 99, 107–121. [Google Scholar] [CrossRef]
- Wu, H.; Zhang, C.; Ji, Y.; Liu, R.e.; Cao, S.; Chen, S.; Zhang, Y.; Wang, Y.; Du, W.; Liu, G. Pore throat characteristics of tight sandstone of Yanchang Formation in eastern Gansu, Ordos Basin. Pet. Res. 2018, 3, 33–43. [Google Scholar] [CrossRef]
- Li, W.; Mu, L.; Zhao, L.; Li, J.; Wang, S.; Fan, Z.; Shao, D.; Li, C.; Shan, F.; Zhao, W.; et al. Pore–throat structure characteristics and their impact on the porosity and permeability relationship of Carboniferous carbonate reservoirs in eastern edge of Pre-Caspian Basin. Pet. Explor. Dev. 2020, 47, 958–971. [Google Scholar] [CrossRef]
- Lai, J.; Wang, G.; Wang, Z.; Chen, J.; Pang, X.; Wang, S.; Zhou, Z.; He, Z.; Qin, Z.; Fan, X. A review on pore structure characterization in tight sandstones. Earth-Sci. Rev. 2018, 177, 436–457. [Google Scholar] [CrossRef]
- Adegbite, J.; Belhaj, H.; Bera, A. Investigations on the relationship among the porosity, permeability and pore throat size of transition zone samples in carbonate reservoirs using multiple regression analysis, artificial neural network and adaptive neuro-fuzzy interface system. Pet. Res. 2021, 6, 321–332. [Google Scholar] [CrossRef]
- Zhang, L.; Liu, X.; Zhao, Y.; Zhou, Y.; Shan, B. Effect of pore throat structure on micro-scale seepage characteristics of tight gas reservoirs. Nat. Gas Ind. B 2020, 7, 160–167. [Google Scholar] [CrossRef]
- Yu, H.; Wei, L.; Qin, X.; Wang, Z.; Cheng, H.; Wang, A.; Wang, D.; Feng, Q.; Lan, Y.; Wang, Y. Gas and water distribution of Ordovician Majiagou Formation in northwest of Ordos Basin, NW China. Pet. Explor. Dev. 2016, 43, 435–442. [Google Scholar] [CrossRef]
- Hu, J.; Yang, S.; Wang, B.; Deng, H.; Wang, M.; Li, J.; Zhao, S.; Shen, B.; Gao, X.; Yang, K. Effect of pore structure characteristics on gas-water seepage behaviour in deep carbonate gas reservoirs. Geoenergy Sci. Eng. 2024, 238, 212881. [Google Scholar] [CrossRef]
- Sharifi, J. Intelligent pore type characterization: Improved theory for rock physics modelling. Geophys. Prospect. 2022, 70, 921–937. [Google Scholar] [CrossRef]
- Jin, X.; Dou, Q.; Hou, J.; Huang, Q.; Sun, Y.; Jiang, Y.; Li, T.; Sun, P.; Sullivan, C.; Adersokan, H.; et al. Rock-physics-model-based pore type characterization and its implication for porosity and permeability qualification in a deeply-buried carbonate reservoir, Changxing formation, Lower Permian, Sichuan Bain, China. J. Pet. Sci. Eng. 2017, 153, 223–233. [Google Scholar] [CrossRef]
- GB/T 29172-2012; Practices for Core Analysis. Petroleum Industry Press: Beijing, China, 2012.
- SY/T 6385-2016; Method for Determination of Porosity and Permeability of Rock under Overburden Pressure. National Energy Administration: Beijing, China, 2016.
- Javadpour, F. Nanopores and Apparent Permeability of Gas Flow in Mudrocks (Shales and Siltstone). J. Can. Pet. Technol. 2009, 48, 16–21. [Google Scholar] [CrossRef]
- SY/T 5913-2004; Rock Thin Section Preparation. National Development and Reform Commission: Beijing, China, 2004.
- Wang, G.; Shen, J.; Liu, S.; Jiang, C.; Qin, X. Three-dimensional modeling and analysis of macro-pore structure of coal using combined X-ray CT imaging and fractal theory. Int. J. Rock Mech. Min. Sci. 2019, 123, 104082. [Google Scholar] [CrossRef]
- Arif, M.; Mahmoud, M.; Zhang, Y.; Iglauer, S. X-ray tomography imaging of shale microstructures: A review in the context of multiscale correlative imaging. Int. J. Coal Geol. 2021, 233, 103641. [Google Scholar] [CrossRef]
- Iraji, S.; Soltanmohammadi, R.; Munoz, E.; Basso, M.; Vidal, A. Core scale investigation of fluid flow in the heterogeneous porous media based on X-ray computed tomography images: Upscaling and history matching approaches. Geoenergy Sci. Eng. 2023, 225, 211716. [Google Scholar] [CrossRef]
- Saif, T.; Lin, Q.; Butcher, A.; Bijeljic, B.; Blunt, M. Multi-scale multi-dimensional microstructure imaging of oil shale pyrolysis using X-ray micro-tomography, automated ultra-high resolution SEM, MAPS Mineralogy and FIB–SEM. Appl. Energy 2017, 202, 628–647. [Google Scholar] [CrossRef]
- Zhou, S.; Liu, D.; Cai, Y.; Yao, Y. Fractal characterization of pore-fracture in low-rank coals using a low-field NMR relaxation method. Fuel 2016, 181, 218–226. [Google Scholar] [CrossRef]
- Zheng, S.; Yao, Y.; Liu, D.; Cai, Y.; Liu, Y. Characterizations of full-scale pore size distribution, porosity and permeability of coals: A novel methodology by nuclear magnetic resonance and fractal analysis theory. Int. J. Coal Geol. 2018, 196, 148–158. [Google Scholar] [CrossRef]
- Wang, F.; Yang, K.; Cai, J. Fractal characterization of tight oil reservoir pore structure using nuclear magnetic resonance and mercury intrusion porosimetry. Fractals–Complex Geom. Patterns Scaling Nat. Soc. 2018, 26, 1840017. [Google Scholar] [CrossRef]
- Liu, Z.; Liu, D.; Cai, Y.; Yao, Y.; Pan, Z.; Zhou, Y. Application of nuclear magnetic resonance (NMR) in coalbed methane and shale reservoirs: A review. Int. J. Coal Geol. 2020, 218, 103261. [Google Scholar] [CrossRef]
- Lai, J.; Wang, G.; Fan, Z.; Chen, J.; Wang, S.; Zhou, Z.; Fan, X. Insight into the Pore Structure of Tight Sandstones Using NMR and HPMI Measurements. Energy Fuels 2016, 30, 10200–10214. [Google Scholar] [CrossRef]
- Rani, S.; Padmanabhan, E.; Prusty, B. Review of gas adsorption in shales for enhanced methane recovery and CO2 storage. J. Pet. Sci. Eng. 2019, 175, 634–643. [Google Scholar] [CrossRef]
- Fan, C.; Li, H.; Qin, Q.; He, S.; Zhong, C. Geological conditions and exploration potential of shale gas reservoir in Wufeng and Longmaxi Formation of southeastern Sichuan Basin, China. J. Pet. Sci. Eng. 2020, 191, 107138. [Google Scholar] [CrossRef]
- Hamza, A.; Hussein, I.; Al-Marri, M.; Mahmoud, M.; Shawabkeh, R.; Aparicio, S. CO2 enhanced gas recovery and sequestration in depleted gas reservoirs: A review. J. Pet. Sci. Eng. 2021, 196, 107685. [Google Scholar] [CrossRef]
- Saboorian-Jooybari, H.; Dejam, M.; Chen, Z. Heavy oil polymer flooding from laboratory core floods to pilot tests and field applications: Half-century studies. J. Pet. Sci. Eng. 2016, 142, 85–100. [Google Scholar] [CrossRef]
- Tananykhin, D.S.; Struchkov, I.A.; Khormali, A.; Roschin, P.V. Investigation of the influences of asphaltene deposition on oilfield development using reservoir simulation. Pet. Explor. Dev. 2022, 49, 1138–1149. [Google Scholar] [CrossRef]


| Sample Number | Length /cm | Diameter /cm | Permeability /10−3 μm2 | Porosity /% | Sample Size | Sample Type |
|---|---|---|---|---|---|---|
| GNQ-6 | 10.136 | 6.610 | 0.001 | 0.872 | Full-diameter | Pore type |
| GNQ-9 | 7.160 | 6.561 | 0.025 | 2.413 | Full-diameter | Pore type |
| GNQ-5 | 7.966 | 6.503 | 0.088 | 5.084 | Full-diameter | Cavity type |
| GNQ-13 | 8.203 | 6.520 | 0.097 | 5.617 | Full-diameter | Cavity type |
| GNQ-7 | 8.361 | 6.534 | 0.112 | 3.892 | Full-diameter | Fracture–cavity type |
| GNQ-4 | 9.773 | 6.573 | 0.419 | 4.282 | Full-diameter | Fracture–cavity type |
| GNZ-5 | 4.641 | 2.532 | 0.00049 | 1.234 | Plunger | Pore type |
| GNZ-6 | 2.483 | 2.533 | 0.013 | 1.894 | Plunger | Pore type |
| GNZ-8 | 2.085 | 2.534 | 0.022 | 5.325 | Plunger | Cavity type |
| GNZ-16 | 2.253 | 2.525 | 0.0018 | 9.006 | Plunger | Cavity type |
| GNZ-17 | 2.118 | 2.513 | 0.54 | 2.167 | Plunger | Fracture–cavity type |
| GNZ–25 | 1.721 | 2.516 | 5.09 | 5.461 | Plunger | Fracture–cavity type |
| Characteristics of Reservoir Body | Pore–Type Reservoir | Cavity–Type Reservoir | Fracture–Cavity Type Reservoir | |
|---|---|---|---|---|
| Dissolved Cavity Storage Type | Dissolved Pore Storage Type | |||
| Permeability/10−3 μm2 | <0.05 | 0.05–0.1 | >0.1 | |
| Porosity/% | <3 | >5 | >4 | |
| Lithologic character | Algal clot dolostone, laminar algal limestone, algal sandy limestone | |||
| Pore type | Intergranular (particle) pores, intergranular (particle) dissolved pores | |||
| Cavity type | / | Small cavity | ||
| Fracture–type | / | / | Dissolved fractures, stress structural fractures | |
| T2 spectral characterization | Unimodal | Bimodal | Unimodal | Bimodal |
| T2 distribution/ms | 0.07–382.54 | 0.02~7215.52 | 0.69~3022.14 | 0.02~2180 |
| Main peak T2/ms | 61.62 | 20.28 (left peak), 276.02 (right peak) | 67.11 | 10.13 (left peak), 121.82 (right peak) |
| 0.1 MPa–3 MPa centrifugal drainage efficiency increase value/% | 6.39 | 18.25 | 33.40 | 15.75 |
| Pore radius/μm | 0.6–3.2 | 2.1–15.8 | 1.7–11.7 | |
| Fracture length/mm | / | / | 2–15 mm | |
| Fracture width/μm | / | / | 10–30 | |
| Throat radius/μm | 0.3–2.2 | 1.7–12.2 | 1.4–10.7 | |
| Pore sphericity | High | Middle | High | Low |
| Main storage space | Pore | Cavity | Large–sized dissolved pores | Cavity |
| Storage capacity | Weak | Strong | Strong | Not strong |
| Seepage capacity | Weak | Not weak | Not strong | Strong |
| Development difficulty | Big | Small | Middle | Small |
Disclaimer/Publisher’s Note: The statements, opinions and data contained in all publications are solely those of the individual author(s) and contributor(s) and not of MDPI and/or the editor(s). MDPI and/or the editor(s) disclaim responsibility for any injury to people or property resulting from any ideas, methods, instructions or products referred to in the content. |
© 2024 by the authors. Licensee MDPI, Basel, Switzerland. This article is an open access article distributed under the terms and conditions of the Creative Commons Attribution (CC BY) license (https://creativecommons.org/licenses/by/4.0/).
Share and Cite
Wang, B.; Yang, S.; Hu, J.; Zhao, S.; Deng, H.; Zhang, Y.; Yan, Y.; Jiang, Y. Reservoir Body Development Characteristics in Deep Carbonate Gas Reservoirs: A Case Study of the Fourth Member of the Dengying Formation, Anyue Gas Field. Processes 2024, 12, 1619. https://doi.org/10.3390/pr12081619
Wang B, Yang S, Hu J, Zhao S, Deng H, Zhang Y, Yan Y, Jiang Y. Reservoir Body Development Characteristics in Deep Carbonate Gas Reservoirs: A Case Study of the Fourth Member of the Dengying Formation, Anyue Gas Field. Processes. 2024; 12(8):1619. https://doi.org/10.3390/pr12081619
Chicago/Turabian StyleWang, Beidong, Shenglai Yang, Jiangtao Hu, Shuai Zhao, Hui Deng, Yuxiang Zhang, Youjun Yan, and Yi Jiang. 2024. "Reservoir Body Development Characteristics in Deep Carbonate Gas Reservoirs: A Case Study of the Fourth Member of the Dengying Formation, Anyue Gas Field" Processes 12, no. 8: 1619. https://doi.org/10.3390/pr12081619