Article

Research on Micropore Development Characteristics and Influencing Factors during CO2 Huff-n-Puff

1
Research Institute of Exploration and Development, Tuha Oilfield Company, Petro China, Hami 839009, China
2
National Key Laboratory of Petroleum Resources and Engineering, China University of Petroleum (Beijing), Beijing 102249, China
*
Authors to whom correspondence should be addressed.
Processes 2024, 12(8), 1665; https://doi.org/10.3390/pr12081665
Submission received: 1 July 2024 / Revised: 2 August 2024 / Accepted: 7 August 2024 / Published: 8 August 2024

Abstract

:
CO2 huff-n-puff is an important method for the development of shale oil reservoirs. In this study, HPMI and NMR technology was used to characterize the pore distribution of the cores. The CO2 huff-n-puff experiment experiments were conducted to study the effects of injection pressure, soaking time, and heterogeneity on the CO2 huff-n-puff. The results showed that the Jimsar core pores are predominantly nanopores. Mesopores with a pore radius between 2 nm and 50 nm accounted for more than 70%. CO2 huff-n-puff has been shown to effectively enhance shale oil recovery. When the injection pressure was greater than the miscible pressure, higher injection pressures were able to improve the recovery of macropores, particularly in cores with higher permeability. Appropriately extending the soaking time enhanced the diffusion of CO2 in the mesopores, and the recovery increased to above 10%. Determining the optimal soaking time is crucial to achieve maximum CO2 huff-n-puff recovery. Artificial fractures can enhance the recovery of mesopores around them, resulting in core recovery of up to 60%. However, artificial fractures exacerbate reservoir heterogeneity and reduce the CO2 huff-n-puff recovery of matrix. Increasing the cycles of CO2 huff-n-puff can effectively reduce the impact of heterogeneity on the recovery of matrix. In conclusion, expanding the area of the fracturing transformation zone and selecting the appropriate injection pressure and soaking time for the multiple cycles of CO2 huff-n-puff can effectively improve the recovery of shale oil reservoirs.

1. Introduction

At present, conventional oil and gas resources have entered the later stage of development, facing challenges of depletion and increased supply pressure. As global energy demand continues to grow, scholars are increasingly focusing on the development of unconventional oil and gas resources [1,2]. Shale oil reservoirs are a type of unconventional oil and gas, characterized by low porosity, low permeability, and complex pore structure. This makes it difficult for fluids to flow, resulting in enormous difficulty in extraction [3,4]. The primary development method for shale oil reservoirs involves conducting extensive hydraulic fracturing via horizontal wells. This process aims to create a network of fractures, enhancing reservoir fluid flow capacity [5,6]. However, due to the limited storage capacity of shale oil reservoirs and the abundance of nano-scale pore throats, shale oil exhibits extremely high flow resistance. Consequently, shale oil production declines very rapidly during the natural depletion exploitation [7,8].
CO2 have a small molecules radius, allowing them to enter smaller pores within the reservoir to replenish formation energy. Upon entering, CO2 can dissolve into crude oil, causing it to expand and reducing its viscosity [9,10]. Additionally, CO2 can extract lighter components from crude oil and form a miscible phase with it [11,12]. These mechanisms collectively reduce the flow resistance of crude oil in the reservoir, causing CO2 to become an effective method in the development of unconventional reservoirs.
The strong heterogeneity of shale oil reservoirs makes gas channeling very likely to occur during gas flooding [13]. CO2 huff-n-puff can avoid gas channeling and has the advantages of strong targeting, short cycle, and quick effect [14,15]. Zuloaga et al. [16] conducted a numerical simulation study on the CO2 huff-n-puff and continuous CO2 displacement recovery effects under different permeabilities. The results show that matrix permeability has a significant impact on CO2 huff-n-puff recovery. The matrix cores with permeability less than 0.03 mD can achieve better recovery. In the three stages of CO2 huff-n-puff, injection pressure, soaking time, and production pressure are important factors affecting the recovery rate [17,18,19].
Scholars have conducted numerous experiments to study the effects of injection pressure and soaking time on CO2 huff-n-puff recovery [20,21]. According to Gao et al., increasing the injection pressure and soaking time enhances the recovery from macropores. Short-term soaking time is beneficial to the production from micropores [22]. Huang et al. [23] studied the production characteristics of nanopores in shale oil reservoirs, and the results show that the small pore recovery increases linearly with the increase in injection pressure and increasing the soaking time can effectively improve the recovery of micropores. Scholars also used NMR technology to conduct a detailed study on the fluid distribution in the core pores during CO2 huff-n-puff [24,25,26]. Zhu et al. [27] studied the migration characteristics and the residual oil distribution of Chang 7 continental shale oil. They found that shale oil production primarily occurs in macropores and medium-sized pores, while the remaining oil is mainly distributed in micropores, accounting for 82.29% of the total remaining oil. Wan et al. [28] observed that after CO2 huff-n-puff, the degree of pore recovery varied in cores with different permeabilities. Specifically, in rocks with permeabilities less than 0.01 mD, pores smaller than 0.1 μm were predominantly recovered. The research of Chen et al. [29] showed that reservoir heterogeneity has a certain influence on CO2 huff-n-puff recovery efficiency.
Although scholars have conducted extensive research on CO2 huff-n-puff, the impact of reservoir heterogeneity on CO2 huff-n-puff is not clear. Moreover, due to the varying adaptability of CO2 to different reservoirs, adaptability research is required to select appropriate injection pressure and soaking time.
Shale oil resources in Jimsar are abundant and hold significant development potential. Clarifying the influence of various factors on the CO2 huff-n-puff is crucial for optimizing reservoir development strategies. Jimsar shale oil reservoirs contain a large number of artificial and natural fractures. Therefore, this study characterizes the pore structure of cores based on NMR and HPMI. Combined with CO2 huff-n-puff experiments, the effects of fractures, injection pressure, and soaking time on huff-n-puff recovery were studied, and the production characteristics of micro- and nanopores in the core under different conditions are analyzed.

2. Experimental Materials and Methods

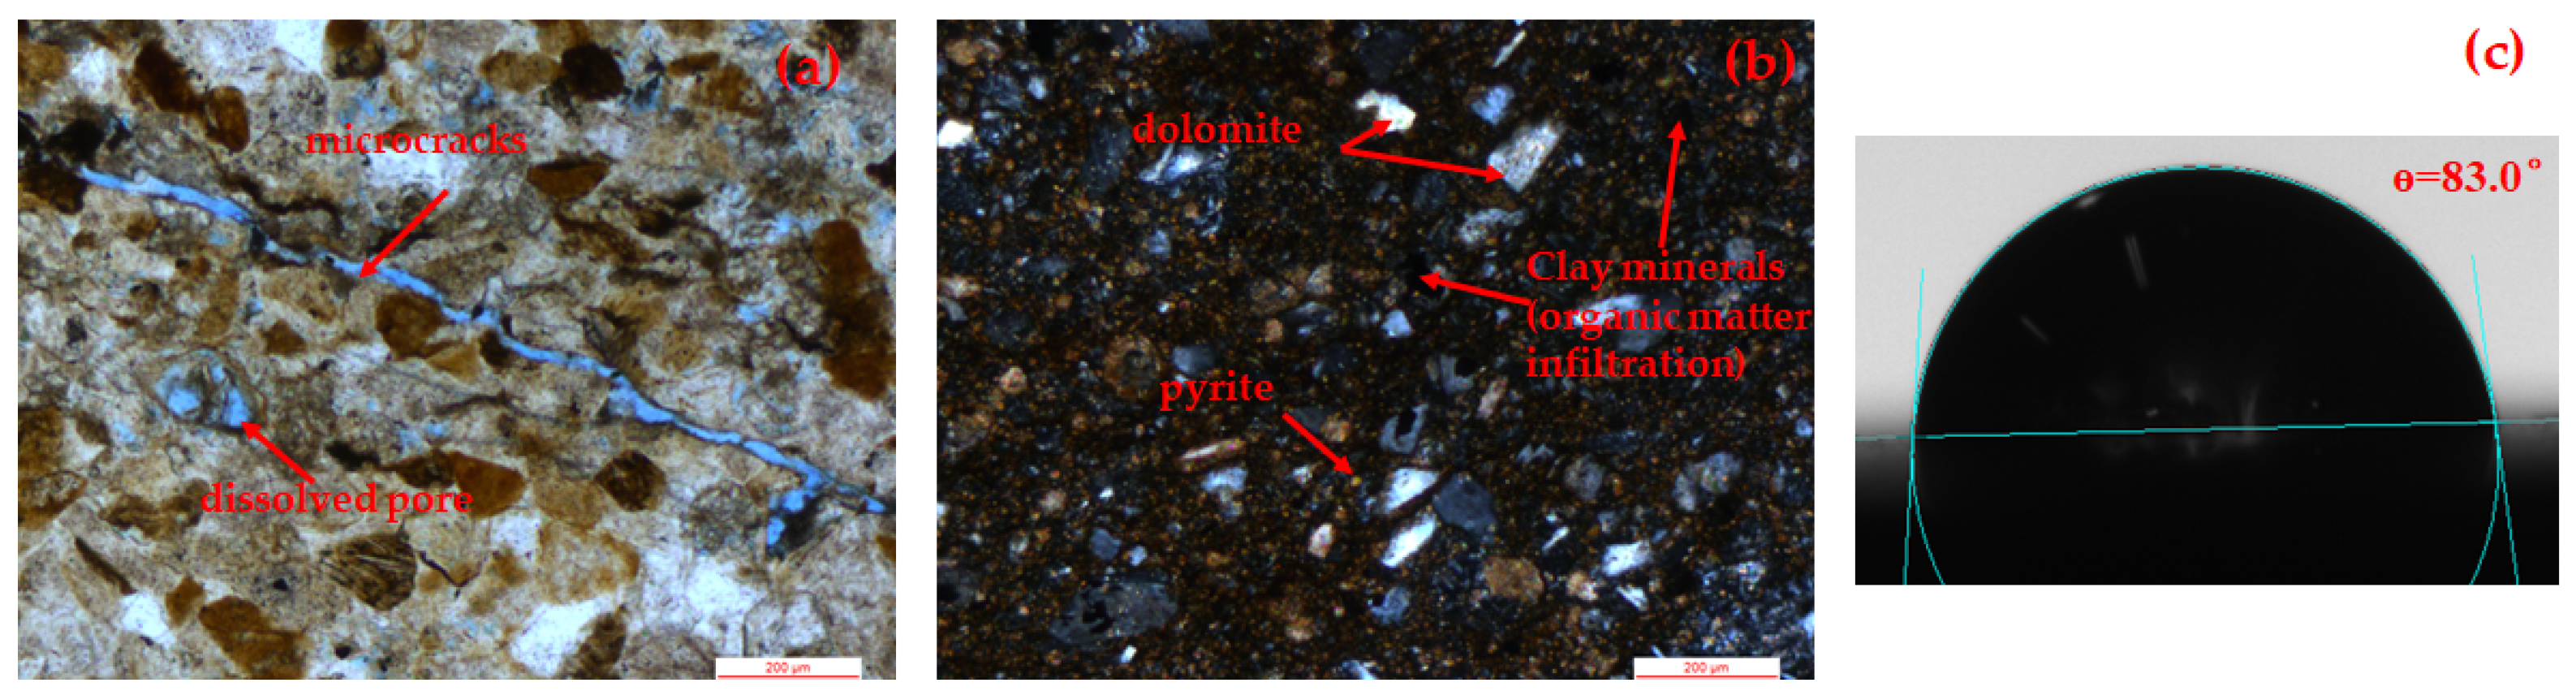
2.1. Experimental Materials

The rock lithology of the Jimsar Lucaogou Formation is dolomitic mudstone, argillaceous siltstone, and dolomitic siltstone. According to SY/T 5368-2000 [30], a thin section examination was conducted on rocks, and the results showed that the rock contained high levels of clay minerals, quartz, and dolomite, with small amounts of potassium feldspar, plagioclase, calcite, and occasional pyrite. This is shown in Figure 1. The reservoir rock contains a small number of micro-cracks. The core contact angle experiment shows that the cores exhibit weak water wettability overall (Figure 1c).
Cores were selected for pore throat structure testing and CO2 huff-n-puff experiments; the porosity of the selected core was between 2.08%~10.88% and the permeability is 0.004~75.47 mD. The core parameters are shown in Table 1.
The experimental oil is a simulated oil prepared from kerosene and crude oil. It has a viscosity of 3.5 mPa·s and a density of 0.857 g/cm3. The purity of CO2 used in the CO2 huff-n-puff experiment is 99.99%.

2.2. High Pressure Mercury Intrusion and Nuclear Magnetic Resonance Experiments

High-pressure mercury intrusion (HPMI) is commonly utilized to analyze the pore throat structure of rock cores. This method is widely used due to its speed, ease of operation, and capability to measure pore distributions ranging from 3 nm to 100 μm. In this experiment, HPMI tests were conducted on three rock cores using the CMS300 (Petrolabs Tech Limited, Beijing, China) and AutoPore IV 9505(McMurray (Shanghai) Instrument Co., Ltd., Shanghai, China) mercury injection instruments, with the maximum mercury injection pressure as 200 MPa. According to GB/T 21650.1-2008 [31], the mercury injection pressure was incrementally increased, and the mercury injection volume at each pressure step was recorded and the mercury saturation to derive the capillary force curve was calculated. Based on the Washburn equation, the pore radius corresponding to each mercury injection pressure was computed. Subsequently, the pore radius and mercury injection volume were processed to establish the pore distribution curve within the cores.
Nuclear magnetic resonance (NMR) can measure the distribution of pore throat structure in rock core under non-destructive conditions. In this experiment, the SPEC-RC1 NMR displacement analyzer (Beijing SPEC Technology Development Co., Ltd, Beijing, China) was used. The NMR equipment has an echo interval of 1 μs, and during testing, 64 scans were conducted with a total of 1024 echoes collected. Prior to the NMR test, the core was pressurized and saturated with oil. The distribution of pore throat structures was calculated based on the NMR spectrum obtained under saturation conditions.

2.3. CO2 Huff-n-Puff Experiment

Injecting CO2 above the miscible pressure can significantly enhance the recovery of a shale oil reservoir [32,33]. The minimum miscibility pressure between simulated oil and CO2 is 19 MPa. Given that the formation pressure of the shale oil reservoir is 25 MPa, a miscible state can be achieved at this pressure. When the injection pressure exceeds the miscible pressure, this study investigates the recovery degree of micro- and nanopores under varying injection pressures and soaking times during CO2 huff-n-puff. As CO2 huff-n-puff causes significant damage to the cores, the core porosity and permeability after oil washing are quite different [34], cores with similar porosity and permeability were selected for parallel experiments.
The CO2 huff-n-puff experimental equipment includes an ISCO pump (Oillab (Wuhan) Technology Co., Ltd, Wuhan, China), intermediate container, core holder, six-way valve, back pressure valve, etc. The pressure range of an ISCO pump is 10–10,000 psi, with an accuracy of 0.1% FS. The CO2 huff-n-puff experiment flow chart is shown in Figure 2, and the experimental procedures are shown as follows:
(1)
Measure the porosity and permeability of the cores after cleaning and drying them, along with measuring the dry weight of each core.
(2)
Evacuate the cores using a vacuum pump for 24 h. Subsequently, saturate the cores with simulation oil under formation pressure, using a high-pressure saturation device. Then, remove any floating oil from the core surface and measure the wet weight.
(3)
Place the saturated core into a nuclear magnetic resonance (NMR) instrument and measure the T2 spectrum under saturated conditions.
(4)
After the NMR test, install the core in the core holder for the CO2 huff-n-puff experiment.
(5)
Inject CO2 at a constant pressure using an ISCO pump. Once the pressure reaches the experimental level (20 MPa, 25 MPa), close the valve and soaking. Control the back pressure and confining pressure to be 1–2 MPa higher than the injection pressure during the experiment.
(6)
After soaking for a specified period (5 h, 10 h, 15 h), adjust the back pressure and slowly reduce the pressure to atmospheric pressure.
(7)
When the pressure drops to atmospheric pressure and no more oil is produced, take out and weight the core. Then, perform another NMR test.
(8)
Repeat steps (4) to (7) to perform multiple cycles of CO2 huff-n-puff.
(9)
Based on NMR T2 spectra, calculate the ratio of signal changes in each pore to the total signal value in order to obtain the recovery of each pore.
Figure 2. Schematic diagram of a CO2 huff-n-puff device.
Processes 12 01665 g002

3. Results and Discussion

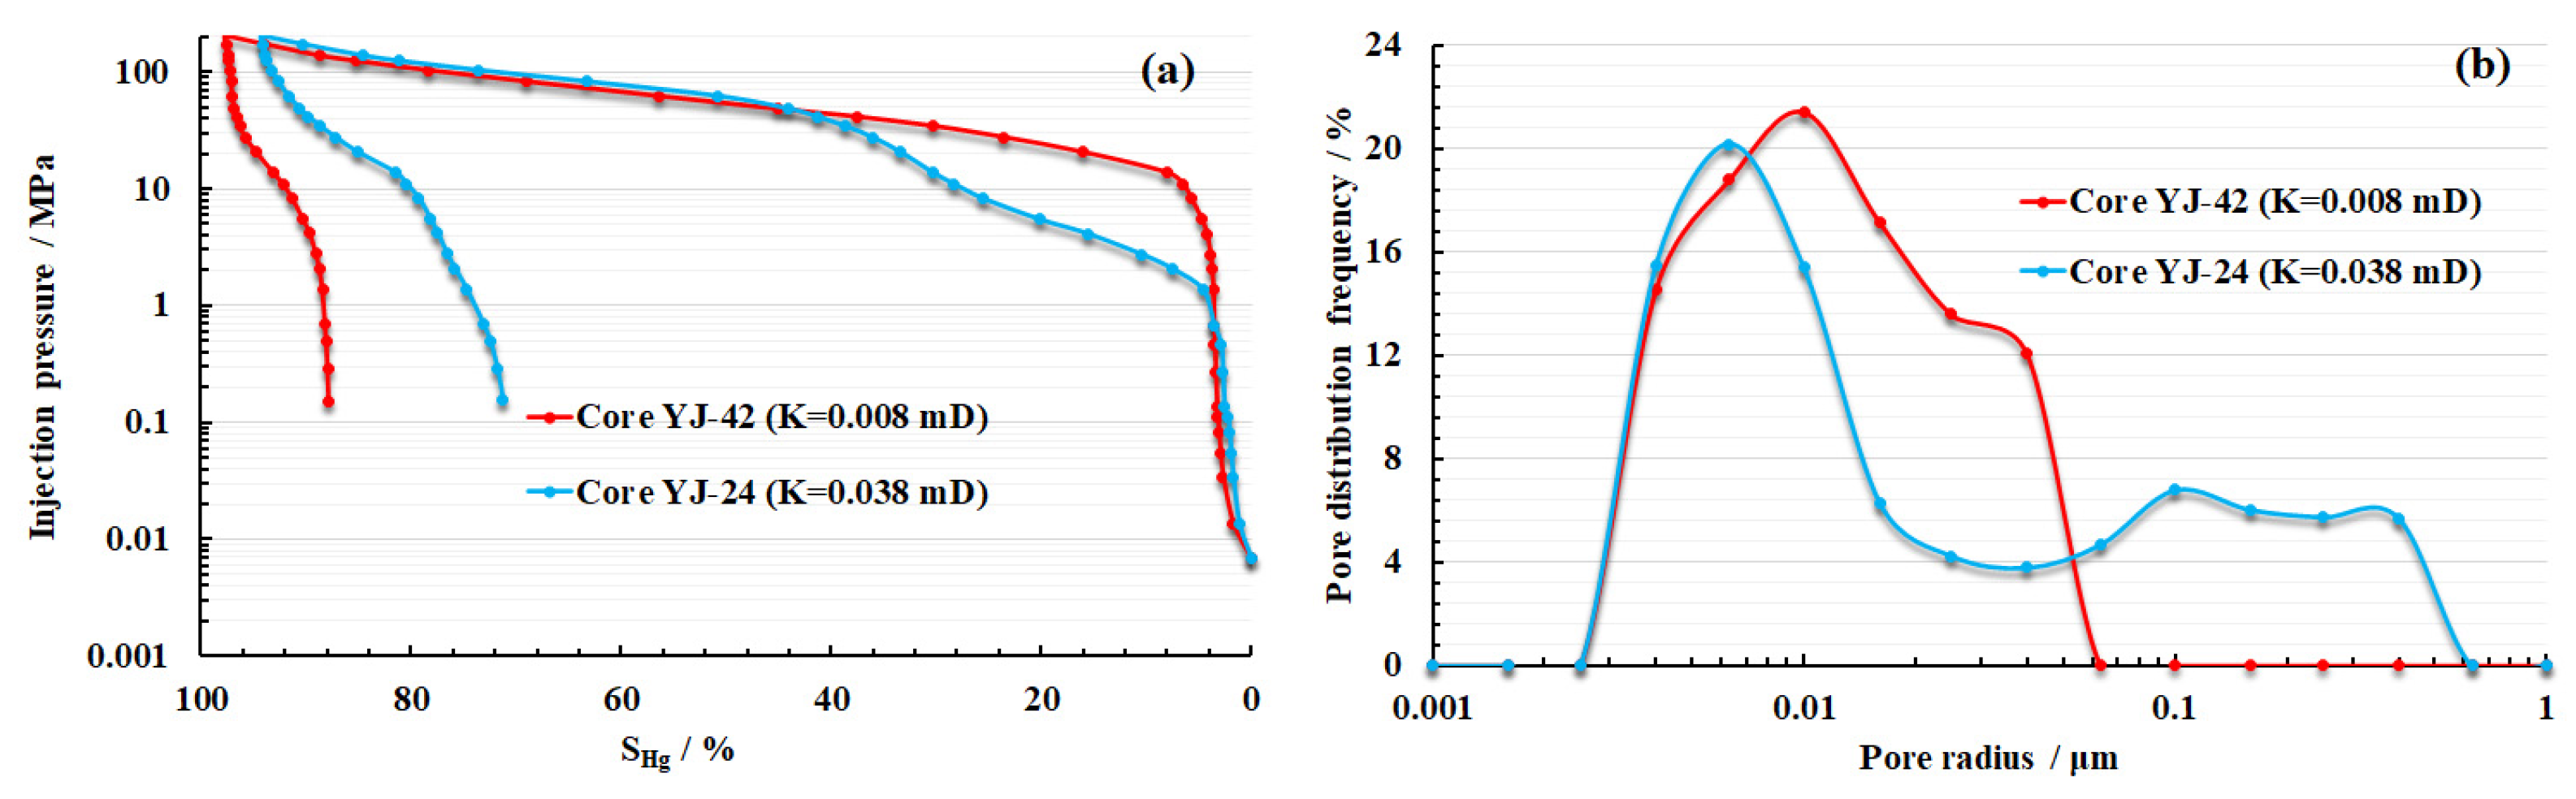
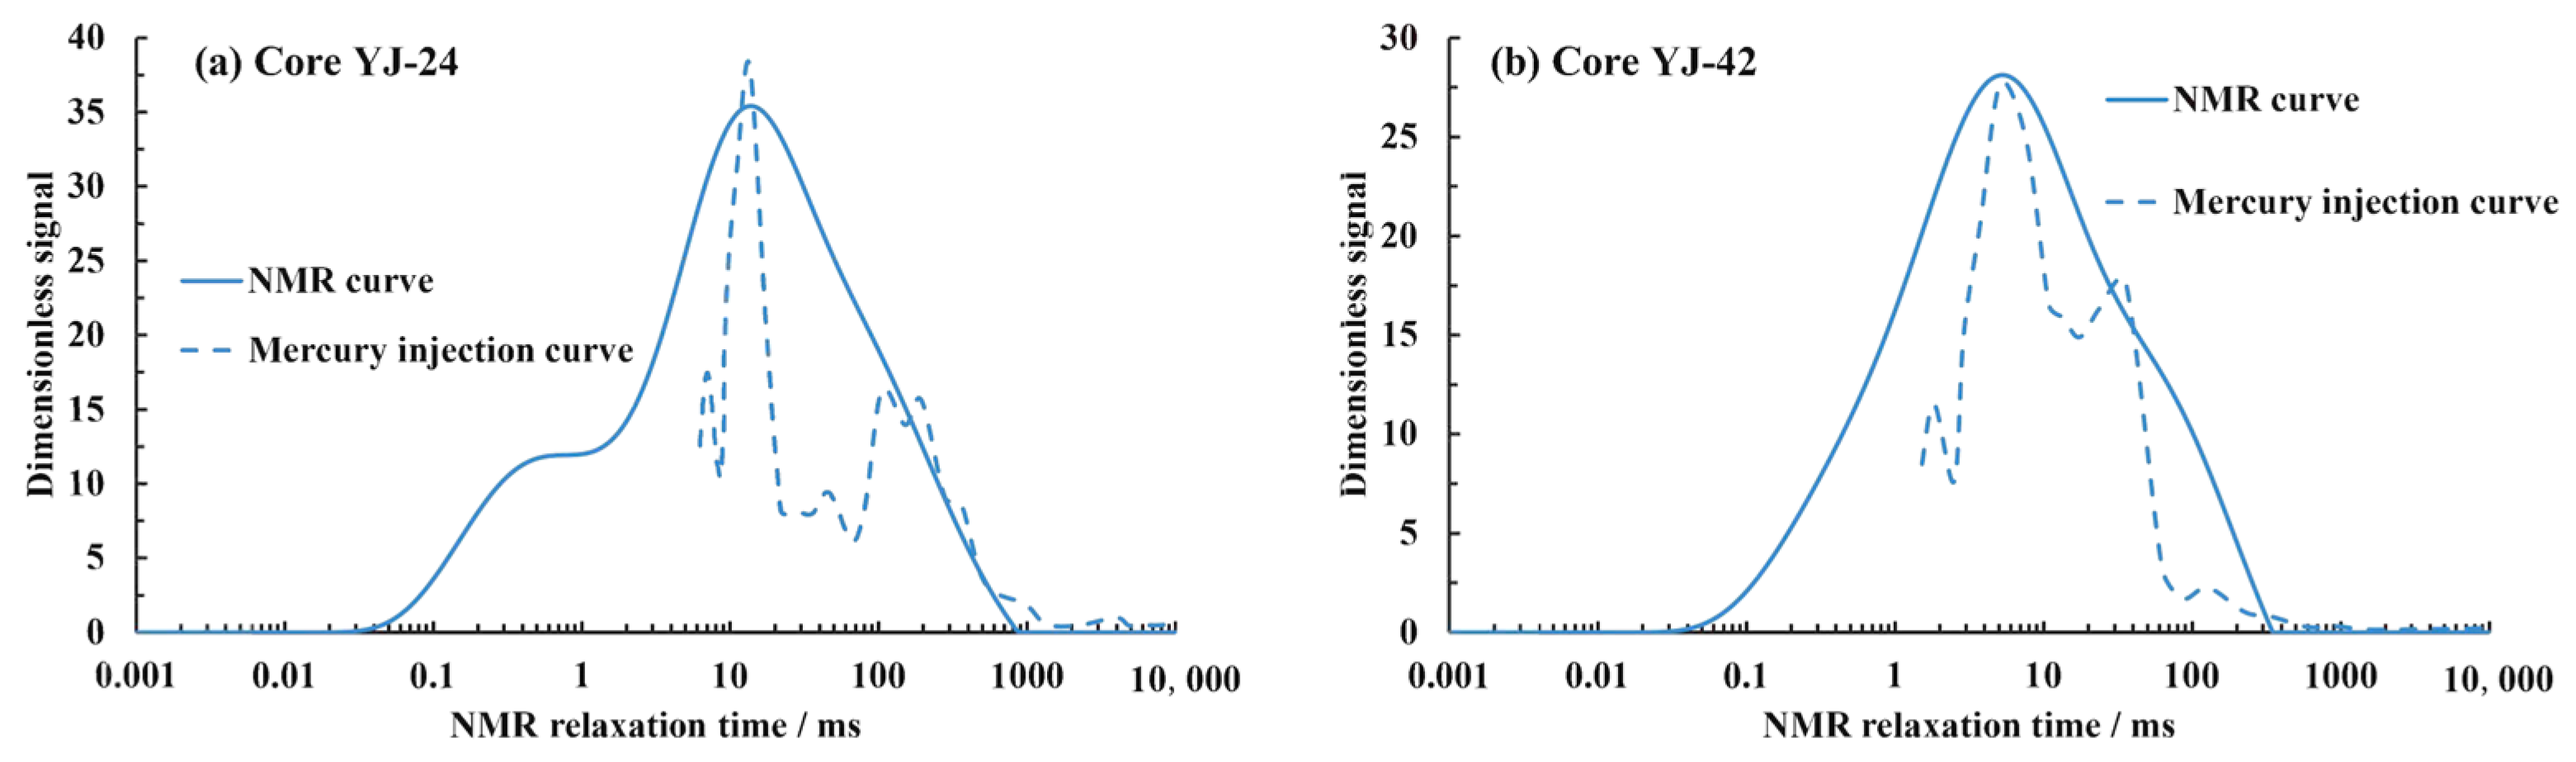
3.1. Core Pore Distribution and NMR Relaxation Time Conversion

The capillary force curves and pore distribution curves of the cores are depicted in Figure 3, revealing that the predominant pores in the rock are nanopores. As the core permeability increases, the range of pore radius distribution widens, accompanied by an increase in the number of larger pores. Table 2 presents the physical properties of the cores measured by high-pressure mercury injection. The pore radius ranges from 0.003 to 0.6 μm, with an average pore radius of less than 0.1 μm. Core permeability correlates with both the maximum and average pore radius, showing an increase as these values increase. The sorting coefficient and homogeneity coefficient indicate significant heterogeneity within the cores, which intensifies with larger core pore radius.
The NMR curves of the two cores are shown in Figure 4, illustrating a broader pore range, particularly enabling the characterization of small pores within the cores. Previous studies have established a power-exponential relationship between NMR relaxation time and pore radius [35]. As shown in Figure 5, based on the NMR cumulative curve and mercury injection curve, the conversion coefficients of the relaxation time and pore radius of the two cores are obtained, and the average value is taken to obtain the conversion formula:
r = 0.0055 × T 2 0.5893
In this formula, r is the pore radius, μm, and T 2 is the NMR relaxation time, ms.
According to the IUPAC pore classification standard, this study defines pores with a pore radius of less than 2 nm as micropores, pores with a pore radius of between 2 and 50 nm as mesopores, and pores with a pore radius greater than 50 nm as macropores.

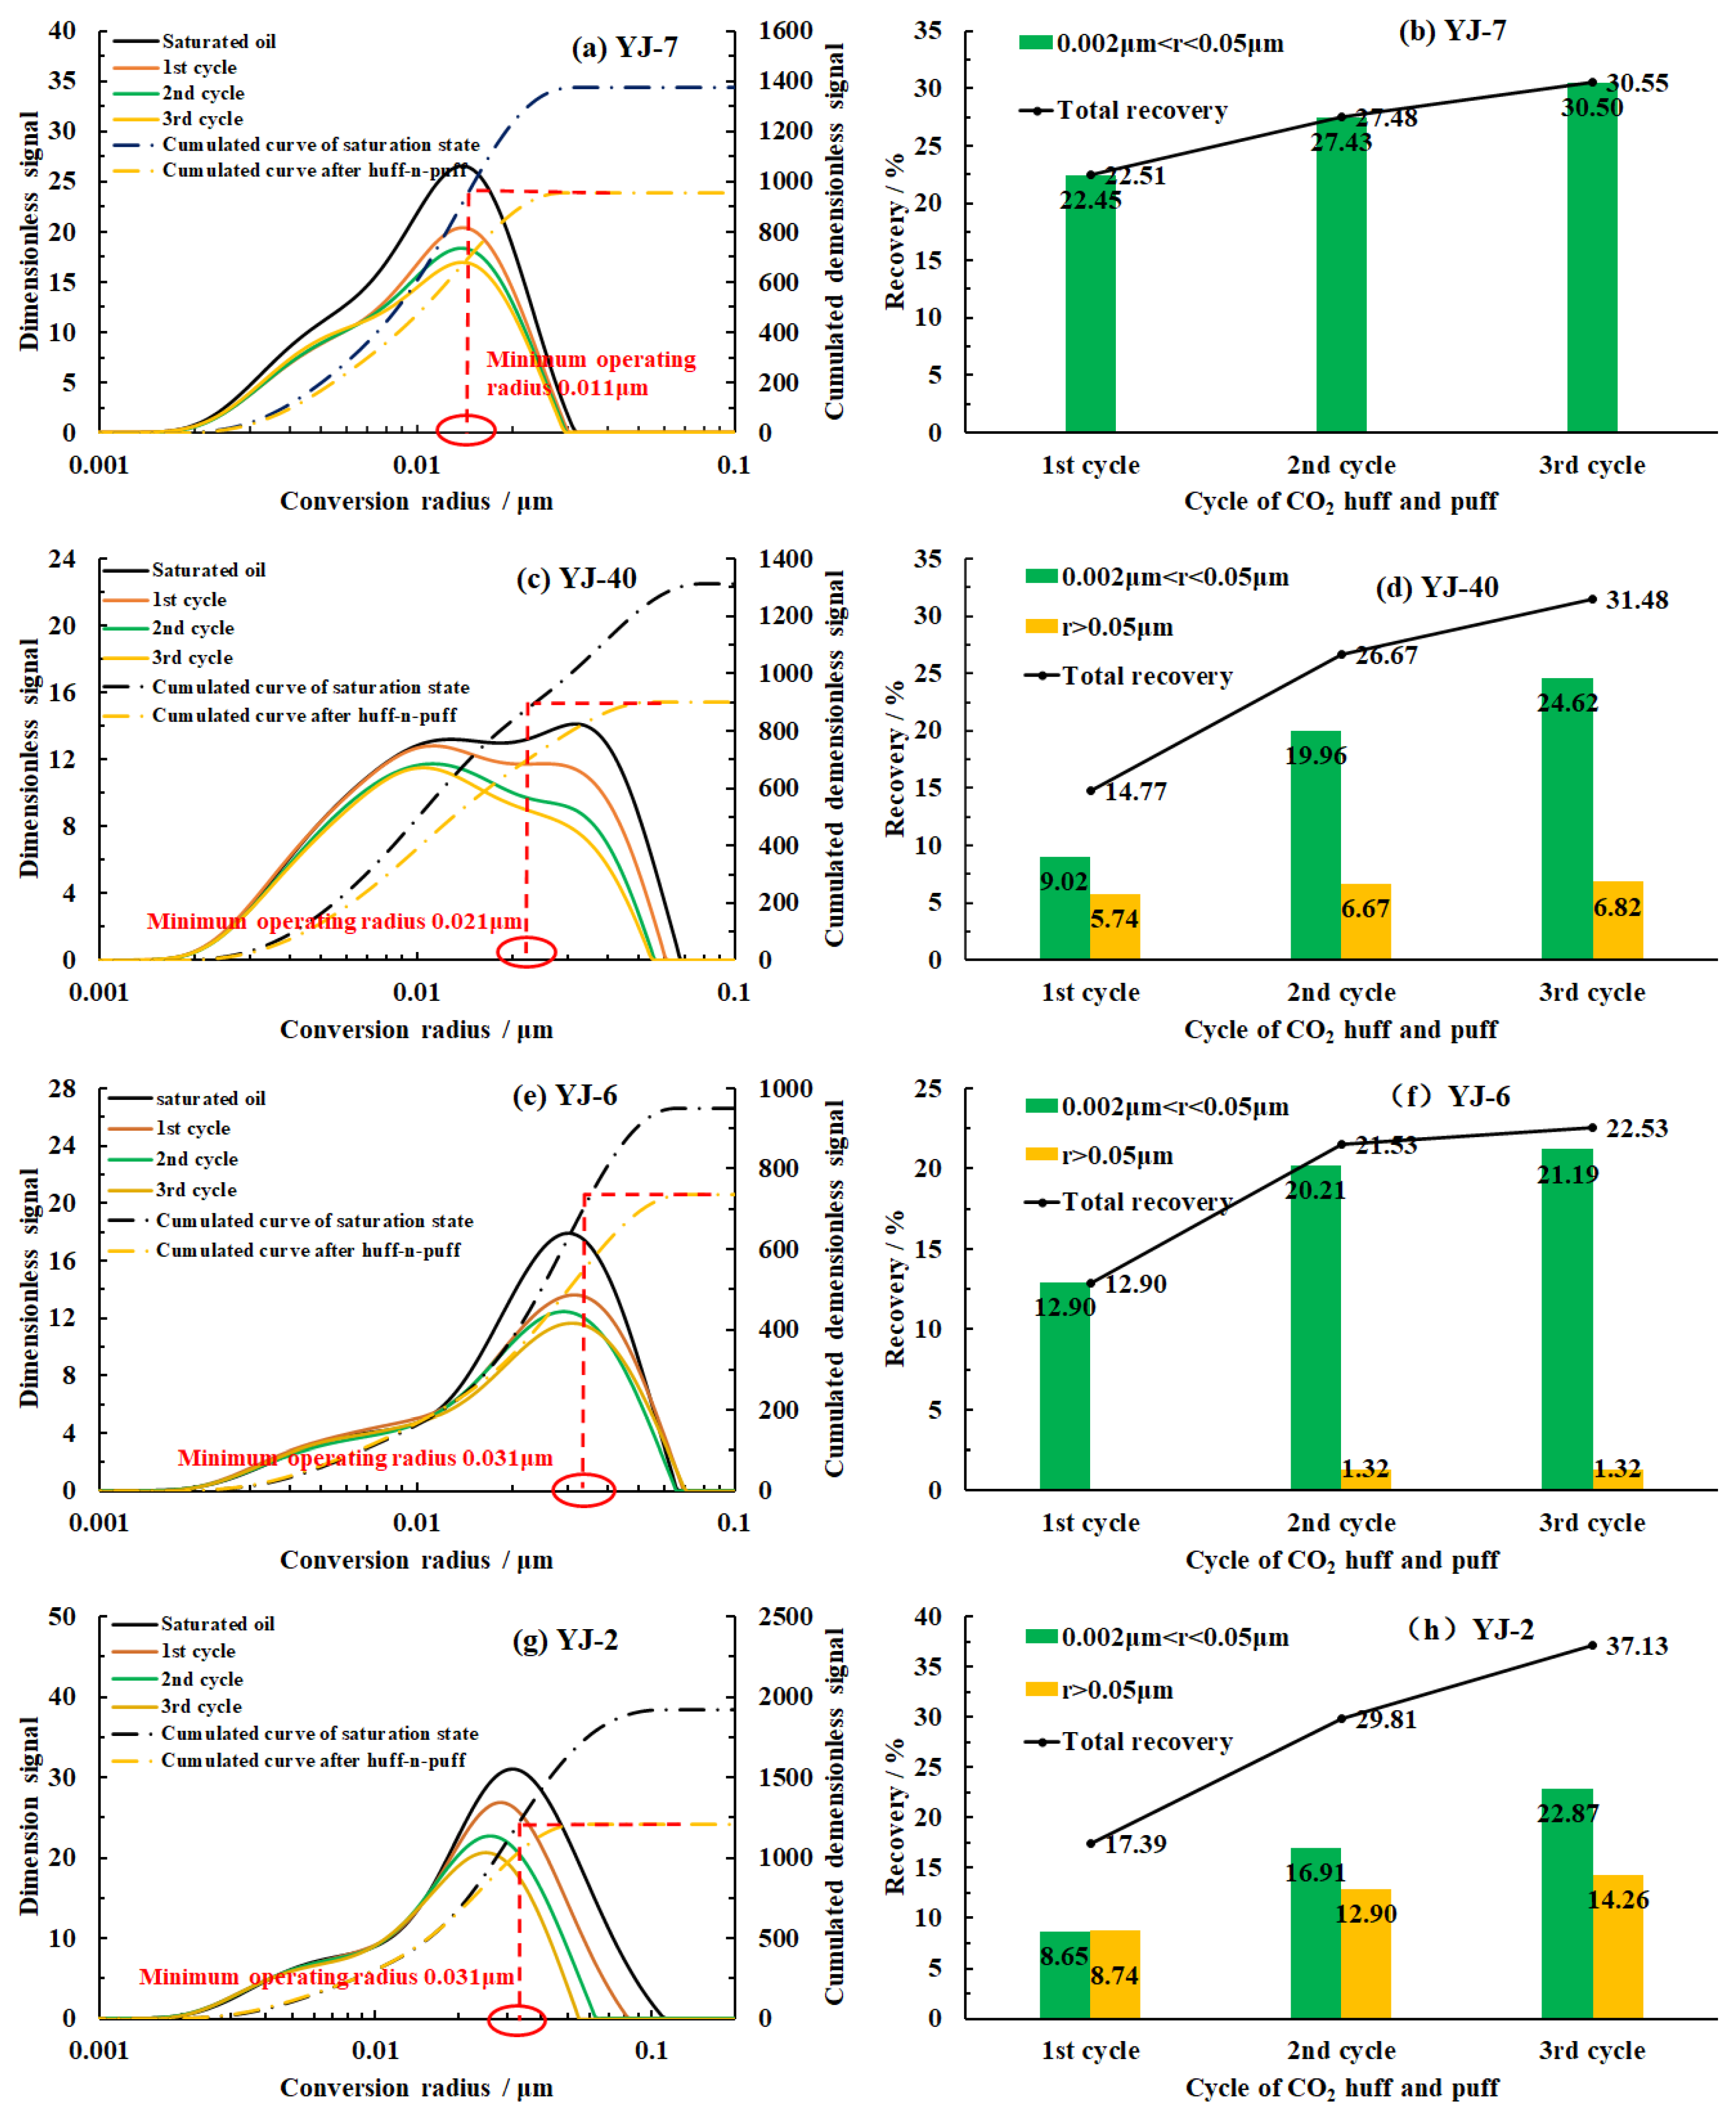
3.2. Effect of Injection Pressure on CO2 Huff-n-Puff

The cores CO2 huff-n-puff recovery under different injection pressures are shown in Table 3. When the injection pressure increases from 20 MPa to 25 MPa, the CO2 huff-n-puff recovery of cores with a permeability of less than 0.01 mD (YJ-7 and YJ-40) vibrates between 30.54% to 31.48%. Conversely, the CO2 huff-n-puff recovery of cores with a permeability greater than 0.01 mD (YJ-6 and YJ-2) increases by approximately 8%. The CO2 huff-n-puff recovery of the core is influenced to some extent by the distribution of pore within the cores. Micropores and mesopores with a pore radius of less than 50 nm constitute the predominant components of the core pores, and the percentages of these pores in cores YJ-7, YJ-40, YJ-6, and YJ-2 are 99.70%, 92.77%, 95.58%, and 85.45%, respectively. Core permeability increases to 0.04 mD and the proportion of mesopores and micropores decreases, yet they remain the primary components of the core pores.
The recovery of core pores is shown in Figure 6. It can be seen that the mesopores are the main source of the core recovery, the micropore recovery rate is almost 0, and macropore recovery increases with the higher macropore content of the core. The recovery of crude oil from mesopores and macropores significantly influences the overall core recovery rate.
Figure 6 shows the minimum pore operating radius of CO2 huff-n-puff in each core. Specifically, the minimum pore operating radii of the four cores YJ-7, YJ-40, YJ-6, and YJ-2 are 0.011 μm, 0.021 μm, 0.031 μm, and 0.031 μm, respectively. Combined with Table 3, it can be found that with the increase in injection pressure, the minimum operating pore radius of the core does not show a significant decrease. This indicates that during the CO2 huff-n-puff process, increasing the injection pressure above the miscible pressure cannot effectively increase the spread of CO2 in the mesopores. Comparing core YJ-7 with core YJ-6, it can be observed that as the pore radius of the core increases, the minimum pore operating radius also increases. The proportions of macropores in core YJ-40 and core YJ-2 are 7.23% and 14.55%, respectively. As shown in Figure 6, it can be seen that nearly all oil in the large pores has been extracted. After the first cycle of CO2 huff-n-puff, the oil extracted from macropores accounts for more than 50% of its pore volume, while micropores and mesopores account for less than 10%. This indicated that CO2 huff-n-puff preferentially produced oil from macropores. Cores YJ-6 and YJ-2 have permeabilities higher than 0.01 mD. A comparison of their pore recovery reveals that increasing injection pressure results in minor changes in mesopore recovery but significantly enhances recovery in macropores. This indicates that in cores with higher permeability, increasing injection pressure effectively improves the efficiency of oil displacement in macropores, thereby increasing core CO2 huff-n-puff recovery.

3.3. Effect of Soaking Time on CO2 Huff-n-Puff

The diffusion of CO2 in crude oil plays a crucial role in enhancing shale oil recovery through CO2 huff-n-puff. The soaking time is a primary factor influencing CO2 diffusion. Table 4 presents the experimental conditions and core recovery results of CO2 huff-n-puff experiments conducted on three cores under varying soaking times.
The CO2 huff-n-puff recovery of the three cores under different soaking times is shown in Figure 7. The nuclear magnetic resonance (NMR) T2 spectrum under saturated oil reveals that the pore radius of all three cores is less than 0.05 μm, with no large pores present. The minimum pore operating radius for the three cores is 0.011 μm, indicating that simulated oil in the micropores was not produced and the diffusion of CO2 in mesopores is the primary factor influencing the CO2 huff-n-puff recovery.
Figure 7a illustrates the recovery of each round of CO2 huff-n-puff for the three cores. It can be observed that the CO2 huff-n-puff recovery of the cores increases with longer soaking times. Specifically, increasing the soaking time from 5 h to 10 h results in a recovery increase of 14.36%, and increasing the soaking time from 5 h to 15 h leads to a recovery rate increase of 10.11%. These increases in recovery rates indicate that the diffusion range of CO2 within the mesopores has expanded and a large amount of simulated oil from mesopore has been produced. Comparing the changes in core recovery between soaking for 10 h and 15 h, it was observed that the CO2 huff-n-puff recovery was lower when soaking for 15 h. This can be attributed to two factors: first, there are inherent differences in the pore structure of the two cores; second, the decrease in pressure within the core due to CO2 diffusion in the mesopores. The recovery of cores in different rounds varies with soaking time. Core YJ-7, soaked for 10 h, exhibited significantly higher recovery in the first cycle compared to the subsequent cycles. In contrast, core YJ-3, soaked for 15 h, demonstrated notably higher recovery in the second cycle.
The nonlinear relationship between soaking time and core recovery indicates that an optimal soaking time (10 h) exists to maximize the CO2 huff-n-puff recovery of the core.

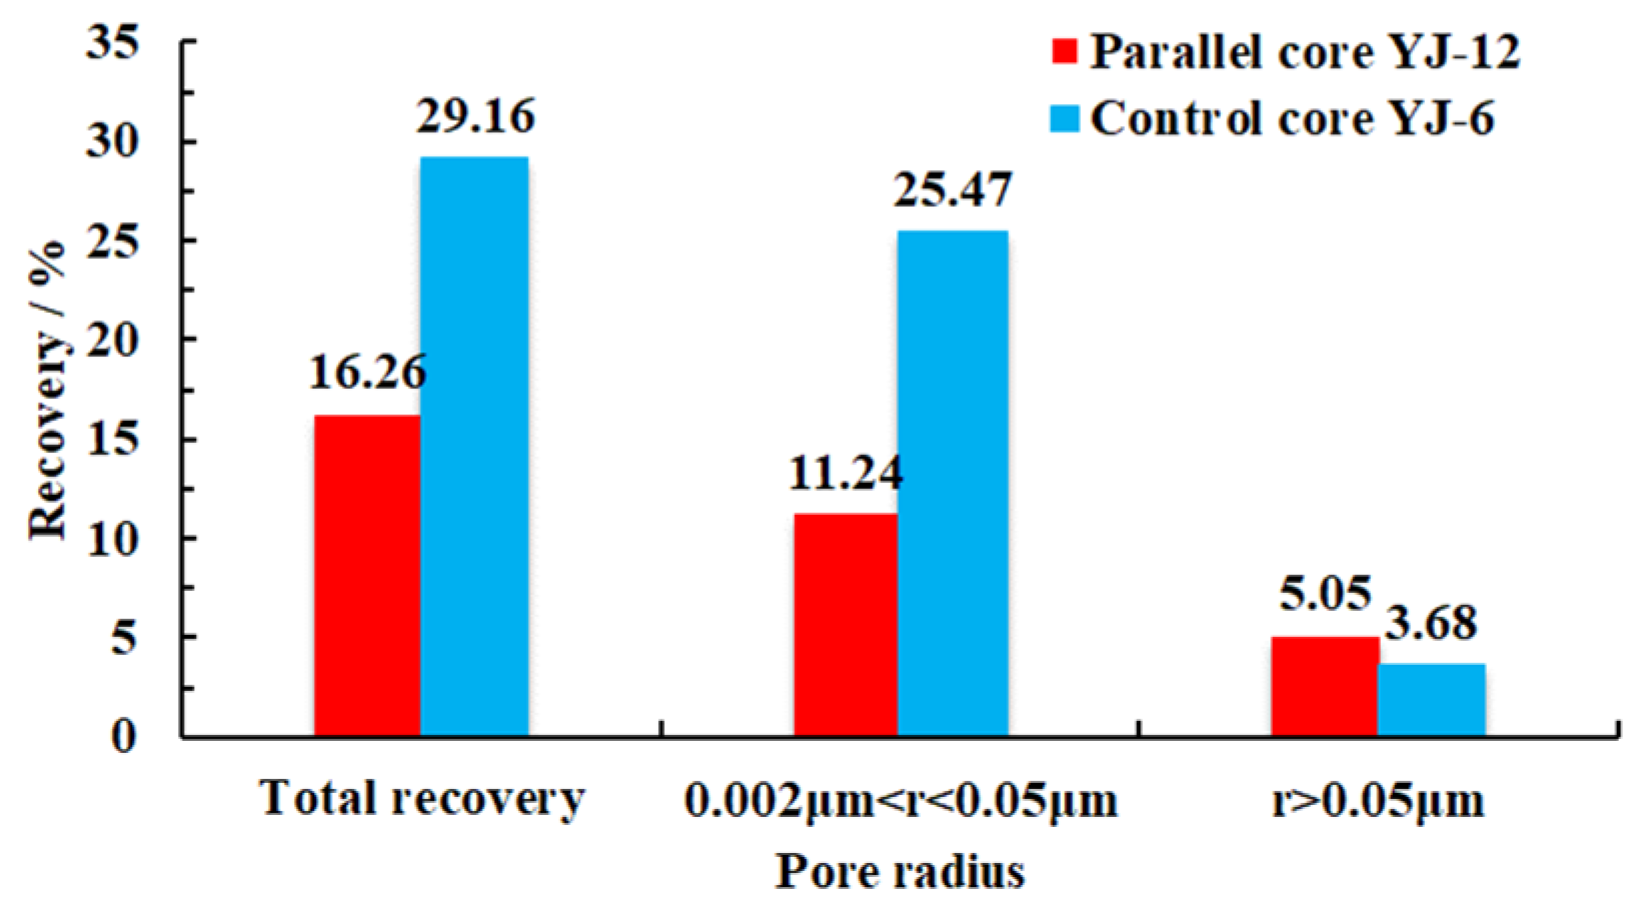
3.4. Effect of Fracture on CO2 Huff-n-Puff

During the volume fracturing process of shale oil reservoirs, the generation of a large number of artificial fractures enhances the heterogeneity of the reservoir. In order to clarify the effect of fracture heterogeneity on the core CO2 huff-n-puff recovery, three cores with different fractures were selected for parallel CO2 huff-n-puff experiments. The three cores are, respectively, the artificial fracture core (YJ-20), the natural fracture core (YJ-13), and the matrix core (YJ-12). The different fractures lead to large differences in the permeability of the three cores. Two matrix cores were selected for single core CO2 huff-n-puff as control experiments. The core parameters and CO2 huff-and-puff results are shown in Table 5.
It can be seen in Table 5 that the core huff-n-puff recovery increases significantly with the increase in core permeability. Specifically, cores with natural fractures show a recovery rate approximately two times higher than that of matrix cores, while cores with artificial fractures exhibit a recovery rate of about four times higher than that of the matrix cores.
The recovery of each pore in the parallel cores are shown in Figure 8. It is evident that the primary contribution to the core recovery originates from mesopores ranging from 2 nm to 50 nm, which collectively account for more than 70% of the total recovery.
During the CO2 huff-n-puff process, the oil from the macropores of each core was effectively recovered. However, the recovery of mesopores varies depending on the presence of fractures within the core. In artificial fracture cores, the recovery of mesopores reaches approximately 45%, whereas in natural fracture cores, it is around 29%. In matrix cores, the recovery is only about 11%. This disparity is attributed to the fractures in cores which significantly increase the contact area between CO2 and the core matrix, thereby greatly enhancing the recovery of mesopores. The difference in pore recovery between artificial fracture cores (YJ-20) and natural fracture cores (YJ-13) also indicates that as the fracture conductivity increases, the recovery of mesopores in the matrix also increases.
Compared with single core huff-n-puff experiments, the recovery rate of the natural fractured rock cores (YJ-13) in parallel huff-n-puff experiments shows no significant difference and the recovery rate of the matrix cores (YJ-12) is notably decreased. It can be seen from Figure 9 that the mesopores recovery of core YJ-6 is 25.45%, while the parallel matrix core is only 11.24%. This indicates that the heterogeneity reduces the CO2 huff-n-puff recovery of matrix cores.
The impact of heterogeneity on recovery is also reflected in each cycle. As shown in Figure 8, in the first two cycles of CO2 huff-n-puff, both artificial fracture cores and natural fracture cores exhibited substantial increases in recovery rates. Specifically, the CO2 huff-n-puff recovery reate of artificial fracture cores was 44.30%, while natural fracture cores achieved 14.51%. In contrast, matrix cores only attained a recovery rate of 7.76%. By the fourth cycle of CO2 huff-n-puff, the recovery rate for natural fractures increased marginally by 1.23%. Meanwhile, artificial fracture cores saw an increase of 5.73%, and matrix cores showed a more significant improvement of 7.87%. This indicates that CO2 flows through each core in sequence according to its permeability and extracts the oil from the core. The results of the multiple cycle recovery also indicate that the recovery of the matrix far from the fracture can be improved through more cycles of CO2 huff-n-puff.

4. Conclusions

This study combined HPMI, NMR, and CO2 huff-n-puff experiments to characterize the core nanopore production characteristics during CO2 huff-n-puff. The effects of fractures, injection pressure, and soaking time on core pore production were analyzed, and the main conclusions are as follows:
(1)
The Jimsar core pores are predominantly nanopores. Mesopores with a pore radius of between 2 nm and 50 nm accounted for more than 70%. NMR can characterize small pores in the core well. The conversion relationship between the nuclear magnetic resonance relaxation time and the pore radius of the core is r = 0.0055 × T 2 0.5893 .
(2)
When the injection pressure is higher than the miscible pressure, higher injection pressures positively influenced recovery rates through the oil washing efficiency of macropores, particularly in cores with higher permeability. Increasing the injection pressure cannot effectively increase the sweep range of CO2 in mesopores.
(3)
Longer soaking times were associated with increased CO2 diffusion and enhanced recovery from mesopores. However, excessive soaking time (more than 10 h) can result in core pore pressure reduction and a subsequent decrease in overall recovery. Thus, determining the optimal soaking time is essential to achieving maximum CO2 huff-n-puff recovery.
(4)
Artificial fractures can enhance the recovery of mesopores around them, resulting in core recovery of up to 60%. In shale oil reservoir development, expanding the area of fracturing transformation zones is essential for effectively improving CO2 huff-and-puff recovery. However, fractures contribute to reservoir heterogeneity, facilitating CO2 flow towards higher permeability regions, thereby decreasing the recovery of the matrix. To optimize recovery, multiple cycle of CO2 huff-and-puff are often necessary.

Author Contributions

Conceptualization, J.K. and S.Y.; methodology, S.Y. and W.Z.; validation, H.Z. and C.H.; formal analysis, X.W. and K.Y.; investigation, S.W.; resources, J.K.; data curation, L.W.; writing—original draft preparation, J.K.; writing—review and editing, S.Y.; visualization, W.Z.; supervision, H.Z.; project administration, J.K.; funding acquisition, J.K. All authors have read and agreed to the published version of the manuscript.

Funding

This research was funded by China National Petroleum Corporation Limited, grant number 2021DJ1807 and 2023ZZ24-01.

Data Availability Statement

The raw data supporting the conclusions of this article will be made available by the authors on request.

Conflicts of Interest

The authors declare that this study received funding from China National Petroleum Corporation Limited. Authors Jilun Kang, Wei Zhang, Hong Zhang, Changsong He, Xuechun Wang, Shuangbao Wei and Lilong Wang were employed by the Tuha Oilfield Company. The remaining authors declare that the research was conducted in the absence of any commercial or financial relationships that could be construed as a potential conflict of interest.

References

  1. Li, Q.; Liu, J.; Wang, S.; Guo, Y.; Han, X.; Li, Q.; Cheng, Y.; Dong, Z.; Li, X.; Zhang, X. Numerical insights into factors affecting collapse behavior of horizontal wellbore in clayey silt hydrate-bearing sediments and the accompanying control strategy. Ocean Eng. 2024, 297, 117029. [Google Scholar] [CrossRef]
  2. Wang, Y.; Li, Q.; Dong, W.; Li, Q.; Wang, F.; Bai, H.; Zhang, R.; Owusu, A.B. Effect of different factors on the yield of epoxy-terminated polydimethylsiloxane and evaluation of CO2 thickening. RSC Adv. 2018, 8, 39787–39796. [Google Scholar] [CrossRef]
  3. Jia, B.; Tsau, J.; Barati, R. A review of the current progress of CO2 injection EOR and carbon storage in shale oil reservoirs. Fuel 2019, 236, 404–427. [Google Scholar] [CrossRef]
  4. Shi, W.; Zhu, L.; Guo, M.; Huang, Z.; Wang, G.; Lin, L.; He, L.; Liao, Y.; He, H.; Gong, J. Assessment of CO2 fracturing in China’s shale oil reservoir: Fracturing effectiveness and carbon storage potential. Resour. Conserv. Recycl. 2023, 197, 107101. [Google Scholar] [CrossRef]
  5. Xu, Y.; Lun, Z.; Pan, Z.; Wang, H.; Zhou, X.; Zhao, C.; Zhang, D. Occurrence space and state of shale oil: A review. J. Pet. Sci. Eng. 2022, 211, 110183. [Google Scholar] [CrossRef]
  6. Feng, Q.; Xu, S.; Xing, X.; Zhang, W.; Wang, S. Advances and challenges in shale oil development: A critical review. Adv. Geo-Energy Res. 2020, 4, 406–418. [Google Scholar] [CrossRef]
  7. Taheri-Shakib, J.; Kantzas, A. A comprehensive review of microwave application on the oil shale: Prospects for shale oil production. Fuel 2021, 305, 121519. [Google Scholar] [CrossRef]
  8. Zou, C.; Yang, Z.; Cui, J.; Zhu, R.; Hou, L.; Tao, S.; Yuan, X.; Wu, S.; Lin, S.; Wang, L.; et al. Formation mechanism, geological characteristics and development strategy of nonmarine shale oil in China. Pet. Explor. Dev. 2013, 40, 14–26. [Google Scholar] [CrossRef]
  9. Yu, H.; Lu, X.; Fu, W.; Wang, Y.; Xu, H.; Xie, Q.; Qu, X.; Lu, J. Determination of minimum near miscible pressure region during CO2 and associated gas injection for tight oil reservoir in Ordos Basin, China. Fuel 2020, 263, 116737. [Google Scholar] [CrossRef]
  10. Hu, J.; Yang, S.; Yang, K.; Deng, H.; Wang, M.; Li, J.; Gao, X. Enhanced gas recovery coupled with CO2 sequestration in tight sandstone reservoirs with different pore-throat structures. Energy Fuels 2024, 38, 12005–12023. [Google Scholar] [CrossRef]
  11. Gao, X.; Yang, S.; Shen, B.; Wang, J.; Tian, L.; Li, S. Effects of CO2 variable thermophysical properties and phase behavior on CO2 geological storage: A numerical case study. Int. J. Heat Mass Transf. 2024, 221, 125073. [Google Scholar] [CrossRef]
  12. Gao, X.; Yang, S.; Tian, L.; Shen, B.; Bi, L.; Zhang, Y.; Wang, M.; Rui, Z. System and multi-physics coupling model of liquid-CO2 injection on CO2 storage with enhanced gas recovery (CSEGR) framework. Energy 2024, 294, 130951. [Google Scholar] [CrossRef]
  13. Shi, J.; Xue, Z.; Durucan, S. Supercritical CO2 core flooding and imbibition in Tako sandstone—Influence of sub-core scale heterogeneity. Int. J. Greenh. Gas Control 2011, 5, 75–87. [Google Scholar] [CrossRef]
  14. Altawati, F.; Emadi, H.; Khalil, R.; Heinze, L.; Menouar, H. An experimental investigation of improving Wolfcamp shale-oil recovery using liquid-N2-assisted N2 and/or CO2 huff-n-puff injection technique. Fuel 2022, 324, 124450. [Google Scholar] [CrossRef]
  15. Gamadi, T.D.; Sheng, J.J.; Soliman, M.Y.; Menouar, H.; Watson, M.C.; Emadibaladehi, H. An experimental study of cyclic CO2 injection to improve shale oil recovery. In Proceedings of the SPE Improved Oil Recovery Symposium, Tulsa, OK, USA, 12–16 April 2014. [Google Scholar]
  16. Zuloaga, P.; Yu, W.; Miao, J.; Sepehrnoori, K. Performance evaluation of CO2 huff-n-puff and continuous CO2 injection in tight oil reservoirs. Energy 2017, 134, 181–192. [Google Scholar] [CrossRef]
  17. Li, L.; Zhang, Y.; Sheng, J.J. Effect of the injection pressure on enhancing oil recovery in shale cores during the CO2 huff-n-puff process when it is above and below the minimum miscibility pressure. Energy Fuels 2017, 31, 3856–3867. [Google Scholar] [CrossRef]
  18. Song, C.; Yang, D. Experimental and numerical evaluation of CO2 huff-n-puff processes in Bakken formation. Fuel 2017, 190, 145–162. [Google Scholar] [CrossRef]
  19. Tang, X.; Li, Y.; Han, X.; Zhou, Y.; Zhan, J.; Xu, M.; Zhou, R.; Cui, K.; Chen, X.; Wang, L. Dynamic characteristics and influencing factors of CO2 huff and puff in tight oil reservoirs. Pet. Explor. Dev. 2021, 48, 946–955. [Google Scholar] [CrossRef]
  20. Zhou, X.; Yuan, Q.; Peng, X.; Zeng, F.; Zhang, L. A critical review of the CO2 huff-n-puff process for enhanced heavy oil recovery. Fuel 2018, 215, 813–824. [Google Scholar] [CrossRef]
  21. Zhou, X.; Li, X.; Shen, D.; Shi, L.; Zhang, Z.; Sun, X.; Jiang, Q. CO2 huff-n-puff process to enhance heavy oil recovery and CO2 storage: An integration study. Energy 2022, 239, 122003. [Google Scholar] [CrossRef]
  22. Gao, Y.; Li, Q.; He, X.; Yu, H.; Wang, Y. Quantitative evaluation of shale-oil recovery during CO2 huff-n-puff at different pore scales. Energy Fuels 2021, 35, 16607–16616. [Google Scholar] [CrossRef]
  23. Huang, X.; Li, X.; Zhang, Y.; Li, T.; Zhang, R. Microscopic production characteristics of crude oil in nano-pores of shale oil reservoirs during CO2 huff and puff. Pet. Explor. Dev. 2022, 49, 636–643. [Google Scholar] [CrossRef]
  24. Liu, J.; Li, H.; Tan, Q.; Liu, S.; Zhao, H.; Wang, Z. Quantitative study of CO2 huff-n-puff enhanced oil recovery in tight formation using online NMR technology. J. Pet. Sci. Eng. 2022, 216, 110688. [Google Scholar] [CrossRef]
  25. Wu, J.; Yang, S.; Li, Q.; Huang, C.; Wang, Z.; Zhou, W.; Chapman, S.; Colledge, M. New insight into imbibition micro mechanisms and scaling model in fossil hydrogen energy development of tight reservoirs based on NMR. Int. J. Hydrogen Energy 2024, 49, 964–977. [Google Scholar] [CrossRef]
  26. Chen, Y.; Zhi, D.; Qin, J.; Song, P.; Zhao, H.; Wang, F. Experimental study of spontaneous imbibition and CO2 huff and puff in shale oil reservoirs with NMR. J. Pet. Sci. Eng. 2022, 209, 109883. [Google Scholar] [CrossRef]
  27. Zhu, J.; Chen, J.; Wang, X.; Fan, L.; Nie, X. Experimental investigation on the characteristic mobilization and remaining oil distribution under CO2 huff-n-puff of Chang 7 continental shale oil. Energies 2021, 14, 2782. [Google Scholar] [CrossRef]
  28. Wan, T.; Zhang, J.; Jing, Z. Experimental evaluation of enhanced shale oil recovery in pore scale by CO2 in Jimusar reservoir. J. Pet. Sci. Eng. 2022, 208, 109730. [Google Scholar] [CrossRef]
  29. Chen, C.; Balhoff, M.; Mohanty, K.K. Effect of reservoir heterogeneity on improved shale oil recovery by CO2 huff-n-puff. In Proceedings of the SPE Unconventional Resources Conference-USA, The Woodlands, TX, USA, 10–12 April 2013. [Google Scholar]
  30. SY/T 5368-2000; Thin Section Examination of Shale and Mudstone. State Bureau of Metallurgical Industry: Beijing, China, 2000.
  31. GB/T 21650.1-2008; Pore Size Distribution and Porosity of Solid Materials by Mercury Porosimetry and Gas Adsorption—Part 1: Mercury Porosimetry. Standardization Administration of China: Beijing, China, 2008.
  32. Chen, H.; Li, B.; Duncan, I.; Elkhider, M.; Liu, X. Empirical correlations for prediction of minimum miscible pressure and near-miscible pressure interval for oil and CO2 systems. Fuel 2020, 278, 118272. [Google Scholar] [CrossRef]
  33. Elturki, M.; Imqam, A. Experimental investigation of asphaltene deposition and its impact on oil recovery in Eagle Ford shale during miscible and immiscible CO2 huff-n-puff gas injection. Energy Fuels 2023, 37, 2993–3010. [Google Scholar] [CrossRef]
  34. Lee, J.H.; Lee, K.S. Investigation of asphaltene-derived formation damage and nano-confinement on the performance of CO2 huff-n-puff in shale oil reservoirs. J. Pet. Sci. Eng. 2019, 182, 106304. [Google Scholar] [CrossRef]
  35. Wang, F.; Yang, K.; Cai, J. Fractal characterization of tight oil reservoir pore structure using nuclear magnetic resonance and mercury intrusion porosimetry. Fractals 2018, 26, 1840017. [Google Scholar] [CrossRef]
Figure 1. Casting thin sheet and contact angles of Jimsar Lucaogou Formation cores: (a,b) are casting thin sheet; (c) is the contact angles between water and core slices.
Processes 12 01665 g001
Figure 3. Capillary force curve and core pore distribution: (a) capillary force curve; (b) core pore distribution.
Processes 12 01665 g003
Figure 4. Core NMR T2 curve and mercury intrusion curve: (a) curves of Core YJ-24; (b) curves of Core YJ-42.
Processes 12 01665 g004
Figure 5. Conversion of pore radius and NMR relaxation time: (a) fitting curve of Core YJ-24; (b) fitting curve of Core YJ-42.
Processes 12 01665 g005
Figure 6. Recovery and minimum operating radius of core under different injection pressures: (a,c,e,g) NMR T2 spectra of saturated state and various CO2 huff-n-puff cycles of YJ-7, YJ-40, YJ-6, and YJ-2, respectively. (b,d,f,h) pore recovery and total recovery of each cycle of YJ-7, YJ-40, YJ-6, and YJ-2, respectively.
Processes 12 01665 g006
Figure 7. Recovery and minimum operating radius of cores CO2 huff-n-puff at different soaking times: (a) recovery of each CO2 huff-n-puff cycle of three cores; (b) NMR T2 spectra and minimum operating radius of core YJ-10 during soaking for 5 h; (c) NMR T2 spectra and minimum operating radius of core YJ-7 during soaking for 10 h; (d) NMR T2 spectra and minimum operating radius of core YJ-3 during soaking for 15 h.
Processes 12 01665 g007
Figure 8. Pore recovery of parallel cores CO2 huff-n-puff: (a) pore recovery and total recovery of each cycle of parallel core YJ-20; (b) pore recovery and total recovery of each cycle of parallel core YJ-13; (c) pore recovery and total recovery of each cycle of parallel core YJ-12.
Processes 12 01665 g008
Figure 9. Comparison of pore recovery between parallel core CO2 huff-n-puff and single core CO2 huff-n-puff.
Processes 12 01665 g009
Table 1. Experiment cores parameters.
Experiment PurposeCore NO.Porosity/%Permeability/mDExperimental Type
Pore throat structure analysisYJ-2410.880.038High-pressure mercury injection + nuclear magnetic resonance
YJ-426.820.008
Injection pressure effect studyYJ-74.070.005CO2 huff-n-puff + nuclear magnetic resonance
YJ-403.050.008
YJ-64.490.019
YJ-26.800.040
Soaking time effect studyYJ-102.170.004CO2 huff-n-puff + nuclear magnetic resonance
YJ-74.070.005
YJ-36.060.004
Heterogeneity effect studyYJ-206.3375.47CO2 huff-n-puff + nuclear magnetic resonance
YJ-133.846.39
YJ-123.130.012
YJ-92.085.64
YJ-64.490.019
Table 2. Physical parameters of rock cores measured by HPMI experiments.
Core No.Permeability/mDPorosity/%Maximum Pore Radius/μmAverage Pore Radius/μmSorting CoefficientSkewnessHomogeneity CoefficientMaximum Mercury Saturation/%Mercury Removal Efficiency/%
YJ-240.03810.880.5370.0972.27−0.4880.18194.2524.42
YJ-420.0086.820.0530.0161.15−0.0480.30797.6110.02
Table 3. Core recovery under different injection pressures.
Core No.Porosity/%Permeability/mDInjection Pressure/MPaSoaking Time/hCycle of CO2 Huff-n-PuffRecovery/%
YJ-74.070.0052010330.54
YJ-403.050.0082510331.48
YJ-64.490.0192010329.14
YJ-26.800.0402510337.13
Table 4. Core CO2 huff-n-puff recovery rate under different soaking times.
Core No.Porosity/%Permeability/mDInjection Pressure/MPaSoaking Time/hCycle of CO2 Huff-n-PuffRecovery/%
YJ-102.170.004205316.18
YJ-74.070.0052010330.54
YJ-36.060.0042015326.29
Table 5. Core parameters and recovery of core CO2 huff-n-puff.
Core No.Experiment TypePorosity/%Permeability/mDInjection Pressure/MPaSoaking Time/hCycle of CO2 Huff-n-PuffRecovery/%
YJ-20Parallel CO2 huff-n-puff experiments6.3375.472010460.19
YJ-133.846.392010430.20
YJ-123.130.0122010416.00
YJ-9Control experiments2.085.642010427.79
YJ-6Control experiments4.490.0192010429.16
Disclaimer/Publisher’s Note: The statements, opinions and data contained in all publications are solely those of the individual author(s) and contributor(s) and not of MDPI and/or the editor(s). MDPI and/or the editor(s) disclaim responsibility for any injury to people or property resulting from any ideas, methods, instructions or products referred to in the content.

