
Mathematical Model of the Migration of the CO2-Multicomponent Gases in the Inorganic Nanopores of Shale

Abstract
:1. Introduction
2. Mathematical Model
2.1. Basic Assumption
- (1)
- It is assumed that multiple parallel capillaries with equal diameters exist in shale reservoirs. Due to the complexity of actual rock pore structures, we make certain assumptions to achieve a theoretical mathematical description. We primarily refer to the capillary model [27] used in the oil and gas industry, which is widely applied and well-established in this field;
- (2)
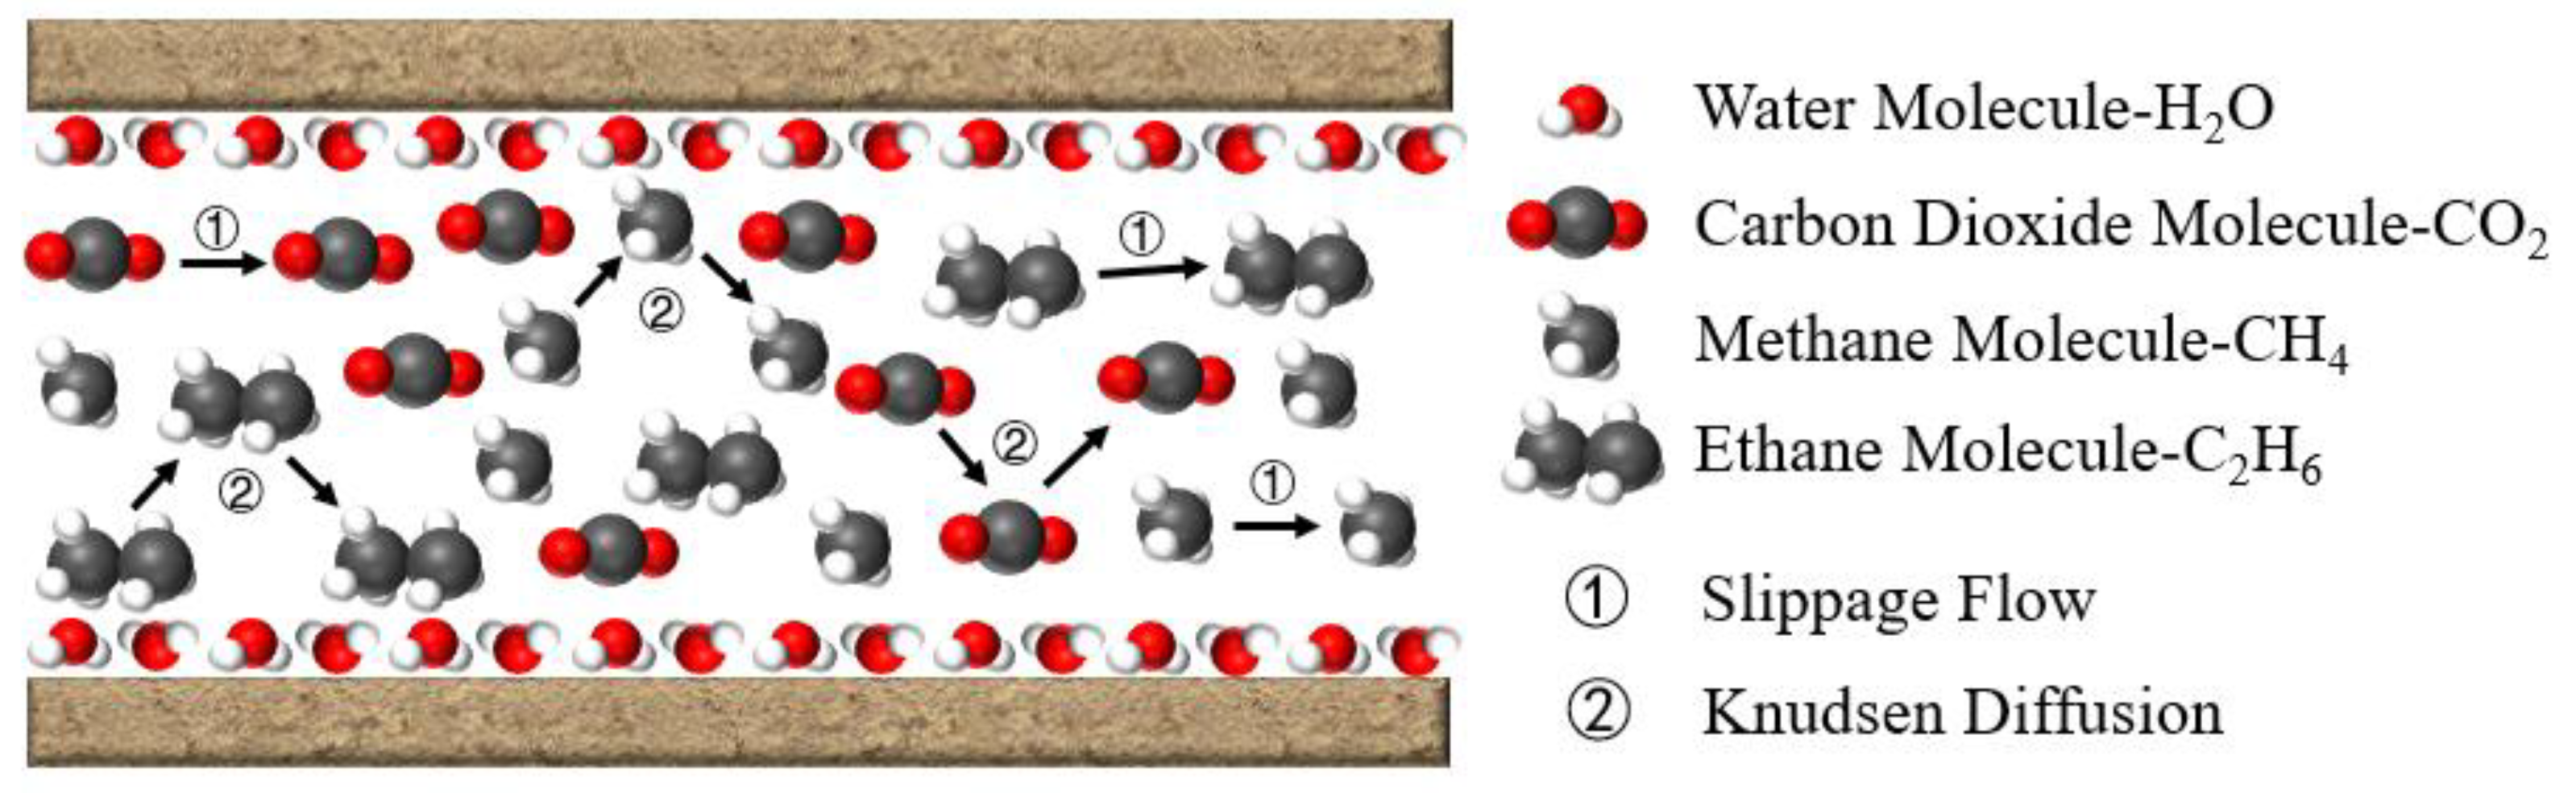
- Multiple component fluids of CO2, CH4, C2H6 and H2O are contained in the pores;
- (3)
- Due to the existence of the adsorbed water film, the adsorption volume of other gas components on the wall can be ignored;
- (4)
- The water film has no compressibility [28];
- (5)
- The dissolution of the water film on the gas components CO2, CH4, and C2H6 can be ignored;
- (6)
- The gas percolation process is isothermal percolation;
- (7)
- The influence of gravity can be neglected.
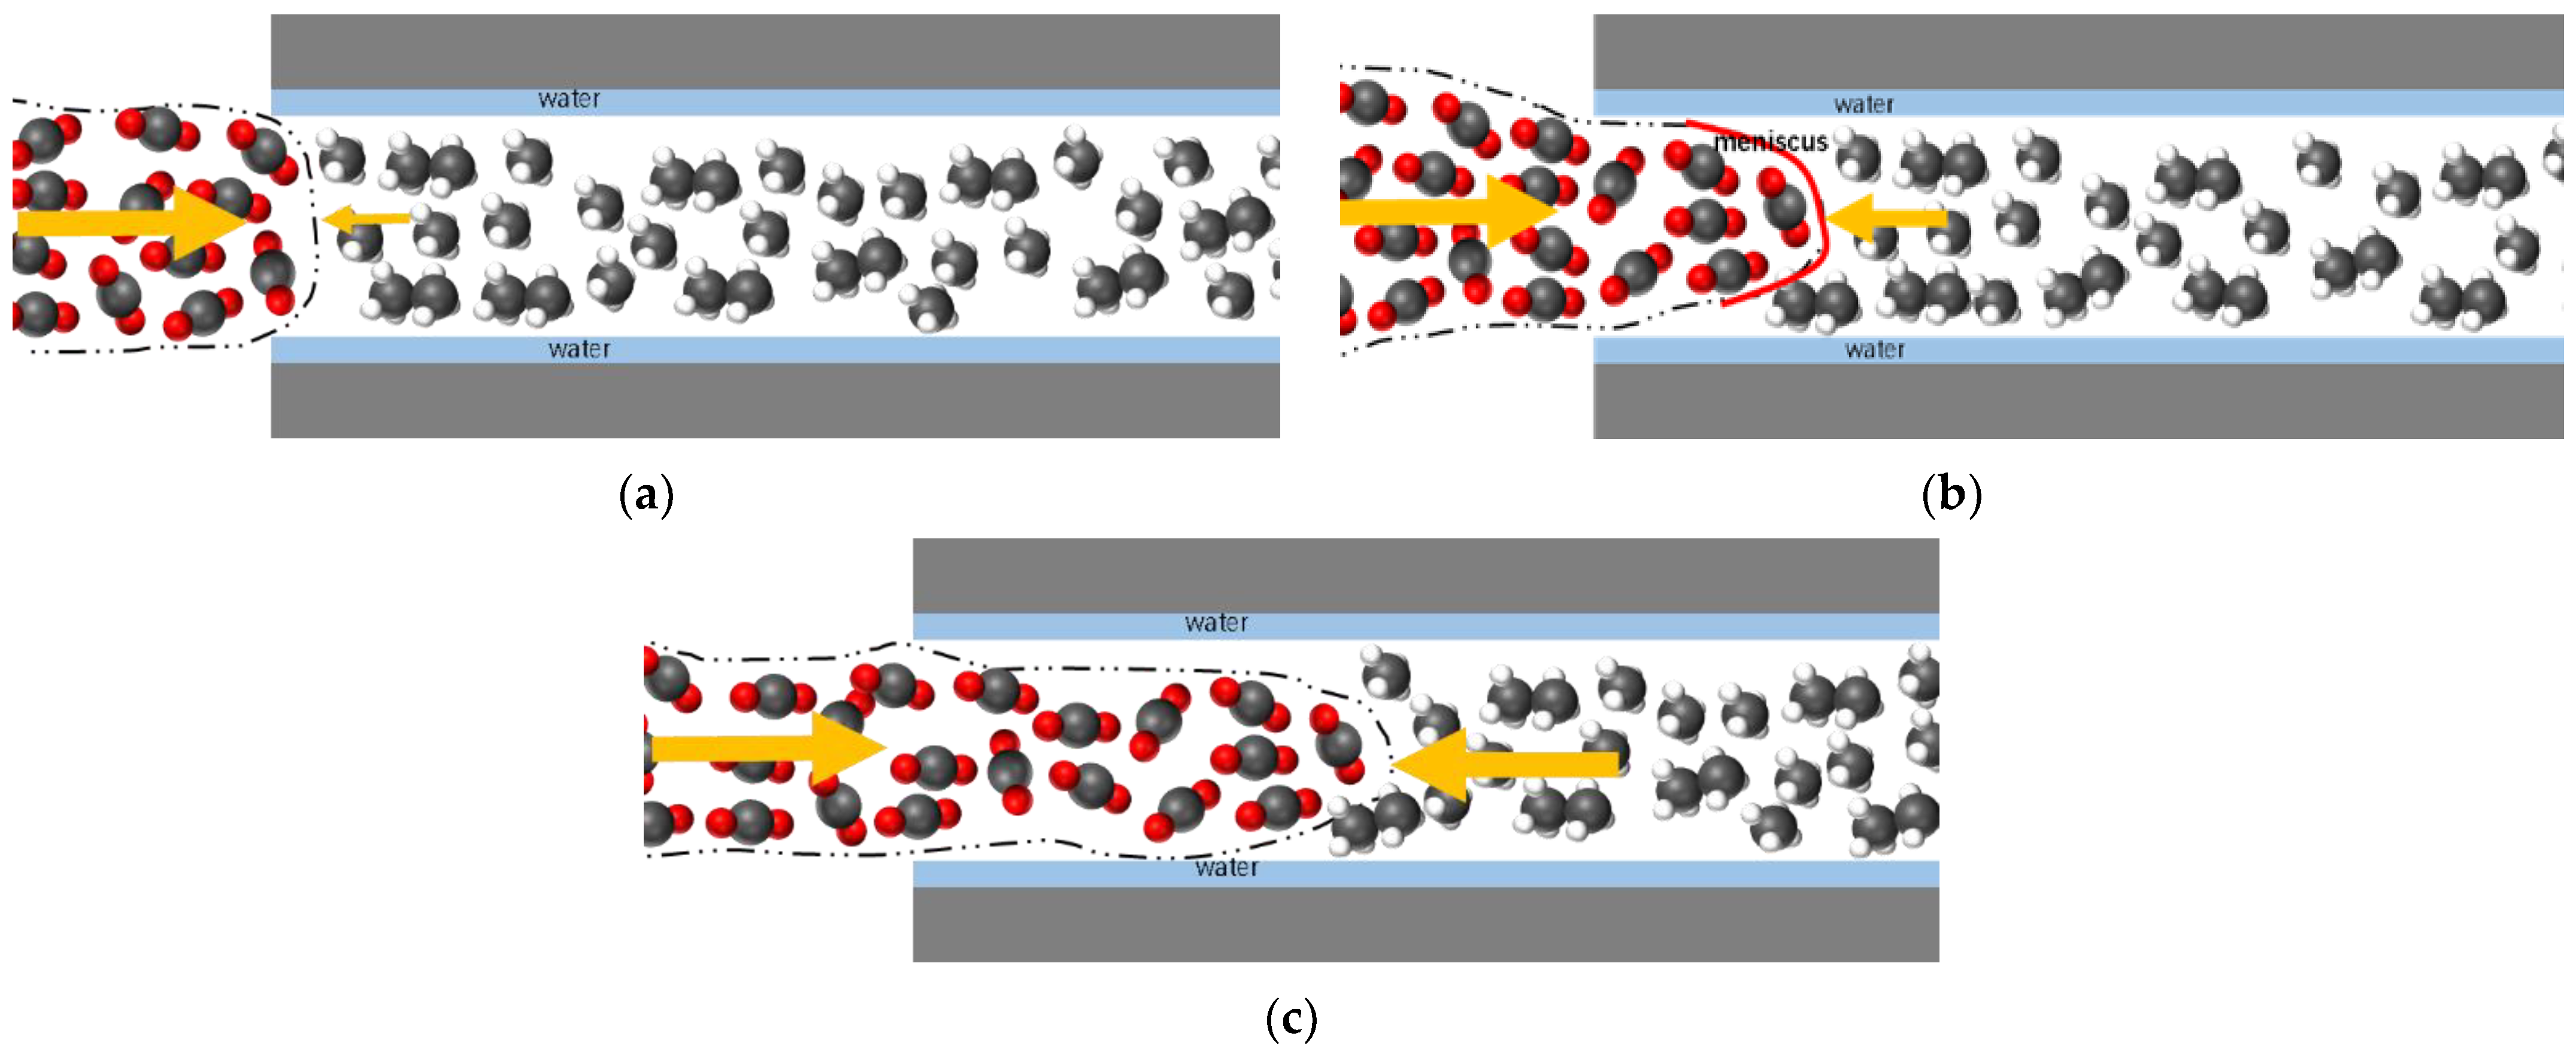
2.2. Physical Model
2.3. Knudsen Number of Multi-Component Gases in Inorganic Nanopores
2.4. Mathematical Model of Multi-Component Gas Slippage Flow
2.5. Mathematical Model of Knudsen Diffusion in Multi-Component Gases
2.6. Multi-Component Gas Bulk Phase Apparent Permeability Model
3. Results and Discussion
3.1. Effects of Contribution of Different Migration Mechanisms on Apparent Permeability
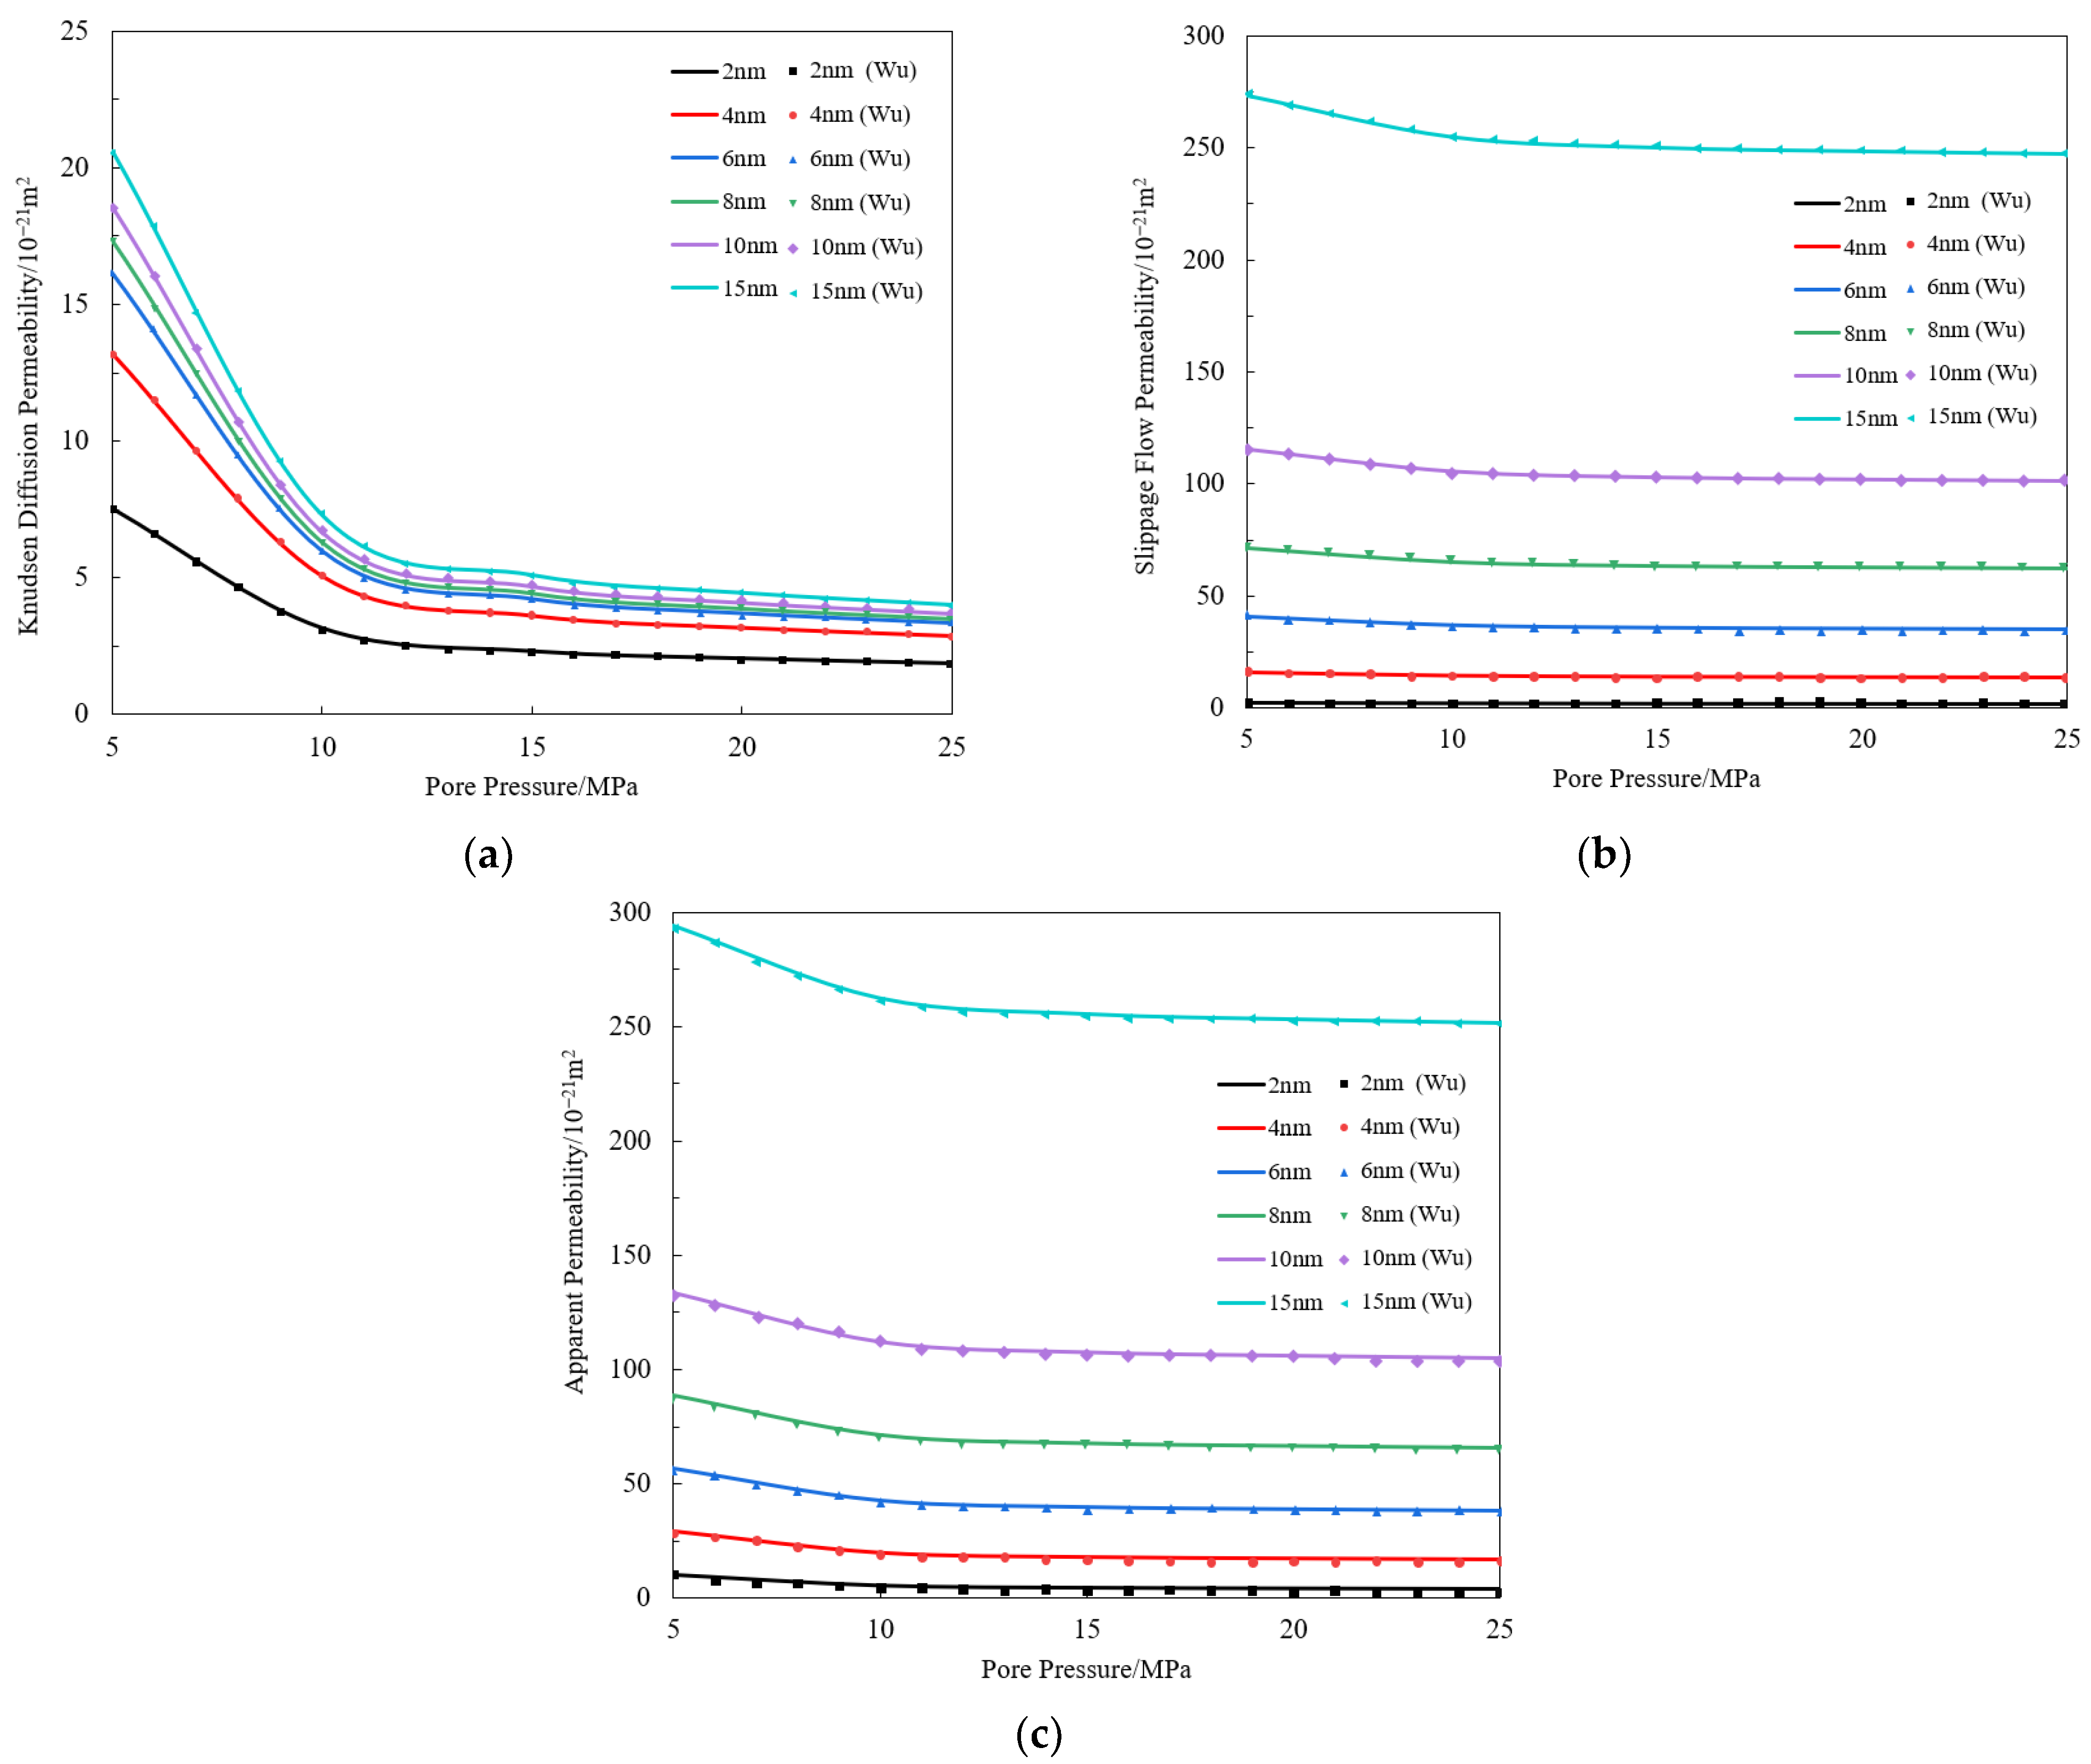
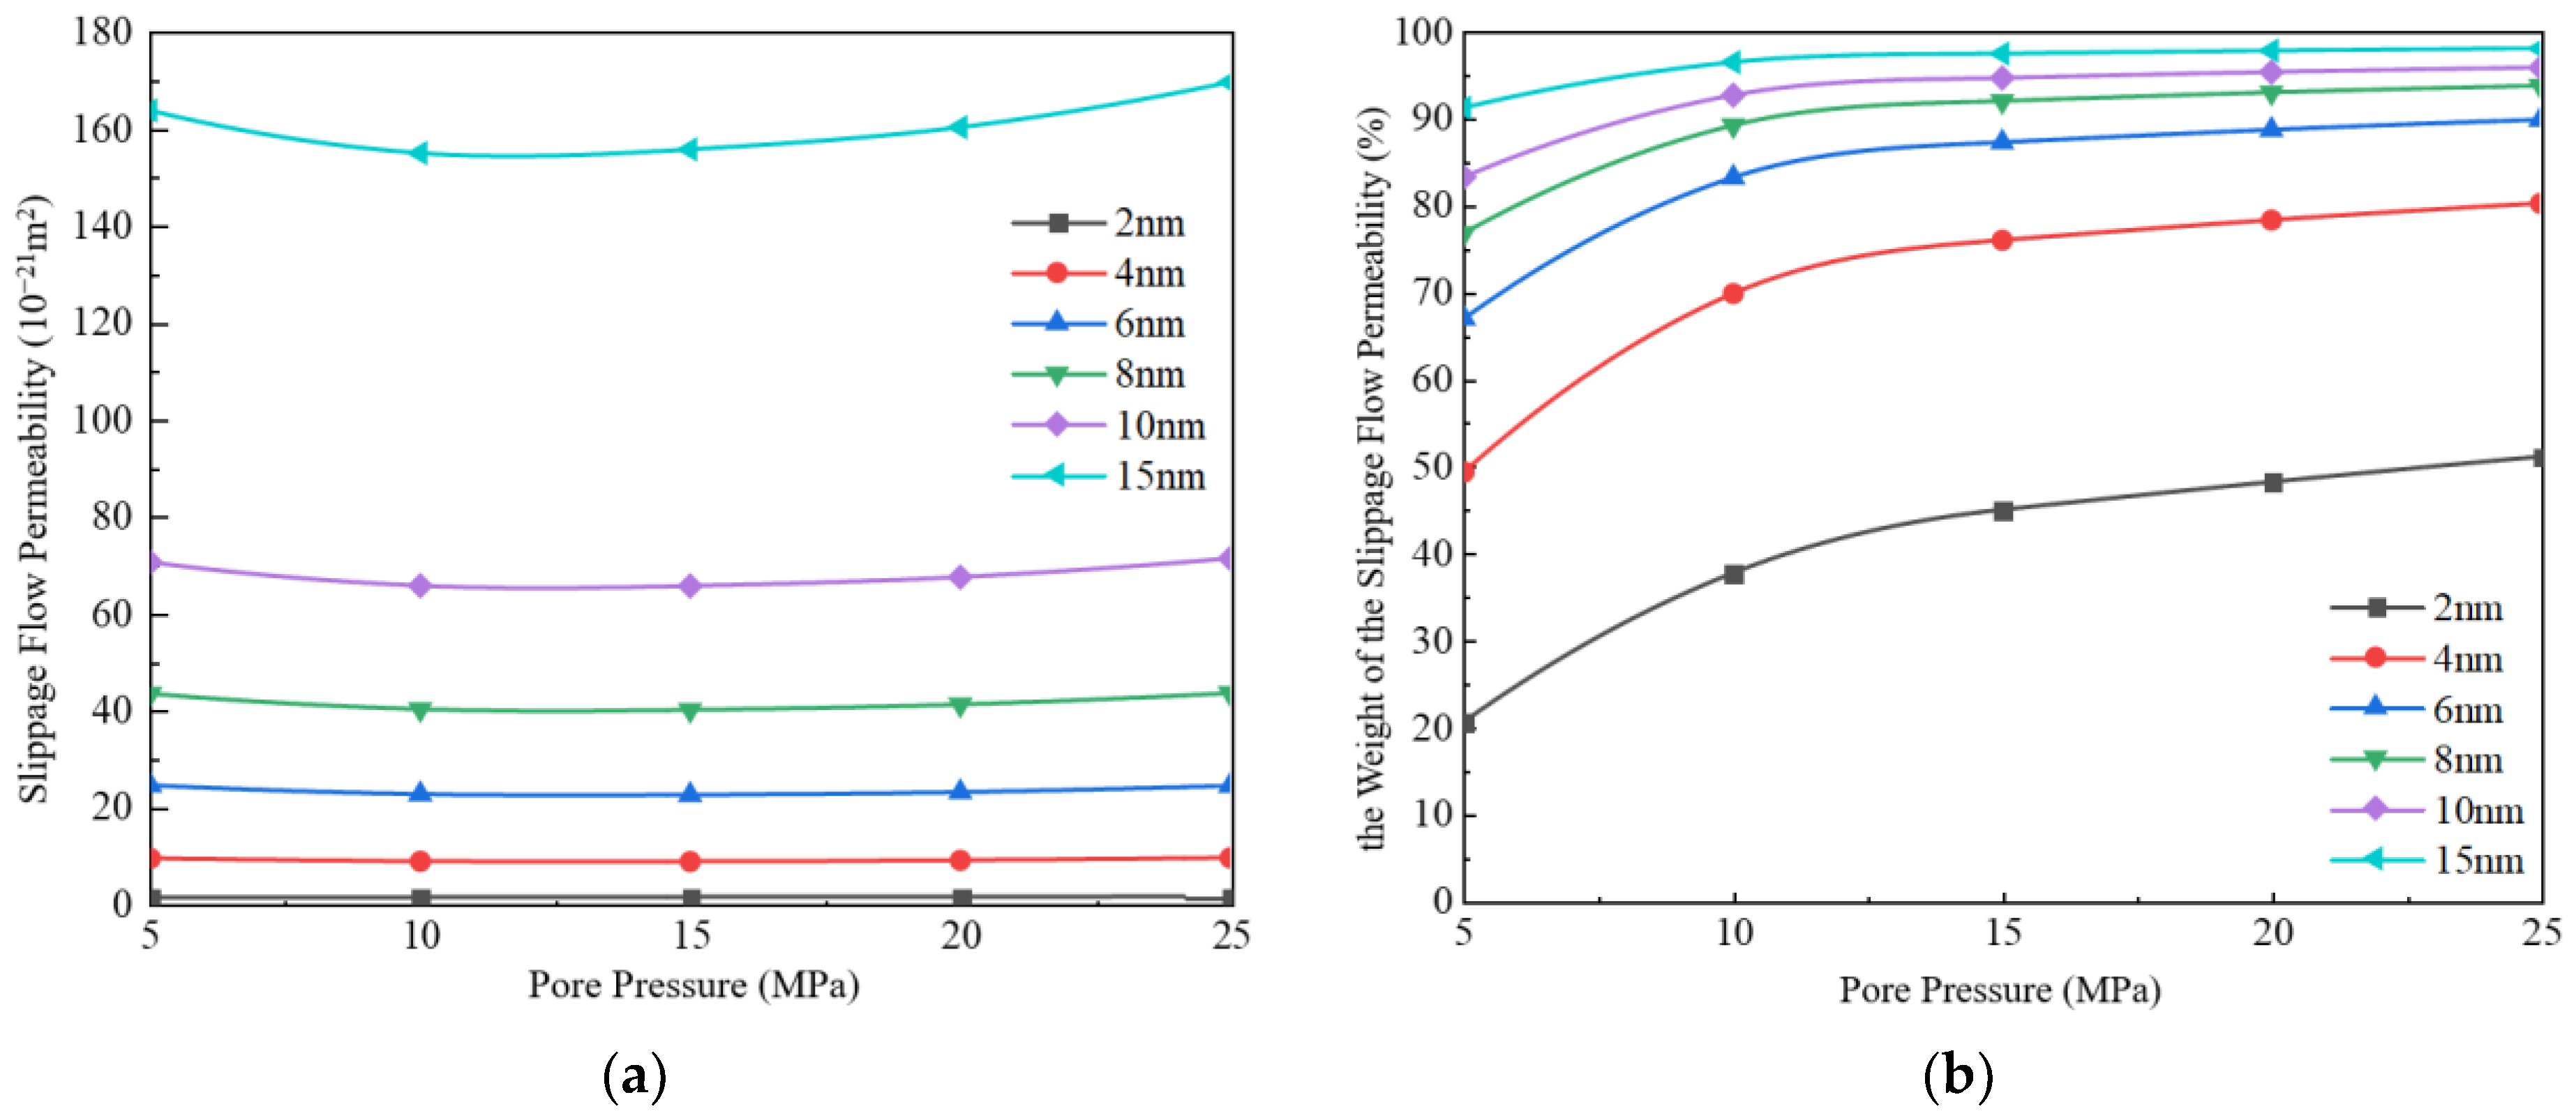
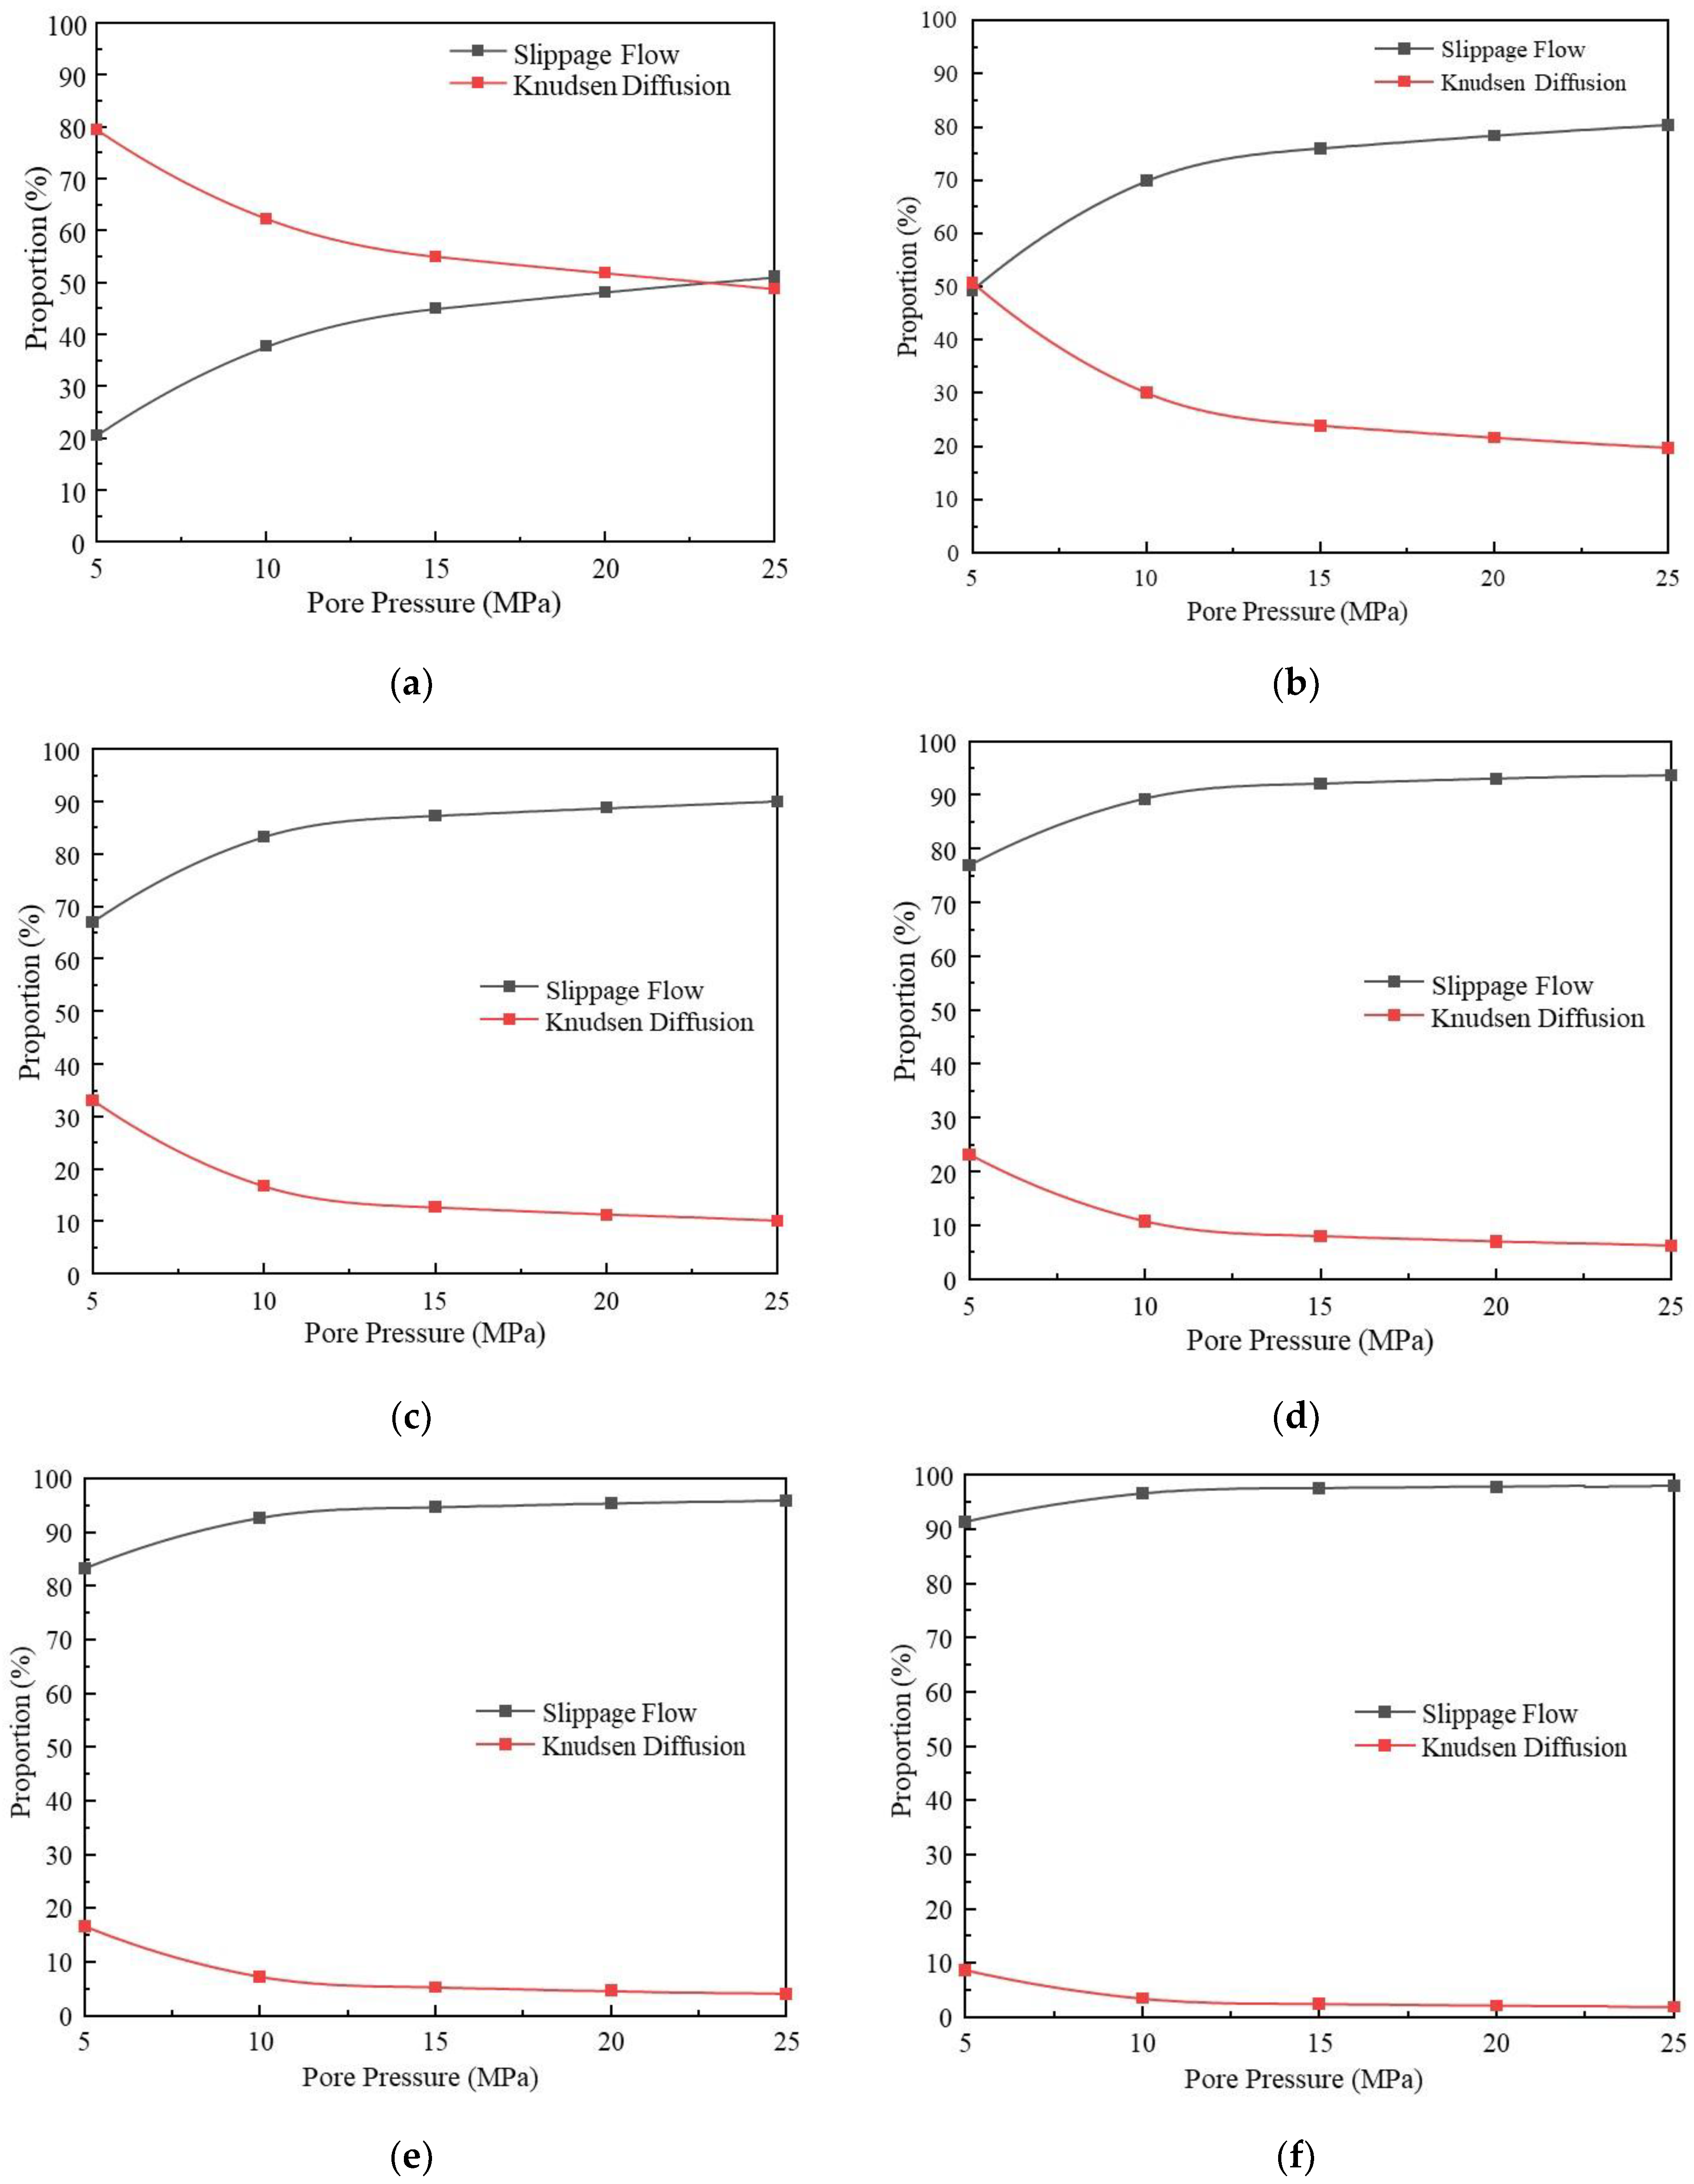
3.1.1. Slippage Flow
3.1.2. Knudsen Diffusion
3.1.3. Comparative Analysis of the Contribution of Different Migration Mechanisms
3.2. Impact of Different Pore Sizes on Apparent Permeability
3.3. Impact of Different Component Proportions on Apparent Permeability
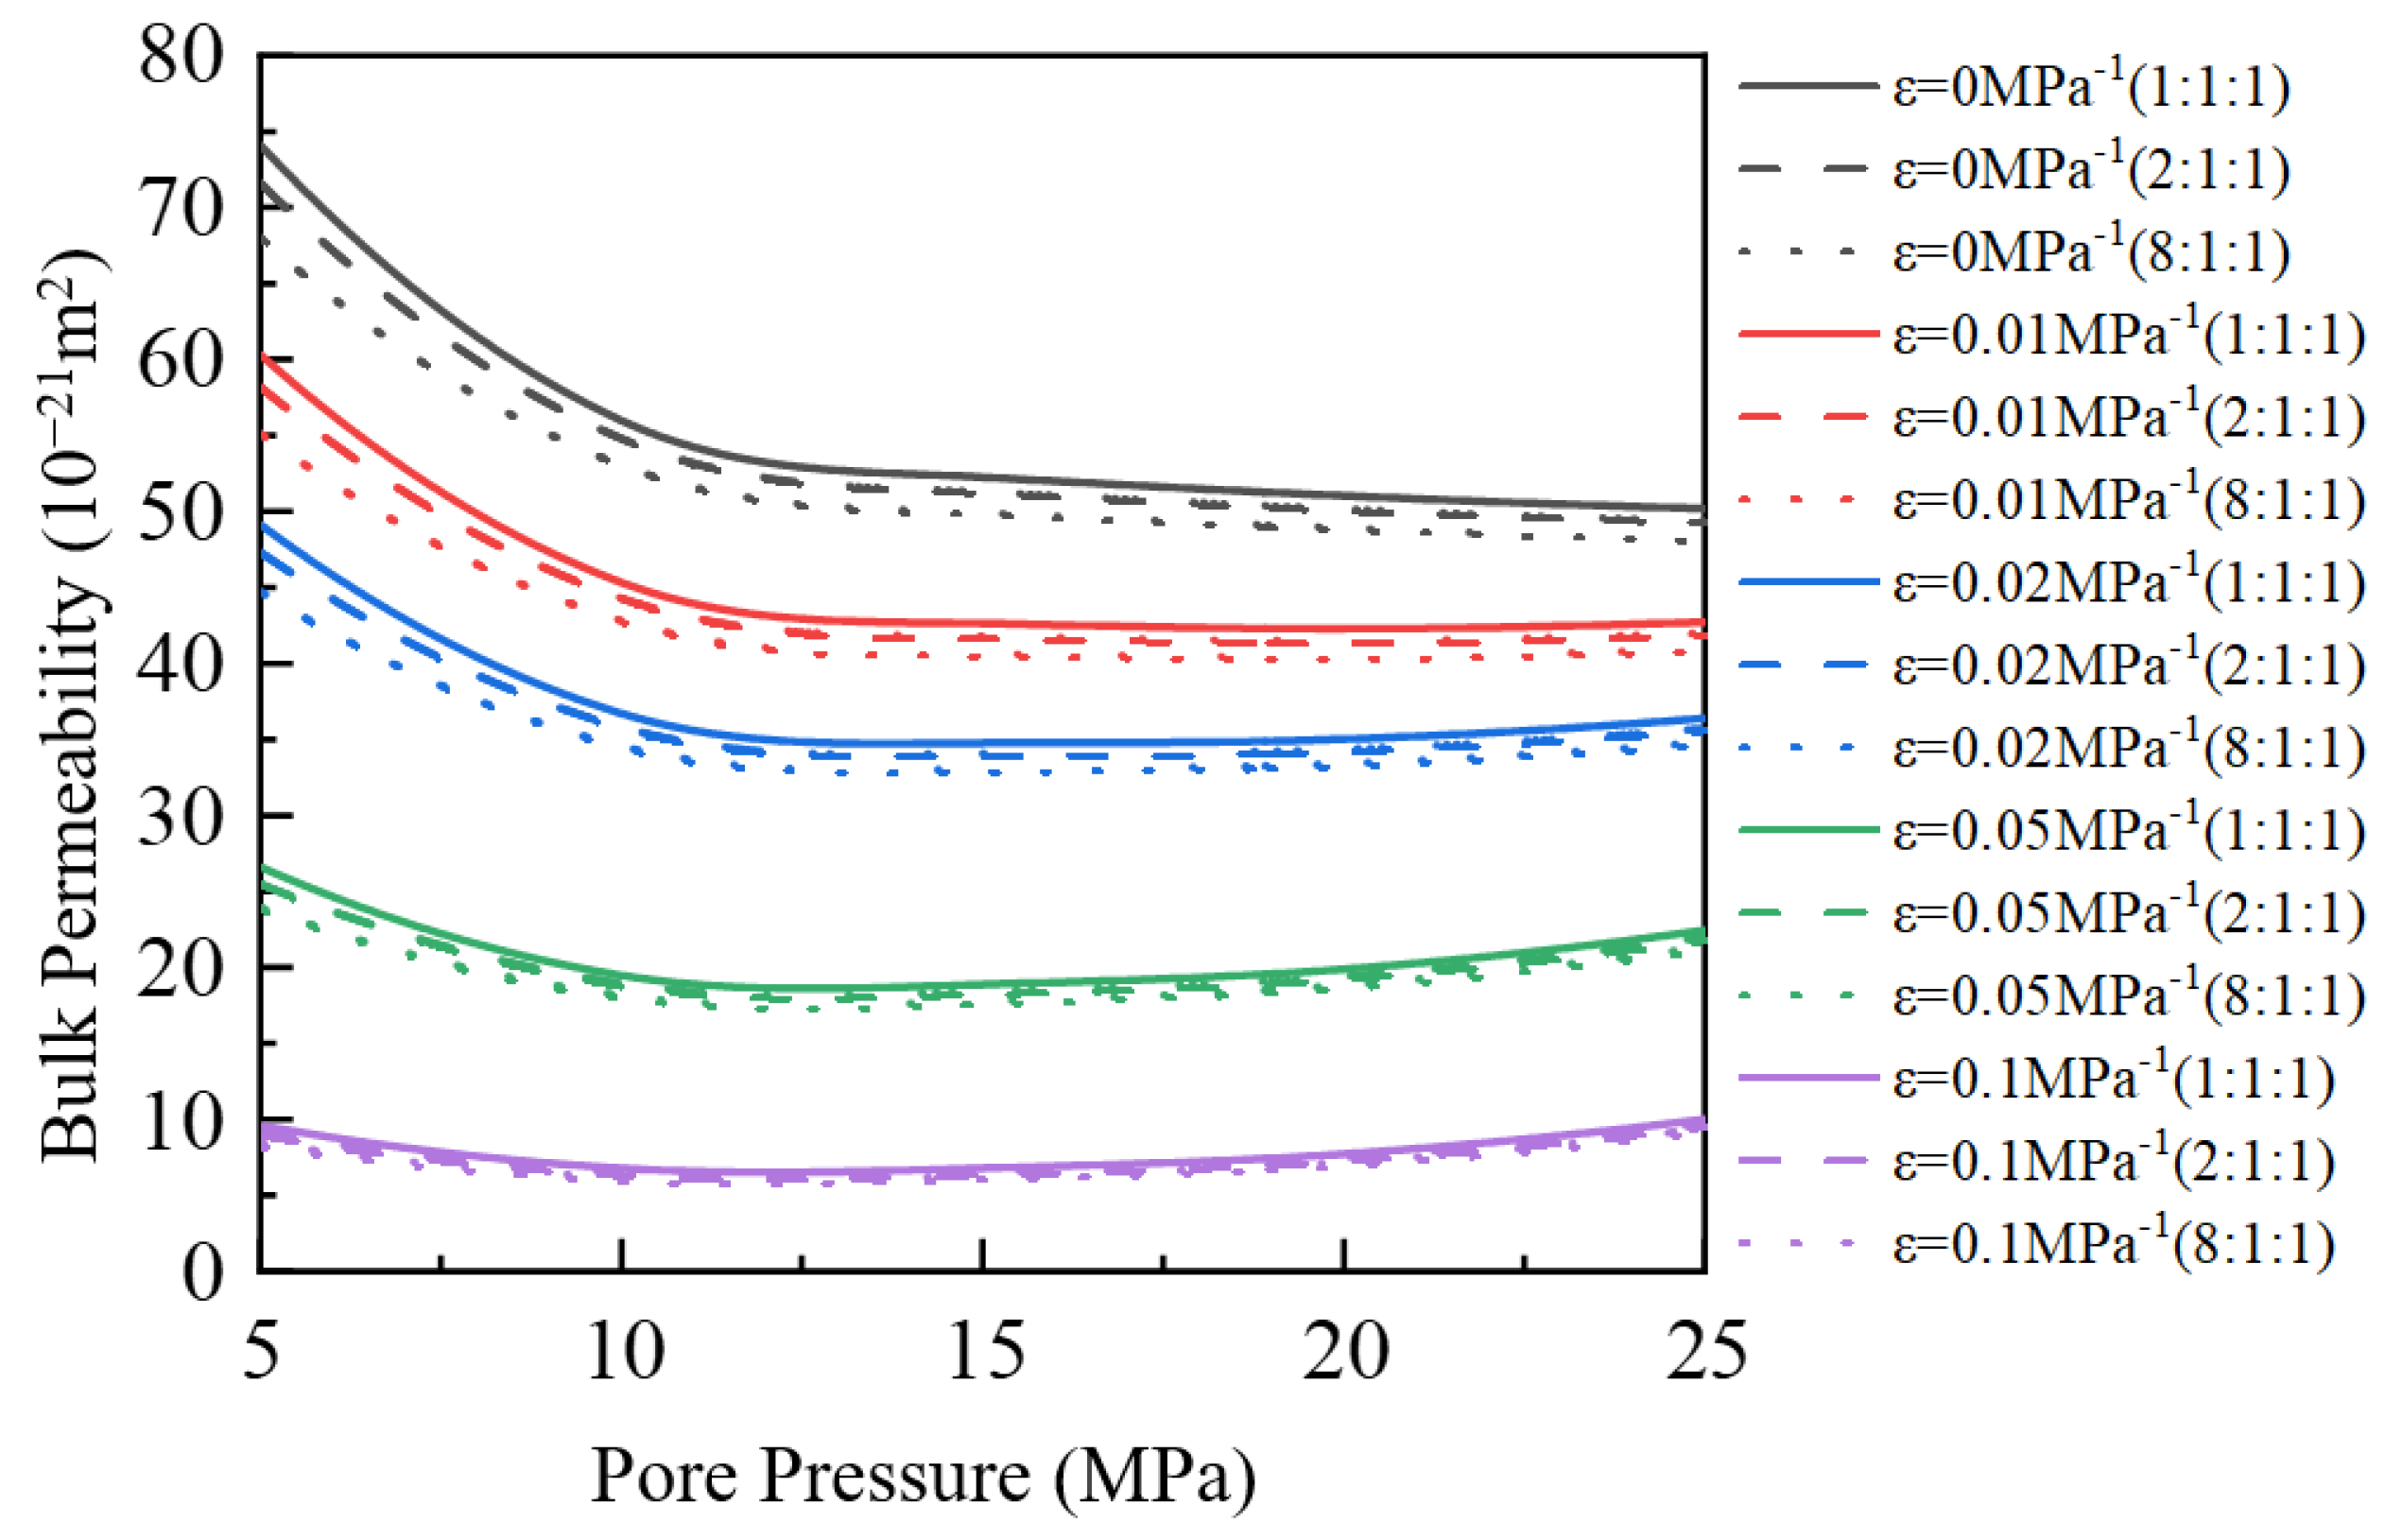
3.4. Impact of Stress Deformation on Apparent Permeability
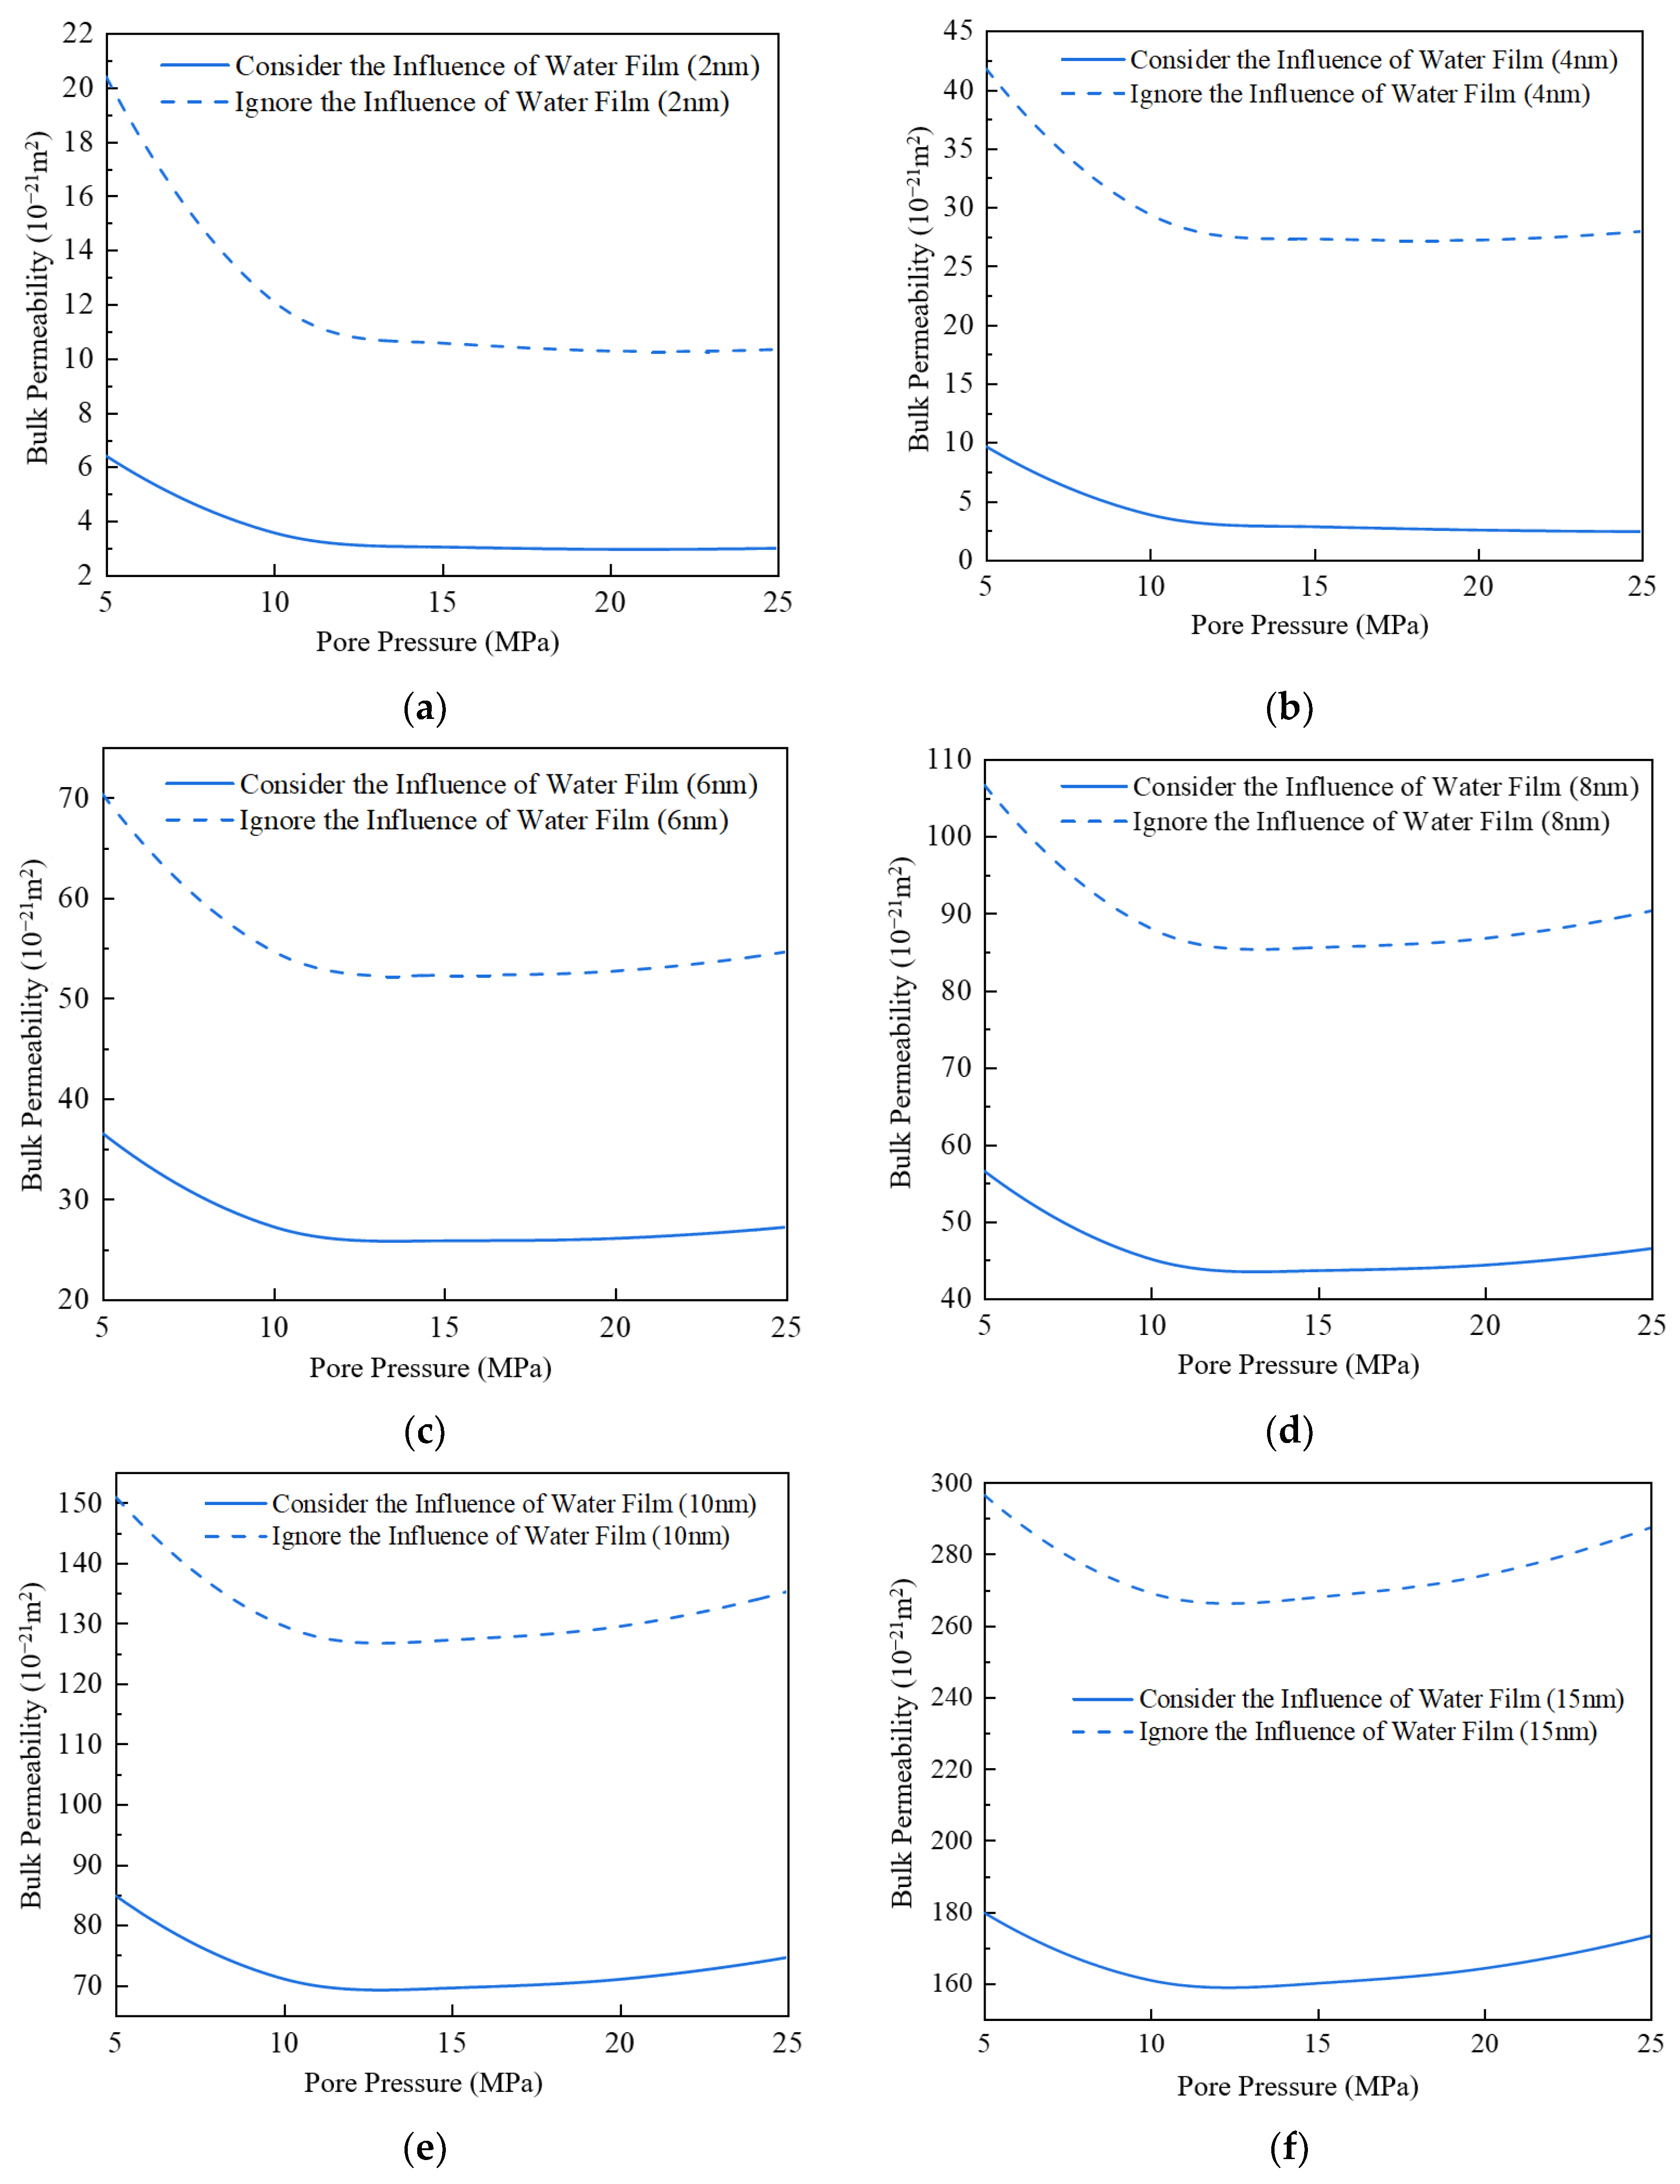
3.5. Impact of Water Film on Apparent Permeability
4. Conclusions
- (1)
- Under the conditions of high pressure and large pore size (pore pressure greater than 10 MPa, pore size greater than 4 nm), slippage flow takes dominance, while under the conditions of low pressure and small pore size (pore pressure less than 10 MPa, pore size less than 4 nm), Knudsen diffusion takes dominance. When the pore size is 15 nm, and pressure is 25 MPa, slippage flow is almost the only migration mechanism, and Knudsen diffusion is negligible.
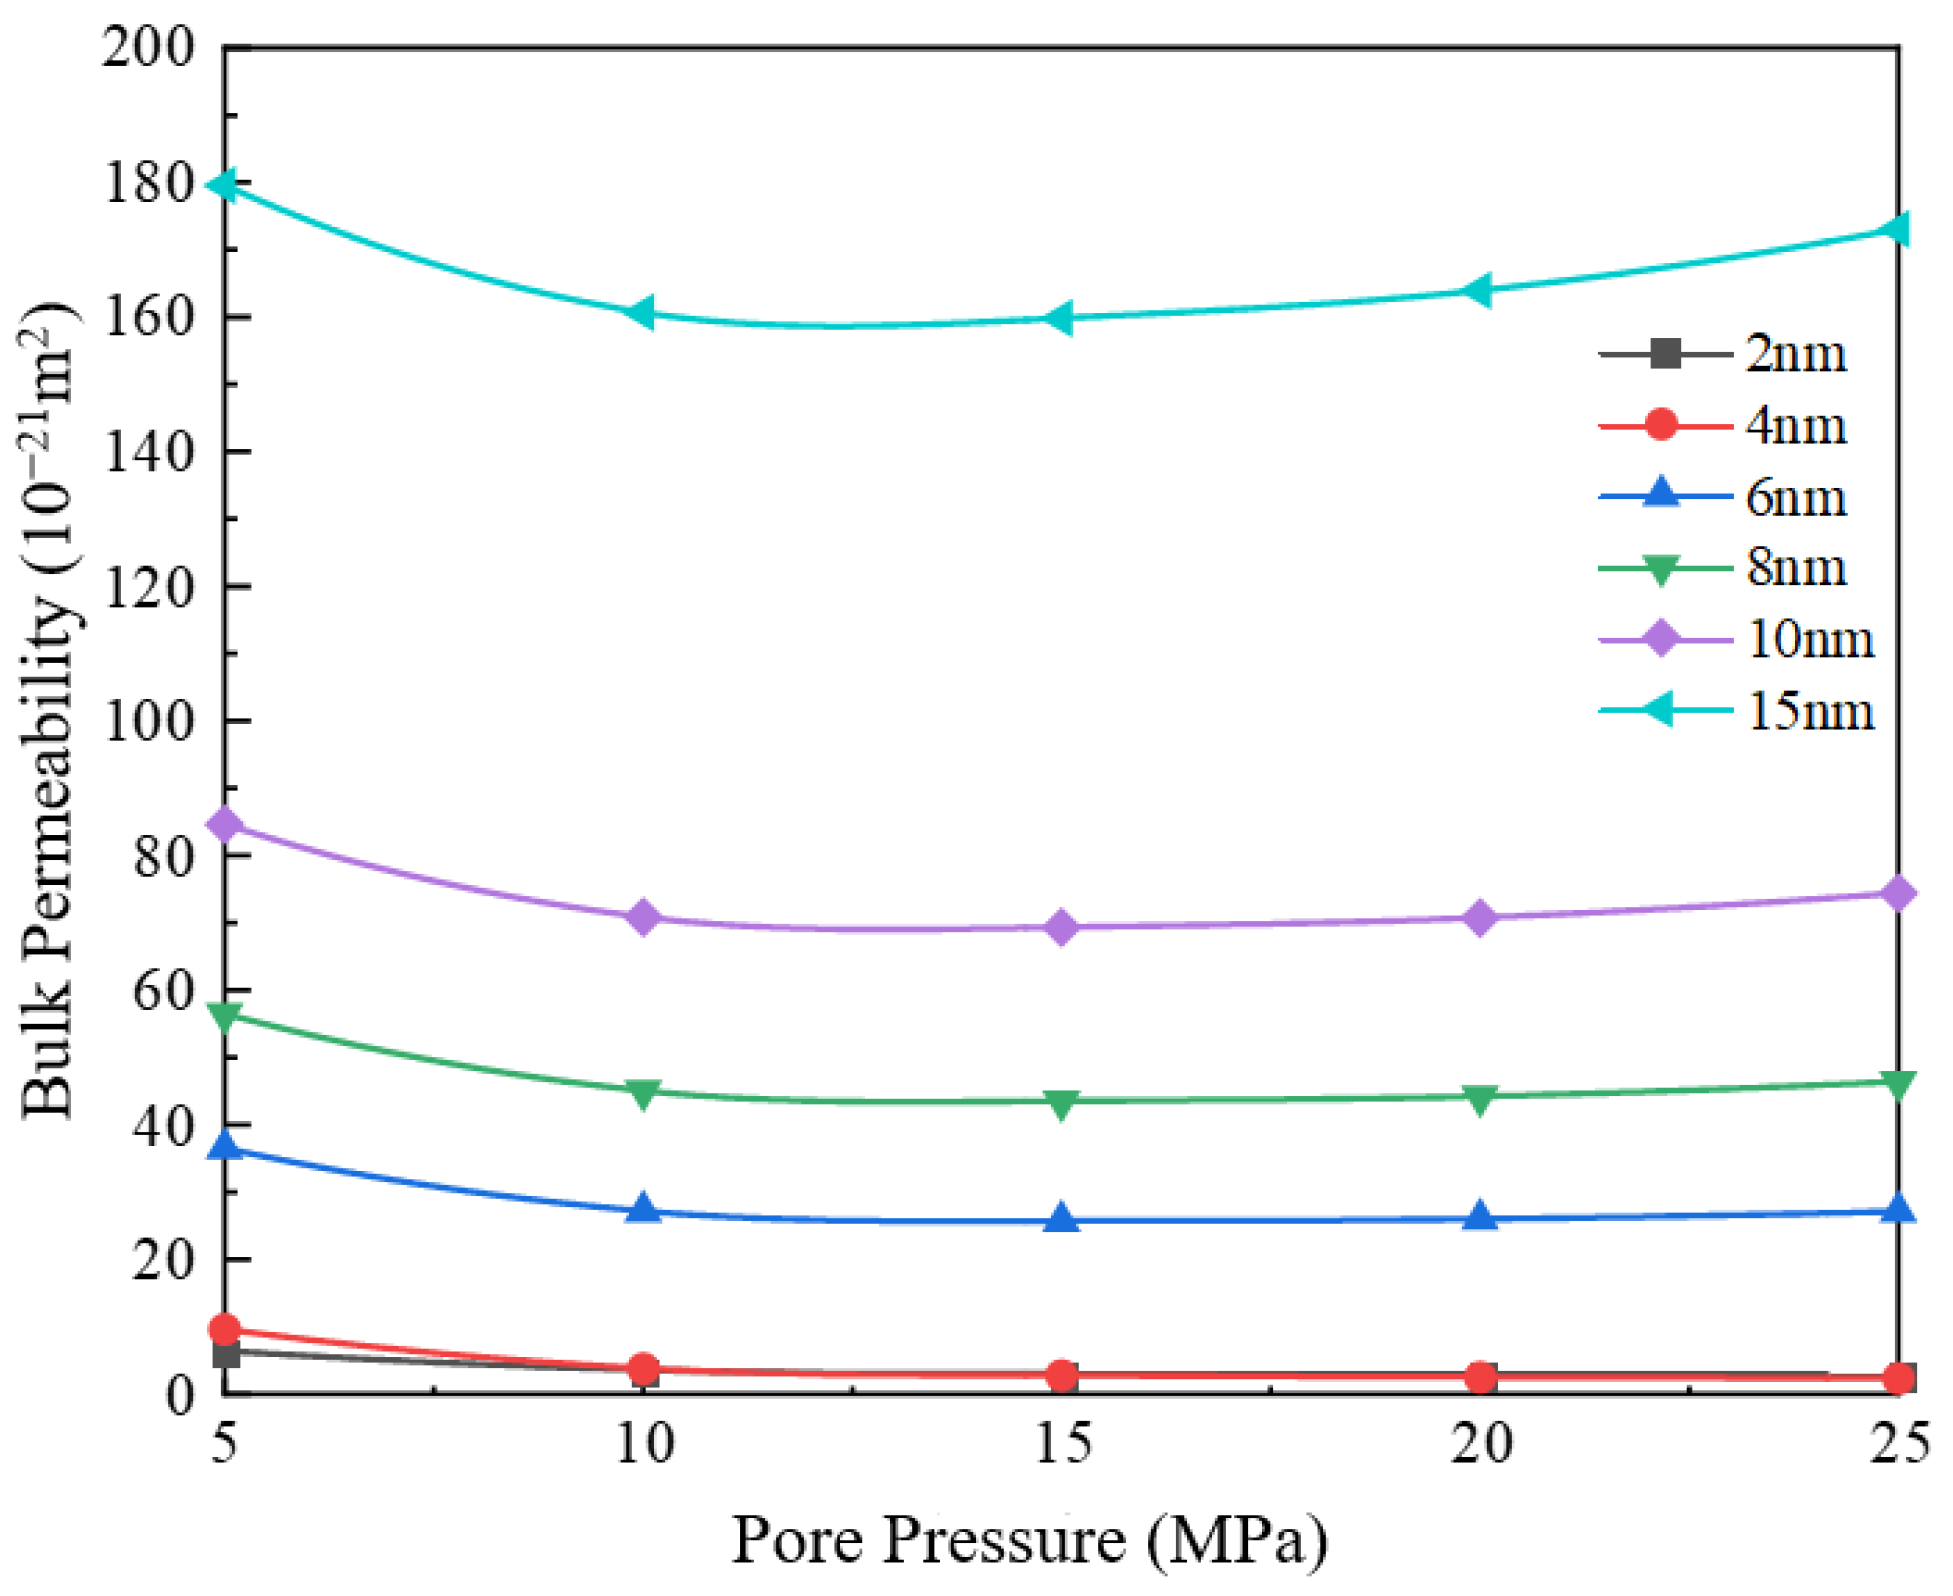
- (2)
- With the increase in pore diameter, the bulk phase apparent permeability of the gas also rises. When the pore diameter exceeds 10 nm, the bulk phase apparent permeability experiences a substantial increase. The existence of water film will reduce the effective migration pathway, which has a greater impact on small pore size and a weaker effect on large pore size. Comparing the apparent permeability for pore sizes of 2 nm and 10 nm, it is found that the increase in apparent permeability is amplified with increasing pore pressure. For example, at 5 MPa, the increase is about 12 times, while at 25 MPa, the increase is about 24 times.
- (3)
- When the molar fraction of CO2 is 33%, the bulk phase apparent permeability is the highest, while at 80%, it is the lowest. The CO2 molecule has a larger diameter than CH4 and C2H6, and molecules with larger diameters have lower collision frequencies compared to smaller ones. Therefore, as the mole fraction of CO2 increases, the apparent permeability decreases.
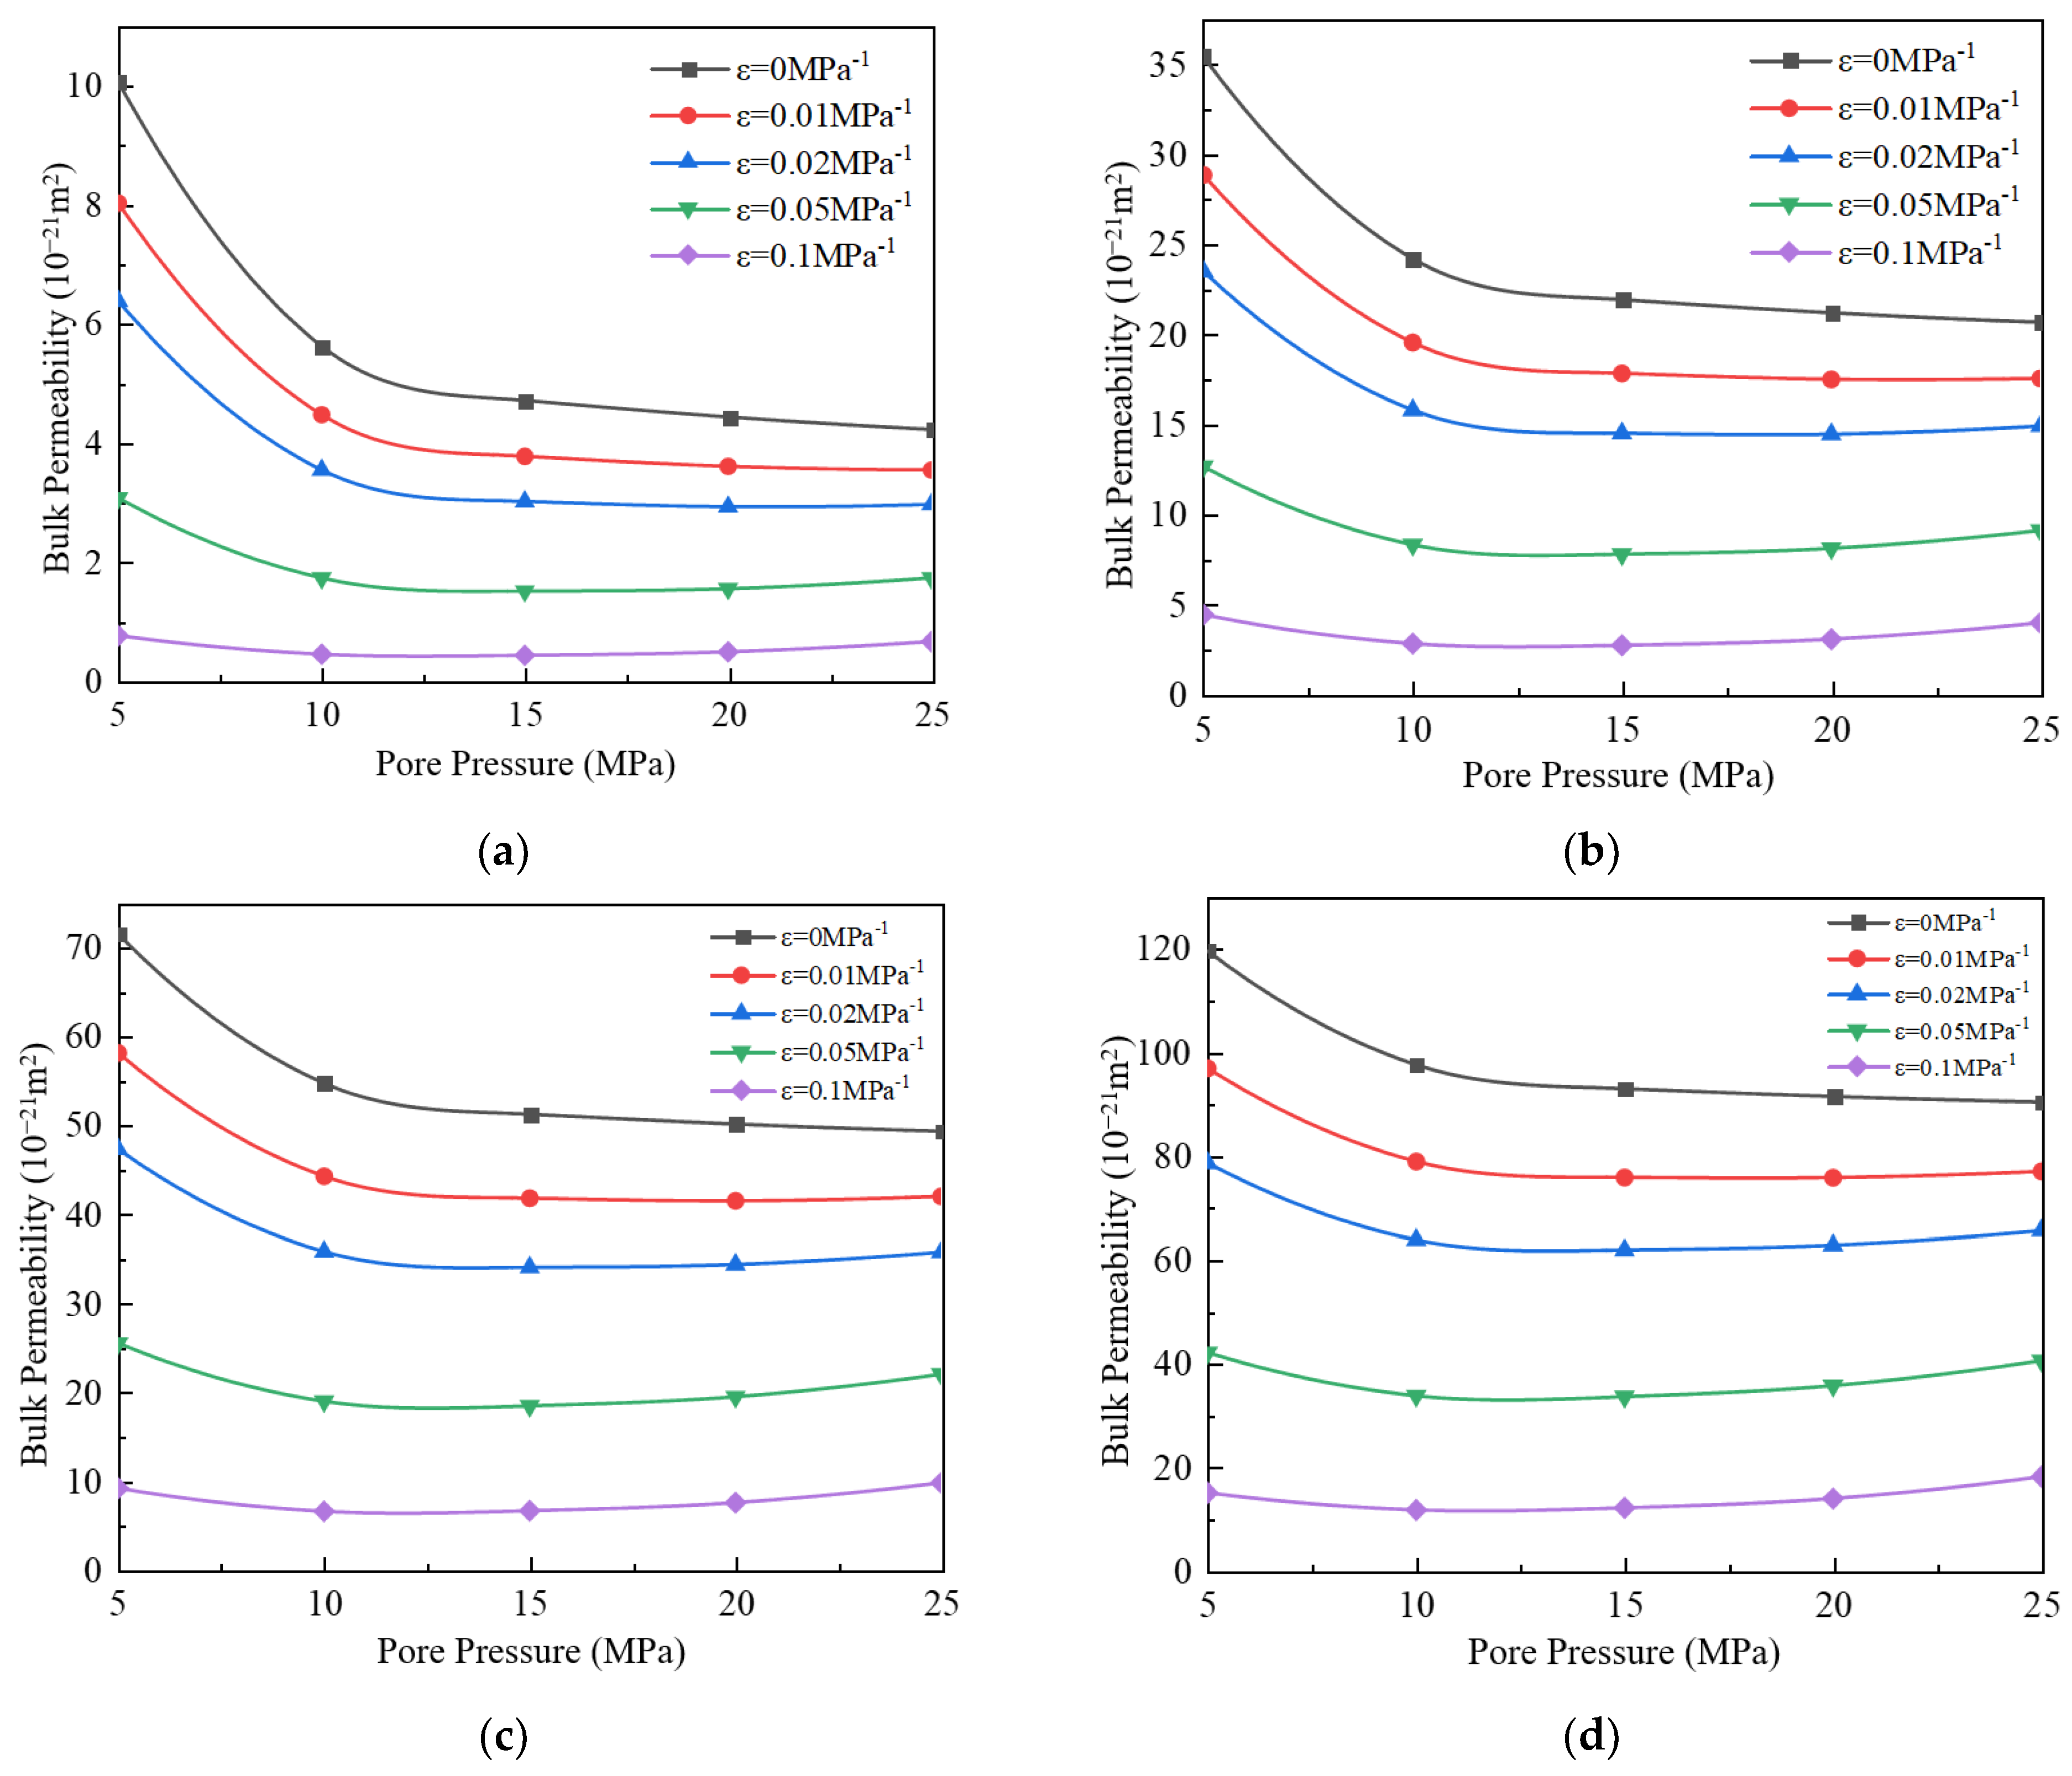
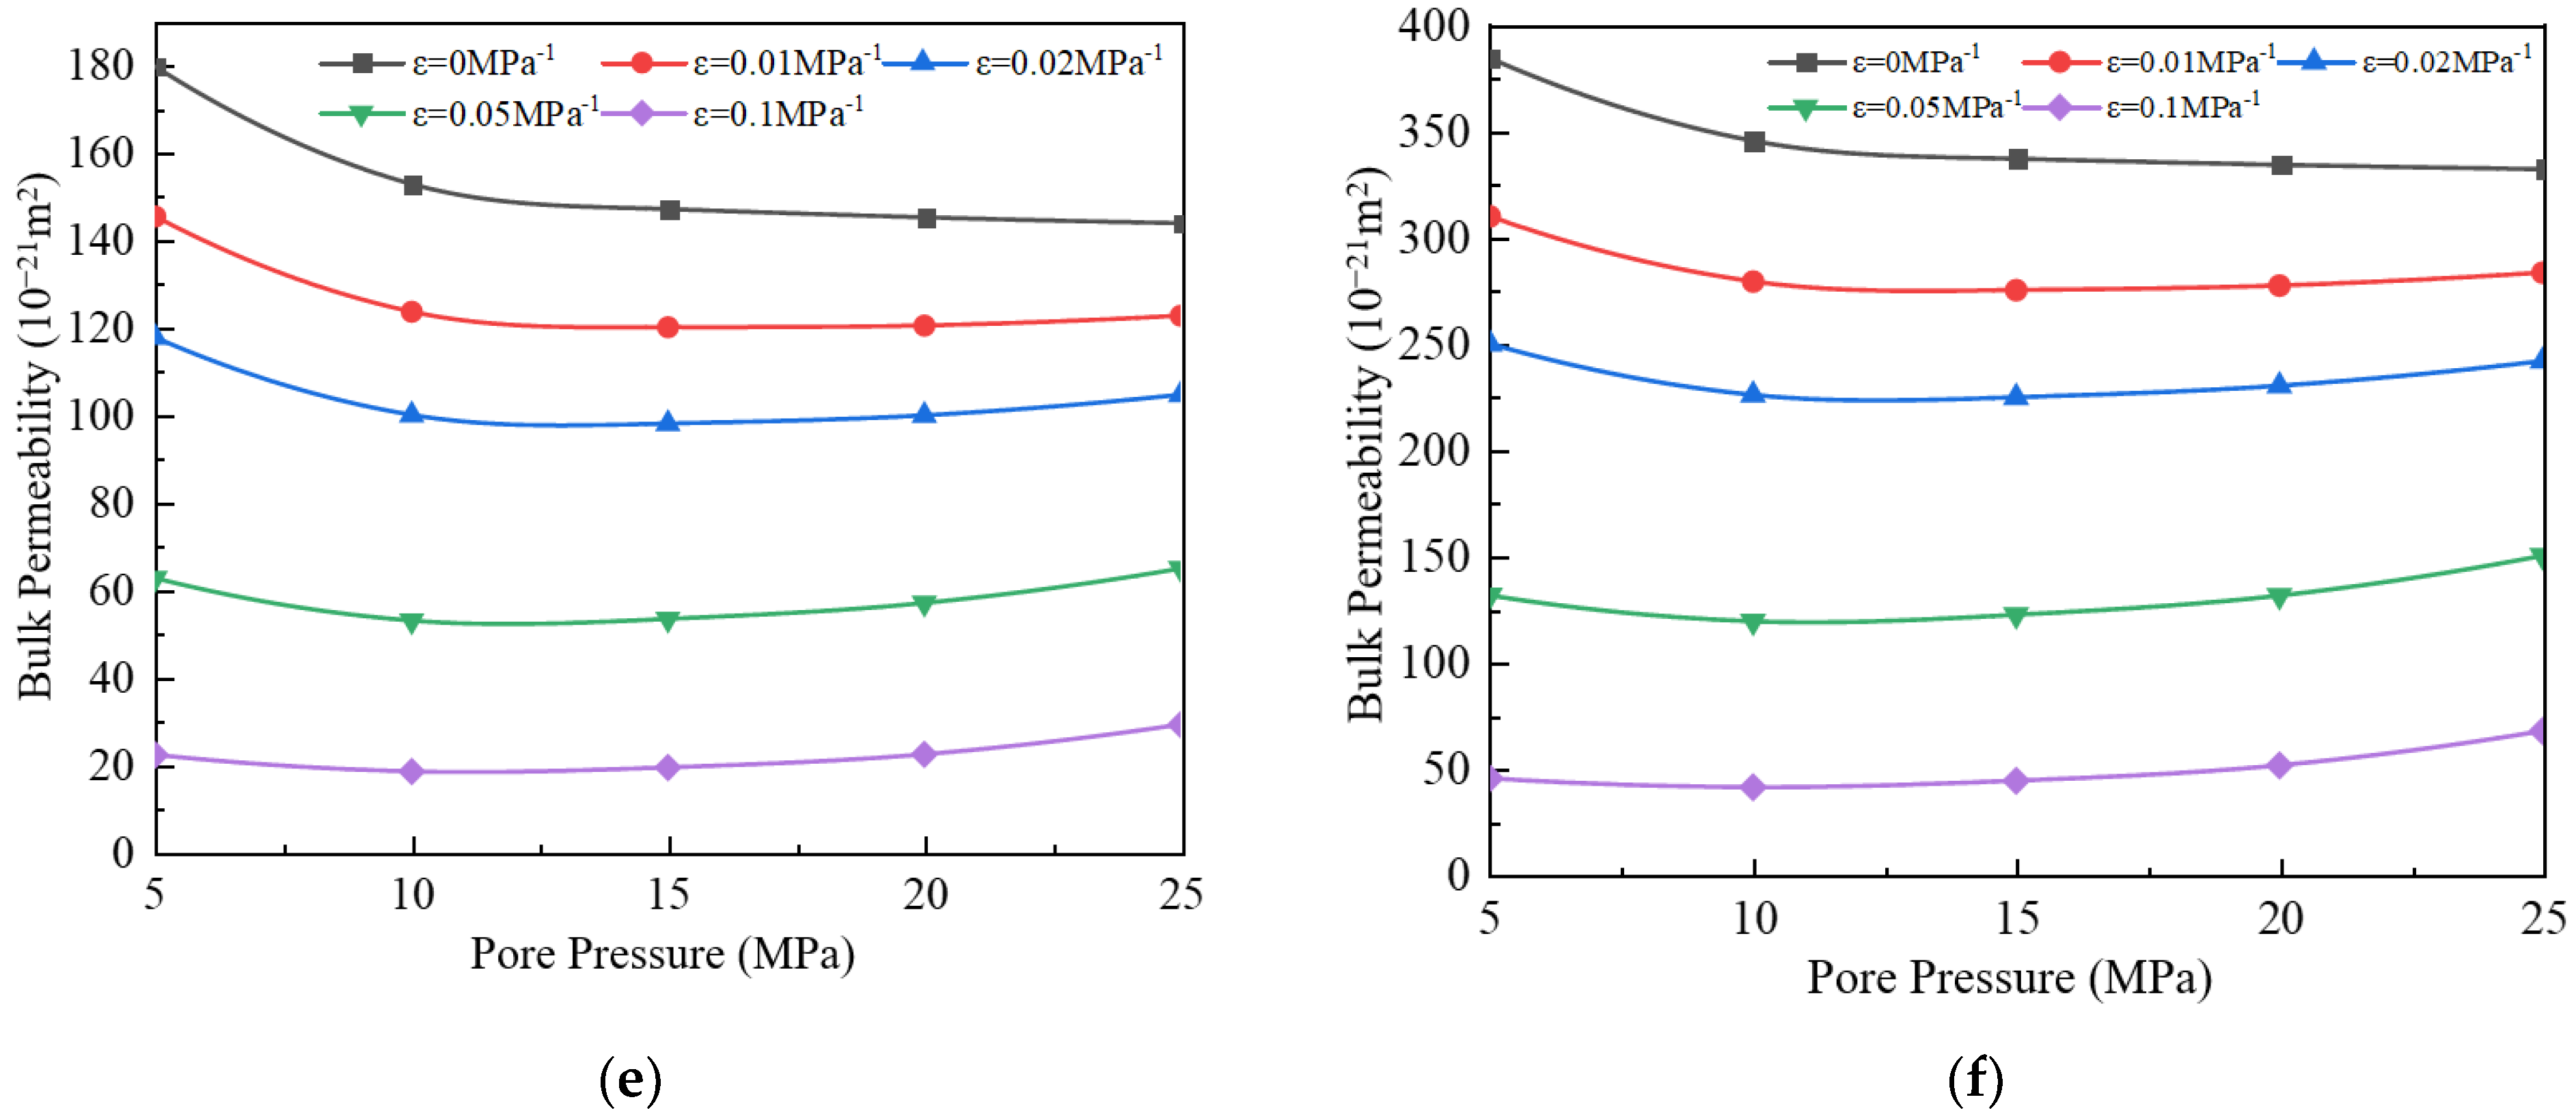
- (4)
- When the stress deformation is not considered, the gas’s apparent permeability is the highest, but when the stress deformation is considered, the apparent permeability will decrease. As the stress deformation coefficient increases, the apparent permeability gradually decreases because the stress deformation of pores reduces the effective flow radius. When the stress deformation coefficient is less than 0.05 MPa−1, the component ratio significantly impacts bulk apparent permeability. However, when the coefficient exceeds 0.05 MPa−1, this influence becomes negligible.
- (5)
- The apparent permeability in the presence of a water film is reduced by 37% to 72% compared to the absence of a water film. The smaller the proportion of water film thickness, the lesser the impact on apparent permeability.
Author Contributions
Funding
Data Availability Statement
Conflicts of Interest
Nomenclature
| Field Variables | |
| Gas concentration, mol/m3 | |
| Characteristic size or aperture, nm | |
| Knudsen diffusion coefficient, m2/s | |
| No-slippage boundary slippage flow mass flow rate, kg/(m2·s) | |
| Knudsen Diffusion Mass Flow, kg/(m2·s) | |
| Permeability, m2 | |
| Intrinsic permeability, m2 | |
| Multi-component Gas Knudsen Diffusion Permeability, m2 | |
| Multi-component Gas Slippage Flow Permeability, m2 | |
| Intrinsic Permeability of Porous Media, m2 | |
| Pore length, nm | |
| Gas molar mass, kg/mol | |
| Multi-component gas mixture molar mass, kg/mol | |
| Pore internal pressure, MPa | |
| Atmospheric pressure, MPa | |
| Pore external confining pressure, MPa | |
| Effective stress, MPa | |
| Critical pressure, MPa | |
| Gas constant, J/(mol·K) | |
| Formation temperature, K | |
| Critical temperature, K | |
| Initial pore radius, nm | |
| Pore radius under effective stress, nm | |
| Effective Pore Radius, nm | |
| Pore radius, nm | |
| Gas mean molecular free path, nm | |
| Multi-component Gas Mixture Mean Molecular Free Path, nm | |
| Biot coefficient, fraction | |
| Water film thickness, nm | |
| Gas viscosity, Pa·s | |
| Multi-component Gas Mixture Viscosity, Pa·s | |
| Gas density, kg/m3 | |
| Dimensionless Variables | |
| Dimensionless gas reduced pressure | |
| Dimensionless gas reduced temperature | |
| Dimensionless gas compression factor | |
| Dimensionless multi-component gas mixture compressibility factor | |
| Dimensionless slippage constant | |
| Dimensionless permeability stress deformation coefficient | |
| Dimensionless porosity stress deformation coefficient | |
| Dimensionless sparse effect coefficient | |
| Dimensionless porosity under effective stress | |
| Dimensionless porosity at atmospheric pressure | |
| Dimensionless effective porosity | |
| Dimensionless Knudsen diffusion permeability weight coefficient | |
| Dimensionless slippage flow permeability weight coefficient | |
Appendix A. The Validation of Multi-Component Gas Bulk Phase Apparent Permeability Model
References
- Li, Y.; Zhang, J. Types of unconventional oil and gas resources in China and their development potential. Int. Pet. Econ. 2011, 19, 61–67. [Google Scholar]
- Yu, H.; Fan, J. Multiscale gas transport behavior in heterogeneous shale matrix consisting of organic and inorganic nanopores. J. Nat. Gas Sci. Eng. 2020, 75, 103139. [Google Scholar] [CrossRef]
- Zhong, Y.; Zhang, H. Gas transport mechanisms in micro-and nano-scale matrix pores in shale gas reservoirs. Chem. Technol. Fuels Oils 2015, 51, 545–555. [Google Scholar] [CrossRef]
- Zou, C.; Zhu, R. Types, characteristics, genesis and prospects of conventional and unconventional hydrocarbon accumulations: Taking tight oil and tight gas in China as an instance. Acta Pet. Sin. 2012, 33, 173. [Google Scholar]
- Ambrose, R.J.; Hartman, R.C. Shale gas-in-place calculations part I: New pore-scale considerations. SPE J. 2012, 17, 219–229. [Google Scholar] [CrossRef]
- Duan, X.; Gao, S. Research progress in multi-scale percolation theory in shale micro-nano pores. Spec. Oil Gas Reserv. 2017, 24, 1–9. [Google Scholar]
- Roy, S.; Raju, R. Modeling gas flow through microchannels and nanopores. J. Appl. Phys. 2003, 93, 4870–4879. [Google Scholar] [CrossRef]
- Zhang, Q.; Su, Y. Gas transport behaviors in shale nanopores based on multiple mechanisms and macroscale modeling. Int. J. Heat Mass Transf. 2018, 125, 845–857. [Google Scholar] [CrossRef]
- Zhang, B.; Li, X. A review of gas flow and its mathematical models in shale gas reservoirs. Geofluids 2020, 2020, 8877777. [Google Scholar] [CrossRef]
- Wu, X.; Ning, Z.; Qi, R.; Wang, Q.; Huang, L. Pore Characterization and Inner Adsorption Mechanism Investigation for Methane in Organic and Inorganic Matters of Shale. Energy Fuels 2020, 34, 4106–4115. [Google Scholar] [CrossRef]
- Sharma, A.; Namsani, S. Molecular simulation of shale gas adsorption and diffusion in inorganic nanopores. Mol. Simul. 2015, 41, 414–422. [Google Scholar] [CrossRef]
- Beskok, A.; Karniadakis, G.E. Report: A model for flows in channels, pipes, and ducts at micro and nano scales. Microsc. Thermophys. Eng. 1999, 3, 43–77. [Google Scholar]
- Javadpour, F. Nanopores and Apparent Permeability of Gas Flow in Mudrocks (Shales and Siltstone). J. Can. Pet. Technol. 2009, 48, 16–21. [Google Scholar] [CrossRef]
- Civan, F. Non-isothermal Permeability Impairment by Fines Migration and Deposition in Porous Media including Dispersive Transport. Transp. Porous Media 2010, 85, 233–258. [Google Scholar] [CrossRef]
- Darabi, H.; Ettehad, A. Gas flow in ultra-tight shale strata. J. Fluid Mech. 2012, 710, 641–658. [Google Scholar] [CrossRef]
- Rahmanian, M.R.; Aguilera, R. A New Unified Diffusion-Viscous-Flow Model Based on Pore-Level Studies of Tight Gas Formations. In Proceedings of the Canadian Unconventional Resources Conference, Calgary, AB, Canada, 15–17 November 2011. [Google Scholar]
- Shi, J.; Zhang, L.; Li, Y.; Yu, W.; He, X.; Liu, N.; Li, X.; Wang, T. Diffusion and Flow Mechanisms of Shale Gas through Matrix Pores and Gas Production Forecasting. In Proceedings of the SPE Unconventional Resources Conference Canada, Calgary, AB, Canada, 5–7 November 2013. [Google Scholar]
- Wang, H.T. Performance of multiple fractured horizontal wells in shale gas reservoirs with consideration of multiple mechanisms. J. Hydrol. 2014, 510, 299–312. [Google Scholar] [CrossRef]
- Ren, J.; Guo, P. Investigation on permeability of shale matrix using the lattice Boltzmann method. J. Nat. Gas Sci. Eng. 2016, 29, 169–175. [Google Scholar] [CrossRef]
- Song, W.; Yao, J. Apparent gas permeability in an organic-rich shale reservoir. Fuel 2016, 181, 973–984. [Google Scholar] [CrossRef]
- Singh, H.; Javadpour, F. Langmuir slip-Langmuir sorption permeability model of shale. Fuel 2016, 164, 28–37. [Google Scholar] [CrossRef]
- Geng, L.; Li, G. A fractal model for real gas transport in porous shale. AIChE J. 2017, 63, 1430–1440. [Google Scholar] [CrossRef]
- Yao, J.; Song, W. Study on the influence of organic pores on shale gas flow ability. Sci. Sin. Phys. Mech. Astron. 2017, 47, 094702. [Google Scholar] [CrossRef]
- Yang, X.; Zhang, H.; Wu, W. Gas migration in the reservoirs of ultra-low porosity and permeability based on an improved apparent permeability model. J. Pet. Sci. Eng. 2019, 185, 106614. [Google Scholar] [CrossRef]
- Abolghasemi, E.; Andersen, P.S. The influence of adsorption layer thickness and pore geometry on gas production from tight compressible shales. Adv. Geo-Energy Res. 2022, 6, 4–22. [Google Scholar] [CrossRef]
- Jia, B.; Tsau, J.-S. A review of the current progress of CO2 injection EOR and carbon storage in shale oil reservoirs. Fuel 2019, 236, 404–427. [Google Scholar] [CrossRef]
- Yang, S.; Wei, J. Fundamentals of Petrophysics; Springer: Berlin/Heidelberg, Germany, 2017; pp. 267–275. [Google Scholar]
- Li, J.; Li, X. A quantitative model to determine water-saturation distribution characteristics inside shale inorganic pores. Acta Pet. Sin. 2016, 37, 903–913. [Google Scholar]
- Huang, L.; Ning, Z. Molecular insights into kerogen deformation induced by CO2/CH4 sorption: Effect of maturity and moisture. Energy Fuels 2019, 33, 4792–4805. [Google Scholar] [CrossRef]
- Wang, Y.; Zhang, L. Steered molecular dynamics simulation of elastic behavior of adsorbed single polyethylene chains. J. Polym. Sci. Part B 2007, 45, 2322–2332. [Google Scholar] [CrossRef]
- Dong, J.J.; Hsu, J.Y. Stress-dependence of the permeability and porosity of sandstone and shale from TCDP Hole-A. Int. J. Rock Mech. Min. Sci. 2010, 47, 1141–1157. [Google Scholar] [CrossRef]
- Vincké, O.; Longuemare, P. Investigation of the poromechanical behavior of shales in the elastic domain. In Proceedings of the SPE/ISRM Rock Mechanics in Petroleum Engineering, Trondheim, Norway, 8–10 July 1998; p. SPE-47589-MS. [Google Scholar]
- Wu, Z.; Zuo, Y. Experimental study on the stress sensitivity and influence factors of shale under varying stress. Shock Vib. 2018, 2018, 3616942. [Google Scholar] [CrossRef]
- Michel, G.G.; Sigal, R.F. Parametric Investigation of Shale Gas Production Considering Nano-Scale Pore Size Distribution, Formation Factor, and Non-Darcy Flow Mechanisms. In Proceedings of the SPE Annual Technical Conference and Exhibition, Denver, CO, USA, 30 October–2 November 2011. [Google Scholar] [CrossRef]
- Wu, K.; Li, X. Real gas transport mechanism and mathematical model through complex nanopores and microfractures in shale gas reservoirs. Sci. Sin. Technol. 2016, 46, 851–863. [Google Scholar] [CrossRef]
- Wu, K.; Chen, Z. Flow behavior of gas confined in nanoporous shale at high pressure: Real gas effect. Fuel 2017, 205, 173–183. [Google Scholar] [CrossRef]
- Wu, K.; Chen, Z. A model for multiple transport mechanisms through nanopores of shale gas reservoirs with real gas effect–adsorption-mechanic coupling. Int. J. Heat Mass Transf. 2016, 93, 408–426. [Google Scholar] [CrossRef]
- Huang, X.; Xue, J. Adsorption Behavior of CH4 and C2H6 on Shale under the Influence of CO2 and Flue Gas. Energy Fuels 2020, 34, 5689–5695. [Google Scholar] [CrossRef]
- Kong, S.; Huang, X. Adsorption/desorption isotherms of CH4 and C2H6 on typical shale samples. Fuel 2019, 255, 115632. [Google Scholar] [CrossRef]
- Wu, K.; Li, X. A Model for Surface Diffusion of Adsorbed Gas in Nanopores of Shale Gas Reservoirs. In Proceedings of the Offshore Technology Conference, Houston, TX, USA, 4–7 May 2015. [Google Scholar]


| Model Parameters | Value |
|---|---|
| Formation temperature T (K) | 353 |
| Formation pressure Pc (MPa) | 30 |
| Pore pressure (MPa) | 5, 10, 15, 20, 25 |
| Initial pore size (nm) | 2, 4, 6, 8, 10, 15 |
| Gas constant (J/mol·K) | 8.314 |
| CH4 molar mass (kg/mol) | 0.016 |
| CH4 molecular diameter (nm) | 0.38 |
| CO2 molar mass (kg/mol) | 0.044 |
| CO2 molecular diameter (nm) | 0.33 |
| C2H6 molar mass (kg/mol) | 0.03 |
| C2H6 molecular diameter (nm) | 0.3 |
| Porosity Stress deformation coefficient | 0.02 |
| Permeability stress deformation coefficient | 0.04 |
| Component ratio | CO2:CH4:C2H6 = 1:1:1, 2:1:1, 8:1:1 |
| Gas slippage constant | −1 |
| Porosity | 0.05 |
| Tortuosity | 1 |
Disclaimer/Publisher’s Note: The statements, opinions and data contained in all publications are solely those of the individual author(s) and contributor(s) and not of MDPI and/or the editor(s). MDPI and/or the editor(s) disclaim responsibility for any injury to people or property resulting from any ideas, methods, instructions or products referred to in the content. |
© 2024 by the authors. Licensee MDPI, Basel, Switzerland. This article is an open access article distributed under the terms and conditions of the Creative Commons Attribution (CC BY) license (https://creativecommons.org/licenses/by/4.0/).
Share and Cite
Dou, X.; Li, H.; Hong, S.; Peng, M.; He, Y.; Qian, K.; Guo, L.; Ma, B. Mathematical Model of the Migration of the CO2-Multicomponent Gases in the Inorganic Nanopores of Shale. Processes 2024, 12, 1679. https://doi.org/10.3390/pr12081679
Dou X, Li H, Hong S, Peng M, He Y, Qian K, Guo L, Ma B. Mathematical Model of the Migration of the CO2-Multicomponent Gases in the Inorganic Nanopores of Shale. Processes. 2024; 12(8):1679. https://doi.org/10.3390/pr12081679
Chicago/Turabian StyleDou, Xiangji, Hong Li, Sujin Hong, Mingguo Peng, Yanfeng He, Kun Qian, Luyao Guo, and Borui Ma. 2024. "Mathematical Model of the Migration of the CO2-Multicomponent Gases in the Inorganic Nanopores of Shale" Processes 12, no. 8: 1679. https://doi.org/10.3390/pr12081679