Abstract
Risk management in electronic component selection is crucial for ensuring inherent system quality dependability in aerospace equipment research and development (R&D). Therefore, it is of great significance to conduct rapid and accurate risk assessment research of electronic components based on engineering practice. This article utilizes the extreme gradient boosting (XGBoost) algorithm and domain knowledge to assess electronic component selection risk. Firstly, an innovative risk assessment system is established for electronic component selection based on business materials analysis and investigation by questionnaire. Then, the values of factors in the system are quantified based on domain knowledge and empirical formulae. Finally, an XGBoost-based risk assessment model is constructed that can explore learning strategies and develop latent features by integrating multiple decision trees. The model is compared against the random forest (RF), support vector machine (SVM) and decision tree (DT) algorithms. Accuracy, precision, recall, and F1 score are used as evaluation indexes. The results obtained from the above algorithms illustrate the effectiveness of the proposed method in electronic component selection risk assessment.
1. Introduction
With the widespread application of electronic devices and systems across various industries, electronic components play a significant role as the fundamental part of electronic devices and systems [1,2]. The key performance indicators, product quality, reliability levels, and maintenance capabilities of electronic components directly impact the major technical performance, development process, and logistics ensure ability of electronic equipment products and systems. Whether communication equipment, medical devices, or aerospace products, they all require reliable electronic components for functions [3,4]. Therefore, it is of great importance to assess risk during the selection process of electronic components. It not only helps identify potential quality problems and prevent possible failures in advance but also guides reasonable electronic component selection and management so that the stable operation and safety of the equipment product can be ensured effectively.
Risk is defined as multiplication of the probability of failure and its likely consequence. Risk assessment aims to pinpoint potential hazards and assess their likelihood and consequence [5,6]. Since the concept of risk assessment was proposed, it has been considered an important measure for making major decisions and strategic planning. The study of risk assessment aims to avoid the uncertainty of loss. This involves modeling the subject, conducting risk analysis, and gaining foresight into the risks by predicting risks, thereby aiming to control or mitigate risks [7]. For example, Chaudhuri et al. [8] proposed a step-by-step approach for supply chain risk assessment during new product development based on numeric and linguistic data. Khan et al. [9] put forward a holistic framework for environment-conscious product risk modeling and assessment, in which various product design alternatives are analyzed from a risk perspective.
In the field of aerospace equipment research and development (R&D), the types of electronic components are complicated and the demand for them is large. The improper selection of electronic components leads to numerous problems, causing a certain amount of economic damage and limiting improvement in the quality and reliability of equipment. Hence, the review of electronic component selection is a crucial part of aerospace equipment quality assurance work. The selection risk of electronic component is an important consideration. It refers to the potential adverse effects and losses that improper selection of electronic components can bring to aerospace equipment development and production. However, most designers have limited and differentiated information on electronic components, including deliverability, quality performance, and so on. This leads to difficulties in giving a comprehensive assess result of selection risk. In addition, the designers often focus on functional performance, which may cause quality issues and losses in the later stage of mass production, especially with newly developed electronic components. Even when information on electronic components is available, the results of selection risk are greatly influenced by personal cognition and preferences, resulting in subjective and fragmented assessments. At present, the methods of electronic component risk assessment are rather scattered, mainly including experimentation analyzing, statistical analysis, and partial index analysis [10,11,12]. But most of the above methods only consider local indicators, lack systematic evaluation, have poor efficiency, and are expensive. Hence, there is an urgent need for a rapid and comprehensive method for risk analysis during electronic component selection to provide better decision-making support at the aerospace equipment R&D stage with low cost.
With the development of modern information technology, machine learning (ML) has drawn increasing attention in recent years [13,14] and demonstrated outstanding performance in multi-class classification problems [15,16]. Applying ML to electronic component selection risk assessment enables the extraction of key features from the original data and labels, as well as the integration of expert experience and knowledge into the model. Compared with the existing methods, models based on ML are capable of automating and systematizing the risk assessment process and help to prevent and manage risk from the source. Extreme gradient boosting (XGBoost), combining the gradient boosting framework and advanced regularization techniques, has been widely used in various fields. Numerous empirical studies have validated its effectiveness [17], such as personal credit risk evaluation [18] and reliability estimation [19]. Motivated by the above discussion, an approach for electronic component selection risk assessment based on XGBoost and domain knowledge is proposed in this study. To begin with, a combination of business materials analysis and specialist interview is used to obtain domain knowledge for determining the representative selection risk factors. Then, a Likert-scale method, questionnaire surveys, and empirical formulae are used to quantify the factors. Afterwards, a general model of risk assessment for electronic component selection based on XGBoost is established. Finally, a set of pre-collected data is used to verify the effectiveness of the proposed approach. At the same time, random forest (RF), support vector machine (SVM), and decision tree (DT) methods are selected for comparison in the present study. The main contributions of this paper are summarized as follows.
- (1)
- An innovative risk assessment system for electronic components is designed based on business materials analysis and questionnaire investigation, which is helpful in obtaining a comprehensive and systematic assessment of the risk level.
- (2)
- An XGBoost-based risk assessment model is established to extract key features from the original data and labels, which can achieve effective reuse and continuous accumulation of expert experience.
- (3)
- The proposed method based on XGBoost and domain knowledge can quickly perform risk assessment for a large volume of electronic components with high accuracy.
The rest of this paper is organized as follows. In Section 2, factor analysis of electronic component risk assessment is presented in a literature review. Section 3 includes the risk assessment methodology based on XGBoost, Section 4 presents the experiment description, results, and discussion. Finally, Section 5 provides the conclusion.
2. Factor Analysis of Electronic Component Selection Risk Assessment
Electronic component selection risk refers to various uncertainties and potential issues that may affect the quality reliability, and supply security of electronic components during the selection and use process, resulting in the inability of the equipment to complete its desired mission. Choosing electronic components with lower risks during equipment research and design helps meet the quality and reliability requirements in the whole life cycle.
2.1. Identification of Factors in Risk Assessment System
The whole life-cycle data of electronic components is studied and analyzed through business materials analysis and a specialist interview method, which can collect more domain knowledge. According to the principles of systematicity, objectivity, and comprehensiveness, the influencing factors in the risk assessment system can be divided into three categories: basic background, quality assurance, and supply security.
- (1)
- Basic background situation
The basic background situation refers to the potential selection risks in the process of basic assessment. It mainly includes the following four factors.
Application resume factor: This mainly refers to the historical applications of the electronic component in equipment. The richer the application history of electronic components, the wider the use of electronic components in equipment, which means the risk is lower.
Qualified supplier factor: This mainly refers to the suppliers whose electronic components are recognized and verified as conforming to certain standards and requirements in the supply chain management. If the electronic component is supplied by a qualified supplier, the risk of the electronic component is low.
Selected catalog factor: This is a list created to control electronic component selection during equipment research and development. Electronic components in this list have undergone extensive testing, evaluation, and practical engineering applications, thereby partially meeting the demands of equipment research and development.
Usability verification factor: Usability verification involves conducting a series of targeted tests, analyses, and evaluations under actual usage conditions or simulated environments, focusing on production elements, functional performance, reliability, and application adaptability, before any electronic components are selected. It can help engineers assess the suitability of electronic components and ensure proper functioning in practical applications.
- (2)
- Supply security situation
The supply security situation refers to the assessment of whether electronic components can be supplied on demand, which influences the mass production process of the entire product. The continuous and stable supply of electronic components is a basic requirement for the manufacturing and maintenance stages of product and equipment. The risk assessment mainly includes the following three factors.
Negative information factor: This refers to the phenomenon of deliberately concealing the true status of products and portraying imported products as independent brands.
Independent guarantee ability factor: Based on available research and development resources, a country can independently carry out the design, manufacturing, and supply assurance of electronic components, as well as has the ability to exercise autonomous control and controllability in its technical research and development, manufacturing, and supply chain.
Long-term stable supply ability factor: The ability of electronic component suppliers to maintain stable supply capacity over an extended period, ensuring timely, high-quality, and large-scale supply of the required electronic components for product manufacturing.
- (3)
- Quality assurance situation
The quality assurance situation refers to potential issues and challenges that may arise during the quality inspection and control processes of electronic components. It includes the following five factors.
Retest and screening factor: When the electronic component manufacturer has not conducted a screening test or the screening test conducted does not meet the specified parameters, conditions, or other special requirements of the product machines, the user or their delegated unit undertakes reselection based on the screening conducted by the manufacturer. The higher the value of reselection, the greater the risk caused by the quality assurance situation.
Destructive physical analysis (DPA) [20] factor: DPA refers to a detailed examination process of electronic components where the electronic components are intentionally damaged or broken down in a controlled way. This is carried out to closely inspect and understand their internal structure, composition, manufacturing quality, and potential faults or weaknesses. It is an important approach in ensuring the quality, reliability, and performance of electronic devices and systems. The risk corresponding to the quality assurance situation increases with the increase in DPA value.
Batch return factor: Due to a whole batch of electronic components not meeting the qualification rate or the test conclusion being unqualified, the entire batch is rejected. A smaller batch return value indicates better quality assurance of the electronic components.
Failure analysis factor: Electronic component failure analysis is a crucial process in the field of electronics and engineering. It is carried out to determine the root cause of why an electronic component has malfunctioned or failed to perform as expected. This involves a detailed examination and testing of the electronic component using various techniques and tools. A lower failure analysis value corresponds to lower quality assurance risks.
Quality problem closed-loop factor: This typically refers to the quality issues encountered after the delivery of electronic components provided by the electronic component production unit during a certain stage or process of the product machine. It involves assessing whether the quality issues can be rectified according to standard requirements, reassessing and improving quality control measures. A lower value of problem’s closed loop indicates lower risks associated with electronic component selection.
The factors in the risk assessment system are shown in Figure 1.
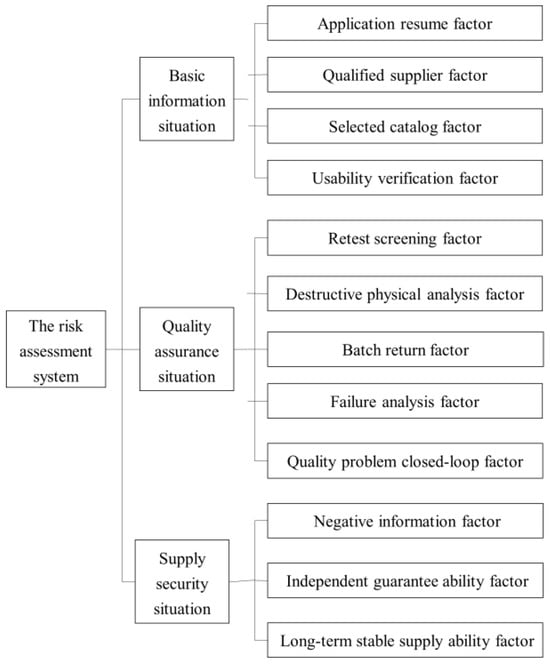
Figure 1.
The risk assessment system of electronic component selection.
2.2. Quantification of Risk Factors
In this paper, the factors associated with basic background situation and supply security situation are quantified by a Likert-scale method [21] and questionnaire survey approach [22], in which the score increases with risk level: minimal risk level—score of 1, very low risk level—score of 2, low risk level—score of 3, moderately low risk level—score of 4, medium risk level—score of 5, moderately high risk level—score of 6, high risk level—score of 7, very high risk level—score of 8, and extremely high risk level—score of 9. The factors associated with the quality assurance situation are quantified by empirical formulae.
- (1)
- Basic background situation
The application resume factor includes five kinds of conditions: the electronic component has not been used in the equipment (), the electronic component has been used in one type of equipment (), the electronic component has been used in two types of equipment (), the electronic component has been used in three types of equipment (), and the electronic component has been used in four or more types of equipment (). The value of the application resume factor is calculated by the following formula:
where represents the score of application resume given by the n-th expert to the indicator value with serial number , and N represents the number of valid expert survey questionnaires collected.
The qualified supplier factor includes two kinds of conditions: the supplier of the electronic component is listed in the qualified supplier list (), and the supplier of the electronic component is not listed in the qualified supplier list (). The value of the qualified supplier factor is calculated by the following formula:
where represents the score of the qualified supplier given by the n-th expert to the indicator value with serial number .
The selected catalog factor includes four kinds of conditions: the selection grade of the electronic component is “optimal (high evaluation level, widely applicable)” (), the selection grade of the electronic component of the electronic component is “optional (medium evaluation level, chosen based on actual product needs)” (), the selection grade of the electronic component of the electronic component is “restricted (applicable only in specific products or environments)” (), and the electronic component is “not listed in the selection catalog” (). The value of the selected catalog factor is calculated by the following formula:
where represents the score of selected catalog factor given by the n-th expert to the indicator value with serial number .
The usability verification factor includes four kinds of conditions: the conclusion of the electronic component’s usability verification is “usable (meeting all application requirements)” (), the conclusion of the electronic component’s usability verification is “conditionally usable (partially meeting requirements, with specific conditions and applicable areas)” (), the conclusion of the electronic component’s usability verification is “disable (failing to meet application requirements)” (), and the electronic component remains unverified (). The value of the usability verification factor is calculated by the following formula:
where represents the score of usability verification given by the n-th expert to the indicator value with serial number .
- (2)
- Supply security situation
The negative information factor includes four kinds of conditions: the electronic components can be independently developed and produced (); the independent research of key technologies for the electronic component is restricted (); the key parts of the electronic component are not self-produced (); and the electronic component is not independently developed and produced (). The value of the negative information factor is calculated by the following formula:
where represents the score of negative information given by the n-th expert to the indicator value with serial number .
The independent guarantee ability factor is described by five levels: excellent (), good (), fair (), poor (), and very poor (). The value of the independent guarantee ability factor is calculated by the following formula:
where represents the score of the independent guarantee ability given by the n-th expert to the indicator value with serial number .
The long-term stable supply ability factor is described by three levels: excellent (), good (), and poor (). The value of the long-term stable supply ability factor is calculated by the following formula:
where represents the score of long-term stable supply ability given by the n-th expert to the indicator value with serial number .
- (3)
- Quality assurance situation
The retest and screening factor mainly considers the failure rate of screening experiment tasks, which can be calculated by the following formula:
where represents the value of the retest screening factor in the j-th year; is the mean of the failure rate of the retest screening experiment tasks in the j-th year; is the variance in failure rate of the retest screening experiment tasks in the j-th year; represents the total number of retest screening experiment tasks in the j-th year; and is the time coefficient of the j-th year, which reflects the temporal degradation situation.
The DPA factor mainly considers the conclusion of the DPA experiment task, and is assigned three grades (1, 0.5, 0). A grade of 1 indicates disqualification, 0.5 corresponds to doubt, and 0 indicates qualification. It can be calculated by the following formula:
where represents the value of the DPA factor in the j-th year; is the mean of conclusion of the DPA experiment tasks in the j-th year; is the variance in conclusion of the DPA experiment tasks in the j-th year; and represents the total number of DPA experiment tasks in the j-th year.
The batch return factor mainly considers the task status of the retest screening experiment, and is assigned two grades (1, 0): 1 corresponds to batch return, and 0 corresponds to no batch return. It can be calculated by the following formula:
where represents the value of the batch return factor in the j-th year; is the mean of task status in the j-th year; is the variance in task status in the j-th year; represents the total number of tasks in the j-th year; is the number of occurrences of batch returns in tasks; and is a constant.
The failure analysis factor mainly considers cause classification of failure analysis experiments, and includes inherent failure, service failure, and others. Different failure cause classifications correspond to different scores, which can be obtained by the expert investigation method. It can be calculated by the following formula:
where represents the value of the failure analysis factor of the k-th batch; is the mean of failure cause classification of the k-th batch; is the variance in failure cause classification of the k-th batch; represents the total number of failure analysis experiments of the k-th batch; is a constant; and K represents the total number of bathes.
The quality problem closed-loop factor mainly considers secondary cause classification, which includes batch failure, inherent quality problems, and others. Different secondary cause classifications correspond to different scores, which also can be obtained through the expert investigation method. It can be calculated by the following formula:
where represents the value of the quality problem closed-loop factor of the k-th batch; is the mean of secondary cause classification of the k-th batch; is the variance in secondary cause classification of the k-th batch; represents the total number of quality problem closed-loop factors of the k-th batch; is a constant; and K represents the total number of bathes.
3. Risk Assessment Based on XGBoost Method
3.1. The XGBoost Method
The XGBoost method is a boosting ensemble learning algorithm proposed by Tianqi Chen from the University of Washington in 2016 [23]. It leverages gradient boosting techniques to implement a machine learning algorithm. The base classifier of the XGBoost method is a classification and regression tree (CART). The XGBoost algorithm combines multiple CART models to achieve better learning performance and stronger generalization ability. The XGBoost model aims to build t decision trees through t rounds of iteration. Each iteration generates a weak classifier (a decision tree). Therefore, the key challenge in building an XGBoost model is how to construct a decision tree in each iteration. The objective function of the XGBoost algorithm is constructed as follows [24], which defines the way of establishing new tree models:
where represents the number of trees, is the loss function, the second term is the regularization term used to prevent overfitting, represents the complexity of each leaf node, T indicates the total number of leaf nodes, λ is a hyperparameter primarily used for adjusting the number of iterations, and represents the weight value on each leaf node.
The objective function is simplified and expanded according to the second-order Taylor series. The Taylor expansion of the objective function is shown as follows:
where and
For a given tree structure , assume that is the set of all samples mapped to the -th leaf node, and is the output of this leaf node. Then, the equation above can be expressed as:
Therefore, the minimum value of the objective function can be obtained by solving the quadratic equation, in which represents the optimal leaf weight for each leaf node.
Then, Equation (20) can be simplified to the following equation:
where and vary depending on the loss function. XGBoost supports custom loss functions, as long as the loss function can be differentiated to obtain both first and second derivatives.
3.2. Implementation
Step 1: Data preprocessing
The numerical results of the original data ranges generally differ after the quantification of selection risk factors. To eliminate the influence of different value ranges and dimensional differences, as well as to improve the convergence speed and accuracy of the model, it is necessary to preprocess the data by normalization and scale the numerical values of electronic component risk features to the range between [0, 1] through the following equation:
where represents the value of factor i, represents the minimum value of factor , and represents the maximum value of factor .
Step 2: Model training
The dataset is divided into training and testing data with a 4:1 ratio. Then, appropriate loss and objective functions are defined to build the electronic component risk assessment model based on the XGBoost method. The objective of the XGBoost-based electronic component risk assessment model is to find the optimal mapping relationship between the extracted electronic component risk feature data (input layer) and the label of risk level (output layer). Specifically, by adjusting the hyperparameters of the XGBoost algorithm, the model can accurately capture the complex relationship between electronic component risk features, minimizing the difference between the output of the model and actual labels. The particle swarm optimization (PSO) method [25,26] is employed to obtain the optimal hyperparameters in the training procedures. Common hyperparameters in this model include learning rate, tree depth, subsampling rate, column sampling rate, regularization parameters, etc.
Step 3: Model validation
Model validation is conducted to effectively evaluate the performance and generalization ability of the model. The trained model is then used to predict the risk level for specific electronic components. The evaluation metrics are calculated by quantifying the differences between the predicted outputs generated by the model and the actual labels, which can provide insight into the model’s accuracy and performance.
The corresponding flowchart of proposed method for risk assessment during electronic component selection is shown in Figure 2.
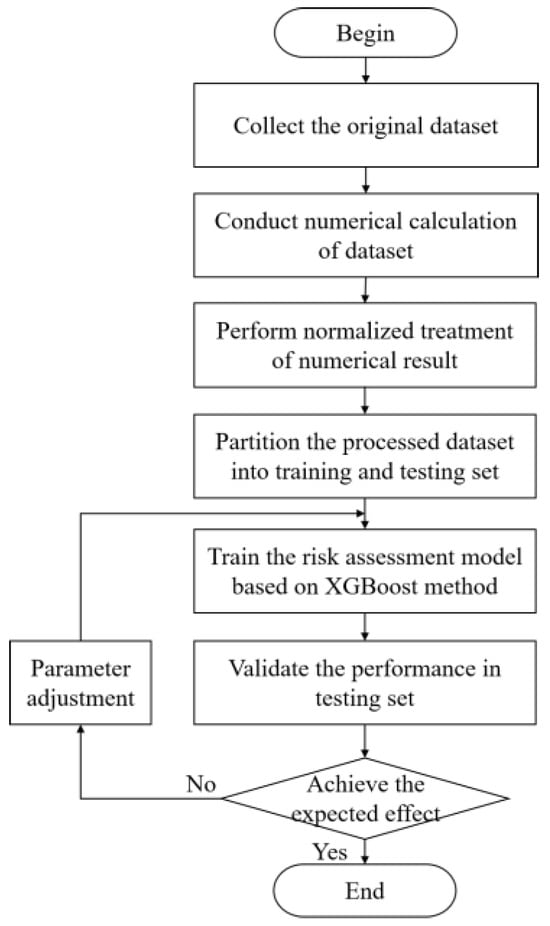
Figure 2.
The flowchart of proposed method for risk assessment.
4. Experimental Verification
4.1. Experiment Description
To validate the effectiveness of the proposed algorithm, a dataset of electronic component selection risk assessment is constructed, including various electronic component feature information (as input parameter data for the model) and the risk level (as the label). The correlation heatmap of each input feature is shown in Figure 3. The risk level is labeled through expert experience, including low risk, medium risk, and high risk. Five business experts with adequate quality assurance working experience of aerospace equipment are invited to label the risk level for each data entry. A well-formed questionnaire is designed to obtain the label of each electronic component. In this way, the potential individual biases can be reduced and the consistency in labeling and the credibility of the dataset can be ensured.
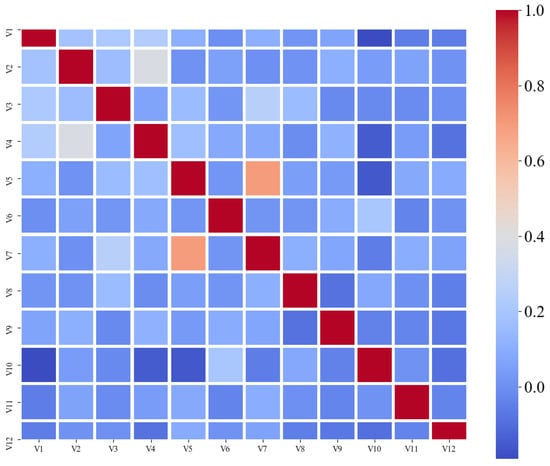
Figure 3.
Pearson coefficient heatmap.
The formation process of original dataset is listed as follows
Step 1: Establish a risk assessment system for electronic component selection based on literature consultation and questionnaire investigation.
Step 2: Collect related data from corresponding business segments according to the need of the risk assessment system.
Step 3: Organize and summarize the data and design a risk assessment questionnaire. The key elements in the questionnaire include serial numbers of electronic components, basic background situation, supply security situation, quality assurance situation, and risk level. Each serial number corresponds to a specific electronic component. The specific product information of the electronic component that may affect the subjective judgment of the experts is hidden, and only the actual situation of each factor in the risk assessment system is given, ensuring that for the same electronic component, the information given to each expert for risk assessment is consistent.
Step 4: Invite five experienced experts to answer the questionnaire (assign a risk level to each datum through personal expertise and experience).
Step 5: Aggregate the expert results using the average method. The final electronic component risk level is determined by calculating the average value of all experts’ results.
Step 6: Build the dataset for the machine learning model, including various electronic component feature information (from step 2) and the risk level (from step 5).
A statistical chart of risk levels from the expert results is shown in Figure 4. The labeled sample dataset is divided into a training and testing set. The training set is used to train the model, and the testing set is used to validate the performance of model. Accuracy, precision, recall, and F1 score are used as evaluation indexes, which are calculated as follows. In addition, RF, SVM, and DT approaches are employed as comparison algorithms.
where TP, FN, TN, and FP represent the number of true-positive, false-negative, true-negative, and false-positive results, respectively.
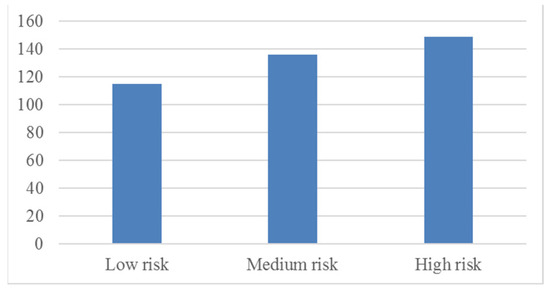
Figure 4.
Statistical chart of risk levels.
4.2. Experiment Result Analysis
The trained risk assessment model can be used to predict the risk levels of electronic components. The results of a confusion matrix obtained from five random data partition experiments is shown in Figure 5. In Figure 5, it can be observed that the model performs well in distinguishing between the different risk levels. The number of correct predictions is significantly higher than the number of misclassifications, indicating high accuracy on the whole.
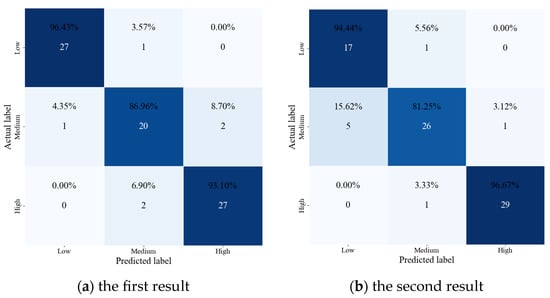
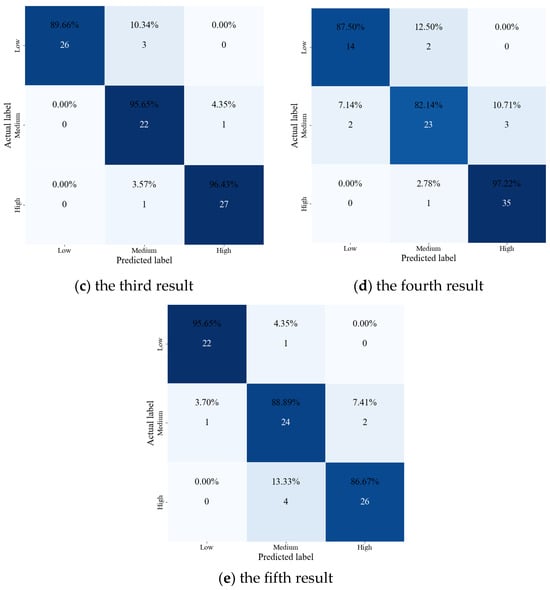
Figure 5.
Confusion matrix of proposed method.
In order to further compare the effectiveness and feasibility of the proposed method, RF, SVM and DT methods are used for risk assessment with the same dataset. Five random data partition experiments are conducted and the corresponding results of the four evaluation indexes are computed. The average values of accuracy, precision, recall, and F1 score for each risk level are shown in Table 1, where it can be seen that the proposed method has the highest accuracy value, the RF algorithm is ranked second, followed by the SVM and DT methods, displaying relatively poor risk assessment performance. More specifically, the accuracy obtained from the XGBoost method is 91.25%, the RF method has accuracy of 88.75%, the accuracy of SVM is 85.00%, and the number of correct predictions observed from the DT method reaches 80.00%. Moreover, the F1 scores, which balance precision and recall indexes, are higher for the proposed method in low, medium, and high risk levels, indicating overall robustness and reliability in risk level prediction.

Table 1.
The accuracy of four methods for each risk level.
In addition, for a visual comparison, the results obtained from five random data partition experiments are shown in Figure 6, Figure 7, Figure 8 and Figure 9. It is observed that the values of evaluation indexes obtained from the XGBoost-based method are higher than the RF, SVM, and DT approaches in most cases. Thus, it is more conducive to enhancing the prediction performance in electronic component selection risk assessment.
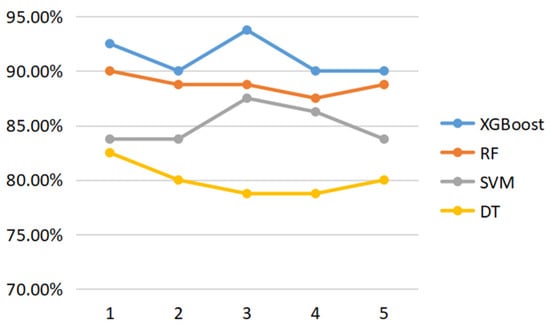
Figure 6.
The values of the accuracy index using four methods.
Figure 7.
The values of the precision index using four methods.
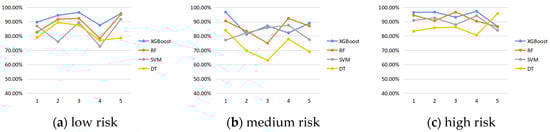
Figure 8.
The values of the recall index using four methods.
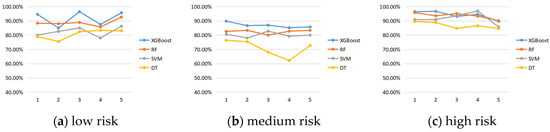
Figure 9.
The values of the F1-score index using four methods.
In summary, the XGBoost algorithm outperforms the other three methods in precision, accuracy, recall, and F1 score, and has been proven to display superior and comparable performance in the aforementioned cases. Thereby, the proposed method with reliable performance can be a novel and also a reasonable alternative choice for electronic component selection risk assessment.
4.3. Factor Importance Analysis
The importance scores of each input feature can be obtained through analyzing the feature importance parameter, which represents the significance of each feature in the assessment model. As shown in Figure 10, the importance values of negative information, selected catalog, independent guarantee ability and usability verification factors are relatively high, which has a significant influence on the predictive risk level. The pronounced importance of features implies their crucial role in enhancing the accuracy of risk assessment, as well as guiding feature selection and model optimization in the future.
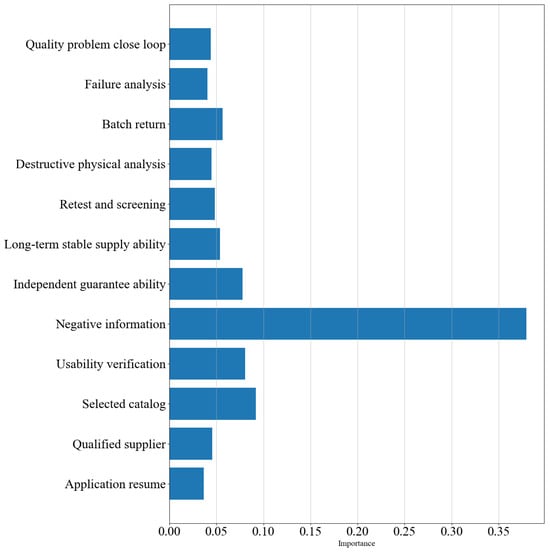
Figure 10.
The results of input feature importance.
5. Conclusions
In this paper, a novel electronic component selection risk assessment based on the XGBoost method and domain knowledge is proposed. Firstly, factor analysis of electronic component selection risk assessment is performed based on business materials analysis, specialist interviews, and empirical formulae. Then, the XGBoost method is utilized to establish a risk assessment model that can accurately capture the complex relationships between electronic component risk features and risk level labels. The simulation results verify the efficiency of the proposed method in assessing the risk of electronic component selection, highlighting its ability to distinguish among three levels of risk accurately. In future work, a method of expanding the dataset and the refined XGBoost algorithm will be studied for practical application. Methods like deep learning will also be explored for risk assessment of electronic component selection, alongside comparative analysis with existing approaches.
Author Contributions
Conceptualization, C.W. and S.Z.; methodology, C.W. and S.Z.; software, X.B. and H.L.; validation, X.B.; formal analysis, C.W. and S.Z.; investigation, X.B.; resources, Y.W.; data curation, H.L.; writing—original draft preparation, X.B.; writing—review and editing, C.W. and S.Z.; visualization, Z.M.; supervision, Z.M.; project administration, Y.W. and Z.M.; funding acquisition, Y.W. and Z.M. All authors have read and agreed to the published version of the manuscript.
Funding
This research received no external funding.
Data Availability Statement
The data are not publicly available due to privacy or ethical restrictions.
Conflicts of Interest
The authors declare no conflicts of interest. The funders had no role in the design of the study; in the collection, analyses, or interpretation of data; in the writing of the manuscript; or in the decision to publish the results.
References
- Wang, K.; Xi, Y.; Zan, X.; Zhu, D.; Luo, L.; Ding, R.; Wu, Y. Failure analysis of damaged tungsten monoblock components of upper divertor outer target in EAST fusion device. Nucl. Eng. Technol. 2024, 56, 2307–2316. [Google Scholar] [CrossRef]
- Veprik, A.M. Vibration protection of critical components of electronic equipment in harsh environmental conditions. J. Sound Vib. 2003, 259, 161–175. [Google Scholar] [CrossRef]
- Goel, A.; Graves, R.J. Electronic system reliability: Collating prediction models. IEEE Trans. Device Mater. Reliab. 2006, 6, 258–265. [Google Scholar] [CrossRef]
- Singh, K.B.; Saket, R.K.; Chatterji, S. The effect of derating on component selection and product design. Int. J. Reliab. Saf. 2009, 4, 89–103. [Google Scholar] [CrossRef]
- Okoro, U.; Kolios, A. Multicriteria risk assessment framework for components’ risk ranking: Case study of a complex oil and gas support structure. J. Mult.-Crit. Decis. Anal. 2018, 25, 113–129. [Google Scholar] [CrossRef]
- Guan, X.; Yu, F.; Xu, H.; Li, C.; Guan, Y. Flood risk assessment of urban metro system using random forest algorithm and triangular fuzzy number based analytical hierarchy process approach. Sustain. Cities Soc. 2024, 109, 105546. [Google Scholar]
- Luo, C.; Zhao, Y.; Xu, K. A risk assessment method considering risk attributes and work safety informational needs and its application. Chin. J. Chem. Eng. 2024, 68, 253–262. [Google Scholar] [CrossRef]
- Chaudhuri, A.; Mohanty, B.K.; Singh, K.N. Supply chain risk assessment during new product development: A group decision making approach using numeric and linguistic data. Int. J. Prod. Res. 2012, 51, 2790–2804. [Google Scholar] [CrossRef]
- Khan, R.A.; Anand, A.; Wani, M.F. A holistic framework for environment conscious based product risk modeling and assessment using multi criteria decision making. J. Clean. Prod. 2018, 174, 954–965. [Google Scholar] [CrossRef]
- Pandey, A.; Singh, M.; Sonawane, A.U.; Rawat, P.S. FMEA Based Risk Assessment of Component Failure Modes in Industrial Radiography. Int. J. Eng. Trends Technol. 2016, 39, 545–550. [Google Scholar] [CrossRef]
- Bhattacharjee, P.; Hussain, S.A.I.; Dey, V.; Mandal, U.K. Failure mode and effects analysis for submersible pump component using proportionate risk assessment model: A case study in the power plant of Agartala. Int. J. Syst. Assur. Eng. Manag. 2023, 14, 1778–1798. [Google Scholar] [CrossRef]
- Zhang, J.; Yin, X.; Xing, J.; An, X. Dynamic risk assessment for train brake system considering time-dependent components and human factors. Comput. Ind. Eng. 2023, 185, 109687. [Google Scholar] [CrossRef]
- Liu, Y.; Jiang, L.; Shi, J.; Liu, J.; Li, G.; Wang, Z.; Zhang, Z. Recognition of Longitudinal Cracks on Slab Surfaces Based on Particle Swarm Optimization and eXtreme Gradient Boosting Model. Processes 2024, 12, 1087. [Google Scholar] [CrossRef]
- Jackins, V.; Vimal, S.; Kaliappan, M.; Lee, M.Y. AI-based smart prediction of clinical disease using random forest classifier and Naive Bayes. J. Supercomput. 2021, 77, 5198–5219. [Google Scholar] [CrossRef]
- Hameed, N.; Shabut, A.M.; Ghosh, M.K.; Hossain, M.A. Multi-class multi-level classification algorithm for skin lesions classification using machine learning techniques. Expert Syst. Appl. 2020, 141, 112961. [Google Scholar] [CrossRef]
- Zhang, Y.; Zhao, M. Cloud-based in-situ battery life prediction and classification using machine learning. Energy Storage Mater. 2023, 57, 346–359. [Google Scholar] [CrossRef]
- Liu, X.; Zhou, P.; Lin, Y.C.; Sun, S.W.; Zhang, H.L.; Xu, W.Q.; Yang, S.D. Influencing Factors and Risk Assessment of Precipitation-Induced Flooding in Zhengzhou, China, Based on Random Forest and XGBoost Algorithms. Int. J. Environ. Res. Public Health 2022, 19, 16544. [Google Scholar] [CrossRef] [PubMed]
- Wang, K.; Li, M.; Cheng, J.; Zhou, X.; Li, G. Research on personal credit risk evaluation based on XGBoost. Procedia Comput. Sci. 2022, 199, 1128–1135. [Google Scholar] [CrossRef]
- Guo, Y.; Wang, H.; Guo, Y.; Zhong, M.; Li, Q.; Gao, C. System operational reliability evaluation based on dynamic Bayesian network and XGBoost. Reliab. Eng. Syst. Saf. 2022, 225, 108622. [Google Scholar] [CrossRef]
- Lim, H.S.; Zelter, G.R.; Smithrick, J.J.; Hall, S.W. Destructive physical analysis results of Ni/H2 cells cycled in low earth orbit regime (II). J. Power Sources 1994, 51, 445–456. [Google Scholar] [CrossRef]
- Kampen, J.K. Reflections on and test of the metrological properties of summated rating, Likert, and other scales based on sums of ordinal variables. Measurement 2019, 137, 428–434. [Google Scholar] [CrossRef]
- Roopa, S.; Rani, M.S. Questionnaire designing for a survey. J. Indian Orthod. Soc. 2012, 46, 273–277. [Google Scholar] [CrossRef]
- Chen, T.; Guestrin, C. XGBoost: A scalable tree boosting system. In Proceedings of the 22nd ACM SIGKDD International Conference on Knowledge Discovery and Data Mining, San Francisco, CA, USA, 13–17 August 2016. [Google Scholar]
- Ma, M.; Zhao, G.; He, B.; Li, Q.; Dong, H.; Wang, S.; Wang, Z. XGBoost-based method for flash flood risk assessment. J. Hydrol. 2021, 598, 126382. [Google Scholar] [CrossRef]
- Wang, D.; Tan, D.; Liu, L. Particle swarm optimization algorithm: An overview. Soft Comput. 2018, 22, 387–408. [Google Scholar] [CrossRef]
- Pebrianti, D.; Kurniawan, H.; Bayuaji, L.; Rusdah, R. XgBoost Hyper-Parameter Tuning Using Particle Swarm Optimization for Stock Price Forecasting. J. Ilm. Tek. Elektro Komput. Inform. 2023, 9, 1179–1195. [Google Scholar]
Disclaimer/Publisher’s Note: The statements, opinions and data contained in all publications are solely those of the individual author(s) and contributor(s) and not of MDPI and/or the editor(s). MDPI and/or the editor(s) disclaim responsibility for any injury to people or property resulting from any ideas, methods, instructions or products referred to in the content. |
© 2024 by the authors. Licensee MDPI, Basel, Switzerland. This article is an open access article distributed under the terms and conditions of the Creative Commons Attribution (CC BY) license (https://creativecommons.org/licenses/by/4.0/).