Article

Qualitative and Quantitative Potential of Low-Cost Near-Infrared (NIR) Devices for Rapid Analysis of Infant Formulas for Regular and Special Needs

Faculty of Food Technology and Biotechnology, University of Zagreb, Pierottijeva 6, 10000 Zagreb, Croatia
*
Author to whom correspondence should be addressed.
Processes 2024, 12(8), 1771; https://doi.org/10.3390/pr12081771
Submission received: 4 August 2024 / Revised: 15 August 2024 / Accepted: 19 August 2024 / Published: 21 August 2024
(This article belongs to the Special Issue Feature Papers in the "Food Process Engineering" Section)

Abstract

:
Infant formulas and their quality are an extremely important factor for proper growth and development and their composition and nutritional quality are extremely important. Fast, green, and cheap quality analysis methods are definitely desirable. Therefore, the aim of this work was to examine the potential of applying near-infrared (NIR) spectroscopy using two devices: a (i) laboratory NIR analyzer and (ii) portable NIR device. Both devices record the vibrations of molecules in the NIR region of 900–1699 nm. Infant formulas intended for children up to 6 months (n = 6) and for infants with a sensitive digestive system or confirmed allergy to cow’s milk proteins (n = 5) were tested. Each infant formula was recorded in the form of powder and in the form of prepared samples corresponding to different ages, according to the instructions on the product declaration. The parameters of color, conductivity, and total dissolved solids (TDS) were also measured. The measured parameters and the chemical composition of infant formulas were associated with NIR spectra and with the application of chemometric tools (principal component analysis (PCA) and partial least squares regression (PLSR)), the similarity and/or difference between the samples was determined and the qualitative/quantitative potential was determined through applications of both devices. Characteristic peaks at certain wavelengths indicate the presence of carbohydrates, proteins, and water were identified and are specific for regular and specific purpose infant formulas. It is precisely these specificities in the composition, which are visible in the NIR spectrum, that make it possible to distinguish samples on a qualitative level. The connection of NIR spectra as input variables and 22 parameters (color, TDS, conductivity, and energy–nutrient composition) as output variables, using PLSR, gave an insight into the quantitative potential, i.e., the possibility of predicting the observed parameters on the basis of NIR spectra (recorded using two devices). The quantitative potential was confirmed on the basis of model parameters that resulted in acceptable values for both NIR devices: the coefficient of determination for the calibration, Rc2 > 0.9, and Range Error Ratio, RER > 6.

1. Introduction

Maintaining the quality and safety of food has always been a challenge because food products are at constant risk of exposure to various contaminations, so it is necessary to ensure that they do not occur. In order to ensure that food reaches the market and reaches consumers in a microbiologically and health-correct manner, there are various methods of monitoring food quality, which help in the detection of contaminants and the analysis of food composition [1]. Spectroscopy is a branch of analytical chemistry that deals with obtaining information about the chemical composition and structure of substances based on the separation, detection, and measurement of energy changes that occur in atomic nuclei, atomic electron shells, or in molecules as a result of their interaction with electromagnetic radiation with particles [2].
Over the last 40 years, near-infrared (NIR) spectroscopy has become one of the most widely used methods for food quality analysis and control and is based on the absorption of electromagnetic radiation in the range from 780 nm (nanometers) to 2500 nm [3,4]. NIR, like any radiation, behaves as a wave with the property of u harmonic motion (photons can be absorbed or emitted, creating a harmonic oscillator, by transitioning from one vibrational energy state to another) [4]. The use of spectroscopic analysis in the food industry provides the possibility of conducting cheap and fast food analysis and has a role in describing the texture and structure of the analyzed food; the analysis can be performed in a laboratory or industrial plant [5].
NIR spectroscopy, like any method, has certain advantages and disadvantages. Its main advantages are that no prior sample preparation is usually required, the analysis is non-destructive, simple, and fast (between 15 and 90 s), and no additional chemical solvents are required for the analysis, which makes it a more environmentally friendly analysis method, compared to some other known and available methods. It also enables the simultaneous measurement of several different ingredients and the analysis of food with a high moisture content is possible [3,4].
Some disadvantages of the application of NIR spectroscopy are the laboratory standard error causing standard error of prediction and performance problems due to biological variation, and the main limitation of NIR spectroscopy in food analysis is its dependence on less precise reference methods [4,6]. NIR spectroscopy is widely used in the food industry precisely because of its characteristics—it offers fast analysis, high reproducibility, is not expensive, does not consume samples, and the results are displayed and processed on a computer. It can be used not only for rapid detection of contaminants in food, but also for assessing food quality for the purpose of guaranteeing food safety and for technical support in the food production process [7]. Like any other method, NIR spectroscopy has its drawbacks: standard error in the laboratory leads to standard error in prediction and problems in performance, and the main drawback of NIR spectroscopy in food analysis is its dependence on less precise methods, which serve as a reference [6]. In order for infant formulas to be put on the market at all, their composition must satisfy a number of legal provisions and regulations and certain nutritional recommendations [8]. In the world, less than 40% of infants are exclusively breastfed, and in the United States, even more than 80% of infants are fed infant formula before the age of 6 months [9]. In 1865, Justus von Liebig developed, patented, and marketed the first baby food in liquid form and then in powder form for better preservation. Its formula consisted of cow’s milk, wheat flour, barley malt flour, and potassium bicarbonate and was considered the perfect food for infants [10]. By 1883, there were 27 different patented powdered infant formulas on the market (consisting of carbohydrates—sugar, starch, and dextrin’s but they lacked proteins, vitamins, and minerals), which caused an increase in the body mass of infants; therefore, these nutrients were individually added to infant formulas [11]. Milk-free infant formulas were developed in the 1920s, based on soy flour, and became available to the public in 1929, but were also lacking in key nutrients, mostly vitamins. Later, this problem was solved by enriching formulas with vitamins [12].
Depending on the part of the world, different bodies are responsible for managing regulations. Whereas in the United States it is primarily the American Food and Drug Administration (FDA), in the European Union, the European Parliament together with the European Council is responsible for passing such regulations. They are at the highest level and have the task of setting the main regulations. After the European Commission approves the framework directive, the European Committee is responsible for implementing the directive. This food control system also includes the European Food Safety Authority (EFSA) together with the European Commission (EC). Due to the growing need for the harmonization of standards for children nutrition and the production of baby food, the Steering Committee of the European Society for Pediatric Gastroenterology, Hepatology, and Nutrition (ESPGHAN) was created in 1974. In January 2000, the European Union published a White Paper on food safety. It contains 84 measures for food safety and sets requirements for food composition, product declaration, and upper limits of pesticide residues in infant formulas and baby food [13].
In accordance with all the above, the aim of this study is to investigate the exceptional advantages offered by NIR spectroscopy by examining the possibility of application in (i) monitoring the quality of infant formulas in the form of powders and prepared drinks (liquid meal) and (ii) the qualitative potential of nutritional composition validation. Results will be compared for two devices, both (i) desktop and (ii) portable micro-sized versions. The qualitative potential will enable the differentiation of infant formulas for special needs, while the combination of NIR spectra associated with the measured data of color, conductivity, and total dissolved substances will enable the assessment of the quantitative potential through calibration models.

2. Materials and Methods

2.1. Infant Formulas

A total of 11 infant formulas were tested, which were purchased over the counter and stored at room temperature in the laboratory. Samples of infant formulas for special purposes were purchased from pharmacies. Regular infant formulas were purchased in stores with a department specializing in infant and child nutrition, and 3 of them represented store brands (e.g., Drogerie Markt and Mueller). All formulas were purchased at the same time (Zagreb, Croatia). All samples were in powder form and they were prepared as prescribed on the packaging. The number of the sample is related to the recommended proportion of powder in water, which changes depending on the age of the infant (Table 1). For each sample, three measurements were performed, regardless of which method (TDS, conductivity, color, and NIR), on the basis of which the mean values and standard deviation were calculated.
A solution was prepared as a standard milk drink. This standard was prepared using milk powder (10 g of whole milk powder was dissolved in 200 mL of boiled water (cooled at 40–50 °C)). Boiled water, cooled to the same temperature, was used in the preparation of all infant formulas.

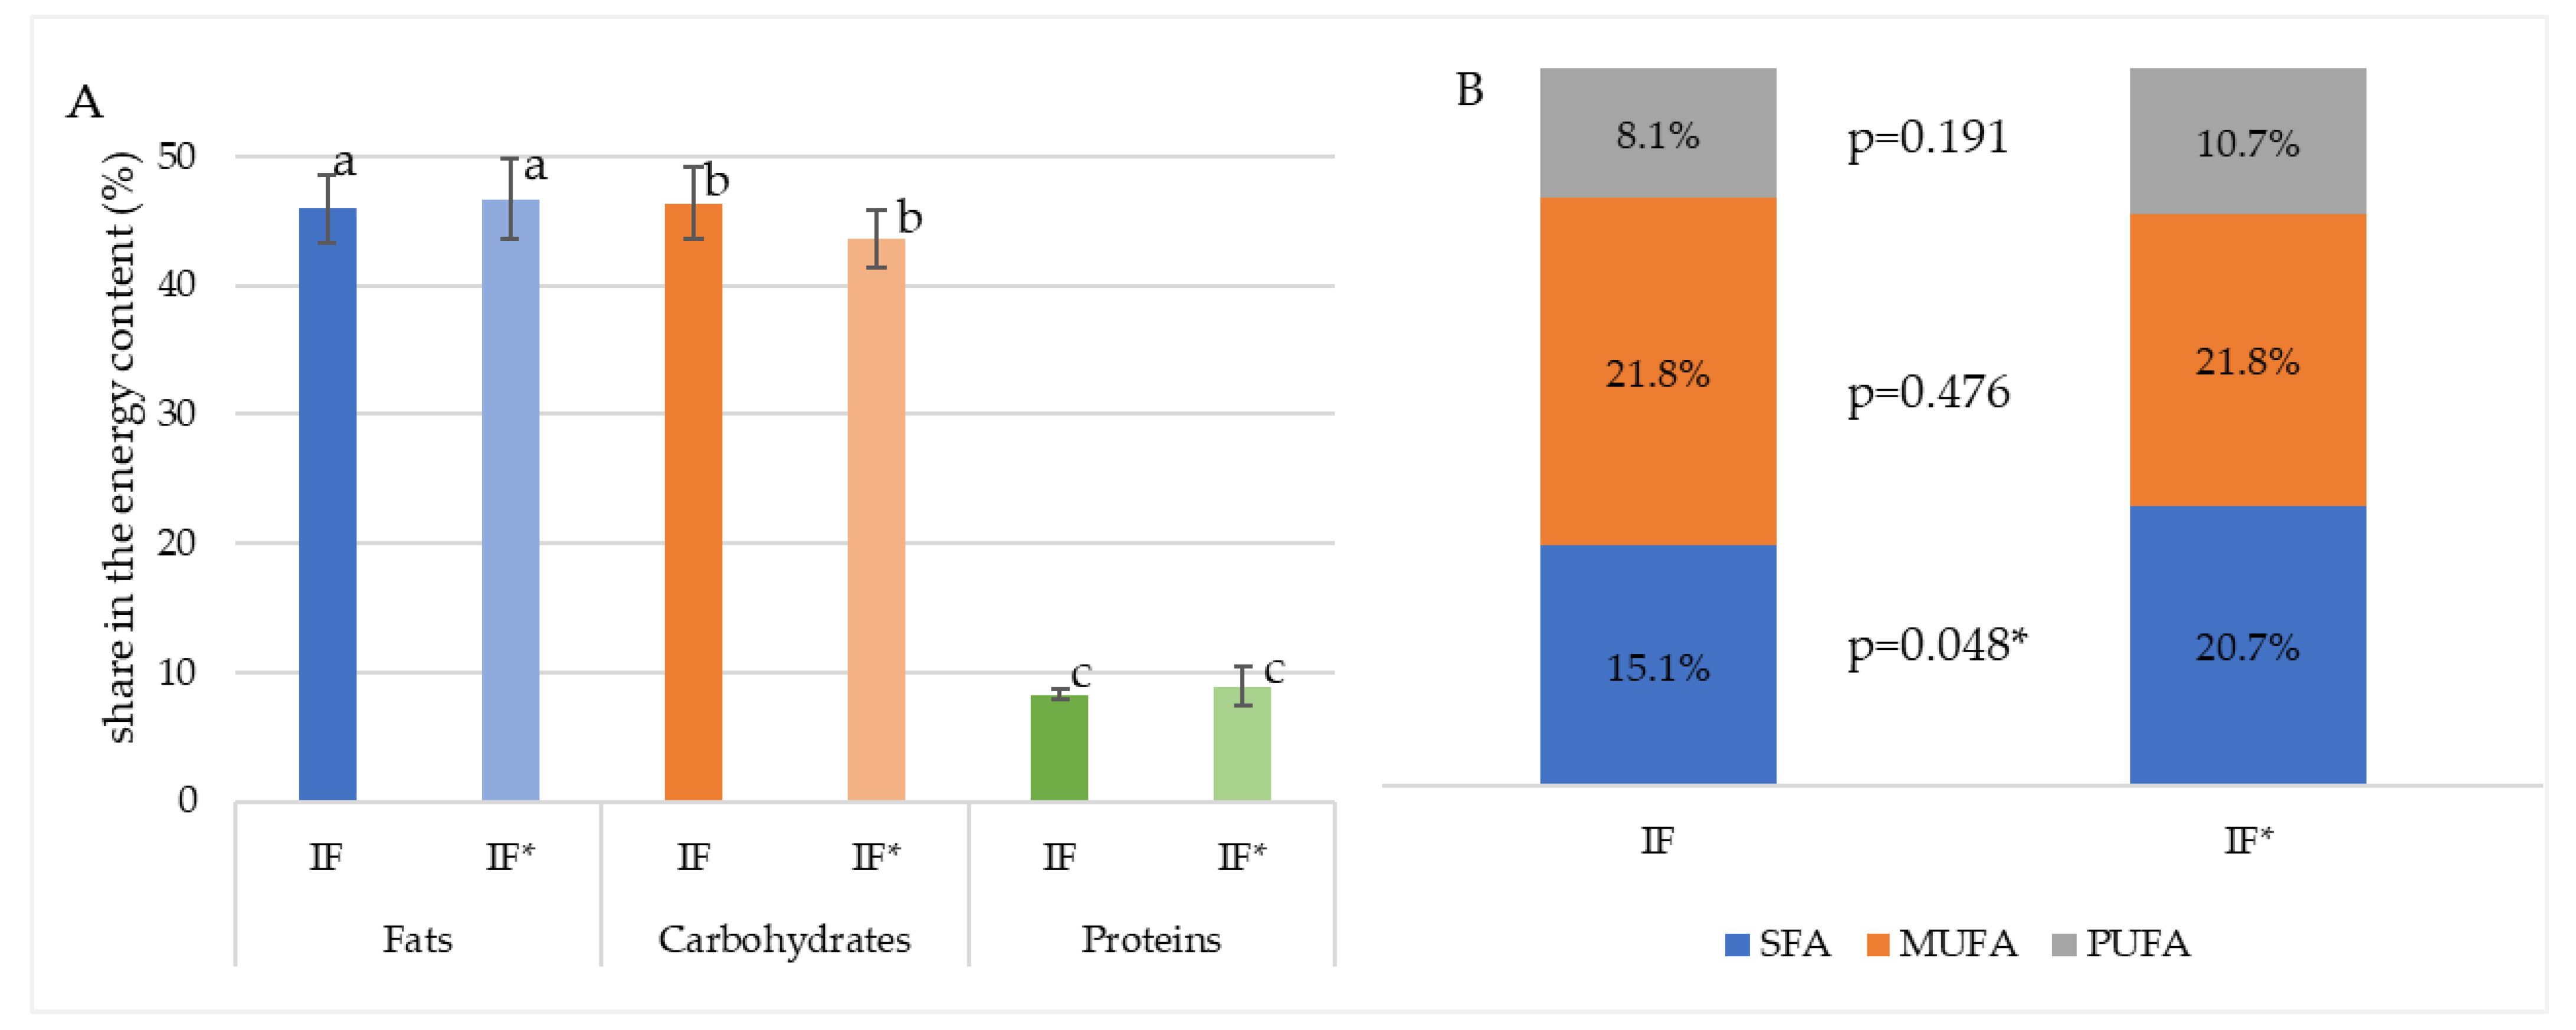
2.2. Energy–Nutritional and Chemical Composition of Infant Formulas

For each prepared volume of infant formula, the energy–nutritional content and chemical composition were calculated, based on the data presented in Tables S1 and S2. The declaration states that the number of scoops for the preparation of a certain volume of formula (masses at the top of the scoop are in the range of 3–4.5 g, depending on the manufacturer). Depending on the volume prepared and on the basis of the mass of the powder used, energy and nutrient values were calculated. The Table S1 presents the energy and nutritional values of the powders of tested infant formulas while Table S2 contains information on the chemical composition of the tested infant formulas.

2.3. Conductivity and Total Dissolved Solids

The temperature, electrical conductivity, and total dissolved solids (TDS) content of the prepared infant formulas were monitored using an Omron device (SevenCompact MettlerToledo, Greifensee, Switzerland). Electrical conductivity of liquids represents the potential of aqueous solutions to transmit electricity and is proportional to the share of total dissolved solid matter in water [14].

2.4. Colorimetry

By using the PCE Instruments colorimeter, the color parameters for investigated baby formulas were determined. The CIELAB color space was used (French: Commission Internationale de l’Éclairage LAB). The differences ∆L*, ∆a*, and ∆b* reflect how much the test sample differs from the standard and then, based on these values, ∆E is calculated according to the following formula:
Δ E i = L * M P L * i 2 + L a * M P a * i 2 + b * M P b * i 2
where ΔE* presents the total color difference in a sample i; ΔL* (L*MPL*i) is the difference in brightness of the tested sample I; and the standard (solution prepared with powder milk), Δa* (a*MPa*i), and Δb* (b*MPb*i) are the differences in chromaticity between the tested sample and the standard.

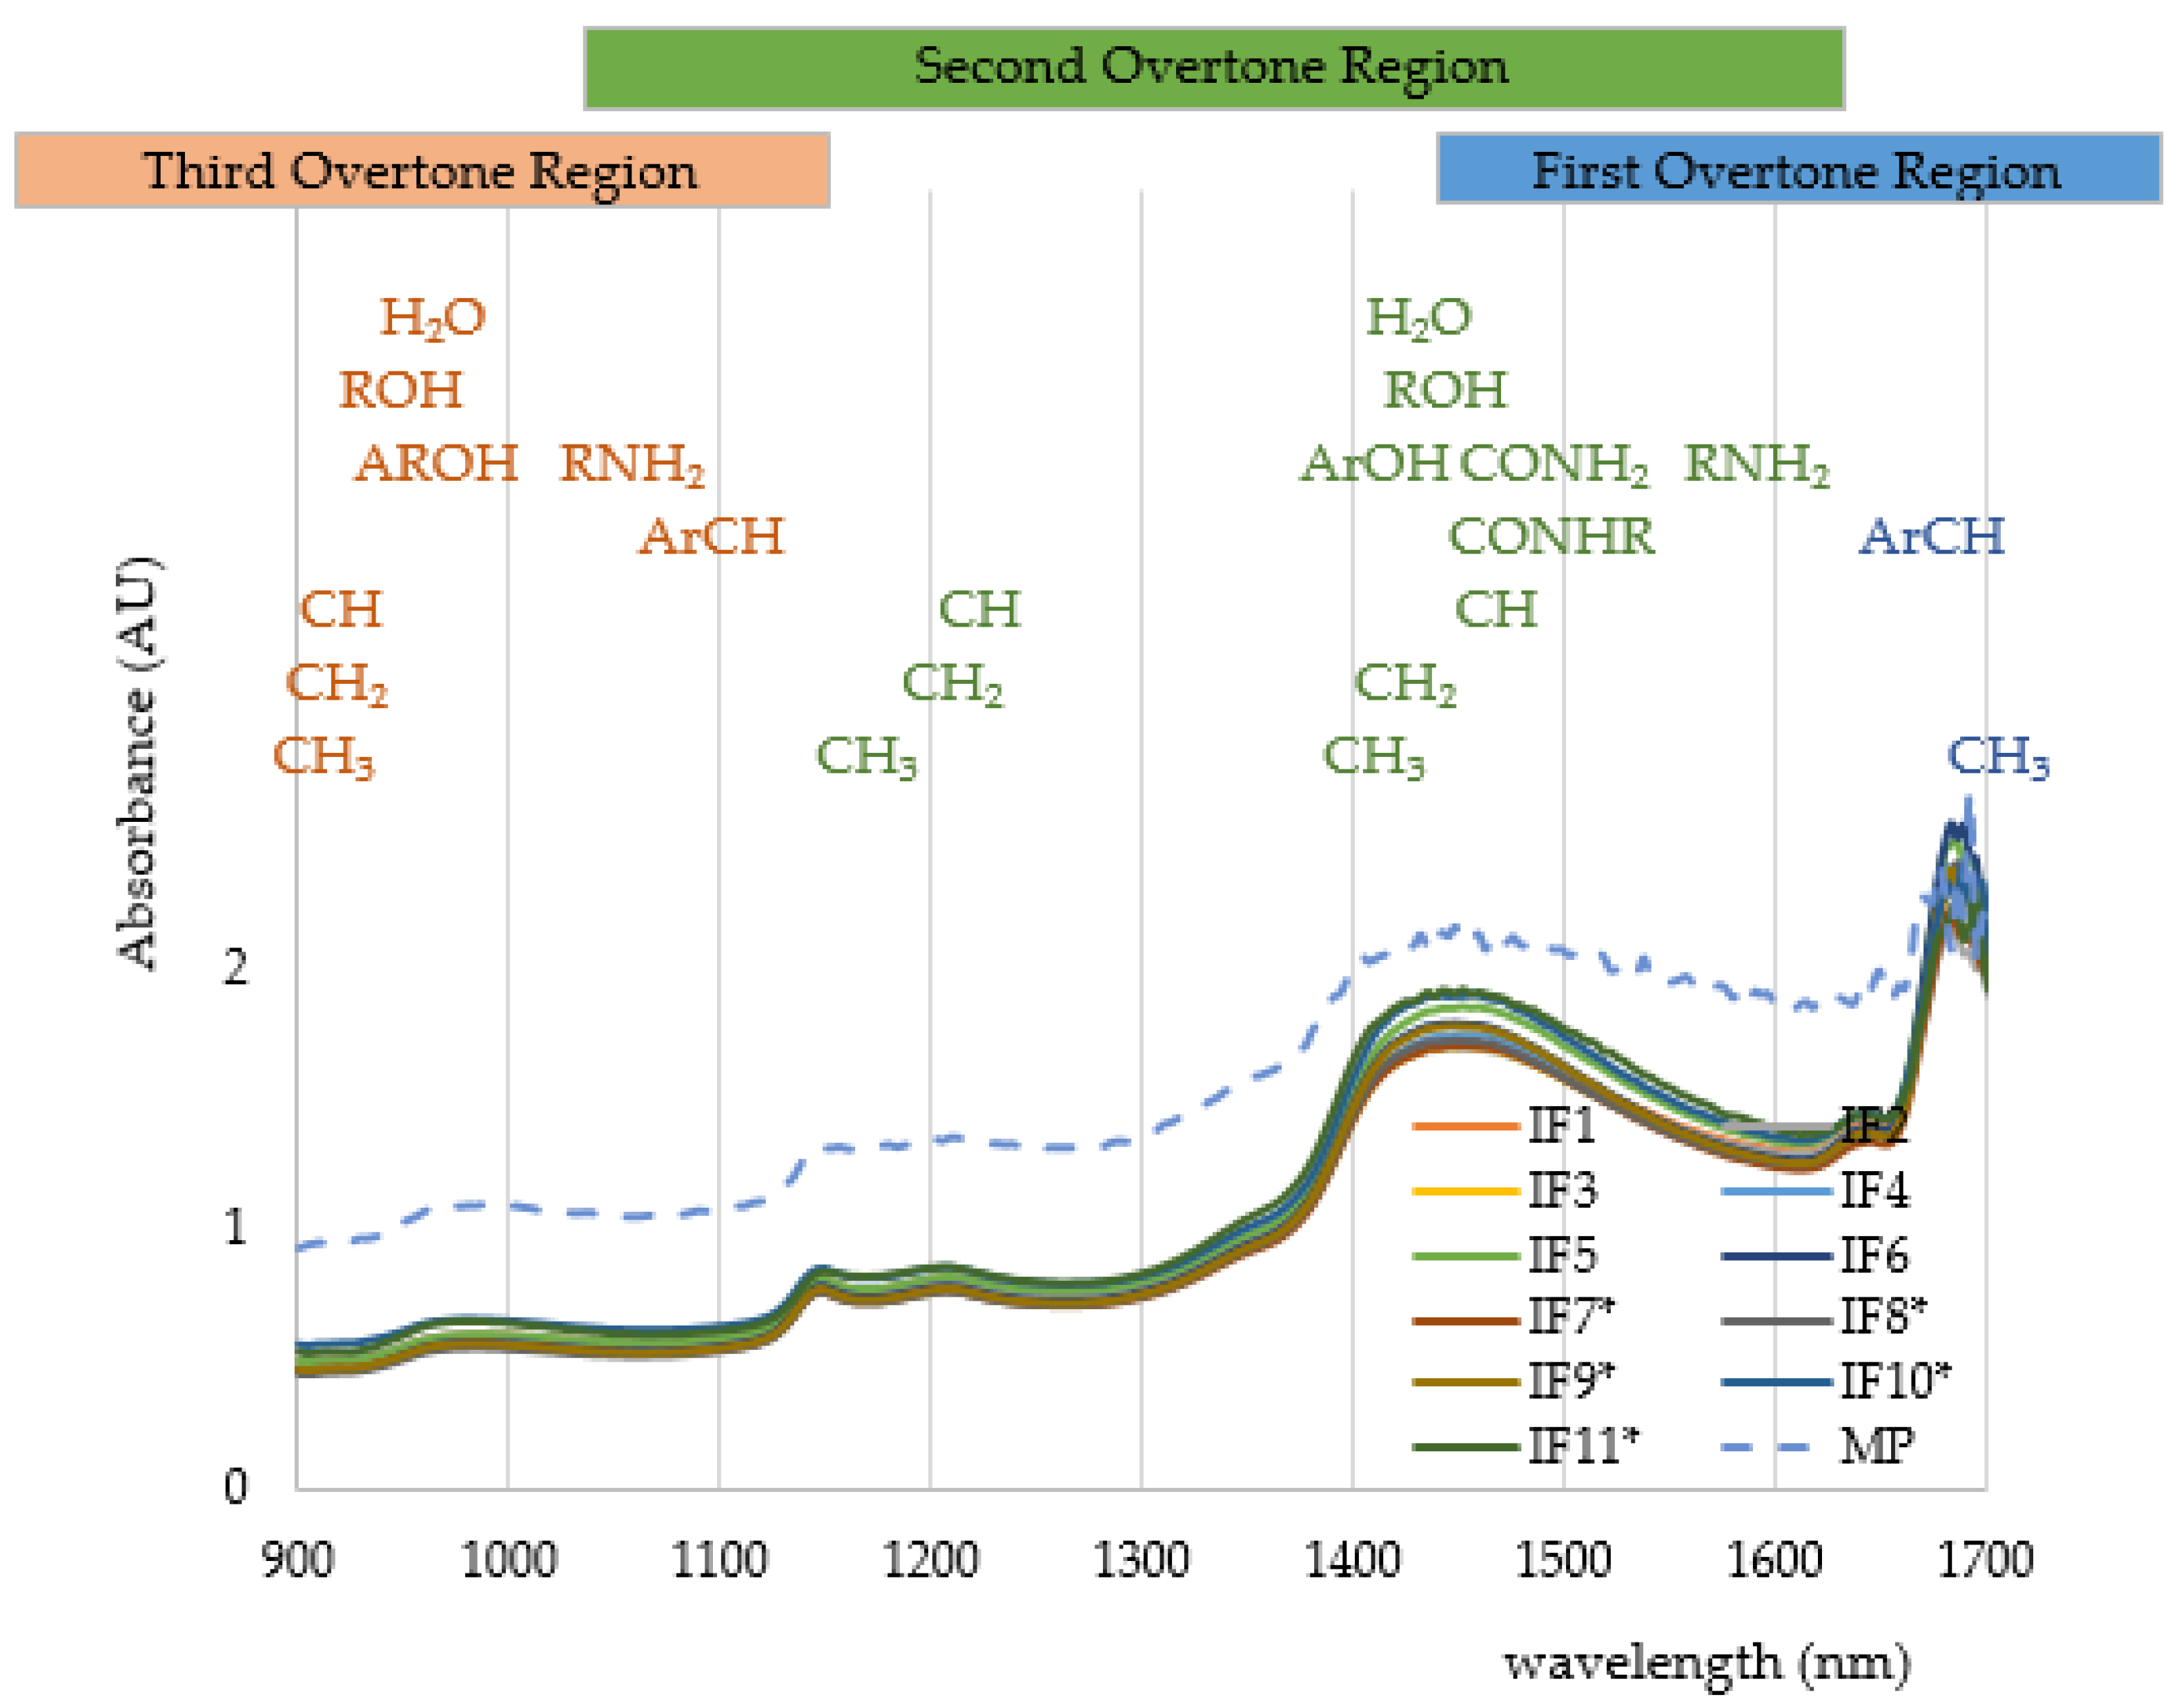
2.5. NIR Spectroscopy

Two measuring devices were used in this work: the (i) laboratory benchtop and (ii) micro device. The performances of the devices were compared by investigating their precision (focusing on repeatability and reproducibility).

2.5.1. Benchtop Device

A laboratory device was used, namely the Control Development, Inc. NIR spectrometer, model NIR-128-1.7-USB/6.25/50 µm (South Bend, IN, USA). This device uses halogen light and has installed the Control Development Spec32 software, v. 1.6. All NIR spectra of powder milk and infant formula samples were recorded at ambient temperature in the range 904 nm to 1699 nm (path length 1 nm). The absorption spectrum for each sample (different volumes of different infant formulas) was recorded in triplicate and, between each measurement, the sample was removed and returned to the measurement location.

2.5.2. Portable NIR Device

The portable NIR spectrometer is a micro-NIR device (NIR-S-T2, InnoSpectra Corporation, Hsinchu, Taiwan) and its wavelength range is the same as for the benchtop device, from 900 to 1700 nm (path length 3.5 nm) using halogen light as well. The software ISC-NIRScan v. 2.18 (InnoSpectra Corporation, Hsinchu, Taiwan) is used with the device. Samples were also recorded at ambient temperature, in triplicate.

2.5.3. Processing of Spectral Data

Before the preprocessing of spectral data, an assessment of the reproducibility and repeatability of the two devices was conducted. Selected samples (IF3; IF5; IF8; and MP) were scanned 10 times. The reproducibility was calculated on 10 scans for the mentioned samples that were re-loaded and re-scanned, while the repeatability was calculated on 10 consecutive scans where the sample was not moved. As suggested [15,16], key wavelengths are selected for absorbance spectra recorded with two devices. So, for the benchtop instrument, the key wavelengths are 1152 nm, 1455 nm, and 1684 nm, and 1153, 1445 nm, and 1674 nm for the micro-NIR instrument. Absorbances were recorded at the mentioned wavelengths and the mean value and the standard deviation (SD) was calculated based on ten of them. The result is presented as relative standard deviation (RSD = SD/average) per observed wavelength [3]. For the RSD calculations, absorbances at any wavelength could be selected; here, wavelengths are used that are confirmed to be associated with water (1156 nm and 1460 nm), starch (1450 nm), aromatic primary amines (1445 nm), C-H aromatic group (1680 nm), and proteins (1690–1696 nm) [3,15].
Different pre-processing methods were tested on the NIR spectra (Standard Normal Variate (SNV), Normalization, and Multiplicative Scatter Correction (MSC) followed by spectral derivation techniques (Savitzky-Golay (SG) 1st or 2nd derivatives) [17]. As the most suitable, the SNV combined with the SG 2nd derivative was extracted. With regard to the variable importance for projection, (VIP) was computed (VIP > 1) and used for model development [18].

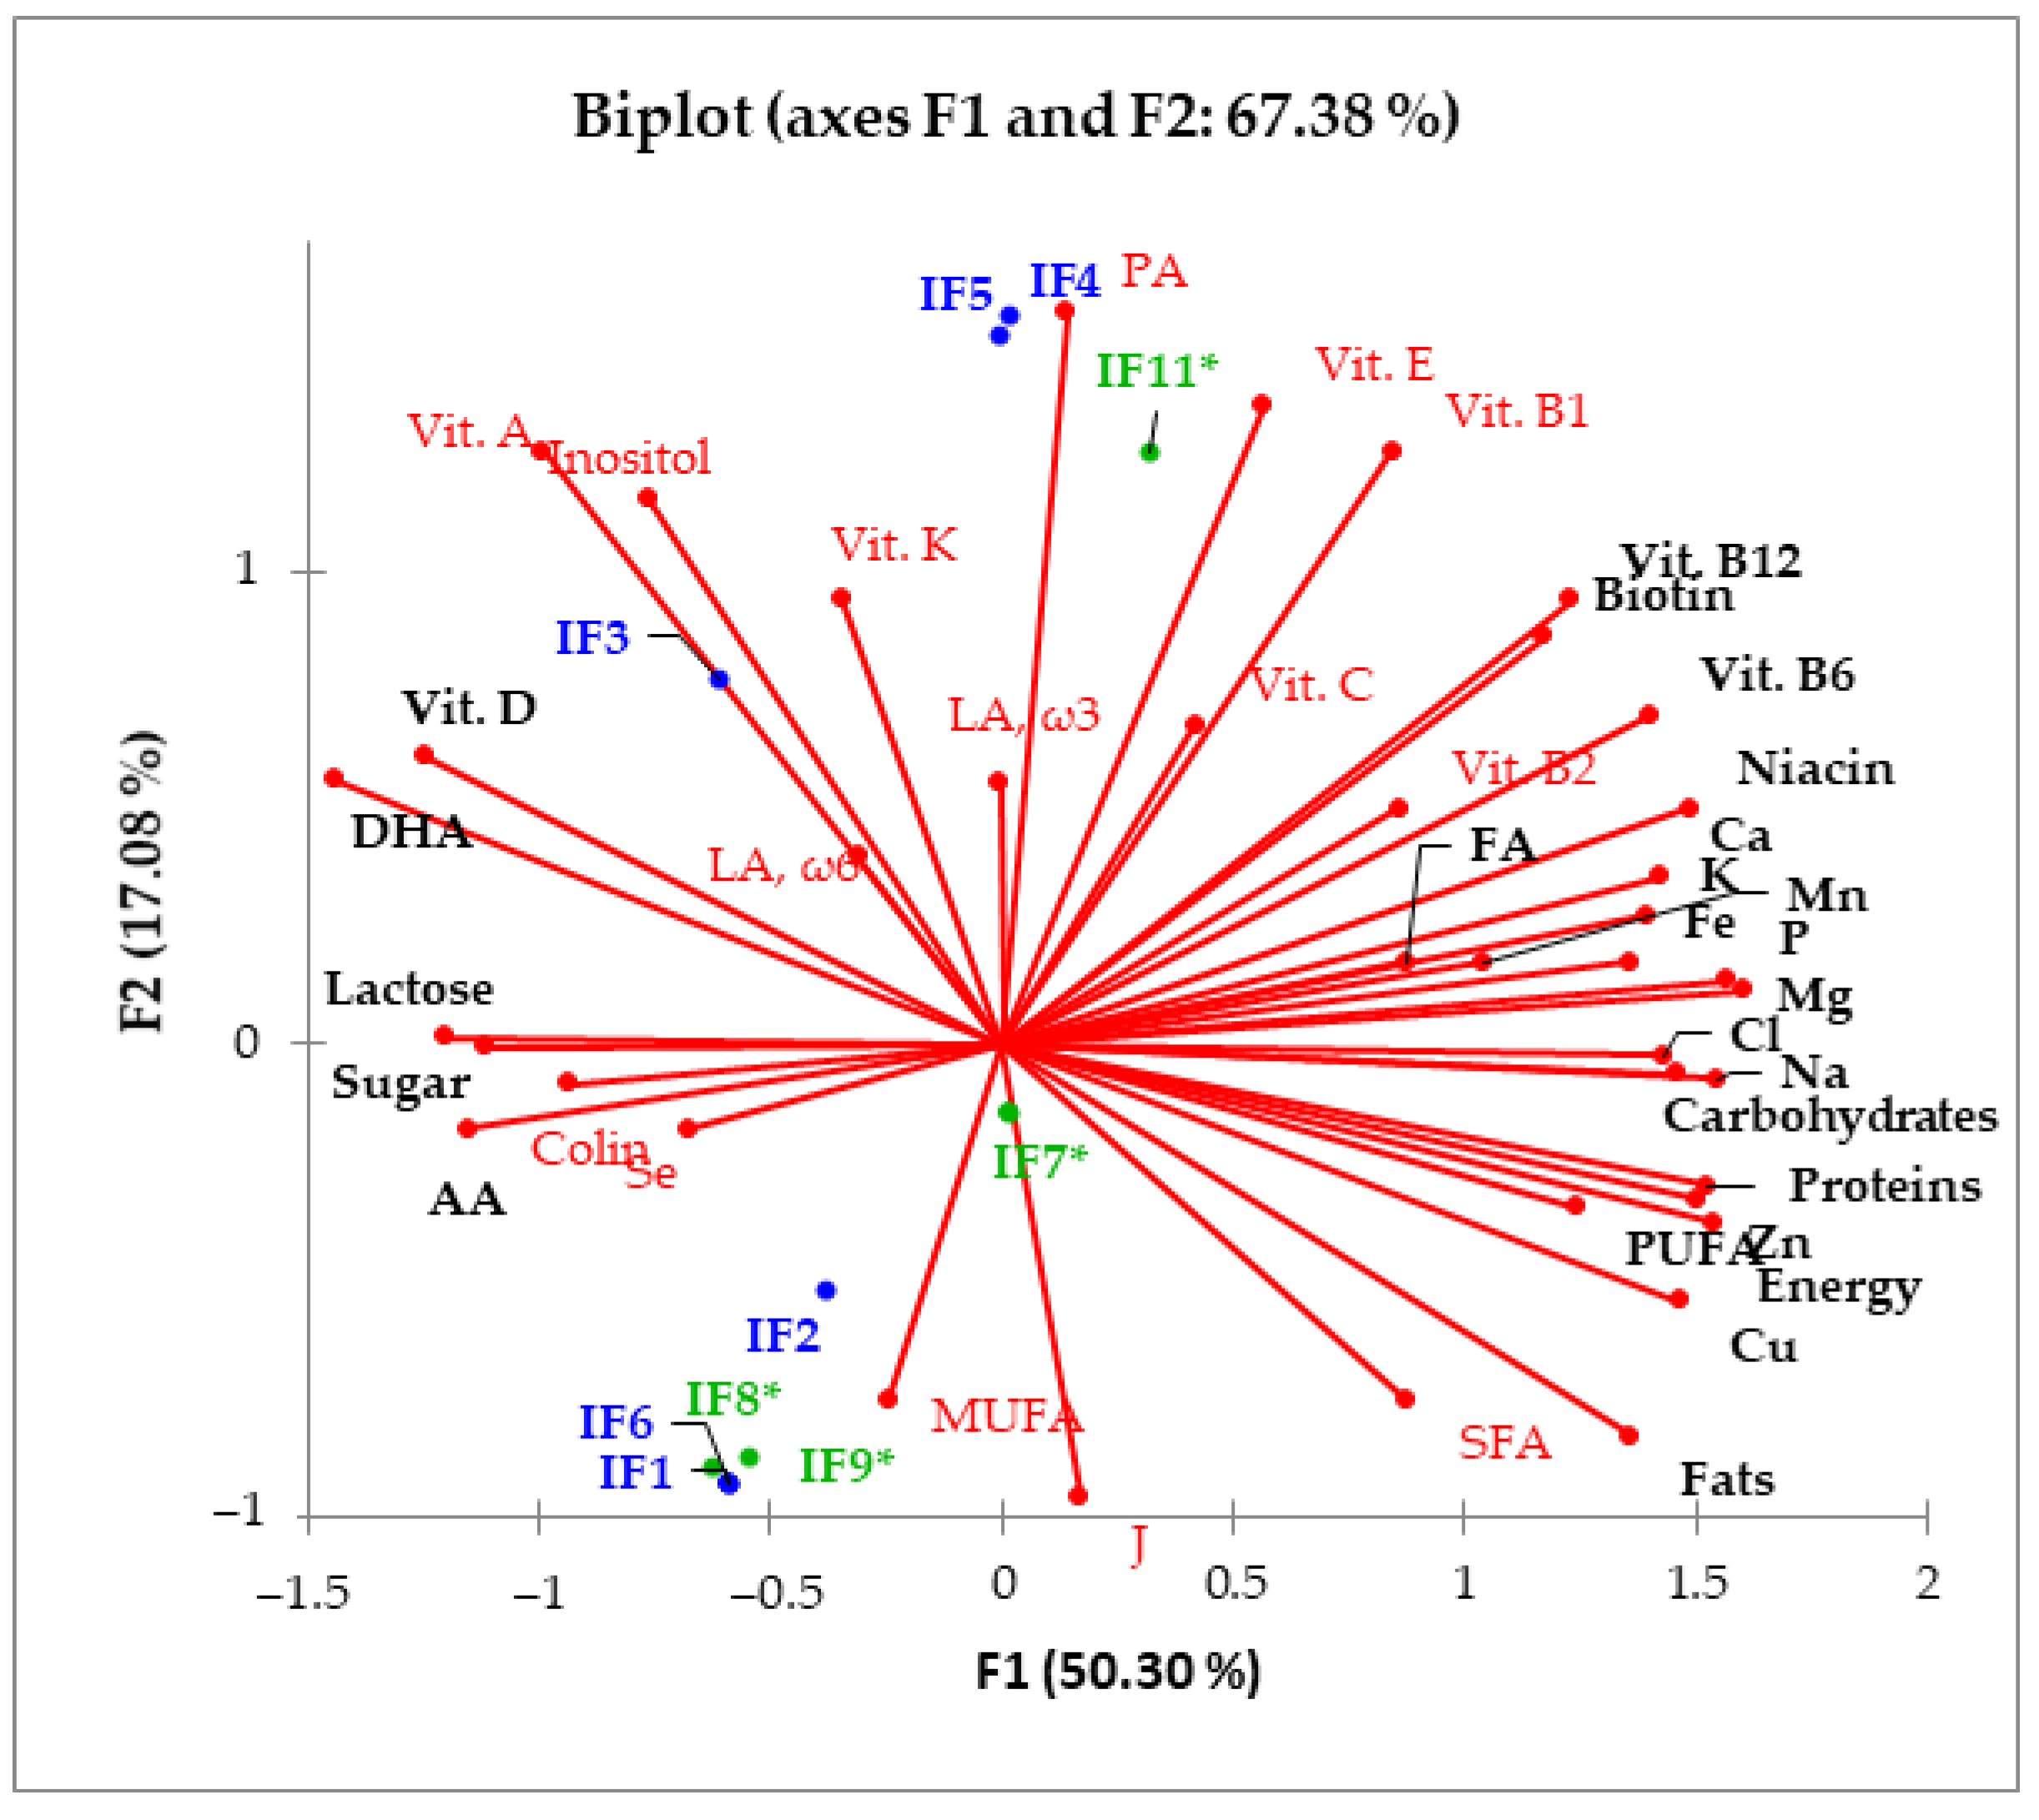
2.6. Data Analysis and Chemometrics

Similarities and differences between the mean values of the observed parameters across different infant formulas were analyzed using a t-test, with a significance level of p < 0.05. Measured data of color, conductivity, TDS, and NIR spectroscopy were processed in the XLSTAT program (AddinSoft, Paris, France) and the software Unscrambler X 10.5.1 (CAMO, Oslo, Norway) was used for the chemometrics.
The chemometric tools used in this paper were (i) Principal Components Analysis (PCA) and (ii) partial least square regression (PLS). The PCA analysis gave an insight into sample grouping, based on their similarity or difference [19]. The PLS regression analysis was performed on a data matrix that contained preprocessed NIR spectra and measured data for color, conductivity, conductivity, and energy nutritional parameters. The representativeness of the obtained models was evaluated based on the (i) coefficient of determination (R2), (ii) standard error of prediction (SEP), (iii) root mean square error of prediction (RMSEP), and (iv) the ratio of standard error of performance to standard deviation (RPD) and the Range Error Ratio (RER; ratio of the range of the reference value in the validation set and the standard deviation) [20]. From the dataset of 165 samples, 60% was allocated for calibration, 35% for validation, and 5% for prediction. The calibration and validation sets consist of randomized samples, which may result in three spectra from the same sample being grouped together in either the calibration or validation set. The predictive performance of the PLSR model was then assessed on the remaining 5% of the samples.

3. Results

Infant formulas differ in nutritional composition, depending on whether they are special purpose infant formulas (IF*) or not. Their energy–nutritional content and ingredients are listed in more detail in Tables S1 and S2 and the basic comparison through average macronutrients outlining the share of fatty acids in energy intake are shown in Figure 1.
The fat content ranged from 3.2 g/100 mL (IF3) of the prepared meal to 4.6 g (IF10*), indicating differences between infant formulas for regular and specific needs. Although no significant differences were confirmed (Figure 1A,B), the study of Mendonça et al. [21] is primarily a consequence of the source of lipids and, according to the data from Table S2, it is evident that the source of lipids in infant formula F10* is Palm oil, Canola, and Coconut oil, while in the IF3, in addition to the other oils that it has in common with the F10* sample, rapeseed oil with low erucic acid content and Mortierella alpina mushroom oil was also added. But, as stated in the guidelines [22], it is an obligation to present this on the label.
Regarding the color differences, regular infant formulas resulted in significantly higher values of ΔE (Figure 2), ranging from 1.42 (IF2) to 6.75 (IF4), while the infant formulas for specific purposes ranged from 2.39 (IF7*) to 3.95 (IF10*). Values of ΔE greater than 2 indicate that the color difference can be noticed; the color difference is clearly visible when the value ΔE is ≥3.5 [23].
The total dissolved solid values ranged from 1.3 mg/L (IF9*) to 2.4 mg/L (IF10*) and, as the TDS values are in a linear relationship with the conductivity [24], the conductivity values are in the range of 2.7 to 4.8 µS/cm (Figure S1). The final measurements were conducted with the NIR devices. Raw NIR spectra for the micro-NIR device are presented in Figure 3.
The typical shape of the spectra of milk substitutes and milk powder itself (Figure 3) is one of the indicators that can be used in the case of adulteration or the presence of undesirable contaminants, such as melatonin [25]. Given that two NIR devices were used, it is necessary to compare the precision parameters they offer, whereby repeatability and reproducibility parameters were calculated according to the recommendation of Williams et al. [5] and shown in Table 2.
Repeatability results are based on the results of the ratio of the standard deviation to the mean (RSD) of absorbance values at key wavelengths for 10 consecutively recorded spectra with a non-moving sample. The repeatability is based on the RSD of the spectral data when the sample is scanned 10 times, but the cuvette is removed or the probe is moved between scans. The data in Table 2 show that the repeatability parameters for the laboratory bench-top device are lower, regardless of which wavelength is observed, and the same trend is found for repeatability of a portable and desktop NIR device [26].
After comparing the devices, the qualitative grouping of the samples was determined using PCA and pre-processing of the spectra (for each device separately) and calibration, validation, and prediction. The results of the PCA analysis indicated the most important nutrients, reducing the observed set (column 1 in Table S1) on 25 VIP variables. The observed set as well as the VIP variables are presented in Figure 4, where the VIPs are black-bolded.
For the last segment, it was necessary to subject preprocessed NIR spectra to the VIP variables, and we have chosen five from the set of chemical composition (macronutrients: proteins, carbohydrates, and fats as well as polyunsaturated fatty acids (PUFA) and Docosahexaenoic Acid (DHA), as an obligated component in infant formulas) and five related to physical properties (color parameters (L*a*b*); the TDS and conductivity PLS regression analysis were conducted on this data matrix and the models’ predictive efficiency was evaluated using the coefficients of determination and RPD, RER, SEP, and RMSEP values [27]. The goal is to achieve SEP and RMSEP values that are as low as possible, while the coefficient of determination should be as close to 1 as possible, with RPD values greater than 2.5 and RER values greater than 6 (Table 3).
Although the calibration coefficients of determination (R2c) are promising with values ranging from 0.798 to 0.999, the predictive potential, according to RPD and RER values, remains in the moderately successful quantification range [27,28].

4. Discussion

An important aspect from the perspective of production process control as well as also product quality control, is the stability of the final product and persistent share of key nutritional parameters, such as macronutrients. The color uniformity of the product and total dissolved substances are also important factors in food industry [29,30]. Breast milk is characterized by a dynamic content of all components, which adapts to the unique needs of the infant. The basic composition of breast milk is 87–88% water and 124 g/L of solid components with macronutrient values of about 7% carbohydrates, ≈1% proteins, and ≈3.8% fats [31]. On the contrary, the composition of infant formulas is constant and unchanging, so it does not necessarily follow all the nutritional needs of the infant, which change depending on various conditions. Although the progress in the development of infant formulas is noticeable, human breast milk remains an unattainable goal and the gold standard of infant nutrition with the approximate proportion of fats around 50%, while carbohydrates make up 40% of the share in energy [32]. The protein content is constant in all infant formulas (8–9%), while the proportions of fat and carbohydrates vary, especially if the infant formulas are intended for specific needs. The ΔE value provides significant information about the color differences in infant formulas and milk powder solutions. In all tested infant formulas, a certain difference in color is visible compared to powdered milk, which can also be a consequence of the reaction of the ingredients during storage [33]. Infant formulas for specific needs are more similar to each other (samples IF9*-IF11*), concerning the color parameters. Human breast milk presents a water solution with solid components [31], which is the reason why the TDS and conductivity were recorded and the lowest and highest values are established in infant formulas for special purposes (1.35 mg/mL in IF9* and 2.2 mg/mL in F10*, respectively).
The multivariate approach, in data investigation, started with the PCA analysis because its primary goal is the analysis of relations within the observed dataset and enables the qualitative differentiation of the samples based on their grouping, according to similarities and/or dissimilarities. This approach applied in the study of Liu et al. [34] made it possible to identify contaminated samples with different concentrations of hydrolyzed whey protein and melamine, added to infant formulas. In our case, only sample IF11* is positioned in the first quadrant, which can be attributed to its different chemical composition compared to the other samples. Notably, it is the only infant formula based on hydrolyzed milk proteins. This finding confirms that multivariate tools can effectively identify samples containing undesirable ingredients. The foregoing confirms the justification of the application of NIR measurements because they record the vibrations of molecules in the near-infrared range (400–2500 nm). Studies that used the same chemometric tools state that such a good qualitative potential can also indicate the possibility of quantitative prediction of the observed parameters based on NIR spectra [3,35]. The application of PCA analysis also made it possible to reduce the observed number of parameters of the chemical composition according to their significance [36], so that a PLS regression analysis could be performed from that dataset.
Partial regression using the method of least squares (PLS) is the most commonly applied method of quantitative analysis that connects observed parameters with NIR spectra [3] and solves the problem of multiple regression, such as correlation between independent variables. This method allows considering most of the variations between the observed information (in our case from the NIR spectrum) and the prediction of the dependent variable [37]. The table shows commonly used parameters such as the coefficient of determination (R2), the standard error of prediction (RPD), and the ratio of the standard error of prediction to the range of measurement data (RER) [38]. A good and qualitatively useful NIR calibration model will be the one evaluated with values of R2 in the range of 0.83–0.9 and quantitatively acceptable for values > 0.9, while the minimum acceptable values of the parameters RPD and RER are set to values of 3 and 10 [5,39]. The PCA analysis identified 25 parameters as VIPs but only the five most significant were included in the PLSR. This decision is supported by the data in Table S1, which highlights the similarity in chemical composition among the infant formulas. For instance, copper levels are around 0.05 mg in 10 of the formulas, while 1 formula (IF10*) has twice that amount at 0.1 mg. However, the challenge lies in parameters that were detected in only a few formulas. For example, starch was found in just three formulas, with concentrations ranging from 0.1 to 1 g. Parameters that exhibit very similar values or extremely wide ranges (especially when absent in most samples) can significantly impact the models. If a parameter is absent in the calibration and/or validation set (e.g., n.s. in Table S1), the models may either show low coefficients of determination, RPD, and RER values [40,41,42,43] or display high coefficients of determination along with high SEP and RMSEP values.
When dealing with food for highly sensitive groups, such as infant formulas, it is crucial to base conclusions on as much data as possible. Therefore, efforts were made to reduce the future applicability of the models developed in this work, focusing on the five most significant nutritional parameters. However, the limited availability of data poses a challenge to generalizing these models, which would need to be specifically developed for specialized or standard infant formulas. This limitation represents a significant drawback of this approach.
Slightly better results of the regression analysis in favor of the micro-device were certainly also affected by the smaller number of wavelengths recorded with the micro-device records (228 vs. 796 (laboratory)). For the micro-device, 21 VIP wavelengths were identified (901 nm, 905 nm, 914 nm, 1391 nm, 1394 nm, 1545 nm, 1548 nm, 1551 nm, 1555 nm, 1558 nm, 1561 nm, 1564 nm, 1567 nm, 1570 nm, 1640 nm, 1643 nm, 1646 nm, 1649 nm, 1655 nm, 1680 nm, and 1689 nm), whereas the number of VIP wavelengths was significantly higher in the NIR spectra recorded with the benchtop device. Although the macronutrient composition of infant formulas has been previously investigated [8,9,10,11,12,13,21,22] and linked to NIR spectra [33,34], this is the first study to include both regular and special-purpose infant formulas, using two NIR devices—one of which is a more affordable design, yet still delivers quality results within an acceptable range. However, it is important to highlight the limitations identified in this research, particularly the indirect nature of the NIR method. This approach necessitates the development of chemometric models, which can vary based on factors such as pre-processing procedures, sample size, and other variables.
This study showed that NIR spectroscopy shows potential in distinguishing infant formulas and for this reason, benchtop and micro-NIR devices can be used on a qualitative level, but the devices also showed potential on a quantitative level and with moderate success even on a quantitative level.

5. Conclusions

The results suggest that even a low-cost spectrometer such as the micro-NIR device is a promising tool in the qualitative differentiation of infant formulas, with moderate success in the quantitative prediction of the color parameters, TDS, conductivity, as well as the macronutrients PUFA and DHA. It was possible to connect the data from the declarations with the spectra of the two NIR devices and to use the PLSR model to predict the parameters that were singled out as key, through the PCA analysis. However, since this is a food product intended for the most vulnerable group, infants, there is an exceptional emphasis on the quality and safety of the product. This is precisely why it is extremely important that, regardless of the device, it was possible to determine a clearly visible trend in the spectra of infant formulas and qualitative analysis with such a fast, sustainable, and cheap method is certainly possible in the industry during the control of raw materials, but also in the sales chain itself. This work confirmed that NIR spectroscopy has the potential for qualitative assessment, but also for quantitative assessment of the color, physical parameters, and chemical composition without time consumption, expensive, and/or toxic solvents, thus minimizing the need for long-term sample preparation and expensive analyses. With a larger number of infant formulas, the creation of open bases with NIR spectra of originals and counterfeits would certainly be another step closer to a more sustainable and green food production and food control system.

Supplementary Materials

The following supporting information can be downloaded at https://www.mdpi.com/article/10.3390/pr12081771/s1, Figure S1: Total dissolved solids (TDS) and conductivity for regular infant formulas (IFs) and for specific needs (IFs*); Table S1: Energy–nutritional composition of infant formulas and milk powder (per 100 mL of ready meal); Table S2: Ingredients listed on the investigated infant formulas.

Author Contributions

Conceptualization, I.M., M.Z. and J.G.K.; methodology, I.M., M.Z., T.J., D.V., M.B., A.J.T. and J.G.K.; software, T.J., D.V., M.B., A.J.T. and J.G.K.; validation, A.J.T. and J.G.K.; formal analysis, I.M., M.Z., T.J. and J.G.K.; investigation, I.M., M.Z. and J.G.K.; resources, T.J., D.V., M.B., A.J.T. and J.G.K.; data curation I.M., M.Z., T.J., D.V., M.B., A.J.T. and J.G.K.; writing—original draft preparation, I.M., M.Z., T.J., D.V., M.B., A.J.T. and J.G.K.; writing—review and editing, I.M., M.Z., T.J., D.V., M.B., A.J.T. and J.G.K.; visualization, I.M., M.Z., T.J., D.V., M.B., A.J.T. and J.G.K.; supervision, I.M., M.Z., T.J., D.V., M.B., A.J.T. and J.G.K.; project administration, I.M., M.Z., T.J., D.V., M.B., A.J.T. and J.G.K.; funding acquisition, I.M., M.Z., T.J., D.V., M.B., A.J.T. and J.G.K. All authors have read and agreed to the published version of the manuscript.

Funding

This research received no external funding.

Data Availability Statement

Dataset and sample information is available on request from the authors.

Conflicts of Interest

The authors declare no conflicts of interest.

References

  1. Fung, F.; Wang, H.S.; Menon, S. Food safety in the 21st century. Biomed. J. 2018, 41, 88–95. [Google Scholar] [CrossRef] [PubMed]
  2. Jurinjak Tušek, A.J.; Benković, M.; Malešić, E.; Marić, L.; Jurina, T.; Gajdoš Kljusurić, J.G.; Valinger, D. Rapid quantification of dissolved solids and bioactives in dried root vegetable extracts using near infrared spectroscopy. Spectrochim. Acta Part. A Mol. Biomol. Spectrosc. 2021, 261, 120074. [Google Scholar] [CrossRef]
  3. Beć, K.B.; Grabska, J.; Huck, C.W. Miniaturized NIR spectroscopy in food analysis and quality control: Promises, challengles and perspectives. Foods 2022, 11, 1465. [Google Scholar] [CrossRef]
  4. Osborne, B.G. Near-infrared spectroscopy in food analysis. Encycl. Anal. Chem. 2006, 1–14. [Google Scholar] [CrossRef]
  5. Williams, P.; Antoniszyn, J.; Manley, M. Near Infrared Technology: Getting the Best out of Light; African Sun Media: Stellenbosch, South Africa, 2019. [Google Scholar]
  6. Pandiselvam, R.; Prithviraj, V.; Manikantan, M.R.; Kothakota, A.; Rusu, A.V.; Trif, M.; Mousavi Khaneghah, A. Recent advancements in NIR spectroscopy for assessing the quality and safety of horticultural products: A comprehensive review. Front. Nutr. 2022, 9, 973457. [Google Scholar] [CrossRef]
  7. Wang, X.; Zhong, J. Near-infrared spectroscopy for food quality evaluation. In Woodhead Publishing Series in Food Science, Technology and Nutrition, Evaluation Technologies for Food Quality; Woodhead Publishing: Sawston, UK, 2019; pp. 105–118. [Google Scholar] [CrossRef]
  8. De Mendonça Pereira, B.F.; de Almeida, C.C.; Leandro, K.C.; da Costa, M.P.; Conte-Junior, C.A.; Spisso, B.F. Occurrence, sources, and pathways of chemical contaminants in infant formulas. Compr. Rev. Food Sci. Food Saf. 2020, 19, 1378–1396. [Google Scholar] [CrossRef] [PubMed]
  9. Gilmore, L.A.; Altazan, A.D.; Flanagan, E.W.; Beyer, A.G.; Olson, K.N.; O’Connell, A.A.; Nguyen, T.H.; Beyl, R.A.; Redman, L.M. Modifications to Infant Formula Instructions Improve the Accuracy of Formula Dispensing. Nutrients 2020, 12, 1150. [Google Scholar] [CrossRef]
  10. Lemaire, M.; Le Huërou-Luron, I.; Blat, S. Effects of infant formula composition on long-term metabolic health. J. Dev. Orig. Health Dis. 2018, 9, 573–589. [Google Scholar] [CrossRef] [PubMed]
  11. Kouwenhoven, S.M.P.; Muts, J.; Finken, M.J.J.; Goudoever, J.B.V. Low-Protein Infant Formula and Obesity Risk. Nutrients 2022, 14, 2728. [Google Scholar] [CrossRef]
  12. Stevens, E.E.; Patrick, T.E.; Pickler, R. A history of infant feeding. J. Perinat. Educ. 2009, 18, 32–39. [Google Scholar] [CrossRef]
  13. Jiang, Y.J.; Guo, M.R. Infant formula product regulation. In Human Milk Biochemistry and Infant Formula Manufacturing Technology, 2nd ed.; Woodhead Publishing: Sawston, UK, 2014; pp. 281–316. [Google Scholar]
  14. Mikulec, V.; Adamović, P.; Cvetković, Ž.; Ivešić, M.; Gajdoš Kljusurić, J. Green Techniques for Detecting Microplastics in Marine with Emphasis on FTIR and NIR Spectroscopy—Short Review. Processes 2023, 11, 2360. [Google Scholar] [CrossRef]
  15. Posom, J.; Sirisomboon, P. Evaluation of the higher heating value, volatile matter, fixed carbon and ash content of ground bamboo using near infrared spectroscopy. J. Near Infrared Spectrosc. 2017, 25, 301–310. [Google Scholar] [CrossRef]
  16. Wolfrum, E.J.; Payne, C.; Schwartz, A.; Jacobs, J.; Kressin, R.W. A Performance Comparison of Low-Cost Near-Infrared (NIR) Spectrometers to a Conventional Laboratory Spectrometer for Rapid Biomass Compositional Analysis. Bioenerg. Res. 2020, 13, 1121–1129. [Google Scholar] [CrossRef]
  17. Rinnan, Å.; Van Der Berg, F.W.J.; Engelsen, S.B. Review of the most common pre-processing techniques for near-infrared spectra. Trends Anal. Chem. 2009, 28, 1201–1222. [Google Scholar] [CrossRef]
  18. Mata, M.M.D.; Rocha, P.D.; Farias, I.K.T.; Silva, J.L.B.D.; Medeiros, E.P.; Silva, C.S.; Simões, S.D.S. Distinguishing cotton seed genotypes by means of vibrational spectroscopic methods (NIR and Raman) and chemometrics. Spectrochim. Acta Part A Mol. Biomol. Spectrosc. 2022, 266, 120399. [Google Scholar] [CrossRef]
  19. Kljusurić, J.G.; Boban, A.; Mucalo, A.; Budić-Leto, I. Novel Application of NIR Spectroscopy for Non-Destructive Determina-tion of ‘Maraština’Wine Parameters. Foods 2022, 11, 1172. [Google Scholar] [CrossRef]
  20. Fearn, T. Assessing Calibrations: SEP, RPD, RER and R2. NIR News 2002, 13, 12–13. [Google Scholar] [CrossRef]
  21. Mendonça, M.A.; Araújo, W.M.C.; Borgo, L.A.; Alencar, E.R. Lipid profile of different infant formulas for infants. PLoS ONE 2017, 12, e0177812. [Google Scholar] [CrossRef]
  22. USDA. Guidance for Industry: Labeling of Infant Formula. 2023. Available online: https://www.fda.gov/media/99701/download (accessed on 15 June 2024).
  23. Mokrzycki, W.S.; Tatol, M. Colour diference ΔE–A survey. Mach. Graph. Vis. 2012, 20, 383–414. [Google Scholar]
  24. Rusydi, A.F. Correlation between conductivity and total dissolved solid in various type of water: A review. IOP Conf. Ser. Earth Environ. Sci. 2018, 118, 012019. [Google Scholar] [CrossRef]
  25. Chen, H.; Tan, C.; Lin, Z.; Wu, T. Detection of melamine adulteration in milk by near-infrared spectroscopy and one-class partial least squares. Spectrochim. Acta Part A Mol. Biomol. Spectrosc. 2017, 173, 832–836. [Google Scholar] [CrossRef]
  26. Ahmed, M.W.; Esquerre, C.A.; Eilts, K.; Allen, D.P.; McCoy, S.M.; Varela, S.; Singh, V.; Leakey, A.D.B.; Kamruzzaman, M. Rapid and high-throughput determination of sorghum (Sorghum bicolor) biomass composition using near infrared spectroscopy and chemometrics. Biomass Bioeng. 2024, 186, 107276. [Google Scholar] [CrossRef]
  27. Rukundo, I.R.; Danao, M.-G.; Mitchell, R.B.; Weller, C.L. Evaluation of predictive performance of PLS regression models after being transferred from benchtop to handheld NIR spectrometers. Biosyst. Eng. 2022, 218, 245–255. [Google Scholar] [CrossRef]
  28. Nie, Z.; Tremblay, G.F.; Bélanger, G.; Berthiaume, R.; Castonguay, Y.; Bertrand, A.; Michaud, R.; Allard, G.; Han, J. Near-infrared reflectance spectroscopy prediction of neutral detergent-soluble carbohydrates in timothy and alfalfa. J. Dairy. Sci. 2009, 92, 1702–1711. [Google Scholar] [CrossRef]
  29. Duta, K.; Nath, R.; Samanta, A.K. Advances in Colorimetry; IntechOpen: Rijeka, Croatia, 2024. [Google Scholar] [CrossRef]
  30. Qasim, W.; Mane, A.V. Characterization and treatment of selected food industrial effluents by coagulation and adsorption techniques. Water Resour. Ind. 2013, 4, 1–12. [Google Scholar] [CrossRef]
  31. Kim, S.Y.; Yi, D.Y. Components of human breast milk: From macronutrient to microbiome and microRNA. Clin. Exp. Pediatr. 2020, 63, 301–309. [Google Scholar] [CrossRef]
  32. Ballard, O.; Morrow, A.L. Human milk composition: Nutrients and bioactive factors. Pediatr. Clin. N. Am. 2013, 60, 49–74. [Google Scholar] [CrossRef]
  33. Wang, W.; Li, Y.; Cai, L.; Fang, L. Characteristics on the oxidation stability of infant formula powder with different ingredients during storage. Food Sci. Nutr. 2020, 8, 6392–6400. [Google Scholar] [CrossRef] [PubMed]
  34. Liu, Y.; Zhou, S.; Han, W.; Li, C.; Liu, W.; Qiu, Z.; Chen, H. Detection of Adulteration in Infant Formula Based on Ensemble Convolutional Neural Network and Near-Infrared Spectroscopy. Foods 2021, 10, 785. [Google Scholar] [CrossRef] [PubMed]
  35. Grassi, S.; Casiraghi, E. Advances in NIR Spectroscopy analytical technology in food industries. Foods 2022, 11, 1250. [Google Scholar] [CrossRef]
  36. Hanousek Čiča, K.; Rupert, M.; Koczon, P.; Derewiaka, D.; Gajdoš Kljusurić, J.; Petravić Tominac, V.; Mrvčić, J.; Stanzer, D. Characterisation of flavour compounds in Biska—A herbal spirit produced with mistletoe. J. Inst. Brew. 2019, 125, 143–154. [Google Scholar] [CrossRef]
  37. Bursać Kovačević, D.; Gajdoš Kljusurić, J.; Putnik, P.; Vukušić, T.; Herceg, Z.; Dragović-Uzelac, V. Stability of polyphenols in chokeberry juice treated with gas phase plasma. Food Chem. 2016, 212, 323–331. [Google Scholar] [CrossRef]
  38. Sun, D.; Cruz, J.; Alcalá, M.; Romero del Castillo, R.; Sans, S.; Casals, J. Near infrared spectroscopy determination of chemical and sensory properties in tomato. J. Near Infrared Spectrosc. 2021, 29, 289–300. [Google Scholar] [CrossRef]
  39. Zhao, X.; Wang, Y.; Liu, X.; Jiang, H.; Zhao, Z.; Niu, X.; Li, C.; Pang, B.; Li, Y. Single- and Multiple-Adulterants Determinations of Goat Milk Powder by NIR Spectroscopy Combined with Chemometric Algorithms. Agriculture 2022, 12, 434. [Google Scholar] [CrossRef]
  40. Mishra, P.; Rutledge, D.N.; Roger, J.M.; Wali, K.; Khan, H.A. Chemometric pre-processing can negatively affect the performance of near-infrared spectroscopy models for fruit quality prediction. Talanta 2021, 229, 122303. [Google Scholar] [CrossRef] [PubMed]
  41. Green, S.; Fanning, E.; Sim, J.; Eyres, G.T.; Frew, R.; Kebede, B. The Potential of NIR Spectroscopy and Chemometrics to Discriminate Roast Degrees and Predict Volatiles in Coffee. Molecules 2024, 29, 318. [Google Scholar] [CrossRef] [PubMed]
  42. Miao, X.; Miao, Y.; Gong, H.; Tao, S.; Chen, Z.; Wang, J.; Chen, Y.; Chen, Y. NIR spectroscopy coupled with chemometric algorithms for the prediction of cadmium content in rice samples. Spectrochim. Acta. Part. A Mol. Biomol. Spectrosc. 2021, 257, 119700. [Google Scholar] [CrossRef]
  43. Heil, K.; Schmidhalter, U. An Evaluation of Different NIR-Spectral Pre-Treatments to Derive the Soil Parameters C and N of a Humus-Clay-Rich Soil. Sensors 2021, 21, 1423. [Google Scholar] [CrossRef] [PubMed]
Figure 1. Comparison of (A) macronutrient share and (B) fatty acids in regular infant formulas (IF) and formulas for specific purposes (IF*). SFA presents saturated fatty acids, MUFA presents monounsaturated fatty acids, and PUFA represents polyunsaturated fatty acids. The same letters for the same color present no significant difference and the p-value presents the significance at α = 5%. (* represents the significant difference between samples).
Processes 12 01771 g001
Figure 2. Color differences in investigated infant formulas vs. powder milk solution. Same letter indicates no significant differences (p > 0.05).
Processes 12 01771 g002
Figure 3. Average NIR spectra for investigated infant formulas (IFs) and the whole milk powder (MP) solution.
Processes 12 01771 g003
Figure 4. Biplot of the PCA analysis for the energy-nutritive composition of investigated infant formulas (IF-regular formulas, IF*-formulas for specific needs).
Processes 12 01771 g004
Table 1. Number of infant formula samples prepared with volume range per serving.
SchemeNumber of Prepared SamplesVolume Range per Serving
(mL)
IF1660–210
IF2590–210
IF3490–210
IF4490–180
IF5490–180
IF6660–210
IF7*660–210
IF8*660–210
IF9*330–150
IF10*490–240
IF11*490–180
MP3170
* infant formulas (IF) for specific needs intended for infants with an allergy to cow’s milk proteins or with a sensitive digestive system; MP, whole milk powder dissolved in water (10 g in 200 mL of boiled water).
Table 2. Relative standard deviation (RSD) calculated for the benchtop and Micro NIR device per key wavelengths.
Precision ParametersNIR Spectra Wavelengths (nm)
≈1150≈1450≈1680
Repeatability
Benchtop device2.1 × 10−25.5 × 10−36.9 × 10−3
Micro device2.7 × 10−27.9 × 10−31.5 × 10−2
Reproducibility
Benchtop device6.0 × 10−39.3 × 10−44.8 × 10−3
Micro device8.7 × 10−36.5 × 10−32.1 × 10−2
Table 3. Parameters indicating model efficiency in detecting color attributes, conductivity, total dissolved solids, macronutrients, and fatty acid proportions in investigated infant formulas, for two NIR devices.
Observed
Parameters
Benchtop NIRMicro NIR
R2cR2PSEPRMSEPRPDRERR2cR2PSEPRMSEPRPDRER
Color parameters
L*0.8990.5372.0784.3161.6546.1180.9770.6991.3423.2162.1337.891
a*0.7980.3670.0390.1971.1514.2580.9880.5380.0410.2031.6576.129
b*0.8890.4560.3530.5941.4145.2320.9730.7320.9280.9632.2308.252
Physical parameters
TDS0.9990.8160.110.1062.4799.1710.9950.7410.0210.1442.2578.350
Conductivity0.9980.8140.0450.2132.4739.1490.9950.7550.0880.2962.2988.504
Chemical composition
Proteins0.8990.6370.6420.8021.9497.2130.9930.6721.3211.1492.0537.596
Carbohydrates0.9100.7003.1125.2142.1367.9020.9850.5883.7083.6761.8046.676
Fats0.9220.6231.8831.6971.9087.0590.9900.5440.3570.5981.6746.195
PUFA0.9930.6730.1450.3817.6067.6060.9890.6160.1190.3451.8876.983
DHA0.9940.7283.7135.8068.2088.2080.9930.6704.5915.3472.0477.574
Disclaimer/Publisher’s Note: The statements, opinions and data contained in all publications are solely those of the individual author(s) and contributor(s) and not of MDPI and/or the editor(s). MDPI and/or the editor(s) disclaim responsibility for any injury to people or property resulting from any ideas, methods, instructions or products referred to in the content.

