Article

Reconstruction of the Municipal Wastewater-Treatment Plant According to the Principles of Aerobic Granular Sludge Cultivation

by
Miroslav Hutňan
1,*,
Barbora Jankovičová
1,
Lenka Jajcaiová
1,
Mikhael Sammarah
1,
Karol Kratochvíl
2 and
Nikola Šoltýsová
1
1
Faculty of Chemical and Food Technology, Slovak University of Technology, 812 37 Bratislava, Slovakia
2
ASIO-SK s.r.o., Ul. 1. Mája 1201, 014 01 Bytča, Slovakia
*
Author to whom correspondence should be addressed.
Processes 2024, 12(9), 1782; https://doi.org/10.3390/pr12091782
Submission received: 24 July 2024 / Revised: 14 August 2024 / Accepted: 21 August 2024 / Published: 23 August 2024
(This article belongs to the Special Issue Municipal Wastewater Treatment and Removal of Micropollutants)

Abstract

:
The work presents the concept of aerobic granular sludge (AGS) and its potential for wastewater treatment. The work also evaluates the condition of the SBR (Sequencing Batch Reactor) type of municipal wastewater-treatment plant (WWTP) after its reconstruction into a system with AGS. The WWTP parameters achieved before and after reconstruction were compared. Operational measurements of the process during the individual phases of the treatment process showed a balanced concentration profile of the monitored parameters in the span of the semicontinuous cycle. Laboratory tests showed that the sludge from the WWTP has nitrification and denitrification rates comparable to the rates achieved for flocculent sludge, and it is also comparable to the nitrification and denitrification rates of AGS with size of granules below 400 µm. Despite the fact that complete sludge granulation was not achieved, the results measured at the WWTP confirmed the advantages of the AGS concept. Neither anaerobic nor anoxic conditions were identified in the SBR during the individual phases of operation, yet high removal efficiencies of ammonia and nitrate nitrogen and orthophosphate phosphorus were achieved. The concentration of ammonia and nitrate nitrogen at the WWTP effluent was below 5 mg/L, and the concentration of phosphorus was below 0.5 mg/L.

1. Introduction

Aerobic sludge granulation is a relatively new technology developed for the biological treatment of wastewater. In the last two decades, it has become the subject of extensive research due to its multiple advantages over the activated sludge system. The aerobic granular sludge (AGS) process has evolved into an advanced technological solution for large wastewater-treatment plants (WWTPs) that treat both municipal and industrial wastewater. The use of AGS allows for the construction of more compact treatment plants with lower operational costs compared to conventional systems such as activated sludge (AS). Granular sludge consists of bacterial aggregates that are much more compact than traditional activated sludge and achieve significantly higher settling velocities [1]. Sludge volume indexes for granular biomass, determined after 5 min of sedimentation, are comparable to those for activated sludge, determined after 30 min of sedimentation [2]. Therefore, the separation of treated water is achieved much faster and without the need for external settling tanks. Compared to AS, AGS allows for the reduction of the necessary surface area of treatment tanks and decreases operational energy requirements.
The granules can contain several microbial layers. Different layers are composed of distinct bacterial species responsible for various ongoing processes such as nitrification, denitrification, or phosphorus removal [3]. The presence of an aerobic outer layer and an anaerobic or anoxic core facilitates the coexistence of nitrifying organisms in the outer layers of the granules and denitrifying organisms in the center, along with poly-P bacteria capable of accumulating polyphosphates, as well as (facultative) anaerobic organisms towards the center of the granule. Due to this structure, AGS can simultaneously remove phosphorus, nitrogen, and organic pollution [4]. Table 1 compares selected properties of aerobic granular sludge and activated sludge.
In systems with granular sludge, vertical segregation of biomass can easily occur due to slight changes in the density and diameter of the particles. The microbial population at the bottom of the reactor may differ from the population present at the top, as the biomass at different levels of the sludge bed is exposed to varying conditions [9]. Various biological conversions occur in different layers or zones within the aerobic granules in a single reactor tank. The operation of the reactor with alternating aerobic and anaerobic periods in a sequential batch mode causes segregation of microorganisms in the granules due to the dissolved oxygen gradient throughout the depth [8].
Individual findings from studies focused on the aerobic biomass-granulation process are summarized in reference [10]. They indicate that the formation of microbial aggregates is a multi-step process with significant influence from hydrodynamic shear forces, and it can be divided into the following four steps:
Step 1: Physical movement leading to contact between bacteria. The forces acting in this step are hydrodynamic, diffusive, gravitational, and thermodynamic, such as Brownian motion and the mobility of microorganisms.
Step 2: Initiation of attractive forces to maintain multicellular contact between microorganisms. Van der Waals forces, attraction due to opposite charges, and thermodynamic forces are involved in this step. Filamentous microorganisms can significantly contribute to the formation of three-dimensional structures. In addition to these forces, chemical and biochemical processes also play an important role.
Step 3: Microbial forces cause the maturation of aggregated bacterial structures. This primarily involves the formation of extracellular polymers, such as exopolysaccharides. Metabolic changes and genetic competencies facilitate and further strengthen interactions between cells, resulting in a high density of connected cells.
Step 4: Three-dimensional structures of microbial aggregates are stabilized by hydrodynamic shear forces. The resulting shape and size are determined by the force and manner of interaction between aggregates and hydrodynamic forces, microbial species, and substrate loading [10].
These facts were also confirmed in several later works, such as study [11].
Currently, several full-scale operational facilities are already in place abroad [4,12,13]. The implementation of this technology is relatively straightforward and has several advantages over conventional technologies (Table 1). The high biomass retention capacity of these systems and the possibility of cultivating granular biomass with stratified bacterial populations allow simultaneous processes for wastewater treatment to occur in one tank.
In works dealing with the granulation process and operation of full-scale WWTP, input–output relationships, AGS growth and microorganisms found in AGS are mostly studied. Very few works deal with measuring the concentration profile of individual pollution components during a semi-continuous cycle and the nitrifying and denitrifying activity of AGS.
This work focuses on assessing the operation of the wastewater-treatment plant with capacity 3000 PE. This WWTP, originally designed as a Sequencing Batch Reactor (SBR) system with suspended activated sludge, with time segregated nitrification and denitrification was reconstructed to a WWTP with the concept of aerobic granular biomass, because it did not reach the required quality of treated water. The aim of this work was to conduct and evaluate operational measurements to confirm the suitability of the WWTP reconstruction, the progress of nitrification, denitrification, and enhanced biological phosphorus removal. Additionally, the nitrification and denitrification activity of aerobic granular biomass was assessed.

2. Materials and Methods

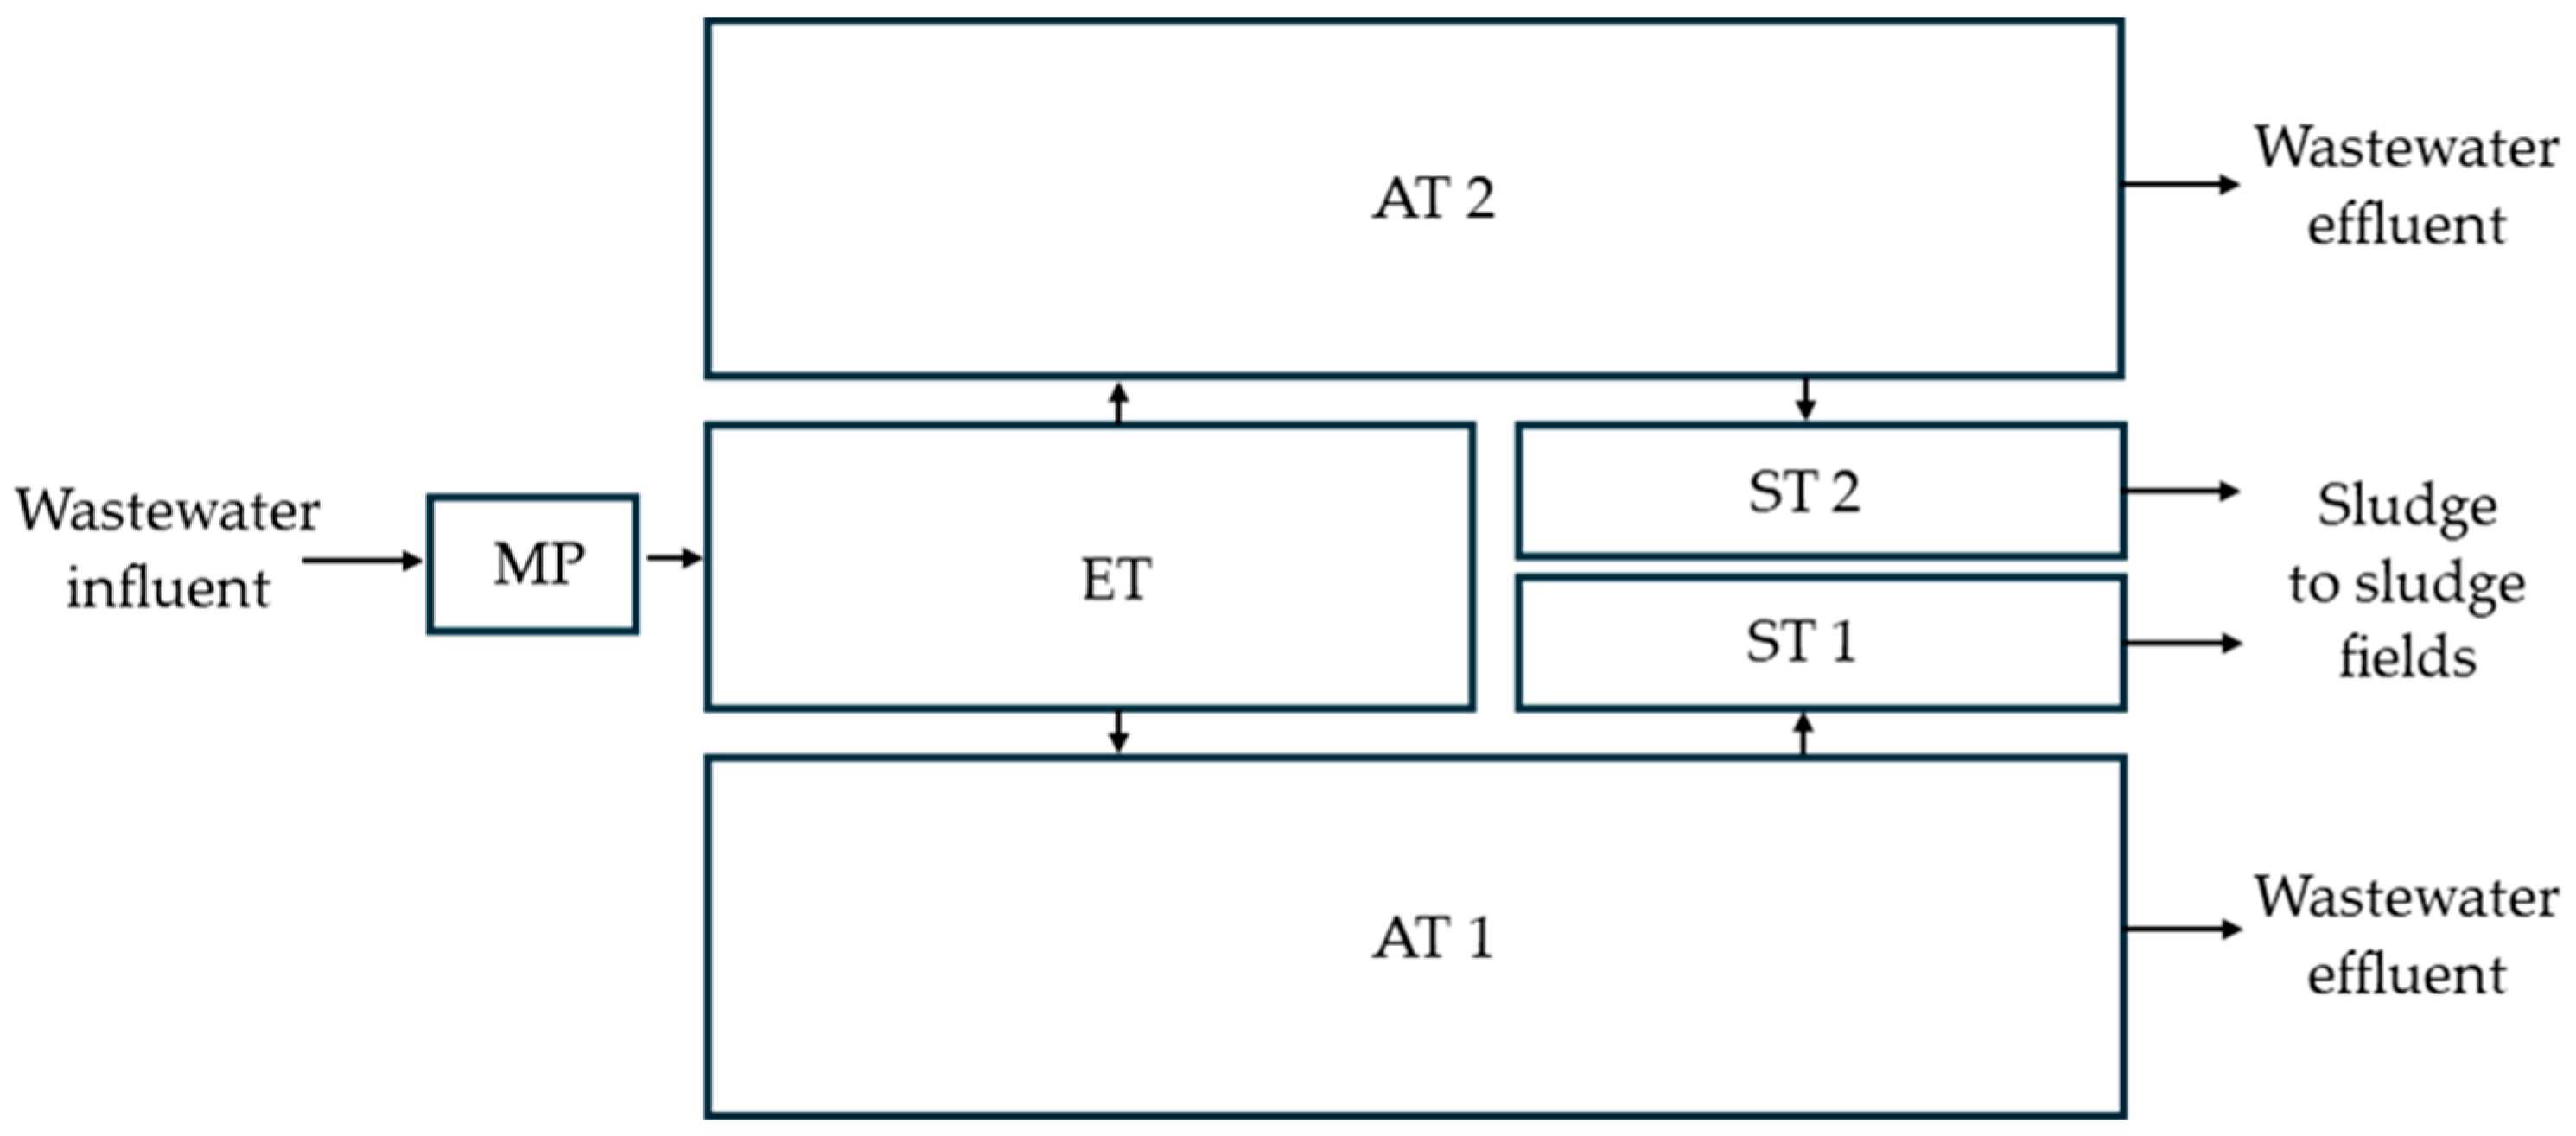
2.1. Technology of the Reconstructed WWTP
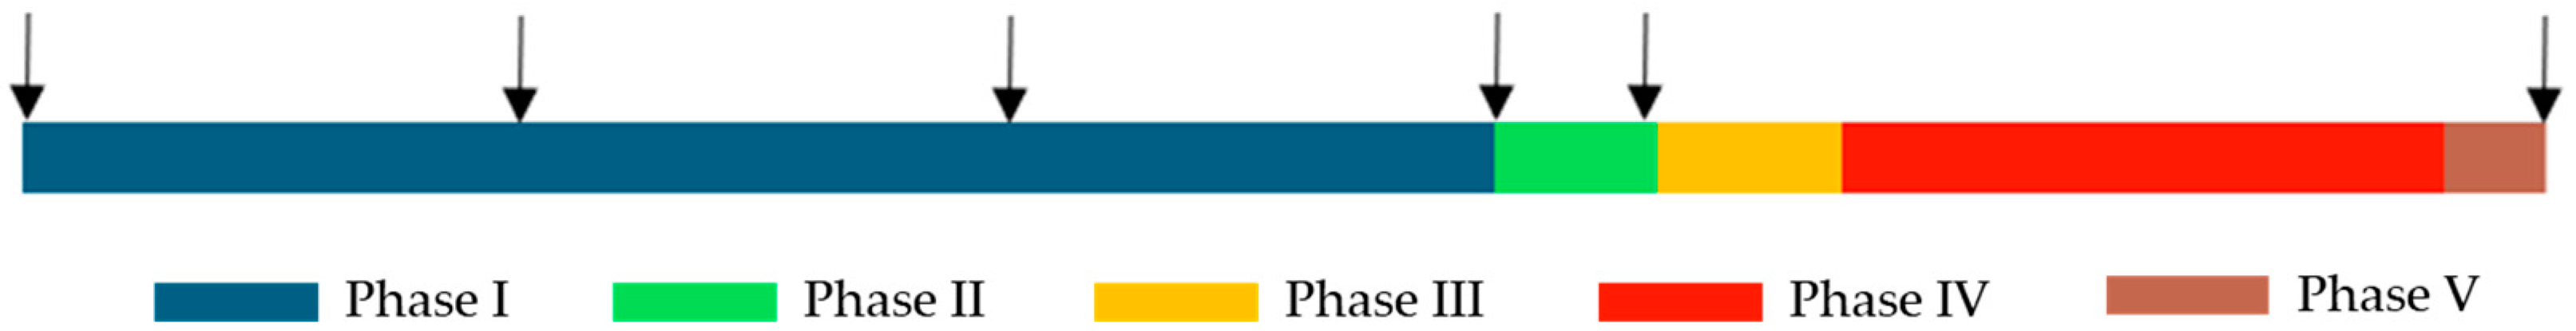
The reconstructed WWTP is a municipal wastewater-treatment plant for 3000 PE (population equivalent) with average wastewater flowrate 300 m3/d. The scheme of reconstructed WWTP is shown in Figure 1. The wastewater-treatment plant is a mechanical-biological WWTP that removes organic pollution and nutrients N and P from the wastewater. Nitrogen is removed through nitrification and simultaneous denitrification. Phosphorus is removed through the process of enhanced biological removal.
The core of the technological line is the biological stage, consisting of two activation tanks (AT1 and AT2), AS-GranBio reactors (2 × 215 m3), which are operated automatically by a control system. In the activation tank, the process of aerobic biological treatment and cultivation of aerobic granular biomass takes place. Oxygen is supplied to the tank in the form of compressed air using a volumetric rotary blower. Each activation tank has a separate blower with air delivery through a fine-bubble aeration system at a volume of 234 m3/h. Wastewater flows into the WWTP through a divided sewer system and undergoes mechanical pre-treatment (MT) on fine screens and in a grit chamber and equalization tank (ET) with a volume of 100 m3 before entering the biological stage. The treated water is discharged into the recipient after the sedimentation phase, while excess sludge is sent to sludge storage tanks (ST1 and ST2 2 × 35 m3) and subsequently dewatered on sludge fields.
The cycle of the original SBR technology consisted of the classic phases—aeration, denitrification, settling, sludge removal, and wastewater filling.
After the reconstruction, the phases of the individual cycles of the AGS system were as follows:
  • Phase I—aeration;
  • Phase II—intermittent aeration (the period of aeration interruption and aeration alternates several times);
  • Phase III—sedimentation;
  • Phase IV—filling wastewater into the lower part of the sludge bed while simultaneously discharging purified water (upper overflow into the drain)—fill-and-draw running;
  • Phase V—sludge removal from the upper part of the sludge bed into the storage tanks.
The course of the individual phases of the semi-continuous cycle is shown in Figure 2. Arrows indicate the sampling points. The exact setting of the duration of each phase and the overall cycle depends on the WWTP technology, wastewater quality, and the minimization of output parameters. Sampling was conducted from the activation tank in accordance with the timing of the individual phases of the treatment process.
Samples in individual phases of semi-continuous cycle marked in Figure 2 were grab samples, meaning one-time samples, which were taken from the activation tank AT1. A sample of the incoming wastewater was taken from the equalization tank ET in the same way as the other samples. As mentioned above, these measurements were taken over a total in six days in the three weeks high spring period; three days at low load of WWTP and three at high load of WWTP. Samples taken from the WWTP during the start-up and trial operation were 24 h composite samples.
The semi-continuous cycle with these phases does not occur simultaneously in both activation tanks but is shifted in time to minimize the amounts of pollution discharged into the recipient.

2.2. Analyses

In the samples, parameters such as COD (chemical oxygen demand), N-NH4 (ammonium nitrogen), N-NO3 (nitrate nitrogen), P-PO4 (phosphate phosphorus), and pH were analyzed. Analyses at the outlet of the WWTP during start-up and trial operation were made in unfiltered samples. Analyses of samples taken during the semi-continuous cycle were made on filtered samples. In selected samples, the dry matter of the sludge—suspended solids (SSs) and its loss on ignition—volatile suspended solids (VSSs) were also determined. The analyses were carried out using methodologies according to [14]. Spectrophotometric methods were used to determine the concentrations of COD, N-NH4, N-NO3 and P-PO4. For COD, it was a modified semi-micro method with K2Cr2O7 and a silver catalyst. After heating for two hours at 150 °C in a closed cuvette and cooling, the absorbance was measured at a wavelength of 600 nm. The method with Nessler’s reagent and Seignet’s salt was used for the determination of N-NH4. Absorbance was measured at a wavelength of 425 nm. N-NO3 was determined using salicylic acid followed by absorbance measurement at a wavelength of 415 nm. The P-PO4 concentration was measured using a mixed reagent composed of sulfuric acid, ammonium heptamolybdate, ascorbic acid and antimony potassium tartrate. Absorbance was measured at 690 nm. A DR3900 VIS spectrophotometer (Hach Lange, GmbH, Germany) was used to measure absorbance. The concentration of SS was measured after filtering the aggregated sludge on a membrane filter with 0.4 μm pores and after drying to constant weight at 105 °C (laboratory oven UN55, Memmert, GmbH, Schwabach, Germany) and VSS as loss on ignition at 550 °C (laboratory muffle oven LMH, LAC, s.r.o., Židlochovice, Czech Republic). The pH values were measured on a Hach HQ11D pH meter (Hach Lange, GmbH, Düsseldorf, Germany). During both the aeration phase and the intermittent aeration phase, the oxygen concentration in the tank was also measured (Oxymeter WTW Oxi 3250, with DO sensor CellOX® 325, WTW, Weilheim, Germany).

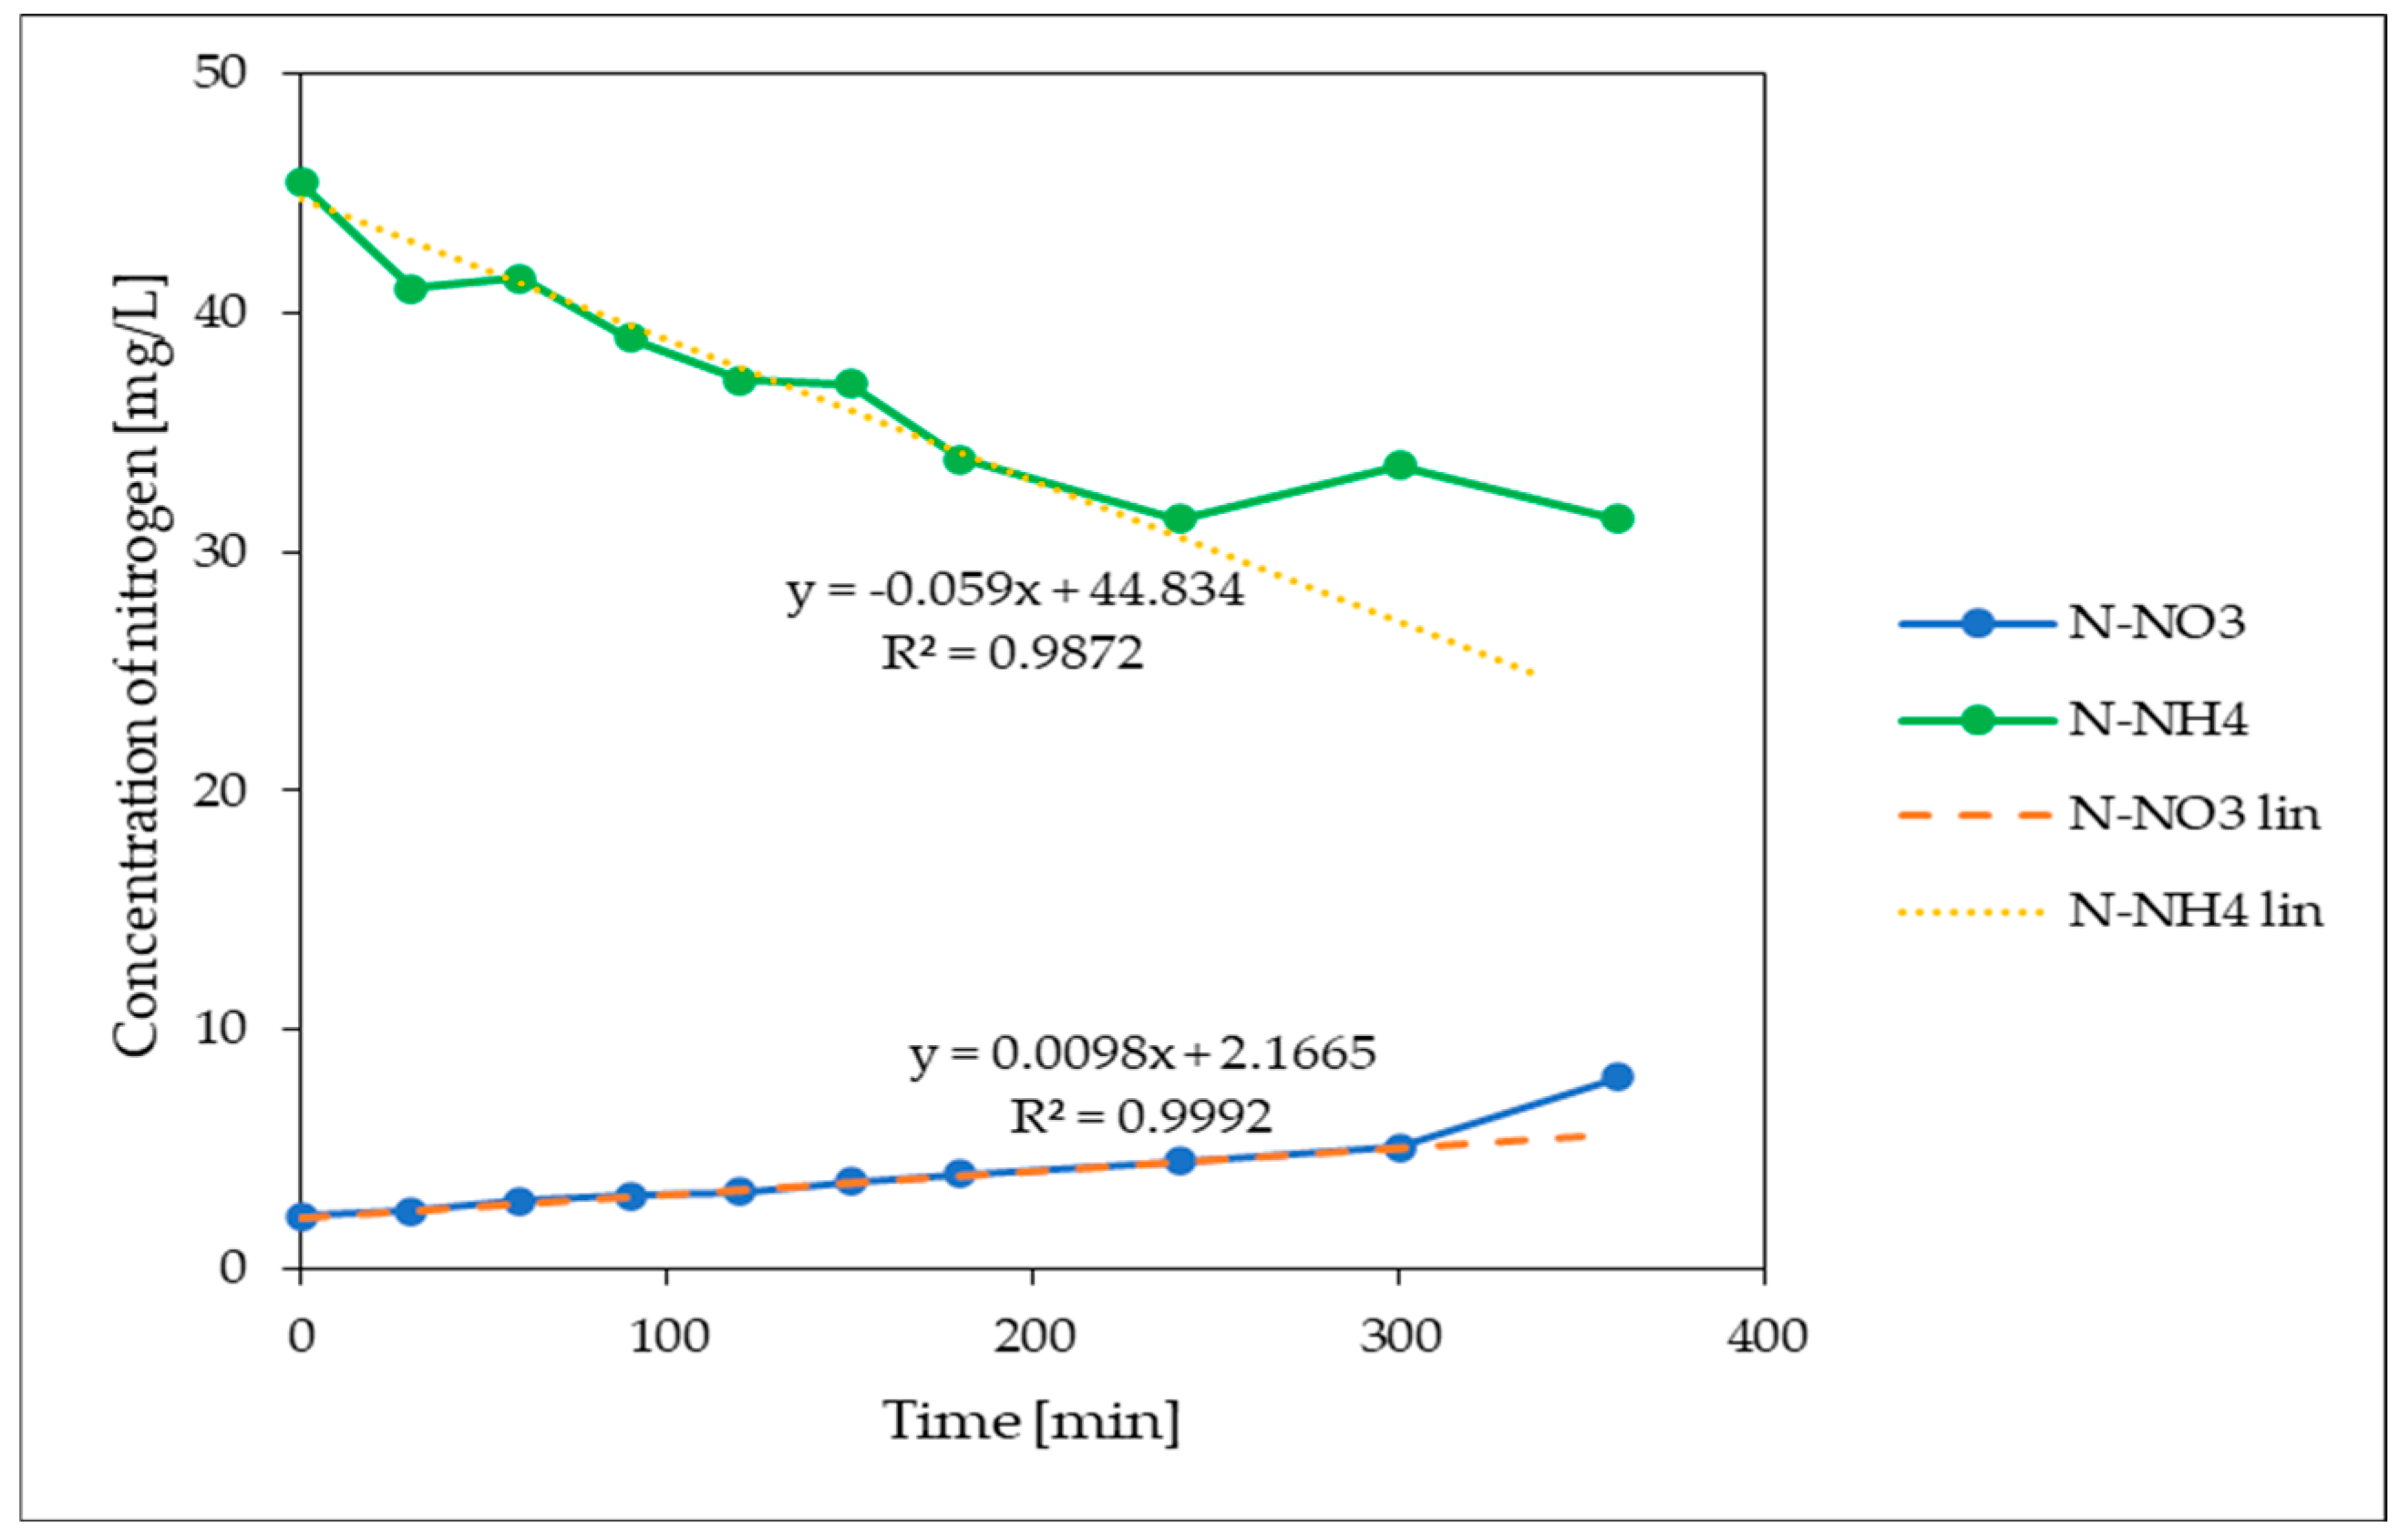
2.3. Tests for Nitrification and Denitrification Activity

Kinetic tests were conducted under laboratory conditions with sludge taken from the monitored activation tank to determine its nitrification and denitrification activity.
One of the parameters characterizing nitrification is the specific nitrification rate (vN) measured in mg/(g·h). It is typically measured using a kinetic batch test and represents the change in nitrogen concentration oxidized by a unit mass of biomass per unit time. The change in nitrogen concentration (ΔcN) is evaluated as a decrease in N-NH4 concentration or an increase in N-NO3 concentration. The specific nitrification rate is determined using the following equation:
v N = Δ c N Δ t × X b
where Δt is the time during which the decrease in N-NH4 or increase in N-NO3 is linear (h), and Xb is the biomass/sludge dry matter concentration (g/L).
Denitrification activity is most characterized by the specific denitrification rate (vD) (mg/(g·h). This is the amount of N-NO3 reduced per unit mass of biomass dry matter per time unit. It is measured using a kinetic batch test, during which the decrease in N-NO3 concentration (ΔcN) is measured. In kinetic tests, both endogenous and exogenous denitrification, or nitrate respiration, occur. Endogenous denitrification takes place without the presence of external organic carbon, with bacteria utilizing their internal (endogenous) sources. In exogenous denitrification, bacteria use an external organic substrate, which in our case was glucose. The specific denitrification rate is calculated using the same equation as for the nitrification rate, but vD is used instead of vN.
The initial concentration of N-NH4 was 45 mg/L, and for N-NO3 it was 43 mg/L. The initial COD concentration at the beginning of the denitrification tests was 500 mg/L.
The nitrification and denitrification activity tests were conducted in glass cylinders with a volume of 1 L. During the nitrification tests, the cylinders were aerated, and the dissolved oxygen concentration was maintained above 2 mg/L. During the denitrification tests, the cylinders were only mixed. Sampling of the sludge mixture during the tests was carried out at 30 min intervals for 3 h, followed by 60 min intervals until the test ended after 6 h. In the collected samples, the concentrations of N-NO3 or N-NH4 were determined. At the beginning of the test, the concentration of sludge dry matter (SS) was also determined.

3. Results and Discussion

3.1. Status of the WWTP before Reconstruction

Average values of selected wastewater parameters at the influent and effluent of the WWTP are shown in Table 2. The parameters that the wastewater should reach at the effluent of the WWTP are specified by the Regulation of the Government of the Slovak Republic no. 269/2010 for the size category up to 10,000 PE:
pm
COD≤120 mg/L150 mg/L
BOD5≤25 mg/L45 mg/L
SS≤25 mg/L50 mg/L
N-NH4≤20 mg/L40 mg/L
N-NH4≤30 mg/LZ140 mg/LZ1
where
p—limit value of the respective indicator in a composite sample over a certain period;
m—maximum limit value of the respective indicator in a qualified point sample;
Z1—values apply for the period during which the temperature of the wastewater at the outflow from the biological stage is lower than 12 °C. If the temperature is below 9 °C, this parameter is not observed.
Table 2. Average concentrations at the inflow and outflow of the WWTP before reconstruction (unfiltered samples).
YearBOD5 (mg/L)COD (mg/L)SS (mg/L)N-NH4 (mg/L)
Influent
20166641246643100
201766512461073157
2018629115288298
Average6531214866118
Effluent
2016432195290
201727460822994
2018572476977
Average12535811687
From Table 2, it is evident that the wastewater-treatment plant (WWTP) before reconstruction did not meet the limits for most parameters set by the Government Regulation of the Slovak Republic No. 269/2010 for the size category up to 10,000 PE. Table 2 shows that in 2017 the BOD5 and COD values at the WWTP inlet were similar to other years, only the SS and N-NH4 values were higher. Despite this, the values of BOD5 and COD at the outlet of the WWTP were significantly higher than in other years. These values document the emergency status of the WWTP. Therefore, in 2018, the reconstruction of the aeration system of the WWTP was carried out. The COD values decreased in the following year, but still did not meet the required parameters. This observation applies not only to the average values listed in Table 2 but also to most of the measurements conducted at the WWTP before the reconstruction. Organic Loading Rate (OLR) before reconstruction was 0.150 kg/(kg·d) BOD5, Sludge Volume Index (SVI) was in the range 100–200 mL/g and Solid Retention Time (SRT)—sludge age was about 15 d.

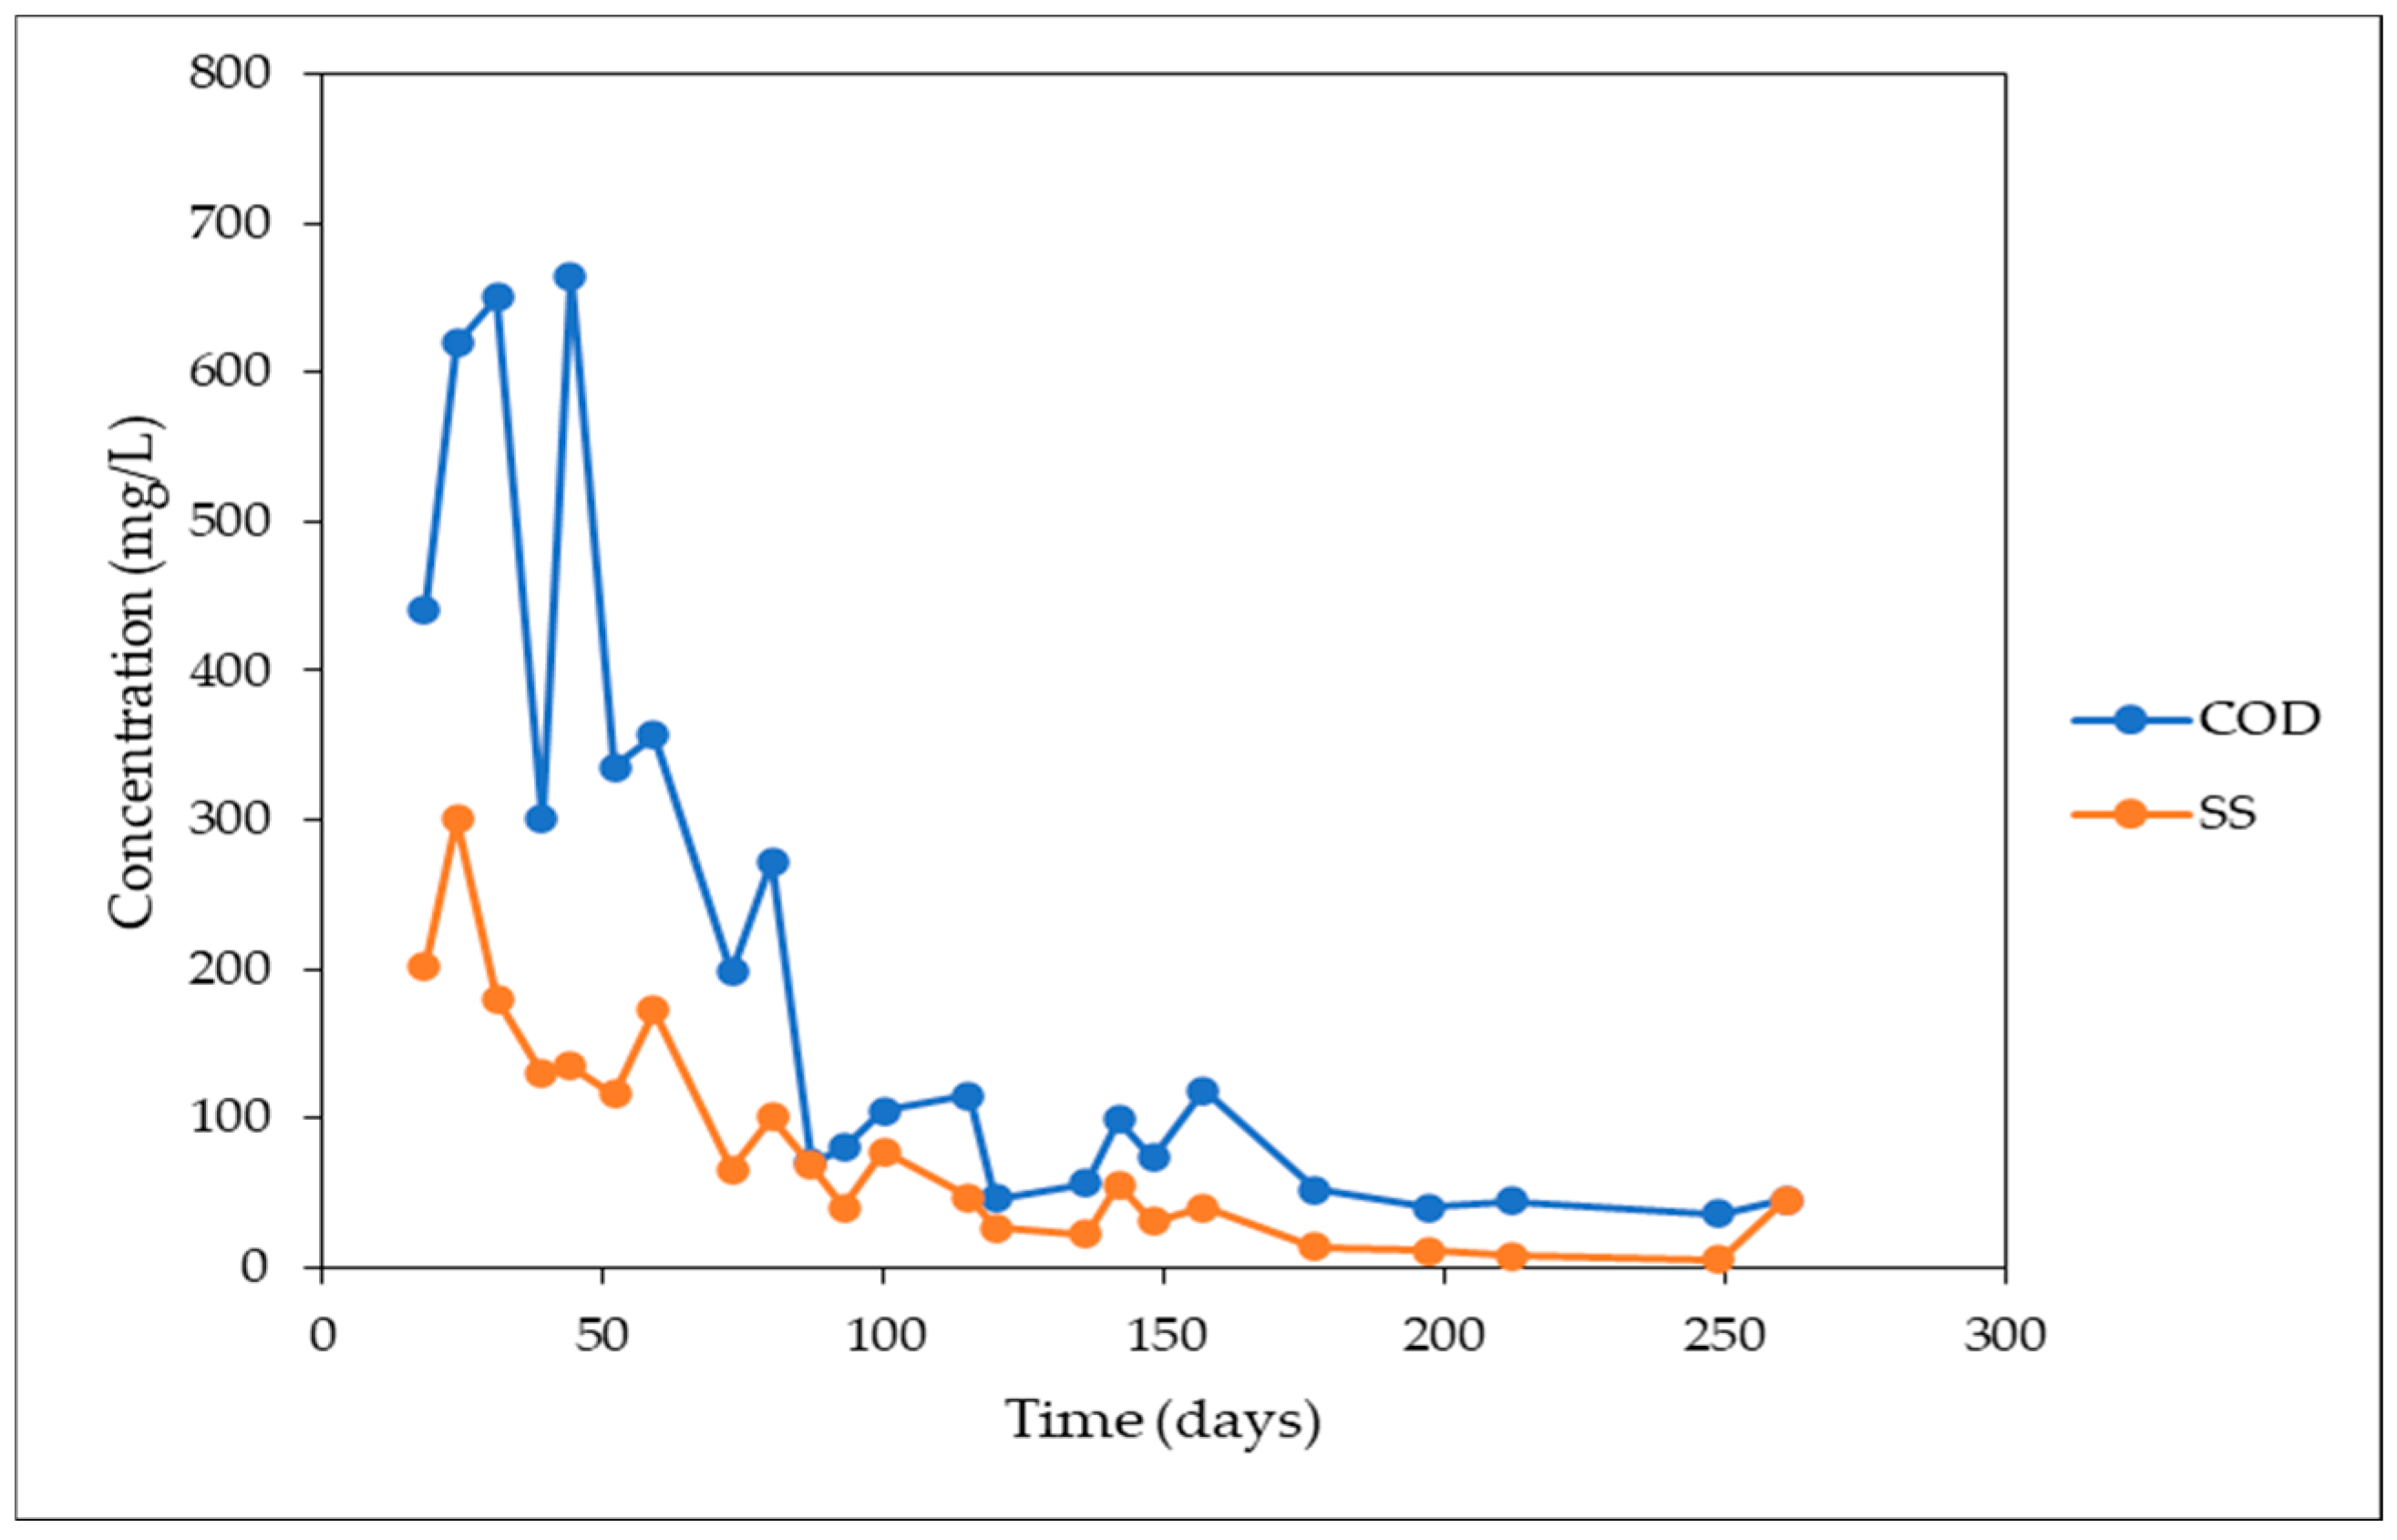
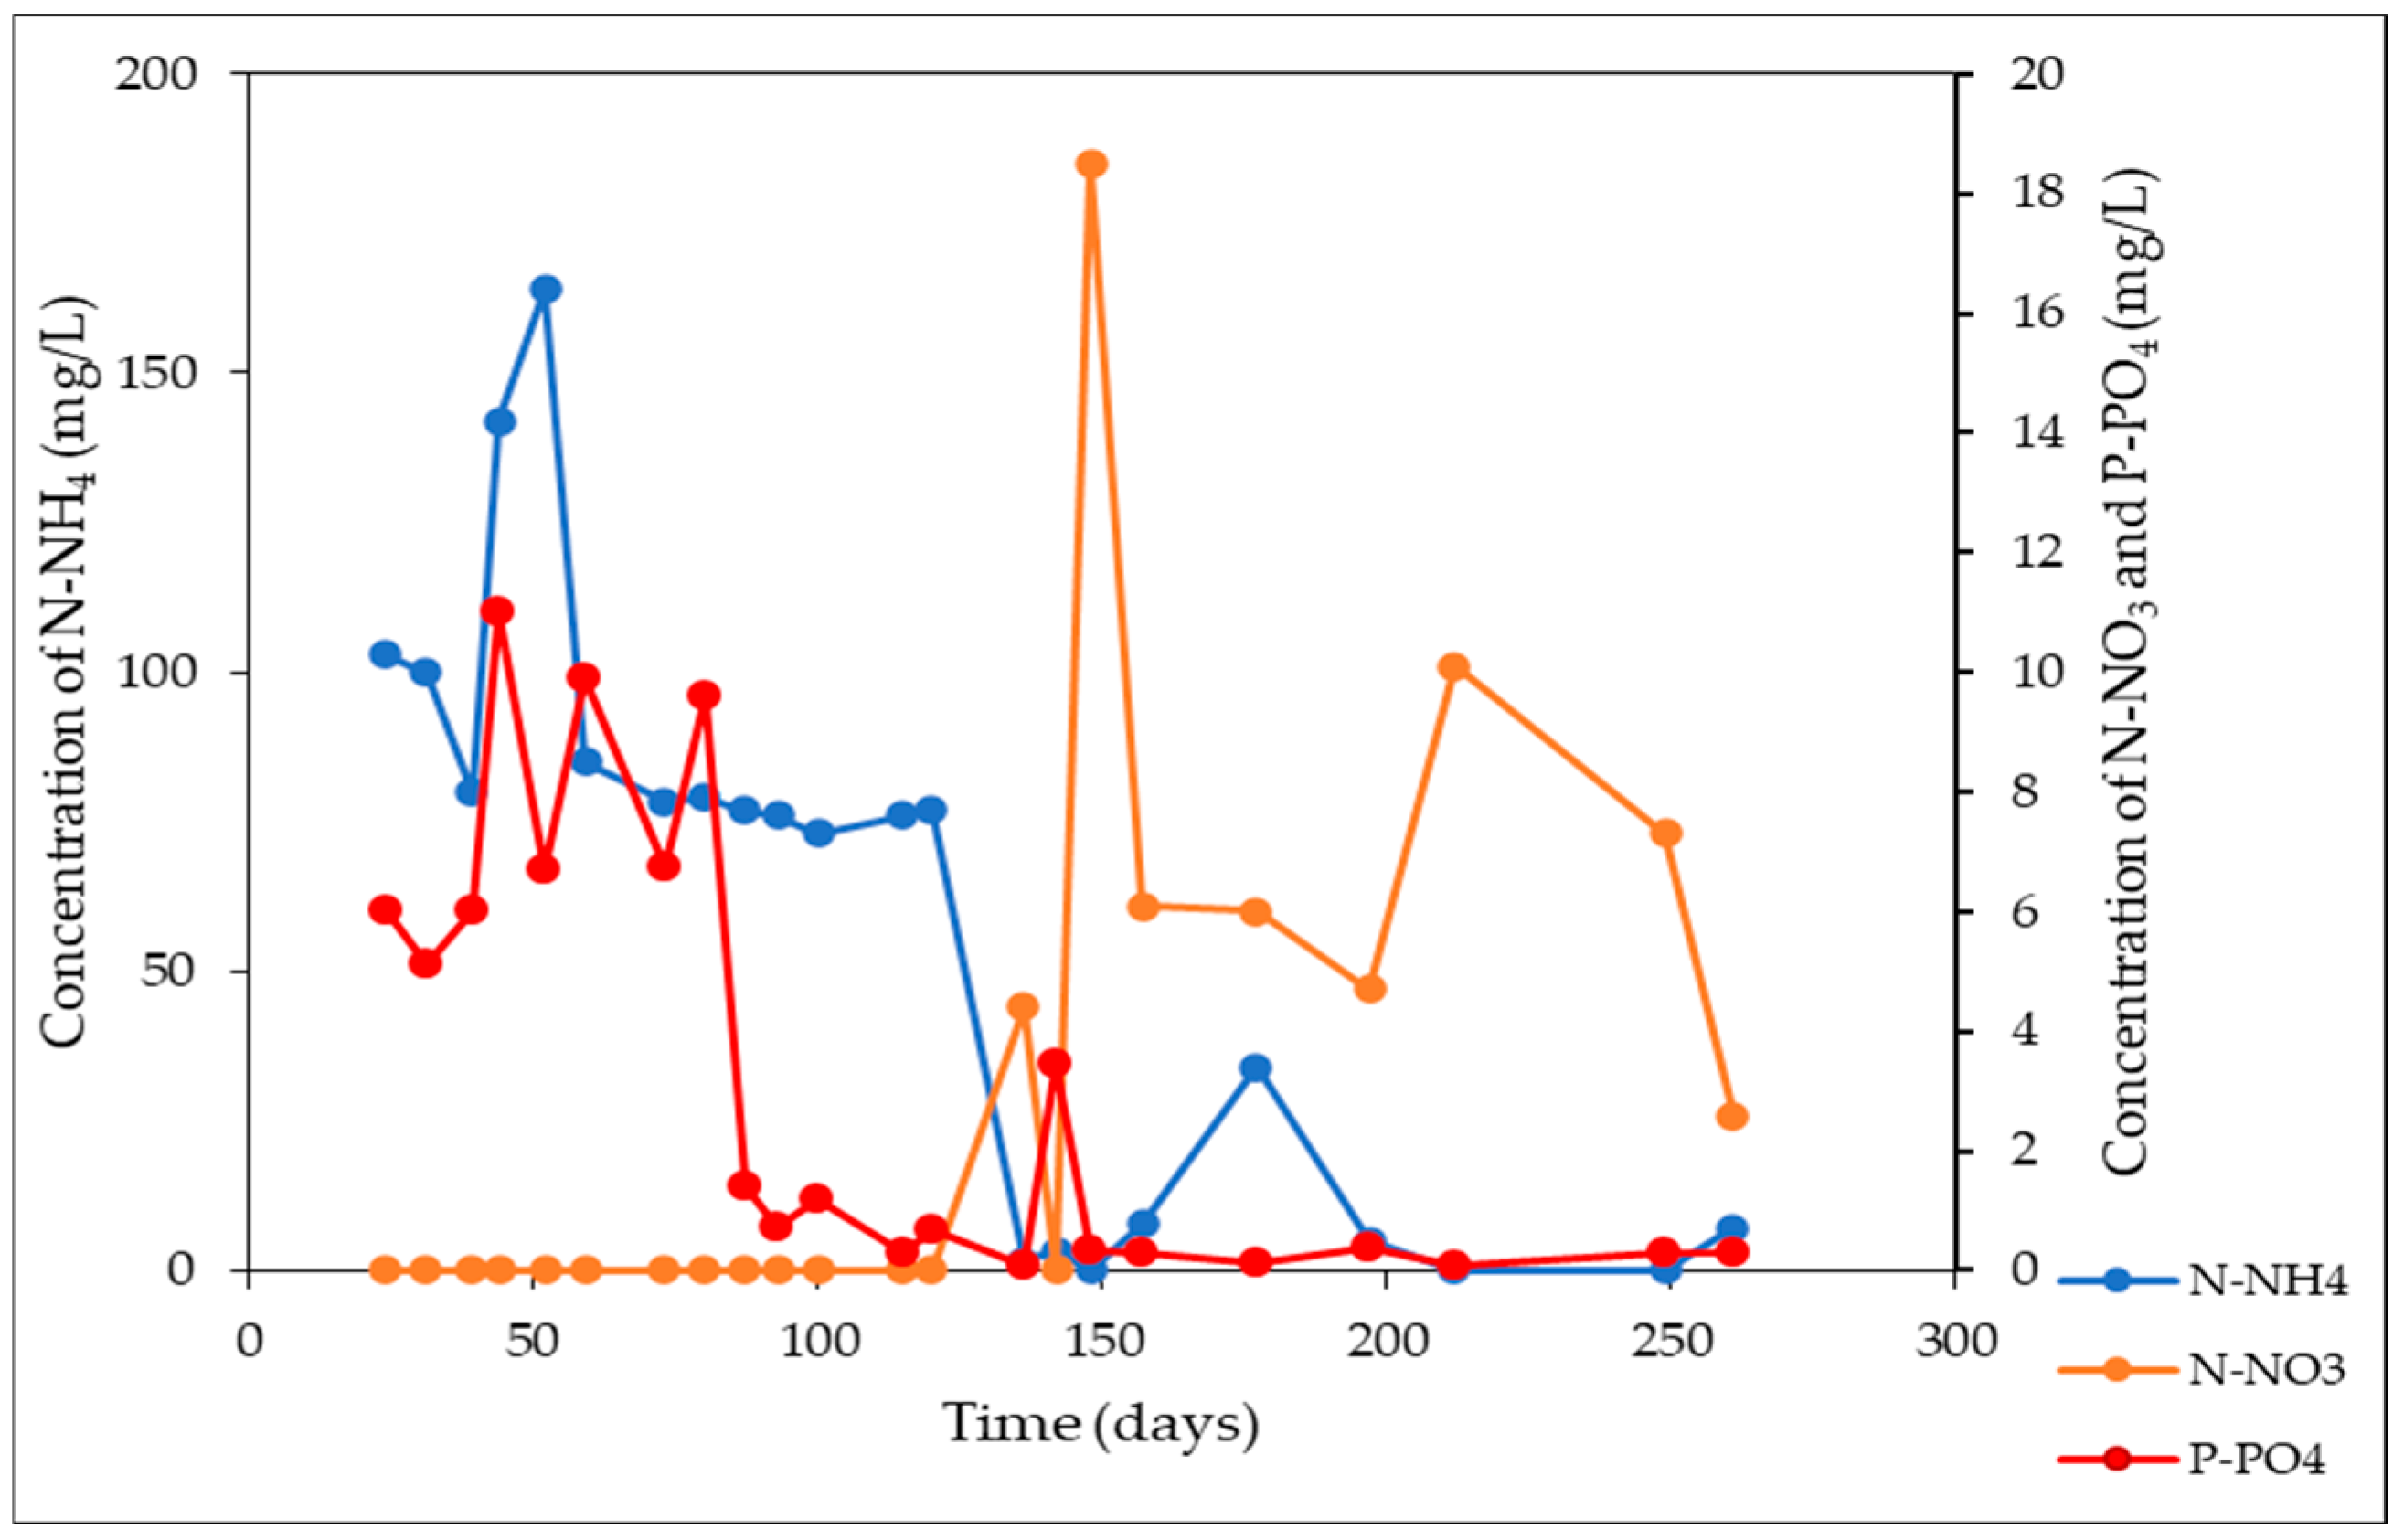
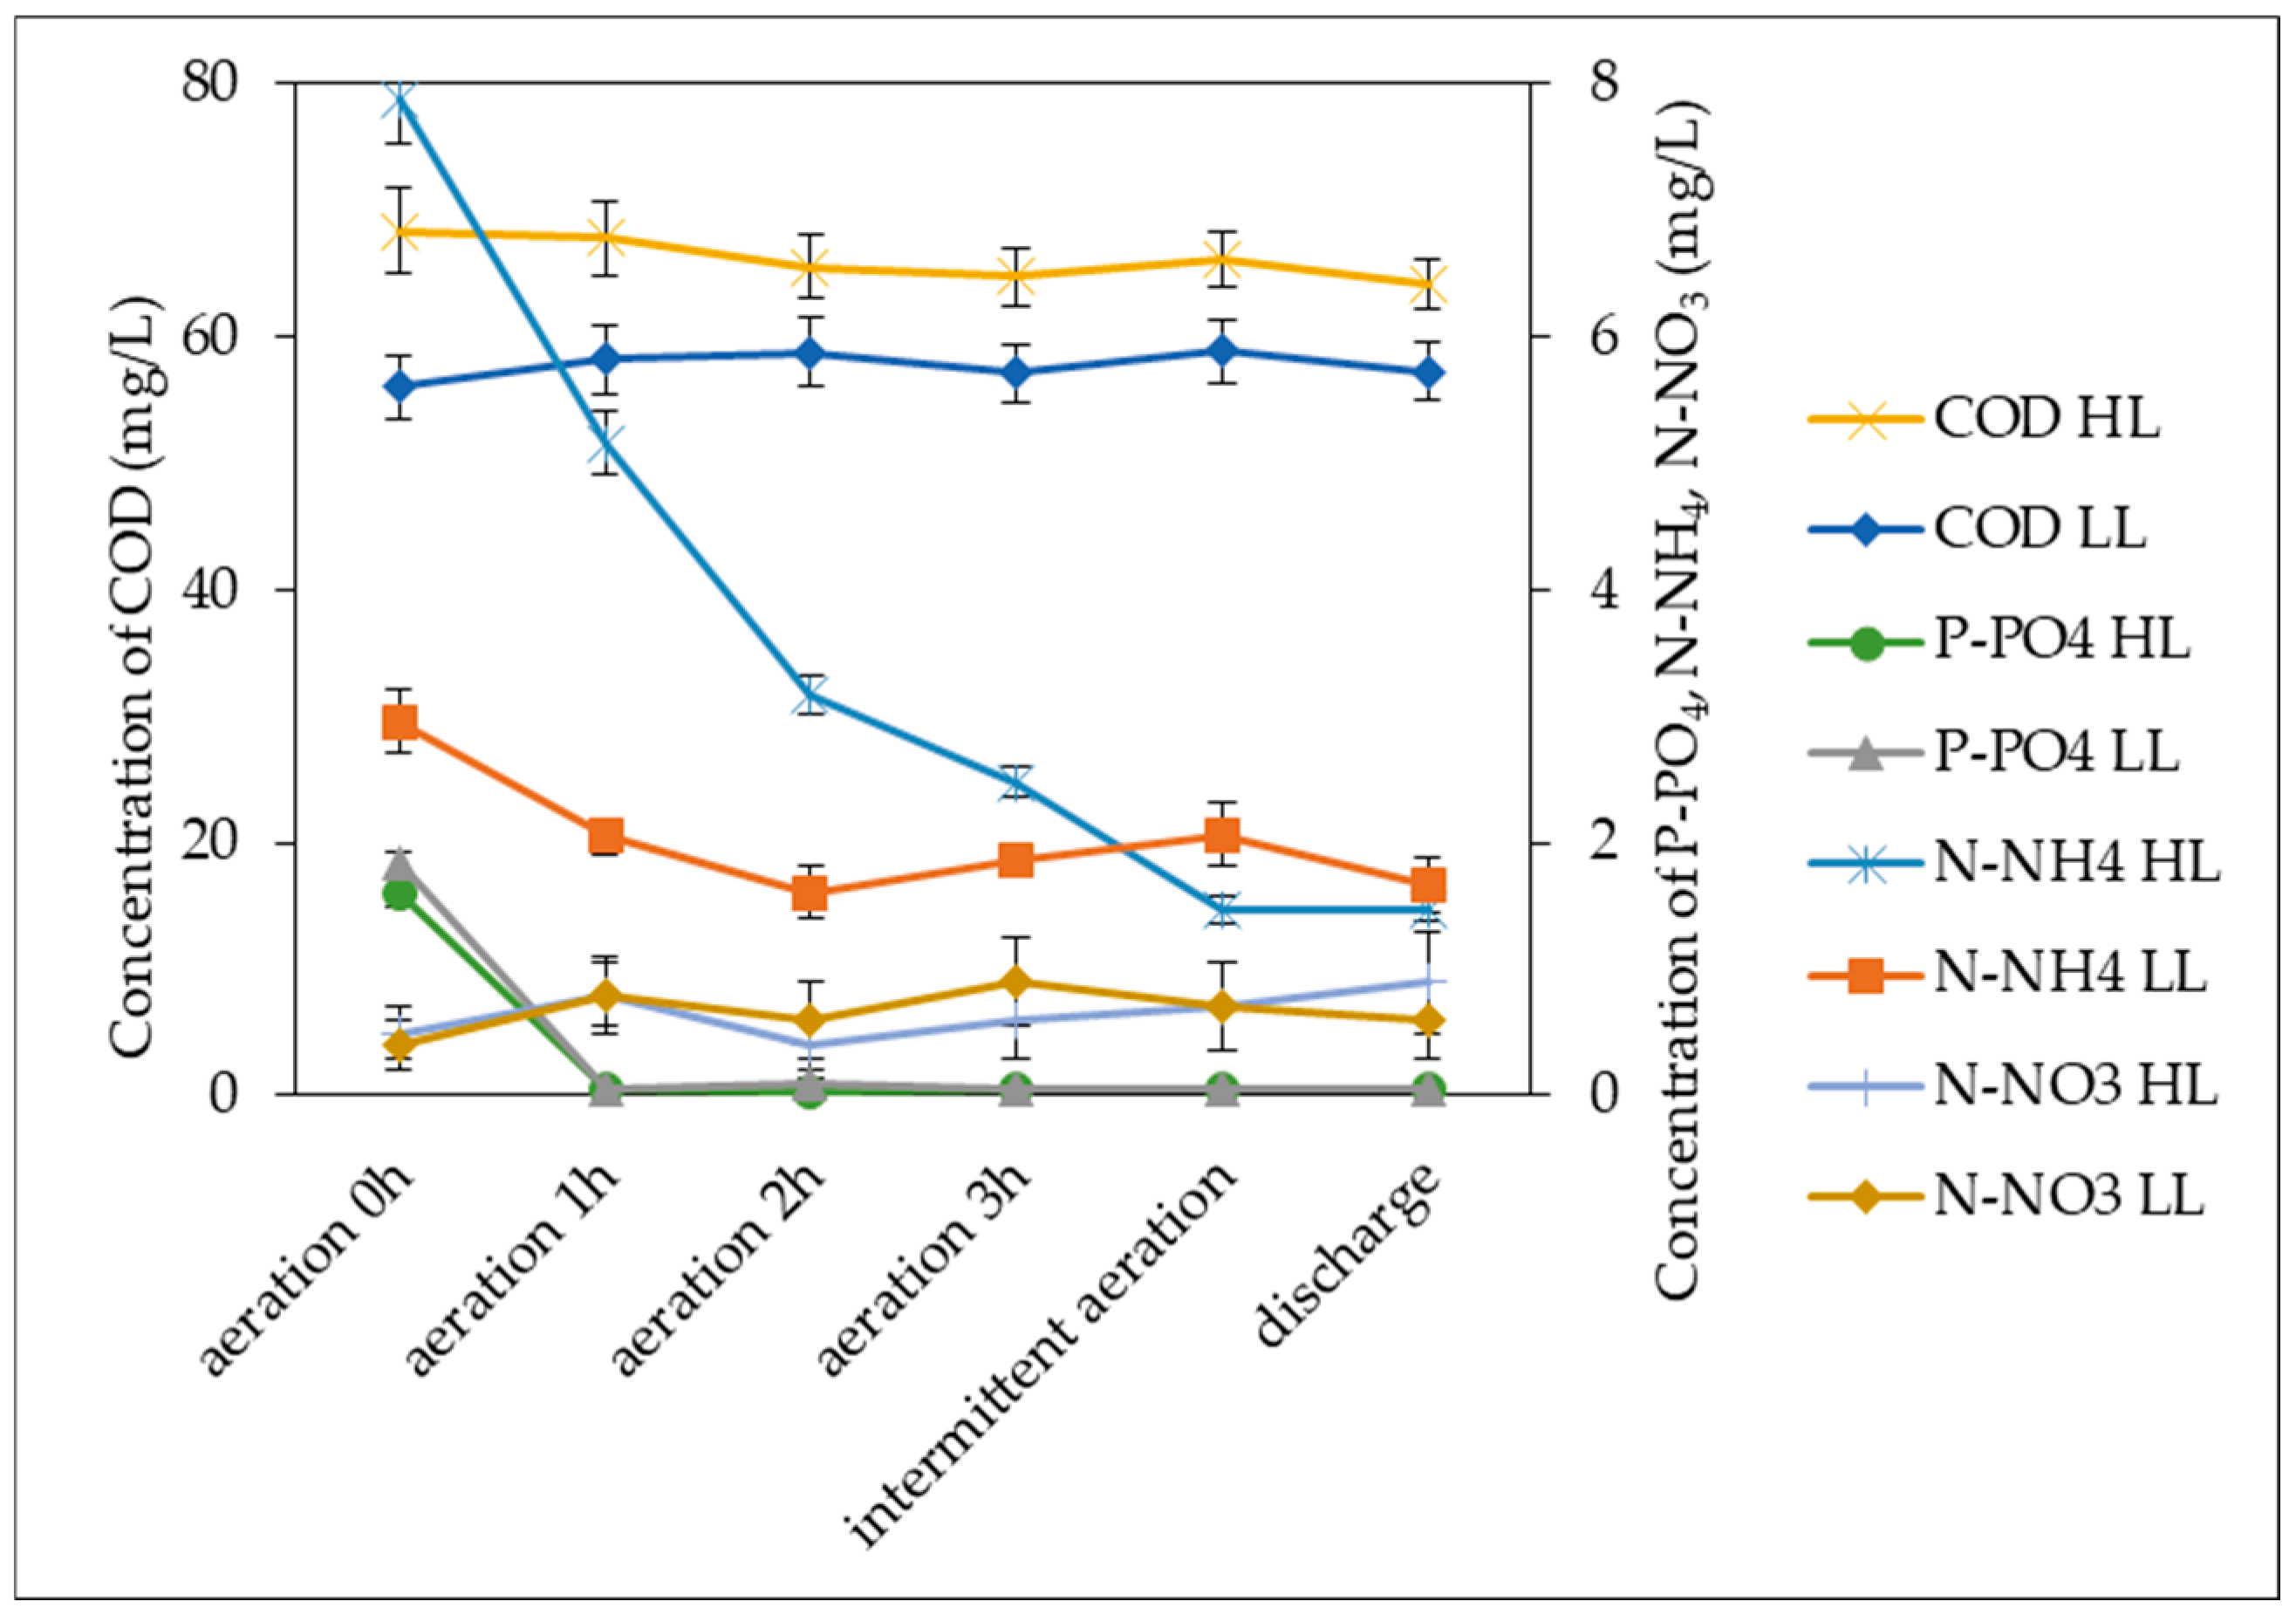
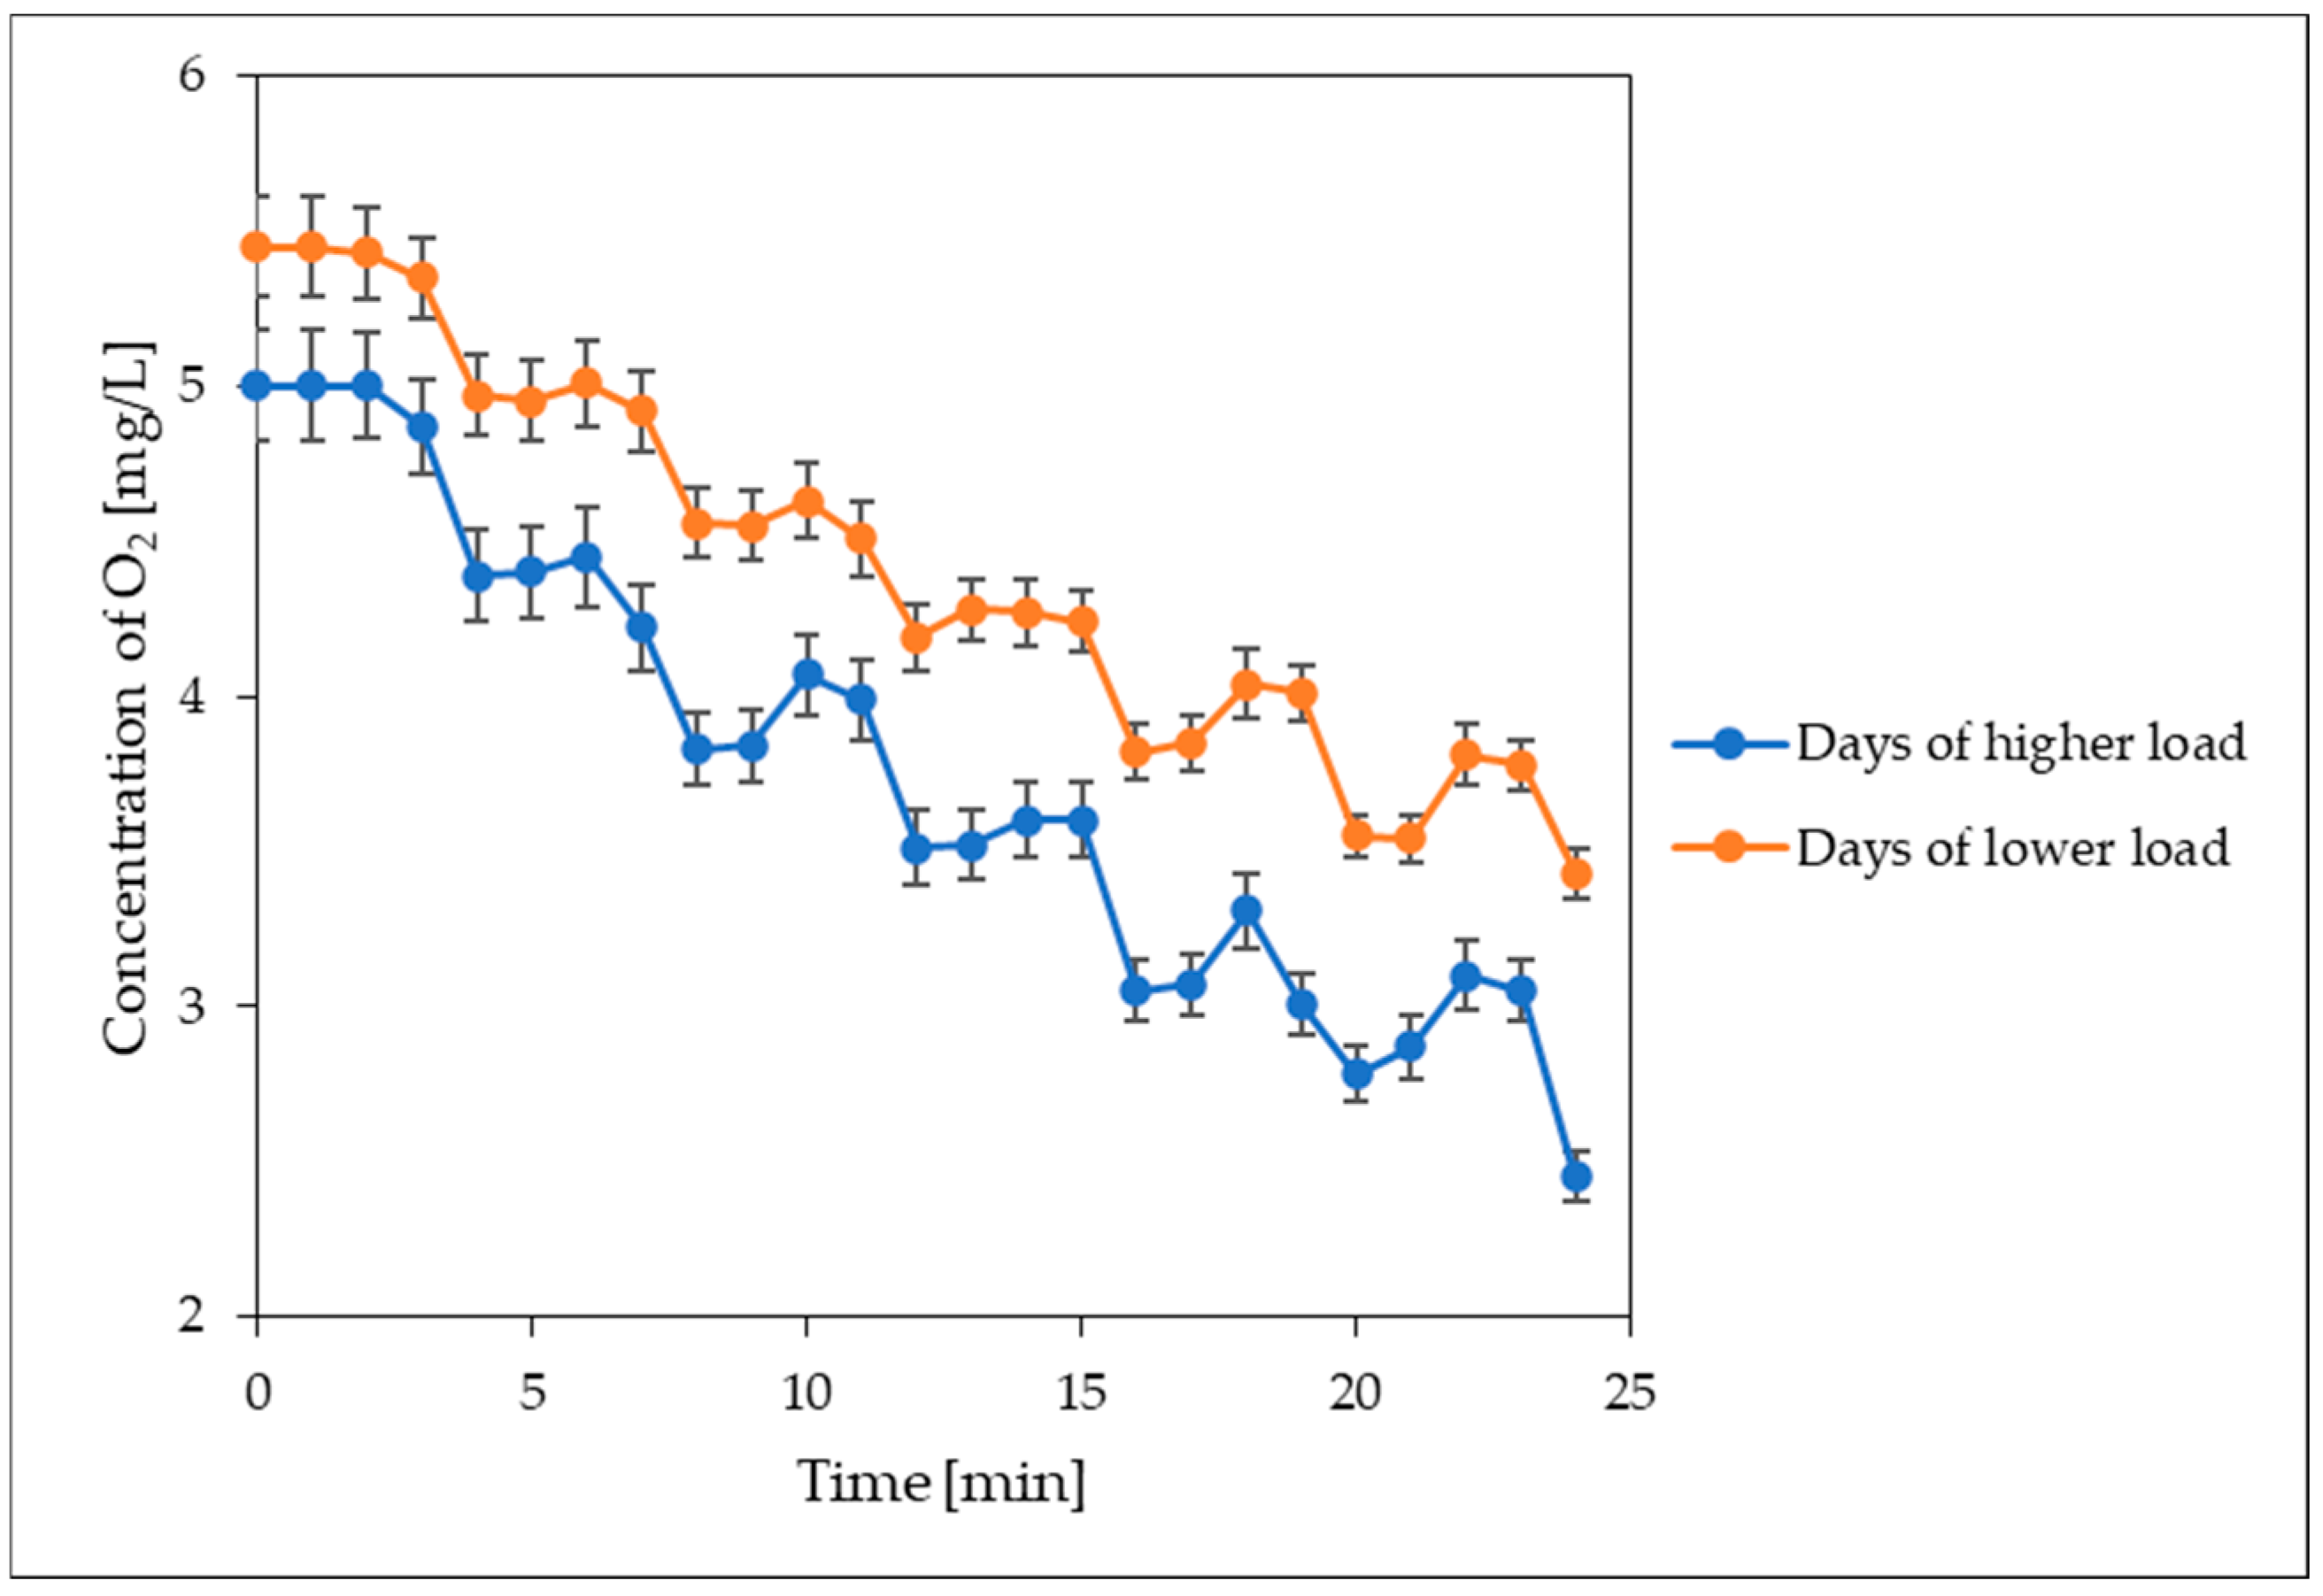
3.2. Operational Measurements at the WWTP after Reconstruction

The course of the monitored parameters at the outlet of the reconstructed wastewater-treatment plant (WWTP) during the start-up and trial operation is shown in Figure 3 and Figure 4. Figure 3 shows the values of COD (chemical oxygen demand) and suspended solids (sludge concentration), and Figure 4 shows the concentrations of ammonia nitrogen, nitrate nitrogen, and phosphate phosphorus.
From these figures, it is evident that during the adaptation of the sludge to conditions suitable for the growth of aerobic granular biomass, all monitored parameters gradually decreased. The COD values declined, and with the improvement of AGS sedimentation properties, the concentrations of suspended solids also decreased (Figure 3).
Figure 4 clearly shows that enhanced biological phosphorus removal was the first process to start in the WWTP, and its concentrations gradually falling below 0.5 mg/L. Nearly 50 days later, nitrification began, as evidenced by the decrease of ammonia nitrogen and the increase in nitrate nitrogen concentration. However, if we compare the concentrations of ammonia nitrogen and nitrate nitrogen, we see that the nitrate nitrogen concentration is significantly lower, indicating that denitrification was also occurring and its efficiency was gradually increasing.
Measurements taken during the start-up and trial operation indicate that the WWTP reconstruction was successful. The outlet values of COD, suspended solids, and ammonia nitrogen (Figure 3 and Figure 4, measurements taken from 24 h composite samples, unfiltered) are significantly lower than the values before reconstruction, as listed in Table 2, and they also meet the legislative requirements mentioned above. The concentration of dissolved oxygen during start-up and test operation in the activation tanks did not fall below 3 mg/L.
OLR after reconstruction decreased to 0.080 kg/(kg·d) BOD5, SVI steeply decreased to the range 80–120 mL/g and SRT—sludge age increase to more than 25 d. Decrease of OLR was caused by increase of average sludge concentration in biological stage from 3 g/L to 5 g/L. Improvement of sludge settling properties characterized by SVI was caused by aggregation of sludge.
In Figure 4, peaks in N-NH4 (approx. 50th day) and N-NO3 (approx. 150th day) concentrations are evident. These values and their subsequent reduction illustrate the optimization of the length of individual phases of the semi-continuous cycle and its total length. The total length of the cycle was set to 6 h after optimization, and the lengths of the individual phases are illustrated in Figure 2. The peak in the concentration of N-NH4 on the 50th day corresponds to a still unstable treatment process, when at high concentrations of COD nitrification does not take place (Figure 3). Stable nitrification started only after about 75 days of operation of the WWTP, which is evident from the permanent decrease in N-NH4 and increase in N-NO3. The peak of N-NO3 at about day 150 illustrates complete nitrification, without denitrification. It can be assumed that the sludge has not yet been sufficiently aggregated, but the subsequent decrease in N-NO3 already indicates the start of denitrification and granulation of the activated sludge. This means that the sludge-granulation time in the WWTP was after the 150th day. The work [5] states that it is possible to grow granulated biomass even with the use of real wastewater, but the granulation time is longer than 50 days. With the use of synthetic substrates, such as volatile fatty acids, granulation can be significantly faster.
After the trial operation, we conducted operational measurements, during which we measured not only the output concentrations of the monitored parameters but also their values during the semi-continuous cycle. The aim of these measurements was to gather information about the operation of the SBR (Sequencing Batch Reactor) technology, which works with the concept of AGS.
We conducted operational measurements at the WWTP on two separate days, during which different quality inflows to the WWTP were expected due to the unregulated discharge of septic tank wastewater and household operations over the weekend. Long-term measurements showed higher inflow concentrations at the WWTP on Tuesdays compared to the relatively average inflows on Fridays. The values of selected average parameters of wastewater inflow to the activation tank are listed in Table 3. The average values were calculated from three Tuesdays (higher load, HL) and three Fridays (lower load, LL) measurements. These values confirm the assumption of poorer wastewater quality at the beginning of the week. The difference in quality is not too significant, as it is partially balanced by the homogenization tank.
Sampling was conducted during the aeration phase, interrupted aeration, at the wastewater inflow, and at the outflow of the treated water, as shown in Figure 2. For all samples, COD, N-NH4, N-NO3, and P-PO4 were determined, and in some samples, the concentration of dry suspended solids (SS) and its volatile suspended solids (VSS) were also measured. During the interrupted aeration phase, the concentration of dissolved oxygen in the tank was measured.
The results of the concentration monitoring of individual parameters are shown in Figure 5. In this figure, we can see that the only significant concentration profile during the semi-continuous cycle can be observed in the case of N-NH4, where its concentration at the inflow on higher load days was significantly higher than on the lower load days. However, the output concentrations of N-NH4 at the WWTP outflow were not affected by this.
For all parameters, significant removal efficiency was recorded on both monitored days. The COD-removal efficiency was around 95%, the total nitrogen-removal efficiency was over 97%, and the total phosphorus-removal efficiency was over 99%. These are interesting results since anoxic conditions (dissolved oxygen concentration below 0.5 mg/L) necessary for the denitrification of N-NO3, which is formed by the oxidation of N-NH4, were not observed during the individual phases of the semi-continuous cycle. Similarly, anaerobic conditions, necessary for enhanced biological phosphorus removal, were not observed. No precipitants (e.g., Fe3+ or Al2+ salts) that enable chemical phosphorus removal were used either.
The oxygen concentration during the continuous aeration phases did not fall below 3.8 mg/L, at which aerobic or oxic processes, oxidation of organic carbon, and nitrification occur. The rate of these processes becomes limited only at dissolved oxygen concentrations below 2 mg/L. Even during the intermittent aeration phase, the oxygen concentration did not drop below 2 mg/L (Figure 6).
From Figure 6, it is evident that the aim of the intermittent aeration phase is not to achieve anoxic conditions, but to create hydrodynamic conditions for the agglomeration of sludge. These conditions, together with the hydrodynamic conditions created by the inflow of wastewater into the lower part of the sludge layer after sedimentation, are the main forces that promote the formation of sludge agglomerates. The existence of these agglomerates can explain the processes of denitrification and enhanced biological phosphorus removal, even though anaerobic or anoxic conditions necessary for these processes were not observed in the semi-continuous cycle of the tank.
The low concentrations of N-NO3 and P-PO4 at the tank outflow indicate the presence of an anoxic to anaerobic core within the sludge agglomerates, which allows these processes to occur at the micro-level through the segregation of anoxic or anaerobic zones within the agglomerates. Such conditions in the agglomerates are reported in many studies dealing with this issue [5,6,7,8]. The formation of sludge agglomerates is illustrated by the microscopic image shown in Figure 7. At 60× magnification, it is clear these agglomerates have formed, and even in smaller flocs, a denser core is evident.
Very similar microscopic images are presented in the work [15], which deals with the cultivation of nitrifying-denitrifying aerobic granular biomass.
The consistent COD concentration during different phases of the semi-continuous cycle, even at the beginning of aeration, is also somewhat surprising. Theoretically, it is possible that during the inflow of wastewater, in the initial phases of its contact with the granular biomass, the pollution accumulated in the sludge through adsorption on the sludge surface and through the formation of storage substances inside the sludge cells. This is a mechanism particularly applied in biological wastewater-treatment systems with sludge regeneration [16]. It is clear from Figure 5 that the concentration of most monitored parameters hardly changes during individual phases and is the same as at the outlet of the WWTP. This confirms claims from the literature that SBR is often used for aerobic granulation of sludge for its fill-and-draw running and aerobic starvation stage. As a filling-and-draw reactor, the settling time of SBR is short and contributes to granulation. In addition, there are two independent stages of sufficient substrate activity and substrate starvation in SBR, in which aerobic starvation can represent for more than 75% of the total semi-continuous cycle [17].
Therefore, at the beginning of aeration and after two hours of aeration, we took a sample of AGS to determine SS and their VSS. In all three cases of measurements on both high and low load days, the concentration of suspended solids at the beginning of aeration was higher, with an average SS concentration of 4.58 g/L and VSS of 87.1%. After two hours of aeration, the concentration of SS was 3.67 g/L and VSS was 85.7%. This means that the idea of adsorption and accumulation of organic pollution in the sludge cannot be excluded. Of course, further measurements would be needed to confirm this. The content of VSS in the sludge was similar to that reported in [18], where in the full-scale SBR system the VSS content was 86%, as well as in the compared continuous AS system. In work [13], the authors report significantly lower values of VSS—56.3% for Anaerobic/Oxic technology, 57.2% for Oxidation ditch technology and 62.4% for SBR technology.
To determine the nitrification and denitrification activity, sludge samples were taken from the activation tank, for laboratory kinetic tests. The specific nitrification rate in the tested sludge and also the specific rate of endogenous and exogenous denitrification were determined according to the procedure outlined in the Material and Methods section. Sampling was carried out every 30 min for 6 h, and the progression of N-NH4 and N-NO3 concentrations was monitored. The results of the nitrification tests are shown in Figure 8.
The nitrification rate can be determined from the rate of decrease in N-NH4 or the increase in N-NO3 concentration. Using linear regression, the slope of the linear part of the curves shown in Figure 5 was determined. The volumetric nitrification rate was found to be 0.059 mg/(L·min) N-NH4 and 0.0098 mg/(L·min) N-NO3. These values clearly show that the nitrification rate determined from the decrease in ammonia nitrogen is significantly higher than that measured from the increase in nitrate nitrogen. Considering the concentration of agglomerated biomass during the test, the nitrification rate is 2.22 mg/(g·h) N-NH4 and 0.365 mg/(g·h) N-NO3.
Theoretically, these rates should be comparable, but as indicated by the operational measurements at the WWTP, denitrification occurs even during the aeration phase due to microsegregation of anoxic conditions within the sludge aggregates. Therefore, it can be said with high probability that part of the nitrates formed was immediately denitrified during the tests, despite the dissolved oxygen concentration being 7.8 mg/L during the test. Therefore, the nitrification rate determined from the decrease in ammonia nitrogen concentration should be considered. This rate falls within the range of nitrification rates reported in the literature for suspended activated sludge [19,20,21,22]—see Table 4. Our achieved specific nitrification rate values are comparable to those reported for nitrifying-denitrifying AGS with enhanced biological phosphorus removal [15,23], as shown in Table 4. These values were measured for AGS cultivated under laboratory conditions, while in our case, it is real sludge. It is evident that the nitrification rates of pure nitrifying cultures grown on synthetic substrates are significantly higher.
When determining the denitrification activity of AGS, the values of N-NO3 concentrations were measured over time. Glucose was used as an external substrate. The course of the decrease in nitrate nitrogen without the addition of an external substrate (endogenous denitrification) and with the addition of an exogenous substrate (total denitrification) is shown in Figure 9. From the slopes of the linear parts of the denitrification curves, the denitrification rates of aerobic granular biomass were determined using linear regression. The volumetric rate of endogenous denitrification was 0.0095 mg/(L·min) N-NO3 and the total denitrification rate was 0.0311 mg/(L·min). From these values, we calculated the specific endogenous rate of 0.27 mg/(g·h) and the total denitrification rate of 0.93 mg/(g·h) N-NO3. Comparing this with the values for suspended sludge listed in Table 5, we see that it is in the same range [25,26,27]. However, it should be noted that in our case, the sludge is in oxic conditions throughout the entire semi-continuous cycle. When we compare our measured total denitrification rate with the rates achieved by granular sludge listed in Table 5, it is again comparable [22,28,29]. Higher rates are achieved with granular sludge with larger granule sizes up to 400 µm [28].
From the measurements of nitrification and denitrification rates, it is evident that the granular activated sludge from the reconstructed WWTP does not exhibit exceptional parameters that might be expected given the concept of granular biomass. Its unique characteristic is the ability to form larger compact agglomerates, in which an anoxic to anaerobic core is created. This enables simultaneous denitrification and enhanced biological phosphorus removal even at dissolved oxygen concentrations above 3.8%.

4. Conclusions

The municipal wastewater-treatment plant with a capacity of 3000 PE did not meet the required parameters of treated wastewater according to current legislation for any of the monitored parameters before the reconstruction. The WWTP was reconstructed following the principles of cultivating aerobic granular sludge, utilizing only the existing volumes of individual structures. Measurements during the start-up and trial operation confirmed that the reconstructed WWTP achieves the required parameters for treated wastewater, even for a WWTP size of up to 100,000 PE.
When measuring the concentrations of monitored parameters during various phases of the semi-continuous cycle, it was found that a significant concentration profile was only observed for ammonia nitrogen, and only at higher loads. For other parameters, their concentration profile was balanced across different phases.
The measurement of nitrification and denitrification rates indicates that the agglomerated biomass at the reconstructed WWTP achieves average values characteristic of both suspended activated sludge and aerobic granular sludge with granule sizes up to 400 µm.
Changes in energy consumption after the reconstruction of the WWTP were not observed. However, significantly better parameters for treated wastewater were achieved with the same energy consumption.
If the conventional SBR technology had been used in the reconstruction of the WWTP and not the concept with aerobic granular biomass, the energy consumption would certainly be higher.

Author Contributions

Conceptualization, M.H. and K.K.; methodology, M.H., K.K. and M.S.; validation, M.H. and B.J.; formal analysis, B.J., M.S., L.J. and N.Š.; investigation, B.J., L.J., M.S. and N.Š.; resources, all authors.; data curation, M.H. and K.K.; writing—original draft preparation, M.H. and K.K.; writing—review and editing, M.H. and K.K.; visualization, B.J., L.J., M.S. and N.Š. All authors have read and agreed to the published version of the manuscript.

Funding

This research received no external funding.

Data Availability Statement

Data are included within the article.

Conflicts of Interest

Author Karol Kratochvíl was employed by the company ASIO-SK s.r.o. The remaining authors declare that the research was conducted in the absence of any commercial or financial relationships that could be construed as a potential conflict of interest.

References

  1. de Kreuk, M.K.; Pronk, M.; van Loosdrecht, M.C.M. Formation of Aerobic Granules and Conversion Processes in an Aerobic Rranular Sludge Reactor at Moderate and Low Temperatures. Water Res. 2005, 39, 4476–4484. [Google Scholar] [CrossRef] [PubMed]
  2. de Kreuk, M.K.; Kishida, N.; van Loosdrecht, M.C.M. Aerobic Granular Sludge–State of the Art. Water Sci. Technol. 2007, 55, 75–81. [Google Scholar] [CrossRef]
  3. Weber, S.D.; Ludwig, W.; Schleifer, K.H.; Fried, J. Microbial Composition and Structure of Aerobic Granular Sewage Biofilms. Appl. Environ. Microbiol. 2007, 73, 6233–6240. [Google Scholar] [CrossRef] [PubMed]
  4. Pronk, M.; Kreuk, M.K.; de Bruin, B.; Kamminga, P.; Kleerebezem, R.; van Loosdrecht, M.C.M. Full Scale Performance of the Aerobic Granular Sludge Process for Sewage Treatment. Water Res. 2015, 84, 207–217. [Google Scholar] [CrossRef] [PubMed]
  5. de Sousa Rollemberg, S.L.; Mendes Barros, A.R.; Milen Firmino, P.I.; Bezerra dos Santos, A. Aerobic Granular Sludge: Cultivation Parameters and Removal Mechanisms. Bioresour. Technol. 2018, 270, 678–688. [Google Scholar] [CrossRef]
  6. Nancharaiah, Y.V.; Sarvajith, M. Aerobic Granular Sludge Process: A Fast Growing Biological Treatment for Sustainable Wastewater Treatment. Curr. Opin. Environ. Sci. Health 2019, 12, 57–65. [Google Scholar] [CrossRef]
  7. Dangcong, P.; Bernet, M.; Delgenes, J.P.; Moletta, R. Aerobic Granular Sludge—A Case Report. Water Res. 1999, 33, 890–893. [Google Scholar] [CrossRef]
  8. Nancharaiah, Y.V.; Kiran Kumar Reddy, G. Mechanisms of Granulation and Biotechnological Applications. Bioresour. Technol. 2018, 247, 1128–1143. [Google Scholar] [CrossRef]
  9. Winkler, M.K.H.; Bassin, J.P.; Kleerebezem, R.; de Bruin, L.M.M.; van den Brand, T.P.H.; van Loosdrecht, M.C.M. Selective Sludge Removal in a Segregated Aerobic Granular Biomass System as a Strategy to Control PAO-GAO Competition at High Temperatures. Water Res. 2011, 45, 3291–3299. [Google Scholar] [CrossRef]
  10. Liu, Y.; Tay, J.H. The Essential Role of Hydrodynamic Shear Force in the Formation of Biofilm and Granular Sludge. Water Res. 2002, 36, 1653–1665. [Google Scholar] [CrossRef]
  11. Sarma, S.J.; Tay, J.H.; Chu, A. Finding Knowledge Gaps in Aerobic Granulation Technology. Trends Biotechnol. 2017, 35, 66–78. [Google Scholar] [CrossRef] [PubMed]
  12. Niermans, R.; Giesen, A.; van Loosdrecht, M.; de Buin, B. Full-scale Experiences with Aerobic Granular Biomass Technology for Treatment of Urban and Industrial Wastewater. Proc. Water Environ. Fed. 2014, 19, 2347–2357. [Google Scholar] [CrossRef]
  13. Li, J.; Ding, L.B.; Cai, A.; Huang, G.X.; Horn, H. Aerobic Sludge Granulation in a Full-scale Sequencing Batch Reactor. BioMed Res. Int. 2014, 2014, 268789. [Google Scholar] [CrossRef] [PubMed]
  14. APHA/AWWA/WEF. Standard Methods for the Examination of Water and Wastewater; American Public Health Association: Washington, DC, USA, 2017. [Google Scholar]
  15. Morgan, G.; Hamza, R.A. Cultivation of Nitrifying and Nitrifying-Denitrifying Aerobic Granular Sludge for Sidestream Treatment of Anaerobically Digested Sludge Centrate. Processes 2022, 10, 1687. [Google Scholar] [CrossRef]
  16. Li, D.; Wang, Z.; Yang, Y.; Liu, H.; Fang, S.; Liu, S. Research Status and Development Trend of Wastewater Treatment Technology and Its Low Carbonization. Appl. Sci. 2023, 13, 1400. [Google Scholar] [CrossRef]
  17. Hou, Y.; Gan, C.; Chen, R.; Chen, Y.; Yuan, S.; Chen, Y. Structural Characteristics of Aerobic Granular Sludge and Factors That Influence Its Stability: A Mini Review. Water 2021, 13, 2726. [Google Scholar] [CrossRef]
  18. Ekholm, J.; Persson, F.; de Blois, M.; Modin, O.; Gustavsson, D.J.I.; Pronk, M.; van Loosdrecht, M.C.M.; Wilén, B.M. Microbiome structure and function in parallel full-scale aerobic granular sludge and activated sludge processes. Appl. Microbiol. Biotechnol. 2024, 108, 334. [Google Scholar] [CrossRef] [PubMed]
  19. Layer, M.; Villodres, M.G.; Hernandez, A.; Reynaert, E.; Morgenroth, E.; Derlon, N. Limited simultaneous nitrification-denitrification (SND) in aerobic granular sludge systems treating municipal wastewater: Mechanisms and practical implications. Water Res. X 2020, 7, 100048. [Google Scholar] [CrossRef]
  20. Carter, J.A. Bioaugmentation with Sidestream Granular Sludge for Nitrification in Activated Sludge. Master’s Thesis, Washington University, Washington, DC, USA, 2020. [Google Scholar]
  21. Yuan, X.; Gao, D. Effect of dissolved oxygen on nitrogen removal and process control in aerobic granular sludge reactor. J. Hazard. Mater. 2010, 178, 1041–1045. [Google Scholar] [CrossRef]
  22. Feng, Q.; Cao, J.; Chen, L.; Guo, C.; Tan, J.; Xu, H. Simultaneous nitrification and denitrification at variable C/N ratio in aerobic granular sequencing batch reactors. J. Food Agric. Environ. 2011, 9, 1135–1140. [Google Scholar]
  23. Figdore, B.A.; Stensel, H.D.; Winkler, M.K.H. Comparison of different aerobic granular sludge types for activated sludge nitrification bioaugmentation potential. Bioresour. Technol. 2018, 251, 189–196. [Google Scholar] [CrossRef] [PubMed]
  24. Figdore, B.A.; Winkler, M.K.H.; Stensel, H.D. Bioaugmentation with Nitrifying Granules in Low-SRT Flocculent Activated Sludge at Low Temperature. Water Environ. Res. 2017, 90, 343–354. [Google Scholar] [CrossRef] [PubMed]
  25. Harremoës, P.; Sinkjær, O. Kinetic interpretation of nitrogen removal in pilot scale experiments. Water Res. 1995, 29, 899–905. [Google Scholar] [CrossRef]
  26. Fan, X.; Urbain, V.; Qian, Y.; Manem, J. Nitrification and mass balance with a membrane bioreactor for municipal wastewater treatment. Water Sci. Technol. 1996, 34, 129–136. [Google Scholar]
  27. Grana, M.; Catenacci, A.; Ficara, E. Denitrification Capacity of Volatile Fatty Acids from Sludge Fermentation: Lab-Scale Testing and Full-Scale Assessment. Fermentation 2024, 10, 25. [Google Scholar] [CrossRef]
  28. Huang, Y.; Wang, X.; Wang, R.; He, J.; Huang, Y.; Hang, Z.; Chen, X.; Li, Z. Managing stability of aerobic granules by coordinating diameter and denitrification. Sci. Total Environ. 2024, 906, 167795. [Google Scholar] [CrossRef]
  29. Zhang, X.; Zhao, B.; An, Q.; Zhang, P. The influence of different nitrate concentrations on aerobic sludge granulation and the role of extracellular polymeric substances. J. Environ. Manag. 2023, 348, 119226. [Google Scholar] [CrossRef]
Figure 1. Scheme of reconstructed WWTP to AGS system. MP—mechanical pretreatment (fine screens and sand trap); ET—equalization tank; AT1, AT2—activation tanks (reactors AS-GranBio); ST1, ST2—tanks for excess sludge storage.
Processes 12 01782 g001
Figure 2. Individual phases of the semi-continuous cycle and sampling from the activation tank.
Processes 12 01782 g002
Figure 3. Course of effluent COD and SS concentration during start-up and trial operation of WWTP.
Processes 12 01782 g003
Figure 4. Course of effluent N-NH4, N-NO3 and P-PO4 concentration during start-up and trial operation of WWTP.
Processes 12 01782 g004
Figure 5. Concentrations of the observed parameters during individual phases of semi-continuous cycle.
Processes 12 01782 g005
Figure 6. Trend of oxygen concentration in the phase of intermittent aeration.
Processes 12 01782 g006
Figure 7. Microscopic image of agglomerated sludge (magnification 60×).
Processes 12 01782 g007
Figure 8. Progress of N-NH4 and N-NO3 during the nitrification test.
Processes 12 01782 g008
Figure 9. Progress of N-NO3 during of denitrification test.
Processes 12 01782 g009
Table 1. Comparison of selected properties of AGS and AS. Adjusted according to [5,6,7,8].
ParameterAerobic Sludge
Activated/SuspendedGranulated
ShapeIrregularRegular and spherical
Average size<0.2 mm0.2–5.0 mm
Sedimentation rateLower settling rates
<10 m/h
Higher settling rates
>10 m/h
SVI 1SVI5 2 > SVI30 3SVI5 ≈ SVI30
Degree of compactness and densityLowHigh
Layered structure or coexistence of aerobic, anoxic and anaerobic microenvironmentMinimum options for anaerobic zonesAerobic, anaerobic and anoxic zones predominate
EPS 4Lower content of EPSHigh content of EPS
Tolerance to toxic compoundsLower tolerance to toxic pollutantsHigher tolerance to toxic pollutants
Ability to withstand impact pollutionWeakGood
1 SVI -Sludge Volume Index (g/L); 2 SVI5—SVI for 5 min sedimentation; 3 SVI30—SVI for 30 min sedimentation (standard SVI); 4 EPS—Extracellular Polymeric Substances.
Table 3. Average values of selected parameters at the WWTP inflow on the days of operational measurements.
BOD5 (mg/L)COD (mg/L)SS (mg/L)N-NH4 (mg/L)P-PO4 (mg/L)
Higher load
760 ± 55.61 390 ± 102.2880 ± 143.4140 ± 18.216 ± 1.9
Lower load
530 ± 53.41 050 ± 82.3640 ± 94.195 ± 11.410 ± 1.2
Table 4. Specific nitrification rate from the literature.
vN (mg/g·h)ConditionsReference
Aerobic suspended sludge
1.5at 2 mg O2/L[19]
1.2–1.4at Xb 8.6–14.4 g/L[20]
1.506at 1 mg O2/L[21]
3.57at 4.5 mg O2/L
1.802at C/N = 20[22]
Aerobic granulated sludge
31.25Pure nitrifying culture[23]
5.83Nitri. and denitri. sludge with biol. remov. of P
29.8Pure nitrifying culture[24]
40.36Pure nitrifying culture[15]
6.86Nitri. and denitri. sludge with biol. remov. of P
2.22Nitri. and denitri. sludge with biol. remov. of PIn this study
Table 5. Specific denitrification rate from the literature.
vD (mg/g·h)ConditionsReference
Aerobic suspended sludge
0.80–0.907 °C[25]
0.97–2.50Membrane reactor [26]
1.00–2.20 Pure volatile fatty acids[27]
Aerobic granulated sludge
0.697–0.775At C/N = 20–10 [22]
0.51Small AGS diameter < 200 µm[28]
2.24Medium AGS diameter 200–400 µm
5.48Large AGS diameter > 400 µm
2.93Xb 4 g/L[29]
0.93SBRIn this study
Disclaimer/Publisher’s Note: The statements, opinions and data contained in all publications are solely those of the individual author(s) and contributor(s) and not of MDPI and/or the editor(s). MDPI and/or the editor(s) disclaim responsibility for any injury to people or property resulting from any ideas, methods, instructions or products referred to in the content.

