Article

Influence of Fault Dip Angle and Strength on Fault Slip Characteristics of Gas Storage

by
Songlin Cheng
1,2,3,4,
Guosheng Ding
1,2,3,4,
Zhide Wu
2,3,4,*,
Xiaosong Qiu
2,3,4,
Haitao Xu
5 and
Bingbing Liu
2,3,4
1
Institude of Porous Flow & Fluid Mechanics Chinese Academy of Sciences, Langfang 065007, China
2
Research Institute of Petroleum Exploration & Development, China National Petroleum Corporation (CNPC), Beijing 100083, China
3
Key Laboratory of Oil & Gas Underground Storage Engineering, China National Petroleum Corporation (CNPC), Langfang 065007, China
4
National Energy Underground Gas Storage Research and Development Center, Beijing 100083, China
5
Development Planning Department, China National Petroleum Corporation (CNPC), Beijing 100007, China
*
Author to whom correspondence should be addressed.
Processes 2024, 12(9), 1869; https://doi.org/10.3390/pr12091869
Submission received: 1 August 2024 / Revised: 27 August 2024 / Accepted: 30 August 2024 / Published: 31 August 2024
(This article belongs to the Section Energy Systems)

Abstract

:
The alternating stress caused by periodic high-pressure injection and extraction in gas storage can potentially induce fault slippage, compromising the sealing integrity of faults within these storages sites. Understanding the mechanical behavior of faults under alternating stress is crucial for ensuring the long-term stability and safety of gas storage operations. To explore the impact of fault dip angle and fault gouge strength on fault slip characteristics, fault samples were prepared with uniaxial compressive strengths of 20.1, 30.2, 42.4, and 51.4 MPa at two distinct dip angles. Triaxial compression experiments were conducted under alternating stress conditions corresponding to operational pressures at a specific gas storage site in China. The results indicate that faults with dip angles of 30° and 45° tend to fail at their weakest points. The increasing strength of fault gouges shifts failure mechanisms from interfacial failure between gouges and the surrounding rock towards internal gouge failure, often accompanied by shear failure across sections, resulting in characteristic “X”-shaped conjugate shear failures. The decrease in the ratio of bedrock strength to fault gouge strength elucidates the observed phenomena of an initial reduction followed by increased fault deformation. Transition points for faults with 30° and 45° dips occur around the strength ratios of 1.7/1 and 1.2/1, respectively. Fault damage exhibits a negative correlation with fault gouge strength and a positive correlation with fault dip angle. Samples with a higher-strength fault gouge at a 30° dip angle generally incur less damage compared to those with a lower-strength fault gouge at a 45° dip angle. Moreover, higher maximum static friction coefficients denote greater fault resistance to slipping, with 30° faults consistently demonstrating superior resistance compared to 45° faults. Additionally, a higher-strength fault gouge consistently enhances slip resistance under identical dip angles.

1. Introduction

Underground gas storage (UGS) is a key component of the system of natural gas that includes “production, transportation, supply, storage, and sales”; it plays an extremely important role in the peak regulation and supply protection of natural gas. By the end of 2022, China built 24 underground gas storage units (groups), forming a gas storage capacity of about 192 × 108 m3 [1]. The target areas for building these gas storage are in poor geological conditions, such as a burial depth generally greater than 3000 m, a complex structure, rapid sedimentary phase transformation, and strong heterogeneity [2], and most UGS sites are gas-reservoir-type reservoirs with relatively developed faults. In addition, the periodic high-pressure injection and extraction of gas storage will lead to alternating changes in regional geostress fields [3], resulting in stress concentration in the fracture section [4], while the gouge in the fault is generally weak and broken. Therefore, it is easy for alternating stress to allow for the capacity to resist damage and deformation reduction and relative dislocation, which may lead to fault sealing failure [5]. It is particularly important to study fault slipping characteristics during the preliminary study and program design of gas storage construction.
Numerous studies have shown that fault slipping often affects the reservoir and distribution of underground resources and the sealing of oil and gas traps [6,7,8]; especially, fault slipping plays an important role in controlling the development and distribution of reservoirs, and fault slipping may cause the deformation, fracture, or folding of reservoirs [9,10,11]. For the caprock, fault slipping may cause the caprock to stretch or squeeze [12], which has a serious impact on the integrity and sealing of the caprock [13,14]. As one of the occurrence of faults, fault inclination has an impact on many aspects, such as shear stress [15], a normal stress variation tendency [16], and an oil and gas migration direction. As a component of faults, the fault gouge is the part with the worst mechanical properties in the fault zone, and it is also the geological unit with the largest deformation and the first to be destroyed after disturbance [17]. Many scholars have carried out a large number of studies on fault gouges. Ma et al. [18] concluded through two-dimensional simulation tests that the greater the fault inclination, the more favorable the upward movement and accumulation of oil and gas; Jia et al. [19] focused on the propagation law of acoustic emission signals in faults, and relevant tests showed that the propagation speed and maximum value of acoustic signals were positively correlated with fault inclination; Li et al. [20] introduced the distance coefficient to establish the weighted gouge ratio method to verify the sealing of oil and gas systems. It is concluded that when the weighted gouge ratio is greater than 0.6, the fault has a good sealing ability; Xie et al. [21] used kaolin, montmorillonite, and quartz to make fault gouges with a water content of 30% of different components for direct shear experiments, and they found that the cohesion and internal friction angle changed with the change in different components.
In summary, fault inclination and gouge mechanical properties can affect fault slipping. Therefore, based on the research purpose, this paper utilizes cement mortar as a similar material to prepare artificial cylindrical fault samples with varying fault inclination and strength grades. Subsequently, orthogonal combination experiments are conducted under alternating stress in order to further comprehend the fault slip mechanism of gas storage.

2. Materials and Methods

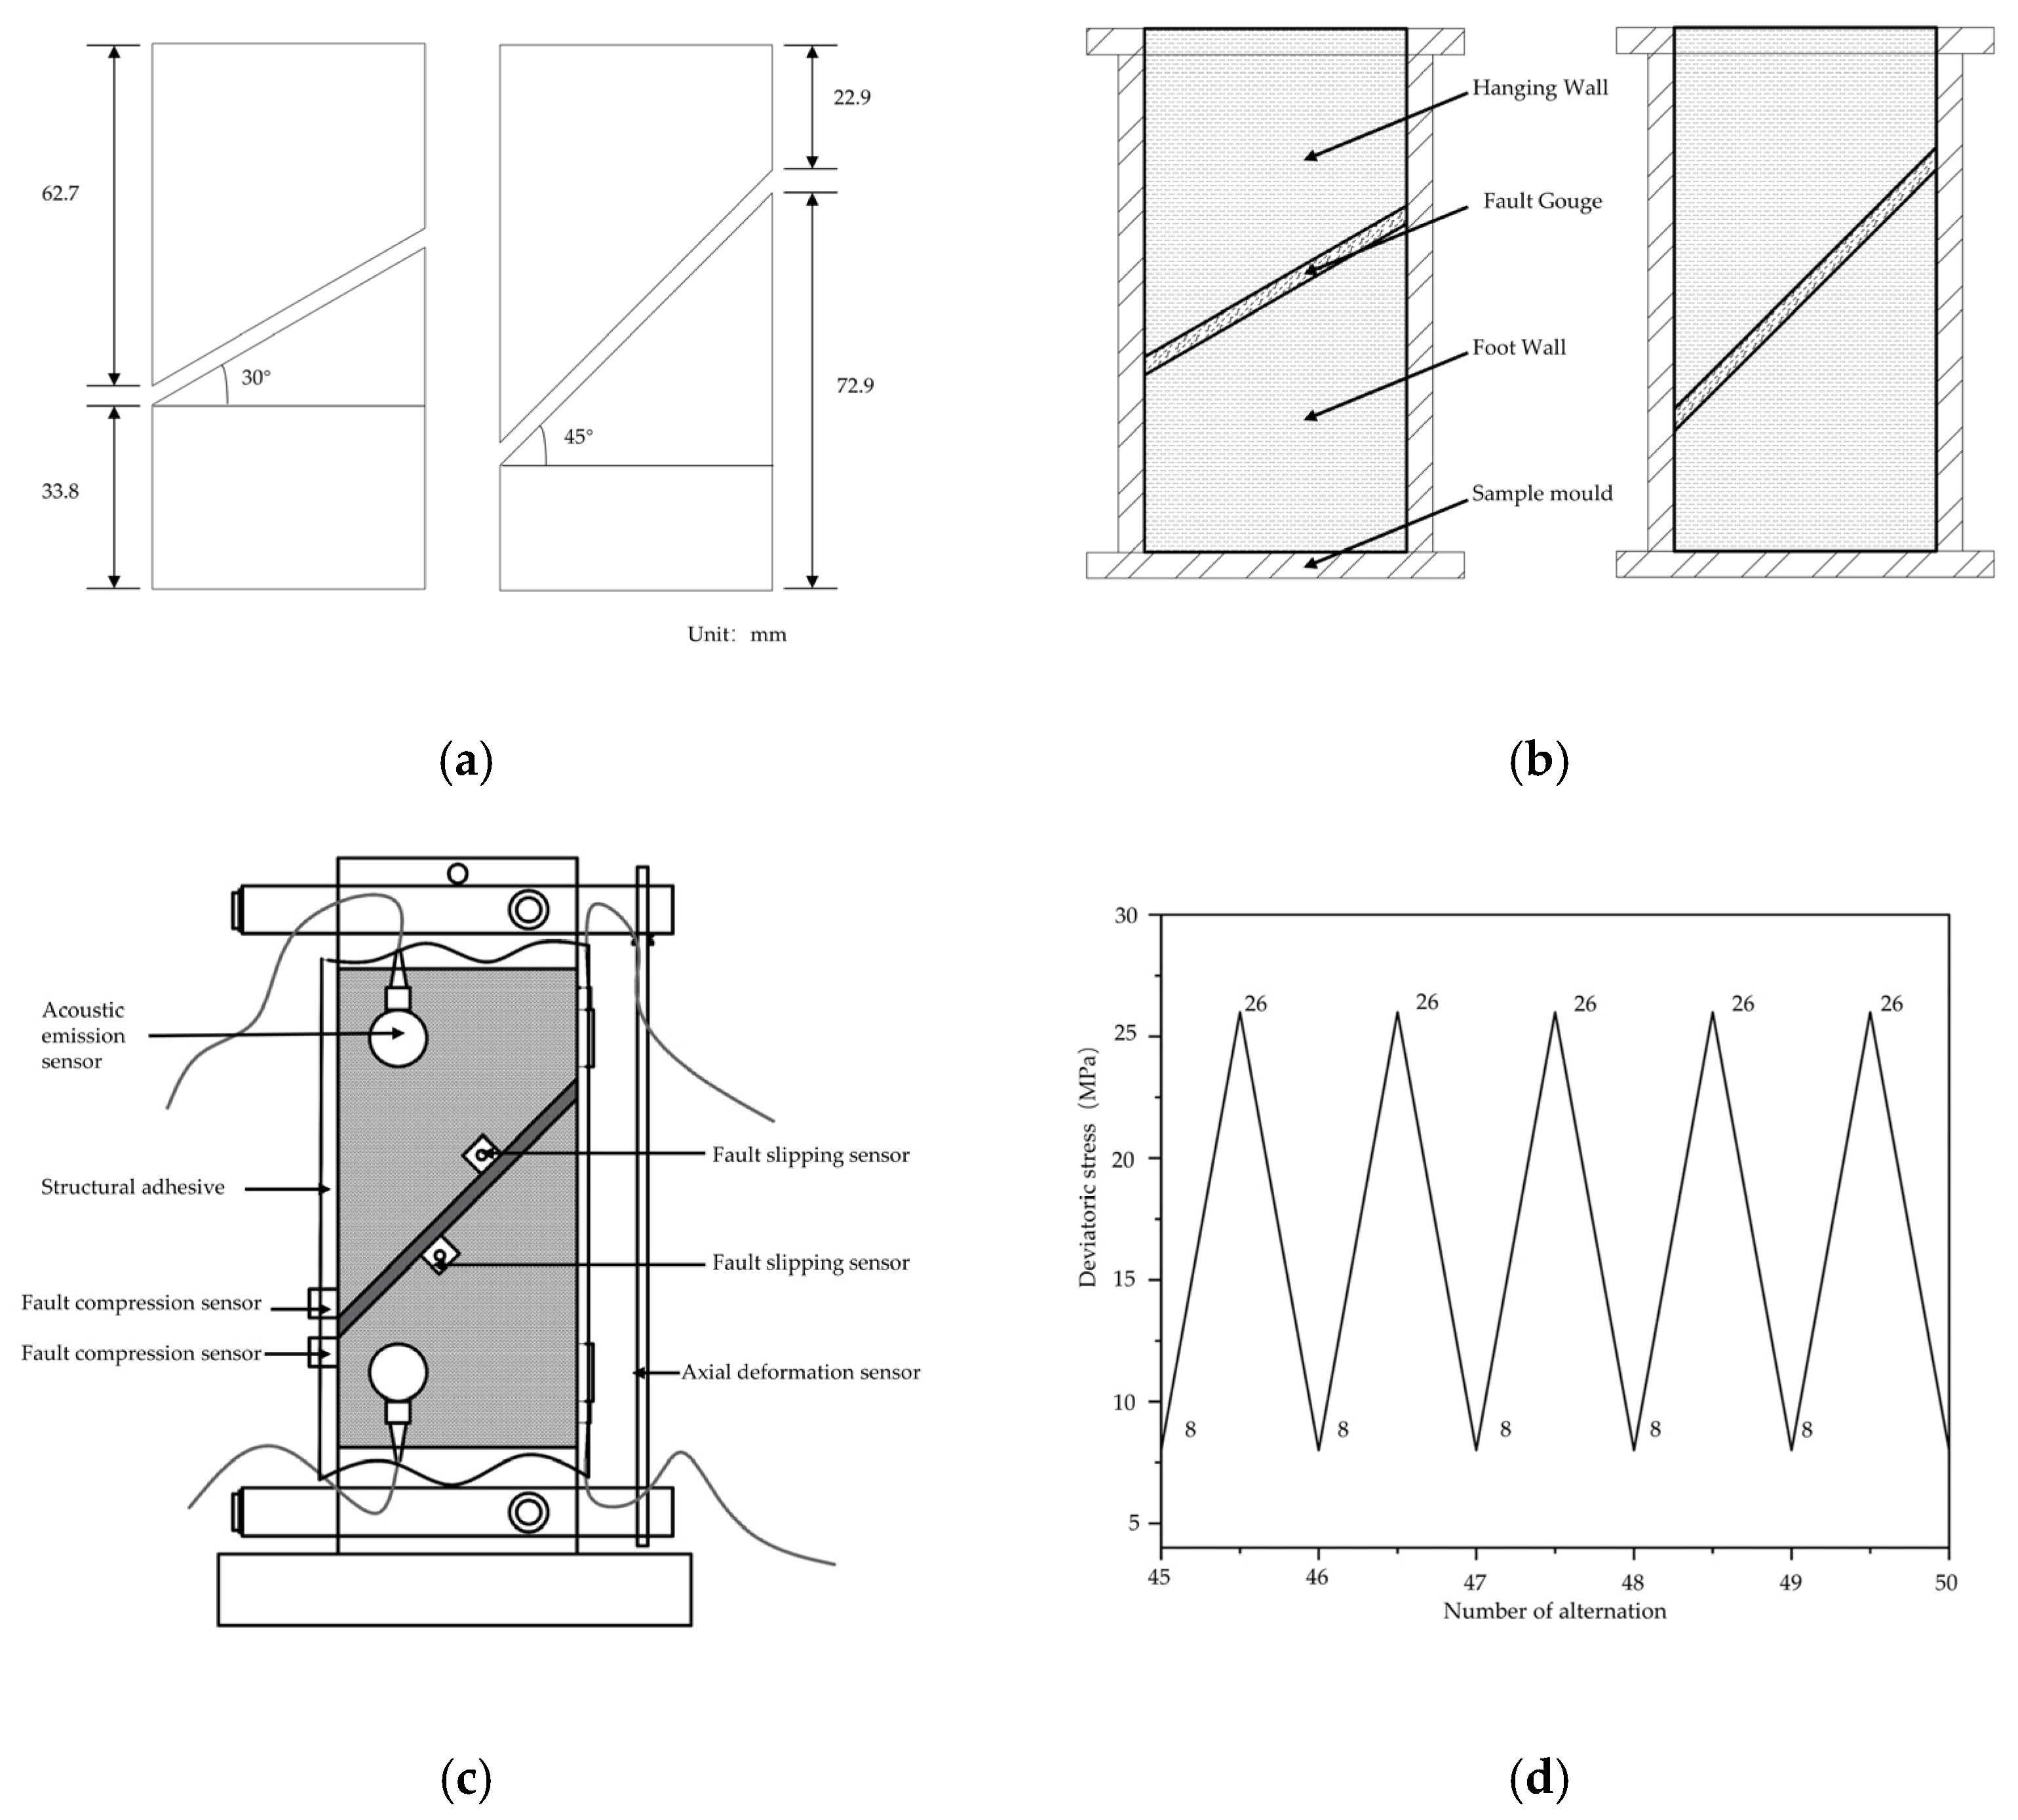
2.1. Preparation of Test Samples

Fault samples are indispensable for the execution of slip experiments. Nonetheless, the pronounced fracturing and substantial softening characteristics inherent to the rock mass within fault zones frequently result in complications such as core blockage and core detachment during the drilling of fault cores [22,23]. These challenges significantly hinder the acquisition of fault samples that are suitable for rigorous experimental analysis. Consequently, this study employed cylindrical fault samples fabricated from highly homogeneous sandstone (Petrochina Langfang Research Institute of Science and Technology Co., LTD, Langfang, China) and cement mortar (Petrochina Langfang Research Institute of Science and Technology Co., LTD) to facilitate a comprehensive experimental investigation.
Initially, hanging and foot wall rocks with 30° and 45° were made, respectively, as shown in Figure 1a. Subsequently, cylindrical molds were employed to fill cement mortar as the fault gouge, maintaining a uniform 3 mm thickness, and following prescribed standards for curing procedures. Upon completion of curing, the fault samples were prepared as depicted in Figure 1b, the sample diameter was 50 mm, and the height was 100 mm. To investigate the influence of fault gouge strength on fault slip characteristics, four types of fault gouge were prepared with uniaxial compressive strengths of 20.1, 30.2, 42.4, and 51.4 MPa, achieved by varying the cement-to-river sand ratio.
As per experimental protocol, a cement–sand mortar mix trial was undertaken; in order to shorten the curing period and quickly improve the mechanical properties of the fault gouge, high-strength cement (Type 425 Portland cement), 50-mesh fine sand, and cement mortar reinforcement agent were innovatively used as raw materials in the preparation of the fault gouge. Employing fine sand ensured optimal consistency of the fault gouge, while the enhancer not only improved mortar workability but also bolstered its resistance to cracking and bond strength, expeditiously meeting the test requirements. To ascertain genuine fault gouge strength, identical materials, mix proportions, and curing protocols were concurrently used to fashion validation specimens for uniaxial compressive strength tests alongside fault sample production. Uniaxial test outcomes for the surrounding rock and fault gouge specimens are detailed in Table 1 for reference. These parameters were obtained by conducting experiments on the MTS815 rock mechanics testing machine. Specifically, the modulus of elasticity, Poisson’s ratio, and uniaxial compressive strength were determined through uniaxial compression tests. During data processing, we generated full stress–strain curves for each sample and calculated the elastic stage of the curve to obtain the modulus of elasticity and Poisson’s ratio. Additionally, the cohesion and internal friction angle were determined through triaxial compression tests. The Mohr stress circle was utilized to calculate these values based on the data obtained.

2.2. Test Methods

The experiment was conducted using the fault mechanics testing apparatus developed by the PetroChina Key Laboratory of Underground Oil and Gas Storage, featuring a maximum axial load capacity of 2000 kN and a maximum confining pressure capability of 80 MPa. Prior to formal testing, the samples underwent preloading. Deformation sensors were strategically installed on the upper and lower indenters to monitor axial compression, while sensors on the fault were deployed to monitor fault compression and slip behavior. To prevent interference from the confining pressure oil during loading and ensure test accuracy, the samples were encapsulated with structural sealant, illustrated in Figure 1c.
During the experiment, the confining pressure was always maintained at 25 MPa, and the axial stress was alternately changed 50 times within the range of 8–26 MPa. After the end of the alternations, the axial integral compression deformation was controlled at a rate of 0.15 mm/min until the sample was damaged. The alternating process is shown in Figure 1d.

3. Results

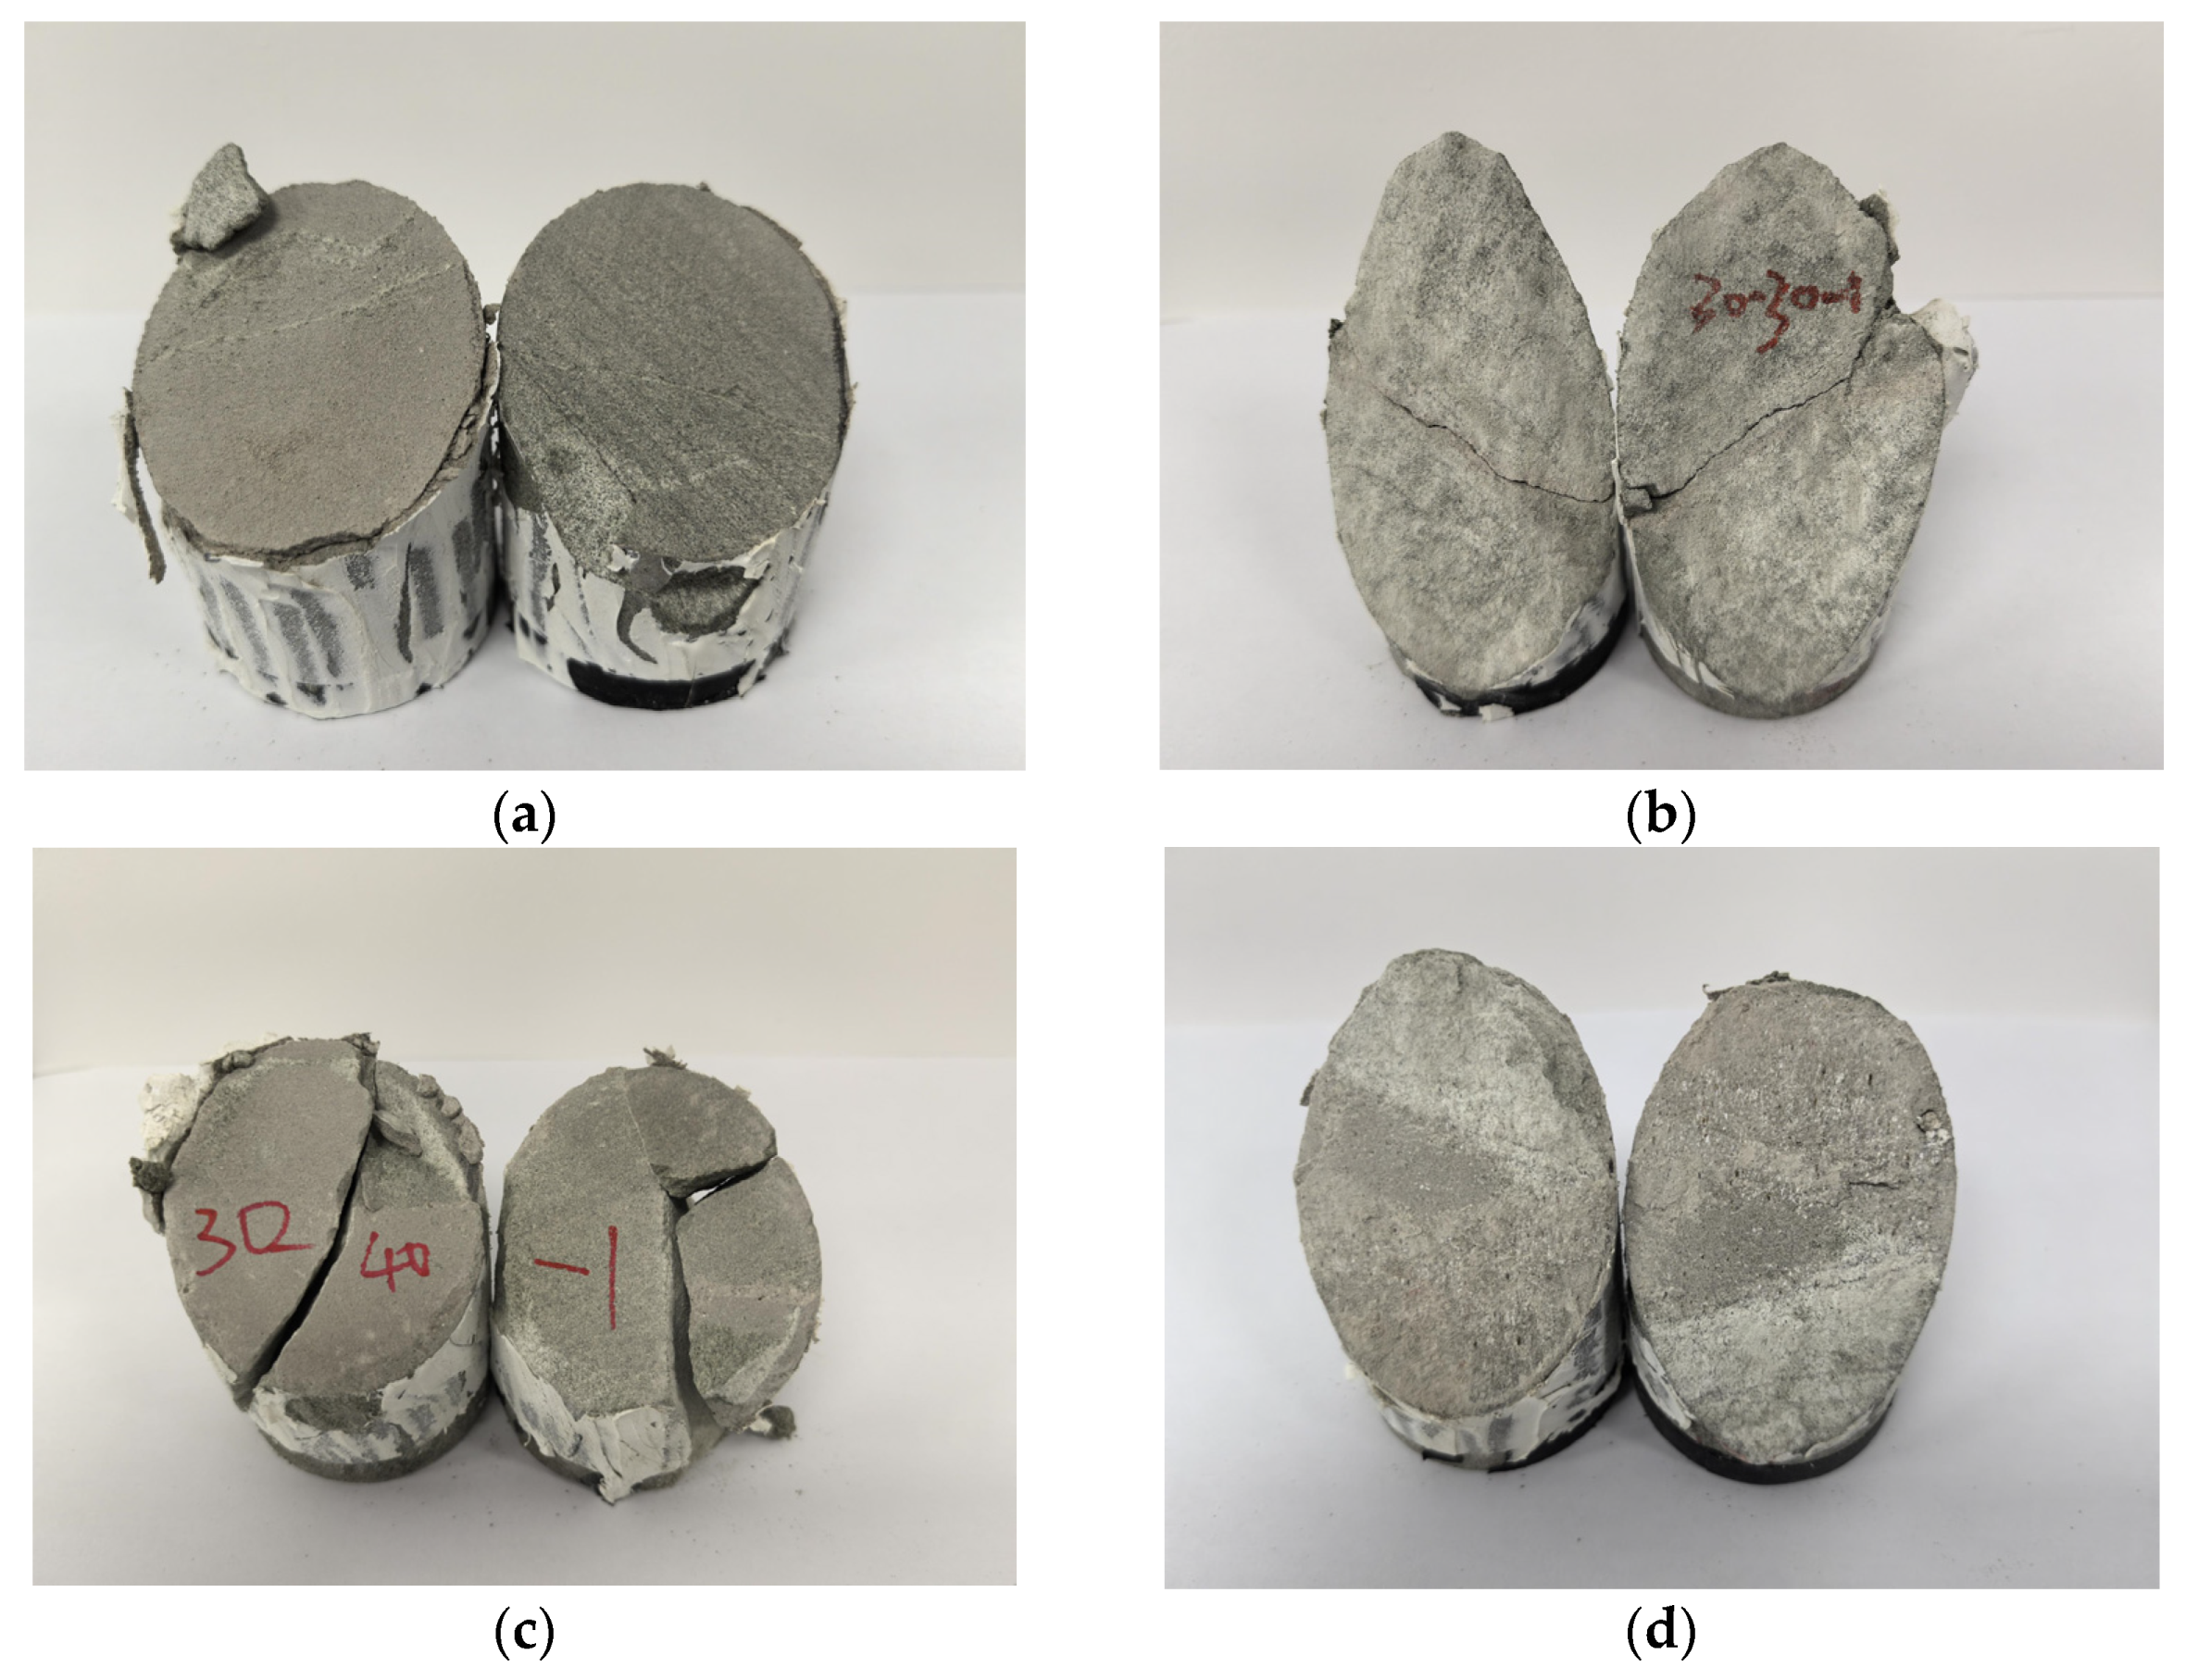
3.1. Failure Characteristic Analysis

The variations in failure strength and the evolution of internal microcracks under distinct fault dip angles and fault gouge compositions manifest in diverse macro-fracture patterns exhibited by fault rocks [24].
At the fault dip angle of 30°, the complexity of the crack penetration network near the fault zone evolves with the strength of the gouge. At lower gouge strengths, such as 20.1 and 30.2 MPa, shear failure predominantly transpires along the contact plane between the gouge and surrounding rock, and it is evident that there is no gouge attached to the fracture section of one panel of bedrock while it is firmly attached to the other panel of bedrock. In the figure presented in this paper, the only gouge exists on the left side of the surrounding rock, but not on the right, resulting in a single macroscopic shear crack on the sample surface, as depicted in Figure 2a. Upon reaching a gouge strength of 42.4 MPa, the sample exhibits not only shear cracks along the primary fracture surface, but also oblique shear cracks, forming an “X”-type conjugate shear failure pattern, with the macroscopic failure intersecting the gouge midpoint, as illustrated in Figure 2b. Advancing to a gouge strength of 51.4 MPa, multiple secondary shear cracks emerge proximate to the primary sample section, accompanied by one or two oblique shear cracks, manifesting in multiple instances of “X”-type conjugate shear failure, as depicted in Figure 2c. The escalation in gouge strength enhances both the shear and compressive resistance of the gouge, augmenting its cementation with the surrounding rock while diminishing the influence of weaker interfaces. Concurrently, a heightened gouge strength elevates the internal stress concentration within the sample, expanding the space for microcrack development and fostering the generation of multiple secondary shear cracks in the vicinity of the primary fracture. This intricate interplay engenders a complex network of cracks within the sample, reflecting the interplay of mechanical properties and failure mechanisms in fault rocks under varying gouge strengths.
At the fault dip angle of 45°, the failure behavior of samples with gouge strengths of 21.1 and 30.2 MPa was similar to that observed at the 30° dip angle, characterized by shear failure predominantly along the gouge–bedrock interface. This results in macroscopic shear cracks visible on the sample surface, indicative of initial failure mechanisms. In contrast, at a gouge strength of 42.4 MPa, a distinct mode of failure emerges where shear failure initiates directly within the central region of the gouge. Notably, there is a reduced occurrence of oblique shear fractures intersecting the main fault section, indicative of a transition away from the “X”-type conjugate shear failure observed at lower strengths. Upon reaching a gouge strength of 51.4 MPa, the failure mode exhibits shear cracks aligned with the fault inclination, accompanied by fewer oblique shear fractures along the fault plane. The characteristic “X”-type conjugate shear failure pattern becomes less pronounced, and secondary shear cracks proximal to the fault diminish in number, as depicted in Figure 2d. For fault samples with a low- and lower-intensity fault gouge, the primary mode of failure is shear failure along the fault plane. Consequently, the fluid leakage mechanism in such faults manifests primarily as leakage along the fault, which diminishes the sealing effectiveness of the fault to some extent. In contrast, for fault samples with a higher- and high-intensity fault gouge, the main modes of failure not only include shear failure along the fault plane but also involve conjugate shear failure that penetrates the fault plane. Therefore, the fluid leakage mechanisms in these types of faults are more complex compared to those in low-intensity fault gouge faults, and their sealing capacity is significantly compromised. In conclusion, while high-intensity fault gouge samples demonstrate characteristics such as elevated failure strength and minimal deformation—indicating a superior sealing capacity prior to failure—their sealing effectiveness post failure is inferior to that of low-intensity fault gouge samples.
The transition in failure modes between 30° and 45° fault dip angles underscores the conversion of axial stress into shear stress along the fault plane with increasing dip angle. This shift intensifies shear failure along the main fault section, influencing fracture characteristics within the samples. Such observations are pivotal for understanding how fault geometry interacts with material properties to govern the mechanical behavior of fault rocks under varying geological conditions.

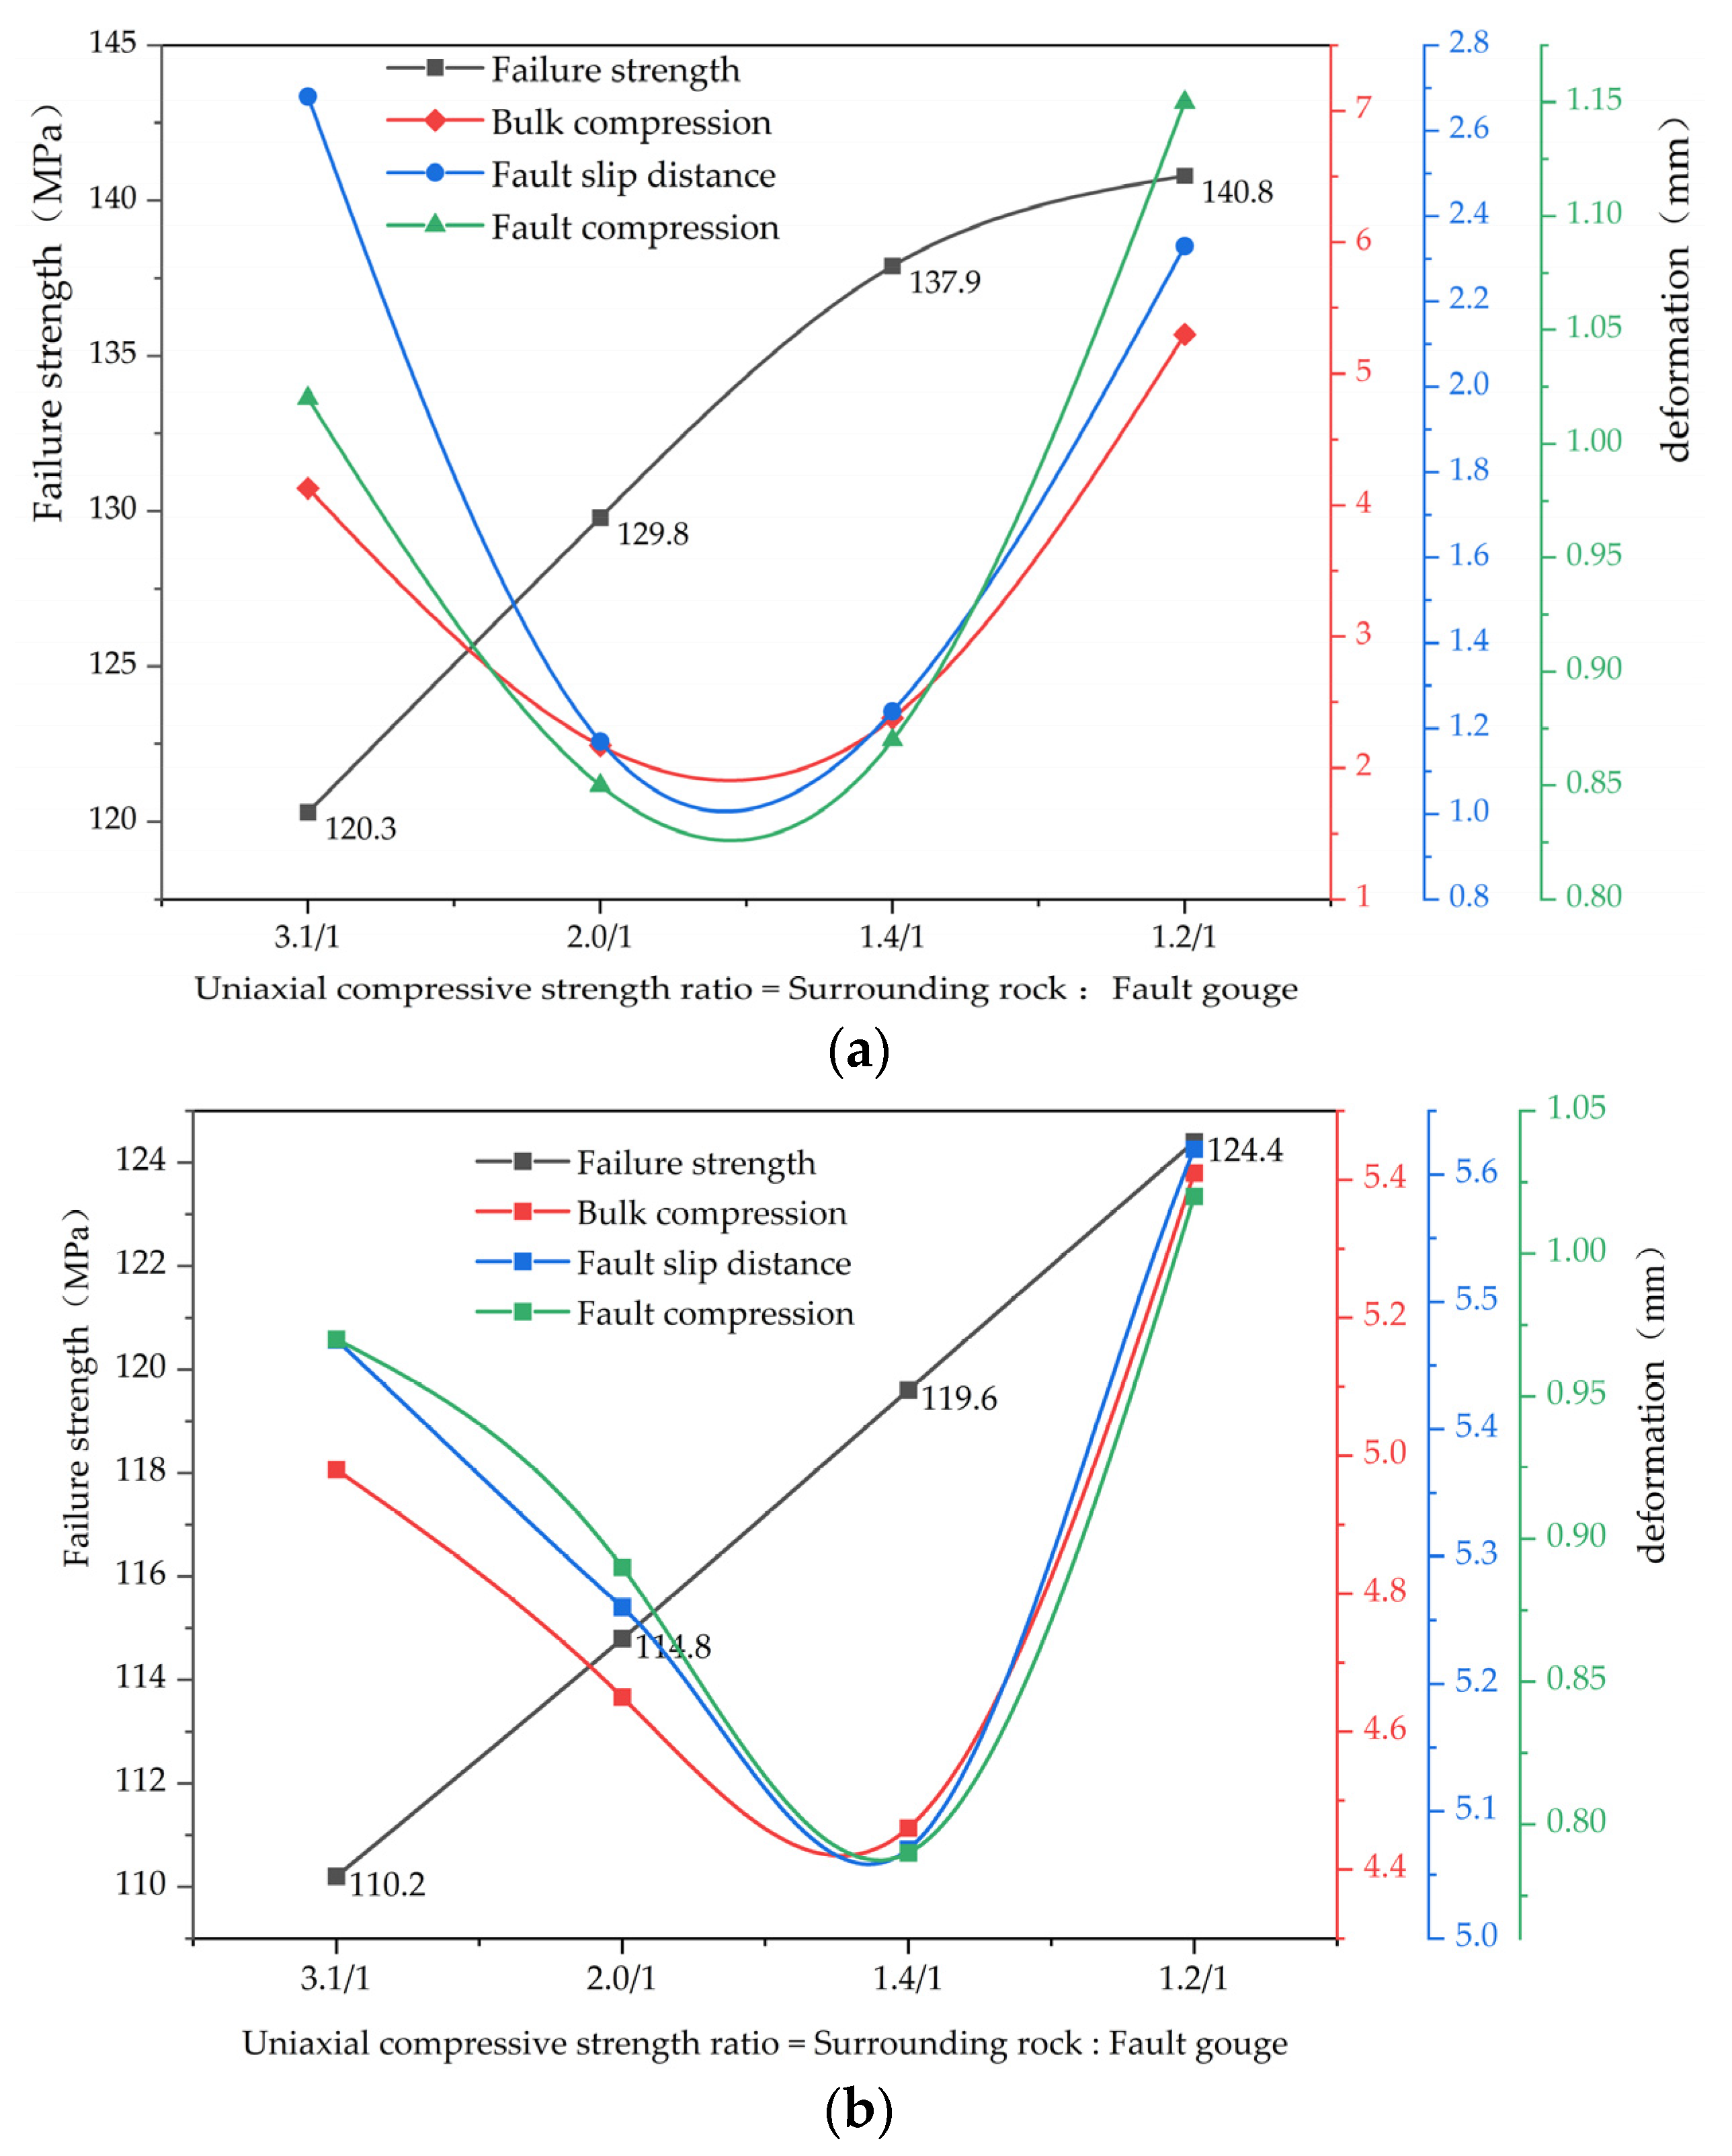
3.2. Analysis of Strength-Deformation Characteristics

The compressive strength and deformation characteristics at failure of the fault samples containing varying strengths of fault gouges at different dip angles are illustrated in Figure 3. This figure depicts the ratio of uniaxial compressive strength between the surrounding rock and fault gouge, where a lower ratio signifies higher strength in the fault gouge material. Observations from this figure reveal that as the strength ratio decreases, the failure strength of the samples consistently increases. Under equivalent strength ratios, the failure strength of 45° dip angle faults is consistently lower compared to those at 30°. Furthermore, the slip displacement of faults at 30° is less than that at 45°, whereas compressive deformation is greater at the latter angle.
This behavior is attributed to the larger normal stress ratio factor in the direction perpendicular to the 30° fault plane compared to the 45° fault, resulting in greater compressive deformation of the intermediate fault gouge section under equivalent stress conditions. Despite the higher compressive deformation, the 30° faults exhibit greater failure strength due to their higher resistance to failure compared to the 45° faults. As the fault dip angle increases, the increment in resolved shear stress along the fault plane alters, facilitating the easier overcoming of frictional resistance. Consequently, the compressive strength of the fault gouge material is not fully realized, necessitating deformation through fault slip to relieve stress. Thus, while the failure strength of 45° fault samples is lower than that of 30° faults, the former consistently exhibit greater slip displacement.
Additionally, experimental observations reveal that the deformation of both 30° and 45° faults initially decreases and subsequently increases as the strength ratio between the bedrock and fault gouge diminishes. The inflection point for deformation in the 30° fault occurs around a strength ratio of 1.7/1, whereas for the 45° fault, it occurs around 1.4/1. This trend is attributed to the insufficient deformation resistance of the fault gouge with lower strength ratios, resulting in significant deformation occurring at a strength ratio of 3.1/1. As the strength of the fault gouge increases, its overall mechanical properties improve, leading to a declining trend in deformation. However, nearing parity with bedrock strength, increased deformation occurs as the sample accumulates energy pre-failure, predominantly released through slip displacement, causing a sudden surge in deformation. Furthermore, aside from shear failure along the fault plane, oblique shear failure across the fault plane also contributes significantly to slip displacement.

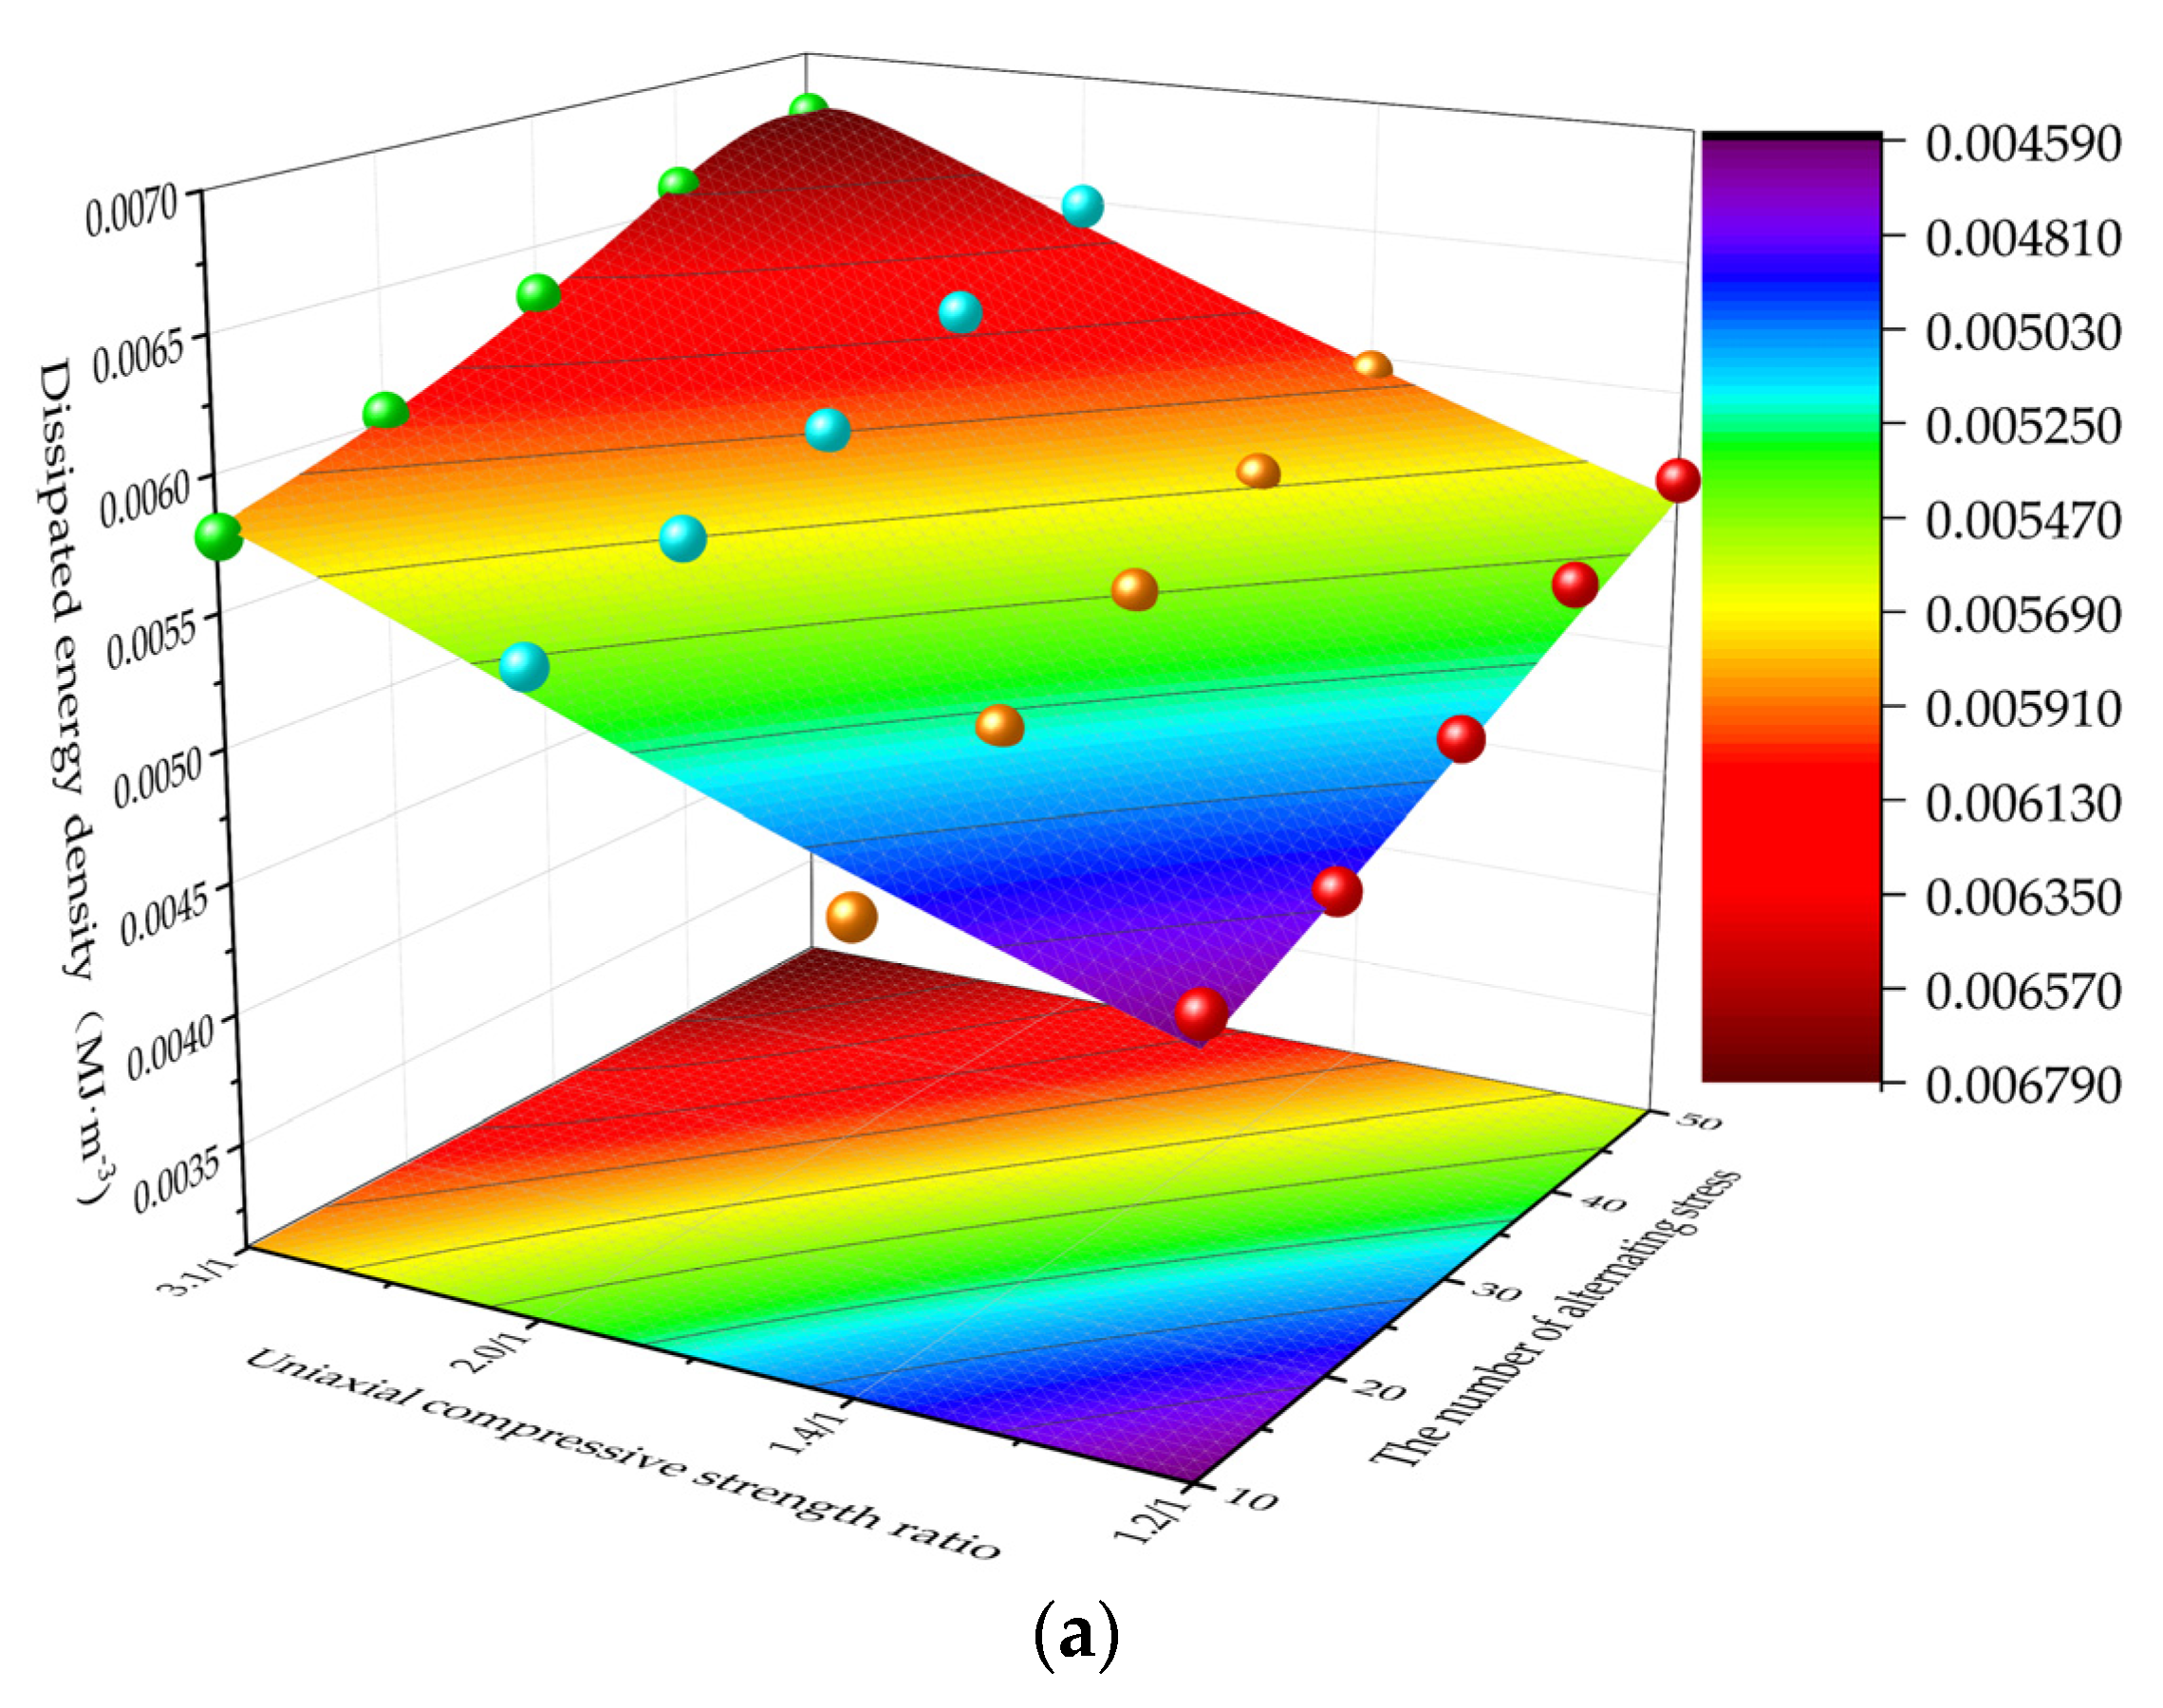
3.3. Fault Damage Analysis

Under the influence of alternating stress, processes within fault specimens such as crack closure, propagation, connectivity, and ultimate failure lead to energy dissipation, rendering the damage irreversible [25]. The calculation of fault-dissipated energy density during alternating processes using energy density methods has been established [26,27,28,29], A three-dimensional visualization of damage data enhances the discernibility of dissipated energy trends, where an elevated dissipated energy density signifies more severe fault damage, as illustrated in Figure 4.
The analysis reveals a negative correlation between fault damage under alternating stress and fault gouge strength, while a positive correlation is observed with fault dip angle. As expounded, a higher fault gouge strength results in an enhanced stability and resistance to damage, thereby reducing the susceptibility to the impact of alternating stress. Conversely, greater fault dip angles increase the propensity for fault slip and shear failure under equivalent stress conditions, amplifying the influence of alternating stress on high-angle faults.
From the analysis above, it is evident that comparing the energy density distributions of fault gouge samples at different angles and strengths does not accurately assess the extent of fault damage and rupture. Therefore, non-dimensional parameters are introduced [30]: R i e is the elastic energy ratio (the proportion of elastic energy in input energy) and R i d is the dissipative energy ratio (the proportion of dissipative energy in input energy); these were used to analyze the distribution law of elastic energy density and dissipative energy density in different stages.
R i e = U i e U i
R i d = U i d U i
where U i is the input energy, U i e is the elastic energy during a particular cycle of alternation, and U i d is the dissipative energy during a particular cycle of alternation.
Figure 5 portrays the temporal evolution of elastic and dissipative energy fractions across fault samples subjected to cyclic loading, considering various dip angles and strength ratios. Throughout 50 loading cycles, elastic energy predominates over dissipative energy, indicating the samples’ primarily elastic response. The dissipative energy fraction for samples with 30° and 45° dip angles exhibits a distinct three-stage evolution: an initial rapid rise, a subsequent plateau, and a late-stage gradual increase.
During the rapid rise phase (cycles 10–20), external energy input consolidates existing microcracks, leading to a significant increase in dissipative energy. Notably, samples with lower strength ratios (indicative of higher fault gouge strength) exhibit a less pronounced compaction due to their enhanced elastic properties, which resist microcrack closure. As loading progresses into the elastic phase (cycles 20–40), high-strength samples maintain a stable dissipative energy fraction, while low-strength samples stabilize, indicating effective microcrack compaction during the initial stages.
In the later stages of cyclic loading, some samples experience new microcrack formation or propagation, resulting in a gradual rise in dissipative energy fractions. This nuanced analysis underscores the complex interplay between microcrack compaction, elastic behavior, and dissipative energy distribution in fault samples under cyclic loading conditions.

3.4. Analysis of Critical Slip Points of Gas Storage Faults under the Alternating Stress

By systematically monitoring fault slip deformation during the loading process and analyzing its temporal progression, the complex behavior can be delineated into distinct phases, initial pore compaction, subsequent elastic deformation, ensuing plastic shear, and eventual shear instability, as elucidated in Figure 6a. Throughout the initial three phases, the fault exhibits negligible slip until reaching a critical shear stress threshold, where significant relative displacement occurs, posing potential gas leakage risks for storage facilities.
Figure 6b,c depict slip curves for faults inclined at 30° and 45°, respectively. Notably, the highest clay strength sample within the 45° fault exhibits a lower shear stress at slip initiation than the lowest strength sample in the 30° fault. Moreover, the variability in shear stress during slip is more pronounced for the 30° fault compared to the 45° fault, underscoring the substantial influence of clay strength on slip behavior in shallow-angle faults, while steep-angle faults consistently pose elevated slip risks. In the context of gas storage facilities, fault slip implies potential natural gas leakage, necessitating rigorous assessment through introduction of the friction coefficient. The maximum static friction coefficient serves as a pivotal parameter in evaluating the fault’s resistance to slip under activation conditions. Statistical analysis of the maximum static friction coefficients for 30° and 45° faults (Figure 6d) reveals that, for faults of equivalent strength, the coefficient is higher for 30° faults than for 45° faults. Specifically, the maximum static friction coefficient for 30° faults escalates with increasing clay strength: 0.436, 0.472, 0.489, 0.532; this contrasts with the range of 0.381 to 0.401 observed for 45° faults. This indicates that 30° faults manifest superior resistance to slip relative to their 45° counterparts, thereby mitigating the risk of natural gas leakage. Furthermore, heightened clay strength correlates positively with increased maximum static friction coefficients, substantiating enhanced resistance to slip and a reduced likelihood of slip occurrence.
In conclusion, through meticulous observation and a rigorous analysis of fault slip dynamics and associated mechanical properties, a comprehensive understanding of potential risks associated with natural gas leakage in critical infrastructure such as gas storage facilities can be attained. This scientific foundation informs robust strategies for risk mitigation and operational safety protocols. Because it is very difficult to obtain the fault core at present, we hope that when the drilling technology makes a breakthrough, the fault core can be taken up for compressive strength tests. Now that we have the inclination of the fault and the strength of the gouge, we can determine when the fault will slip, as well as the impact of the failure on fluid migration and so on.

4. Conclusions and Discussion

This article investigates the influence mechanisms of fault inclination and fault clay strength on the mechanical slip behavior of faults in gas storage facilities through triaxial compression tests under cyclic loading conditions on fault samples with different characteristics (varying angles and strengths of fault clay). Four key conclusions are drawn as follows:
(1)
During fault failure, the strength of fault clay and fault inclination significantly affect the mode and intensity of failure. A higher fault clay strength correlates with increased failure intensity, leading to a more extensive crack propagation upon fault failure, a gradual convergence of the failure location towards the fault core from the periphery, and the development of shear cracks oblique to the fault plane. As fault inclination increases, the failure intensity tends to decrease, resulting in reduced sample damage.
(2)
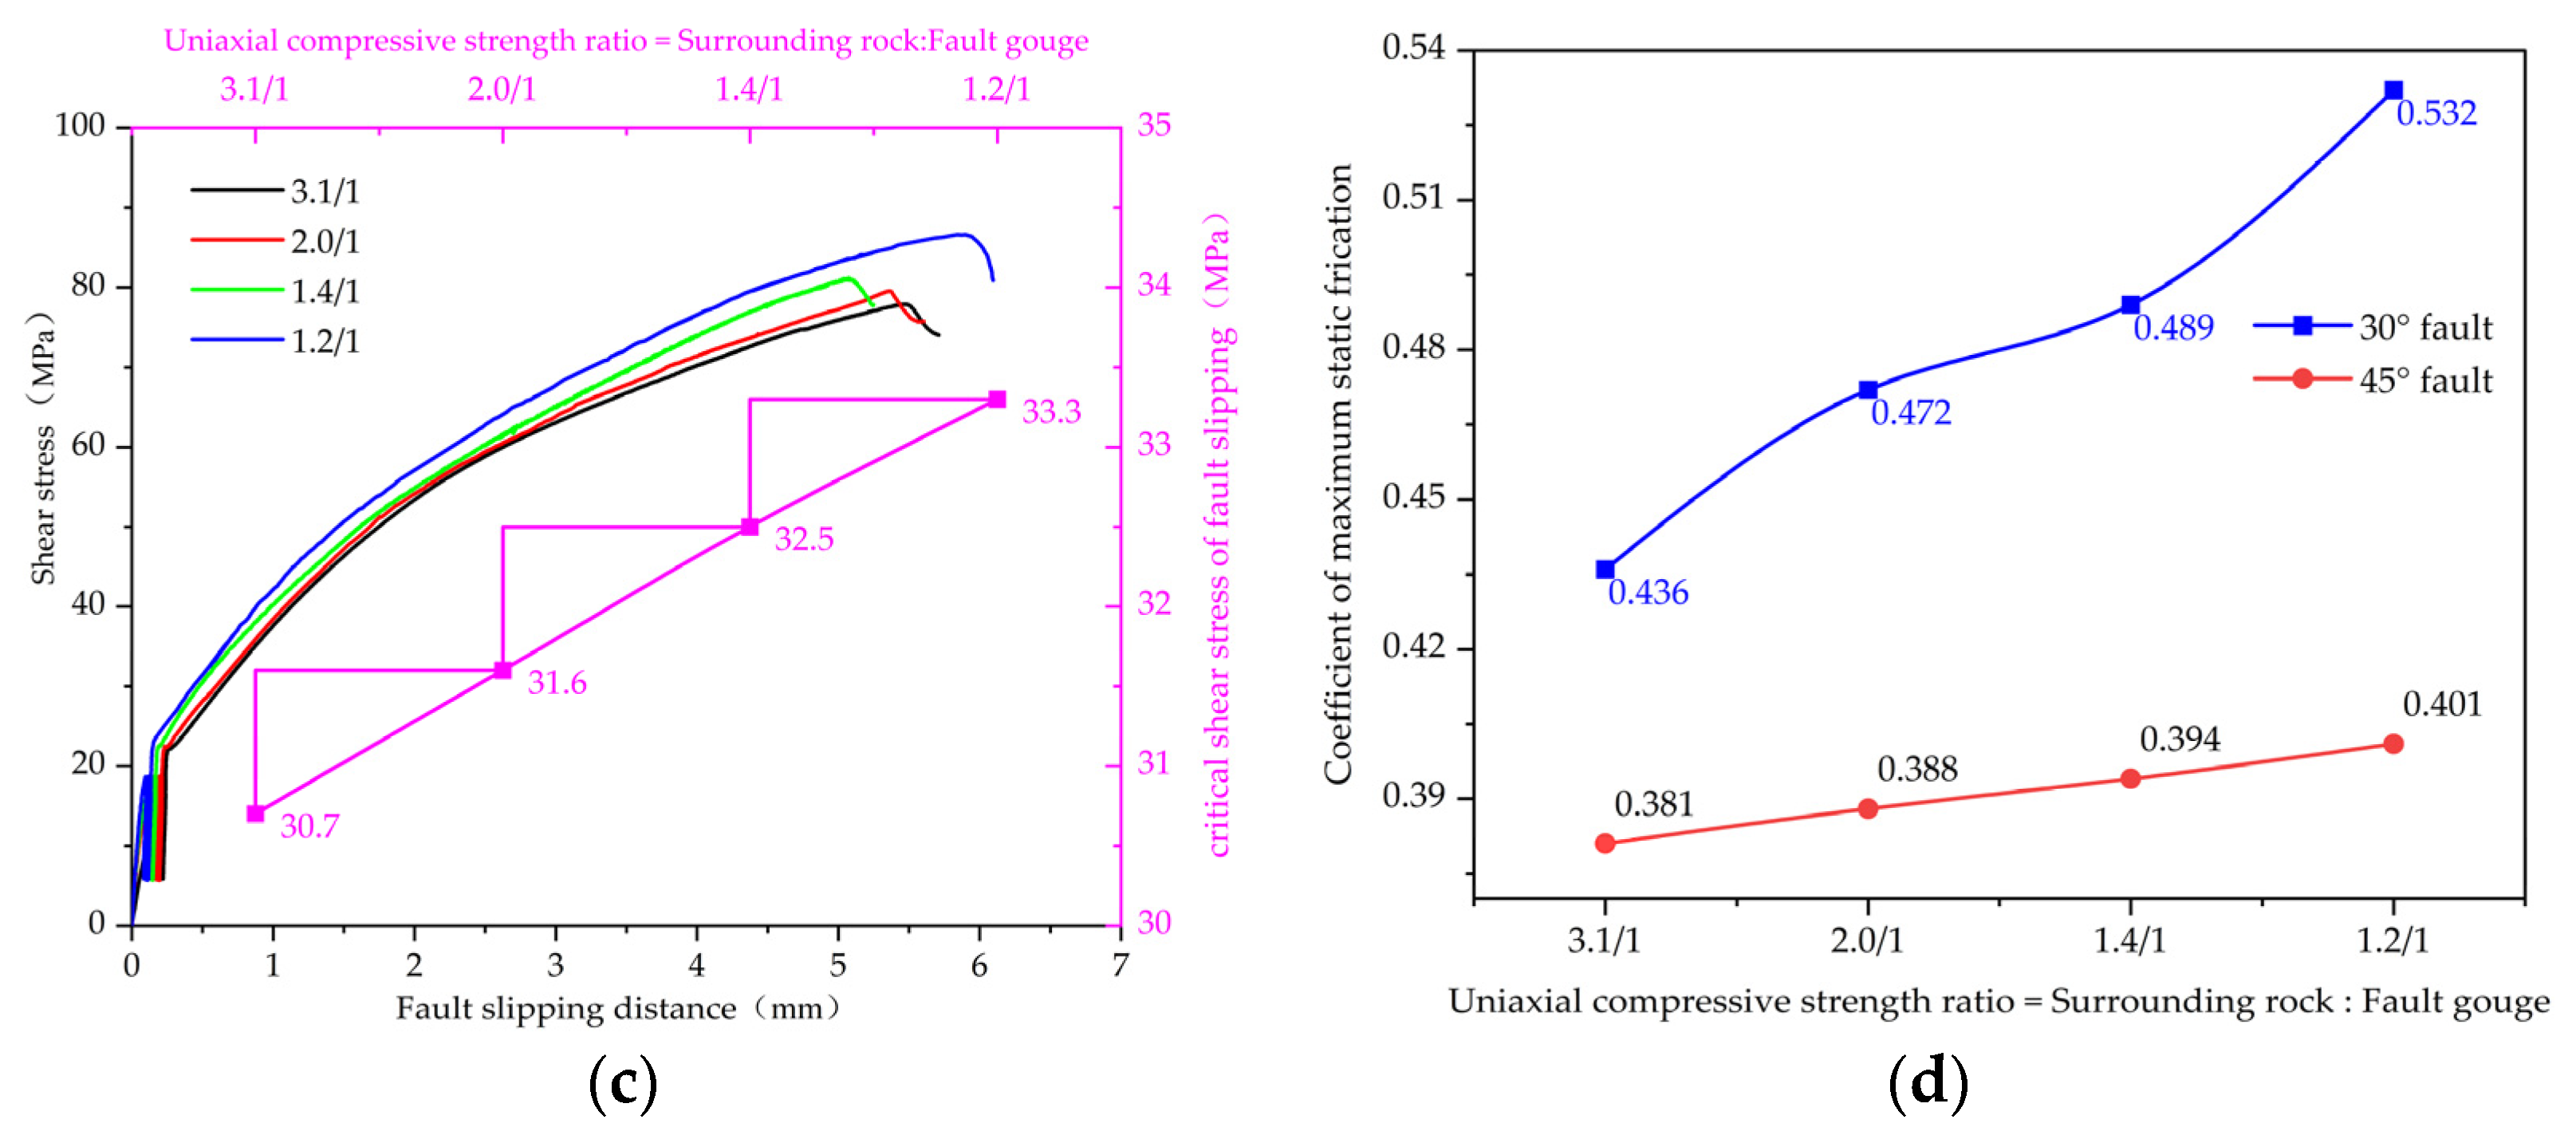
With increasing fault clay strength, the overall compression, fault slip, and fault compression of fault samples exhibit a trend of an initial decrease followed by an increase. The inflection point for 30° faults occurs at a ratio of around 1.7/1 between rock strength and fault clay strength, while for 45° faults, the inflection point is near 1.2/1.
(3)
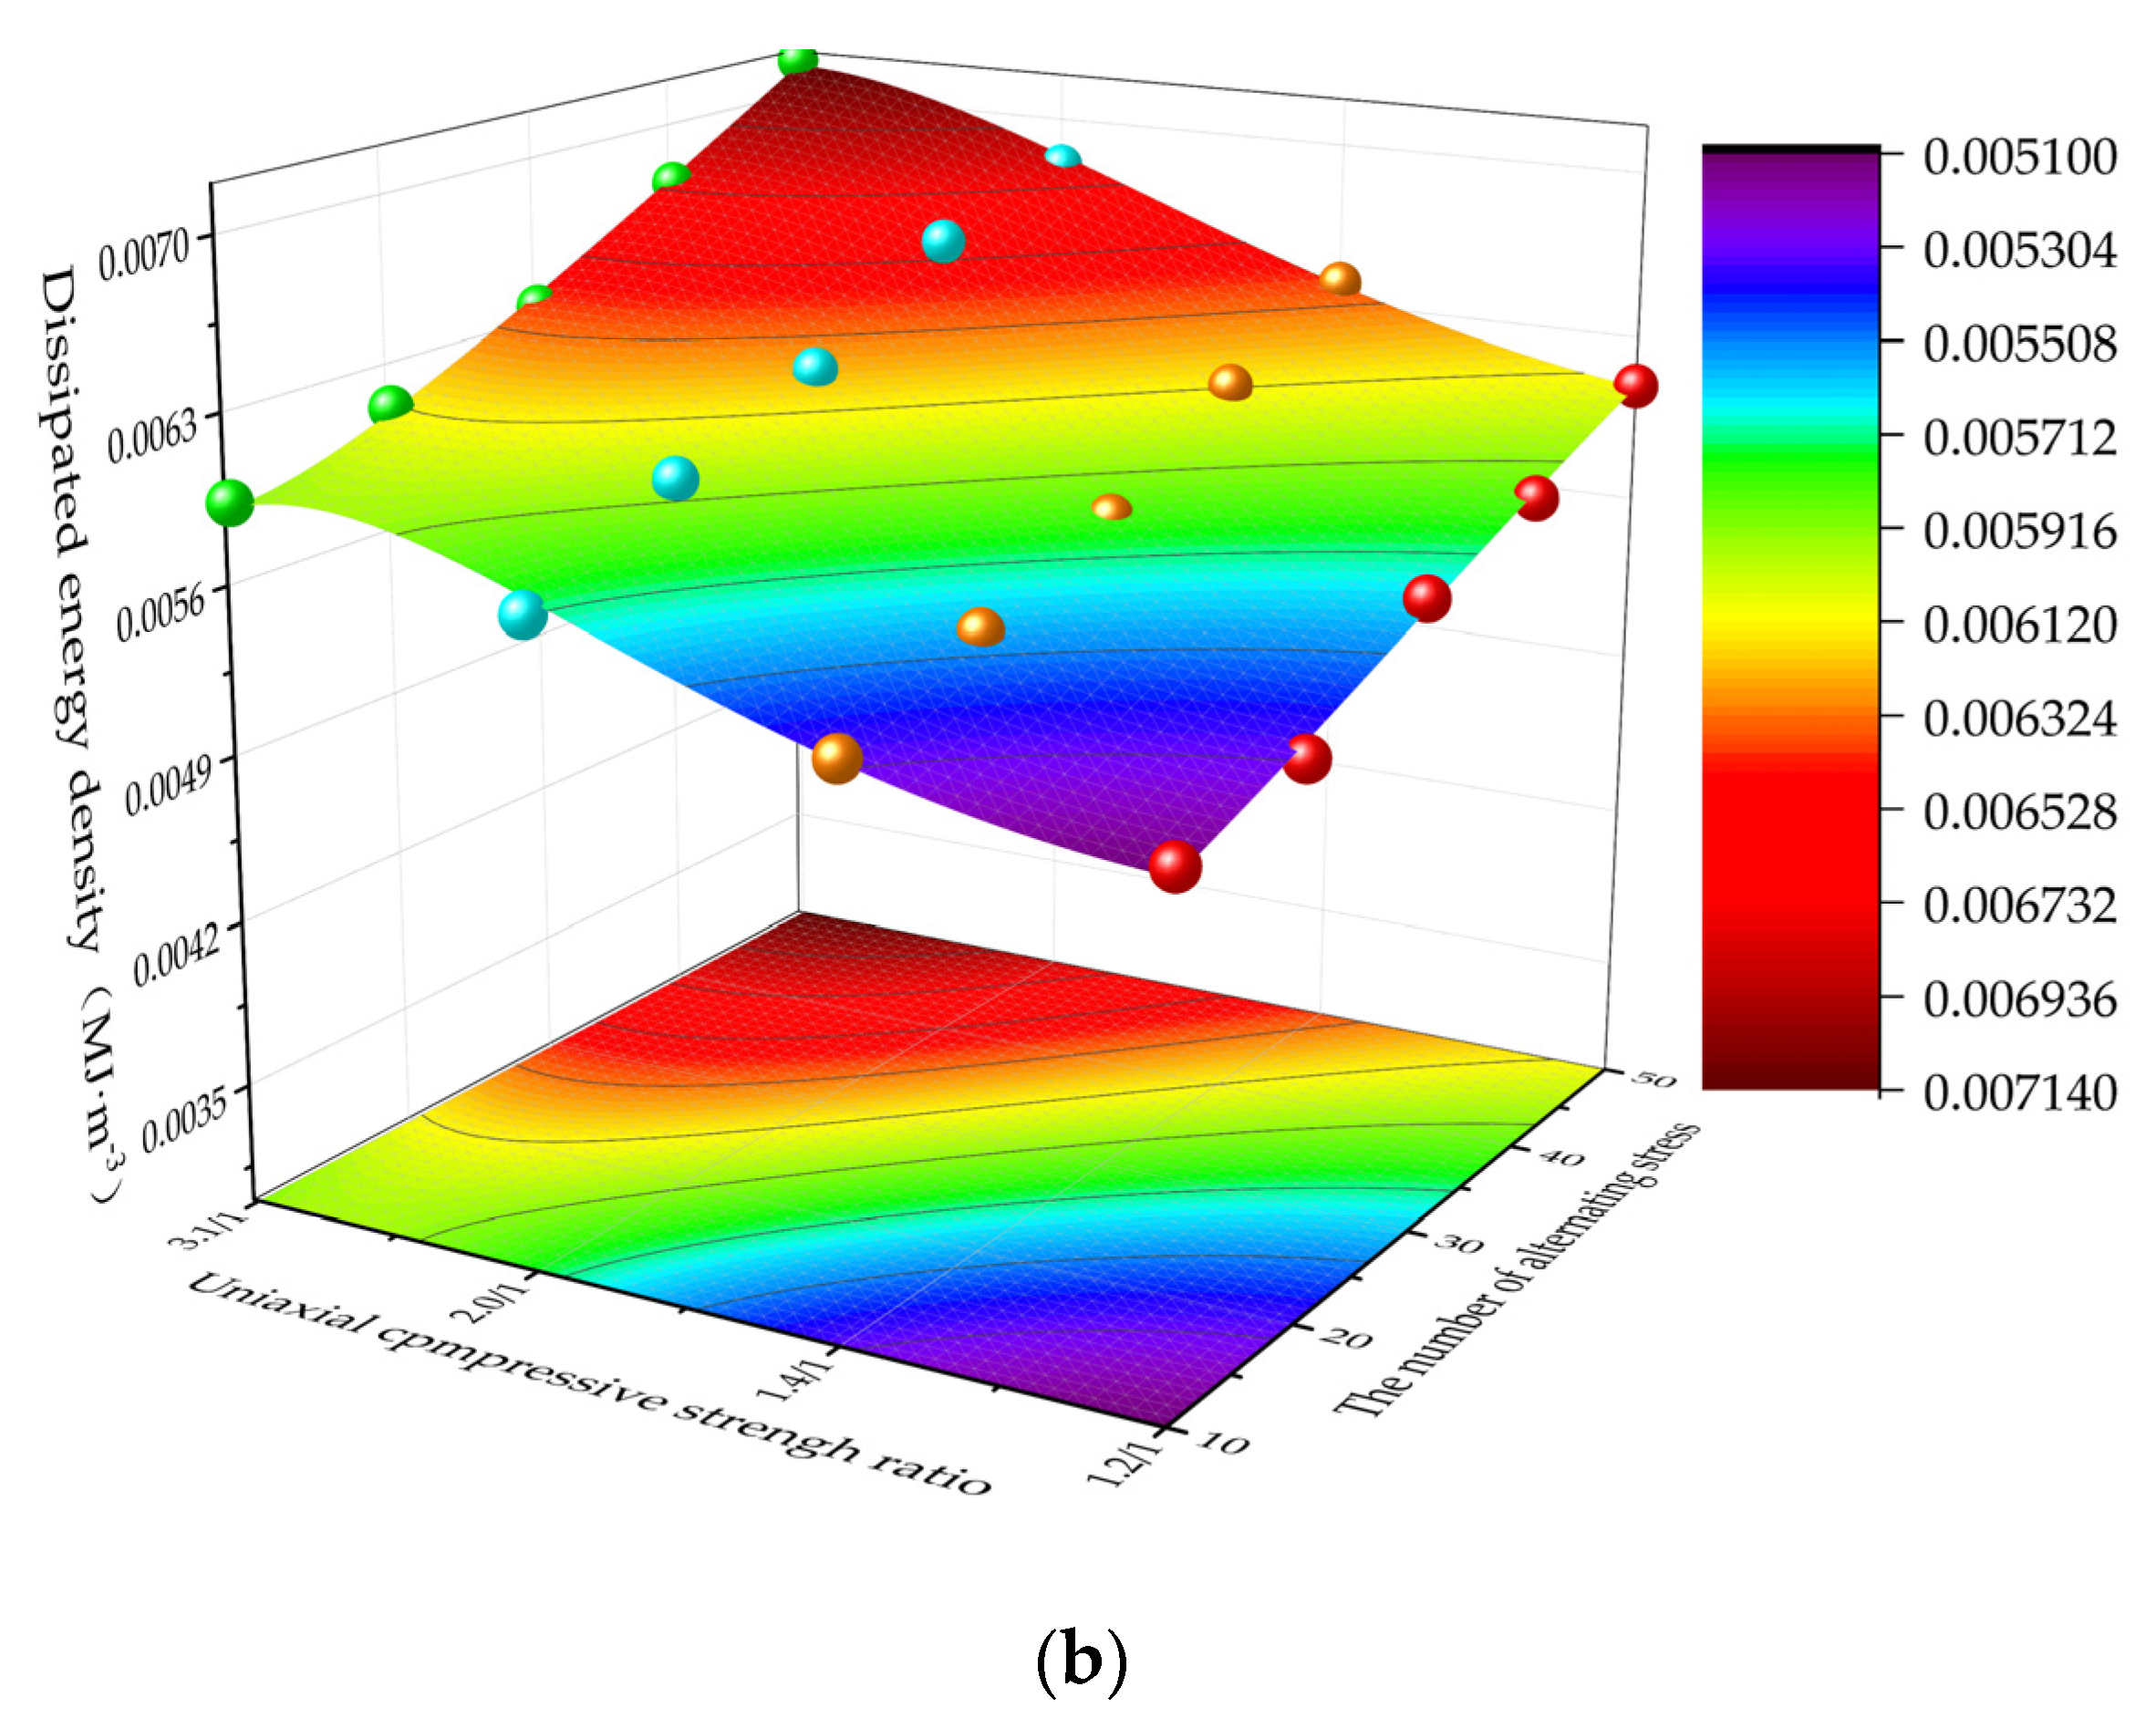
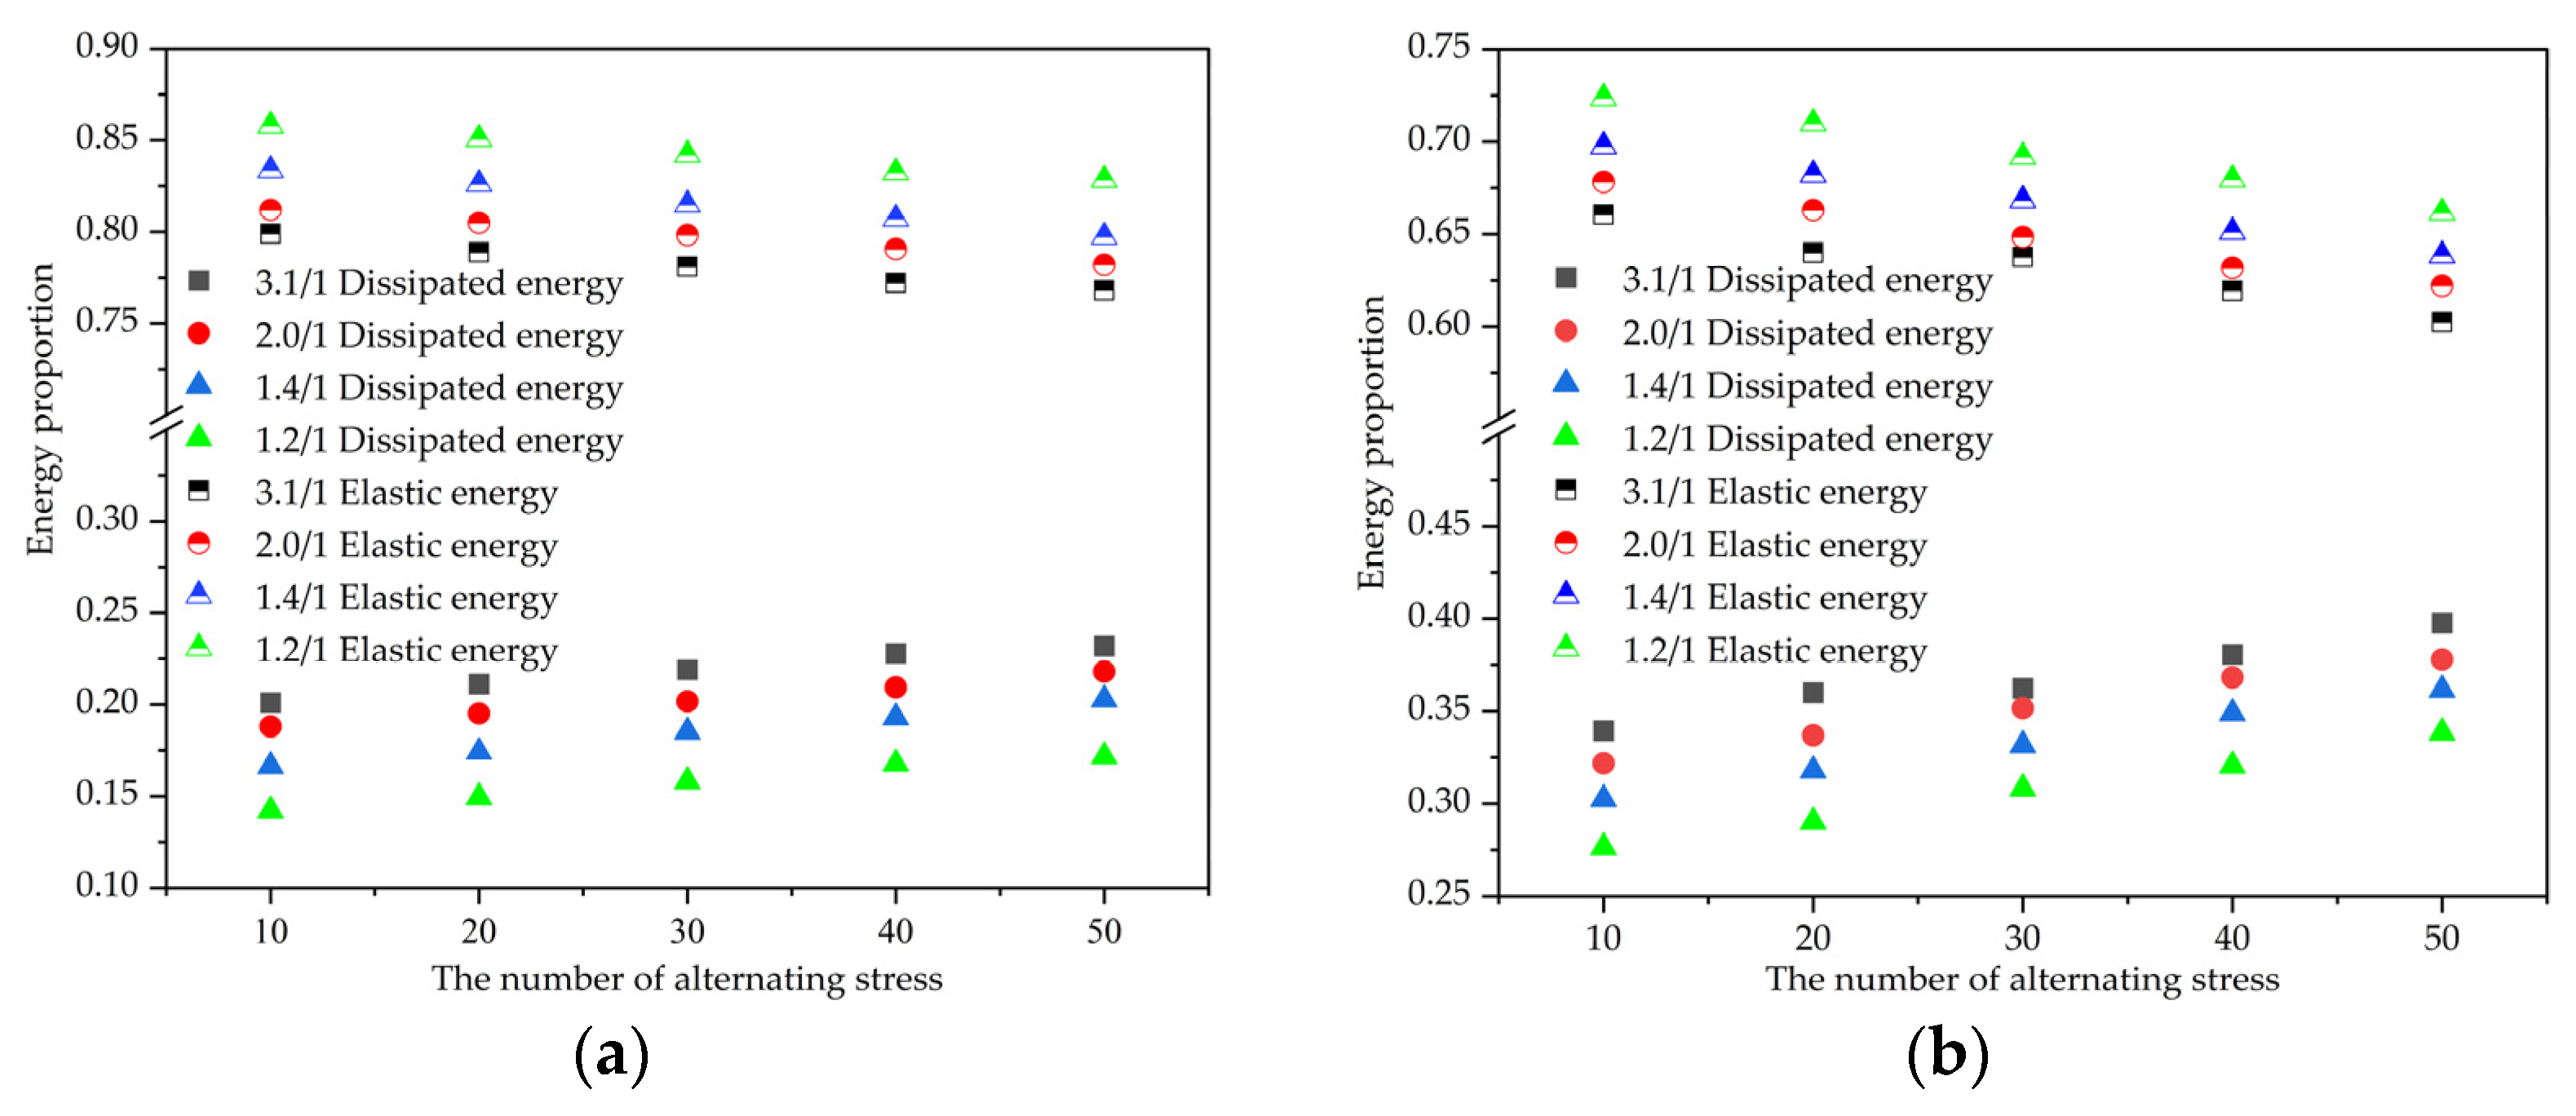
Fault clay strength plays a decisive role in the damage to faults under cyclic loading conditions. A higher fault strength leads to lower dissipated energy and higher elastic energy proportions at the same number of loading cycles. Furthermore, for the same number of loading cycles and fault clay, a greater fault inclination results in more severe fault damage.
(4)
The maximum static friction coefficient represents the fault’s resistance to slip. Overall, the static friction coefficient of 30° faults is higher than that of 45° faults. The static friction coefficient of 30° faults demonstrates nonlinear growth with increasing fault clay strength, while that of 45° faults shows nearly linear growth.

Author Contributions

Conceptualization, S.C. and Z.W.; methodology, X.Q.; validation, H.X., G.D., and B.L.; formal analysis, S.C.; investigation, S.C.; data curation, Z.W.; writing—original draft preparation, S.C.; writing—review and editing, H.X.; supervision, G.D. All authors have read and agreed to the published version of the manuscript.

Funding

The authors declare that this study received funding from the Scientific research and technology development project of China National Petroleum Corporation Limited (Number: 2022DJ8304) and the Scientific research and technology development project of Research Institute of Science and Technology of China Petroleum Corporation (Number: 2023YCQ01) from Petro China Co. Ltd.

Data Availability Statement

The data that support the findings of this study are available from the corresponding author upon reasonable request.

Acknowledgments

The authors acknowledge the technical support provided by the Research Institute of Petroleum Exploration & Development, and the experimental help of testers in CNPC Key Laboratory of Oil & Gas Underground Storage Engineering.

Conflicts of Interest

Authors Songlin Cheng, Guosheng Ding, Zhide Wu, Xiaosong Qiu, Haitao Xu and Bingbing Liu were employed by the China National Petroleum Corporation. The authors declare that this research was conducted in the absence of any commercial or financial relationships that could be construed as a potential conflict of interest. The funder was not involved in the study design, collection, analysis, interpretation of data, the writing of this article, or the decision to submit it for publication.

References

  1. Ding, G.; Wang, Y.; Wanyan, Q.; Wang, J.; Xu, H.; Li, K.; Xia, Y.; Li, L.; Zeng, D.; Liu, Z. Construction difficulties and research directions of various complex UGSs. Nat. Gas Ind. 2023, 43, 14–23. [Google Scholar]
  2. Ma, X.; Zheng, D.; Ding, G.; Wang, J. “Extreme utilization” theory and practice in gas storageswith complex geological conditions. Pet. Explor. Dev. 2023, 50, 373–383. [Google Scholar] [CrossRef]
  3. Guo, S.; Li, Y.; Zhang, Y.; Xu, S.; Zheng, D.; Ren, J.; Bu, Y.; Pang, X. The excellent adaptability to large temperature differences of alkali-activated slag using Na2SO4+ Ca(OH)2 as the activator. Constr. Build. Mater. 2024, 431, 136514. [Google Scholar] [CrossRef]
  4. Wang, C.; Gao, G.; Jia, J.; Chang, C.; Wu, Z. Variation of stress field and fault slip tendency induced byinjection and production in the H underground gas storage. Nat. Gas Ind. 2020, 40, 76–85. [Google Scholar]
  5. Ke, W.; Zeng, H.; Wang, Z.; Yu, H.; Liu, Y.; Zheng, D.; Zhu, J.; Zhu, H. A Numerical Study on Labyrinth Screw Pump (LSP) Performance under Viscous Fluid Flow. Energies 2023, 16, 5997. [Google Scholar] [CrossRef]
  6. Caine, J.S.; Evans, J.P.; Forster, C.B. Fault zone architecture and permeability structure. Geology 1996, 24, 1025–1028. [Google Scholar] [CrossRef]
  7. Cello, G.; Tondi, E.; Micarelli, L.; Invernizzi, C. Fault zone fabrics and geofluid properties as indicators of rock deformation modes. J. Geodyn. 2001, 32, 543–565. [Google Scholar] [CrossRef]
  8. Brogi, A. Fault zone architecture and permeability features in siliceous sedimentary rocks: Insights from the Rapolano geothermal area (Northern Apennines, Italy). J. Struct. Geol. 2008, 30, 237–256. [Google Scholar] [CrossRef]
  9. Zhang, X.; Sun, Z.; Zhao, J.; Pan, Y.; Wu, M. Study on the Influence of Strike-slip Fault Displacement on Reservoir in Northern Slope, Tazhong Area. Geoscience 2014, 28, 1017–1022. [Google Scholar]
  10. Zheng, H.; Hu, Z.; Yun, L.; Lin, H.; Deng, S.; Jia, H.; Pu, Y. Strike-slip faults in marine cratonic basins in China:Development characteristics and controls on hydrocarbon accumulation. Earth Sci. Front. 2022, 29, 224–238. [Google Scholar]
  11. Wu, M.; Liu, Y.; Peng, P.; Chai, X.; Yan, N. Characteristics of strike-slip faults in Lunnan buried hill and its influence on hydrocarbon accumulation. Fault Block Oil Gas Field 2021, 28, 456–462. [Google Scholar]
  12. Peng, C.; Xiao, Y.; Fu, J.; Cao, Q.; Zhang, J.; Su, Y.; Zhang, H.; Wan, X.; Zheng, D. Numerical validation of a novel cuttings bed impeller for extended reach horizontal wells. Pet. Res. 2024; in press. [Google Scholar] [CrossRef]
  13. Wu, Y.; Sun, C.; Wang, D.; Jiang, T.; Huang, Y.; Gong, J. Hydrocarbon distribution characteristics and main controlling factors of accumulation in South Konys Oilfield in South Turgay Basin, Kazakhstan. Nat. Gas Geosci. 2016, 27, 2013–2022. [Google Scholar]
  14. Lan, X.; Lv, X.; Zhu, Y.; Li, S.; Xie, E. Hydrocarbon accumulation pattern jointly controlled by strike-slip faults and cap rocks:a case from Yingshan Formation in ZG-51 wellblock of eastern Tazhong area, Tarim Basin. Oil Gas Geol. 2014, 35, 107–115. [Google Scholar]
  15. Jia, X. Numerical simulation of the effect of fault inclination on faultactivation and water inrush from floor. Coal Eng. 2017, 49, 90–93. [Google Scholar]
  16. Piao, W.; Mao, X. Research on effect of fault dip on fault activation andwater inrush of coal floor. Chin. J. Rock Mech. Eng. 2009, 28, 386–394. [Google Scholar]
  17. Li, Z.; Zhou, M.; Huang, H.; Tong, Y.; Zhang, W. Mechanical and constitutive characterization of gouge considering cementation. J. Basic Sci. Eng. 2024; in press. [Google Scholar]
  18. Ma, Z.; Zeng, J.; Zhao, L.; Wu, Y.; Xu, X.; Li, D. Experimental simulation for the influence of fault property and dip angle on petroleum migration and accumulation in Jiyang Depression. Lithol. Reserv. 2008, 20, 109–113. [Google Scholar]
  19. Jia, B.; Li, B.; Zhou, L.; Chen, H. Experimental study on the influence of fault dip angle on acoustic emission sinalpropagation. Coal Sci. Technol. 2024; in press. [Google Scholar]
  20. Li, C.; Yu, W.; Ding, J. Quantitative evaluation of fault sealing by Weighted Shale Gouge Ratio(WSGR): A case study of Yongan area in Gaoyou Sag, Subei Basin. Pet. Geol. Expr. 2024, 46, 158–165. [Google Scholar]
  21. Xie, L.; Liu, H.; Ban, S.; Mao, H.; Xia, D.; Song, Y.; Tong, R.; Ying, Q. Experimental study on shear properties of fault gouge withdifferent mineral compositions. Rock Soil Mech. 2023, 44, 2545–2554. [Google Scholar] [CrossRef]
  22. Zhang, J. Study on causes and preventive measures of coring and plugging in complex formation. China Mine Eng. 2021, 50, 52–55. [Google Scholar] [CrossRef]
  23. Li, X.; Li, K.; Liang, J.; Yin, H.; Wang, Z.; Sun, J.; Zhang, Y. Analysis of core-blocking causes in complex formation core drilling and its preventive measures. Explor. Eng. (Rock Soil Drill. Tunn.) 2018, 45, 12–15. [Google Scholar]
  24. He, X.P.; Sinan, M.; Kwak, H.; Hoteit, H. A corrected cubic law for single-phase laminar flow through rough-walled fractures. Adv. Water Resour. 2021, 154, 103–984. [Google Scholar] [CrossRef]
  25. Chen, X.; Xiao, Y.; Tang, M.; Jiao, T.; Zhang, F. Experimental study on deformation, permeability and AE characteristics ofsandstone under multi-stage cyclic loading with a constant amplitude. Chin. J. Rock Mech. Eng. 2024, in press. [CrossRef]
  26. Duyi, Y.; Zhenlin, W. A new approach to low-cycle fatigue damage based on exhaustion of static toughness and dissipation of cyclic plastic strain energy during fatigue. Int. J. Fatigue 2001, 23, 679–687. [Google Scholar] [CrossRef]
  27. Xiao, J.-Q.; Ding, D.-X.; Jiang, F.-L.; Xu, G. Fatigue damage variable and evolution of rock subjected to cyclic loading. Int. J. Rock Mech. Min. Sci. 2009, 47, 461–468. [Google Scholar] [CrossRef]
  28. Zhou, H.; Hou, W.; Zhang, L.; Xie, S.; Jia, W.; Shi, B. Constitutive model of coal considering temperature under cyclic loading andunloading conditions. J. China Coal Soc. 2024, 49, 442–453. [Google Scholar] [CrossRef]
  29. Li, X.; Yao, Z.; Huang, X.; Liu, Z.; Zhao, X.; Mu, K. Investigation of deformation and failure characteristics and energy evolution ofsandstone under cyclic loading and unloading. Rock Soil Mech. 2021, 42, 1693–1704. [Google Scholar] [CrossRef]
  30. Yang, L.; Gao, F.; Wang, X.; Li, J. Energy evolution law and failure mechanism of coal-rockcombined specimen. J. China Coal Soc. 2019, 44, 3894–3902. [Google Scholar] [CrossRef]
Figure 1. Sample preparation and test process: (a) rock cut dimension; (b) sample preparation process; (c) sensor installation; (d) alternating process.
Processes 12 01869 g001
Figure 2. The illustration of fault sample failure: (a) the failure diagram of low-strength (30.2 MPa) fault gouge samples at a 30° fault dip angle.; (b) the failure diagram of higher-strength (42.4 MPa) fault gouge samples at a 30° fault dip angle.; (c) the failure diagram of high-strength (51.4 MPa) fault gouge samples at a 30° fault dip angle; (d) the failure diagram of high-strength fault gouge samples at a 45° fault dip angle.
Processes 12 01869 g002
Figure 3. Illustration of fault failure strength–deformation characteristics: (a) 30° fault failure strength and deformation characteristics; (b) 45° fault failure strength and deformation characteristics.
Processes 12 01869 g003
Figure 4. The distribution of dissipated energy density for different fault samples during alternating processes: (a) the dissipated energy density distribution of a 30° fault; (b) the dissipated energy density distribution of a 45° fault.
Processes 12 01869 g004aProcesses 12 01869 g004b
Figure 5. The trend of changes in the proportion of elastic energy and dissipative energy during cyclic loading and unloading interruptions: (a) 30° fault; (b) 45° fault.
Processes 12 01869 g005
Figure 6. Fault slip characteristic analysis: (a) fault slip stage division; (b) slip curves of different fault gouge samples at a 30° fault dip angle; (c) slip curves of different fault gouge samples at a 45° fault dip angle; (d) maximum static friction curves of fault gouge samples from different faults.
Processes 12 01869 g006aProcesses 12 01869 g006b
Table 1. Table of basic parameters of materials.
Lithologic CategoryModulus of Elasticity (GPa)Poisson’s RatioUniaxial Compressive Strength (MPa)Cohesive Force (MPa)Angle of Internal Friction (°)Density (kg · m−3)
Fault gouge3.690.1220.13.02301959.31
4.870.1230.28.14311962.68
5.500.1142.48.56361969.72
5.730.1051.48.99411956.73
Surrounding rock6.850.3162.510.81452263.12
Disclaimer/Publisher’s Note: The statements, opinions and data contained in all publications are solely those of the individual author(s) and contributor(s) and not of MDPI and/or the editor(s). MDPI and/or the editor(s) disclaim responsibility for any injury to people or property resulting from any ideas, methods, instructions or products referred to in the content.

