Abstract
Identifying and categorizing drilling-induced fractures is pivotal for understanding the mechanisms underlying wellbore instability, drilling fluid loss, and assessing reservoirs using imaging logging data. This study employs a linear elastic stress model around the wellbore, coupled with a tensile failure criterion, to establish a predictive framework for the orientation of drilling-induced fractures. It investigates how engineering parameters like wellbore trajectory and bottomhole pressure influence the distribution of principal stresses around the wellbore, as well as the angle and orientation of drilling-induced fractures relative to the wellbore axis, across various faulting scenarios. The results indicate that drilling-induced fractures exhibit structured arrangements and consistent patterns, often appearing at approximately 180° symmetric intervals and descending in similar orientations. This provides a theoretical basis for their systematic identification and classification. Under different stress conditions, these fractures can manifest as feather-like shapes, “J”-shaped, or transitional states between feather-like and “J”-shaped orientations, as well as “V”-shaped or “M”-shaped orientations. Accurate detection and classification of these fractures are essential for interpreting effective fractures, conducting thorough reservoir evaluations, and predicting appropriate drilling fluid densities to mitigate the wellbore failure risk. Moreover, this knowledge aids in effectively determining the magnitude and direction of in situ stress inversion.
1. Introduction
Wellbore instability has been a crucial focus of scientific efforts, with extensive research conducted on the collapse, fracturing, and reinforcement of wellbores. Significant achievements have been made in this regard. For instance, Rahimi et al. [1] conducted hydraulic tests on cement paste to study the influence of adding lost circulation materials on increasing the fracture initiation pressure and fracture reopening pressure. The authors compared five crack width models estimated by Morita, Fuh [2], Wang et al. [3], Hillerborg et al. [4], Alberty and McLean [5], and Carbonell and Detournay [6], respectively, with the experimental results of pressure plugging tests. They found that the model proposed by Carbonell and Detournay [6] best matched the experimental results. Zhang and Yin [7] statistically analyzed the leakage pressures of hundreds of wells and found that, for salt rock formations, the fracture pressure exhibited a linear relationship with overlying rock pressure. However, in non-salt rock formations, the Eaton method underestimates the fracture pressure gradient. Aadnøy and Belayneh [8] found that the linear elastic wellbore fracturing model underestimated the formation fracture pressure, and the results also predicted that the wellbore fracturing pressure, considering the shielding effect of drilling fluid particle size distribution on crack propagation, matched the experimental test results more closely.
While these studies have predominantly focused on predicting formation fracture pressures, the process of formation leakage involves the initiation and propagation of formation fractures under excessive liquid column pressure, and natural fractures or pre-existing fractures in subsurface rocks may serve as pathways for well leakage [9,10,11,12]. However, there have been few reports on predicting the initiation positions and morphological characteristics of drilling-induced fractures (DIFs) around the wellbore [13,14,15]. Understanding the generation mechanism and propagation characteristics of DIFs can assist in inferring the stress inversion, determining the optimal drilling fluid density window, and optimizing the particle size distribution of plugging materials [16,17].
DIFs are fractures generated promptly under the combined effects of in situ stress and engineering disturbances [18,19,20]. They are characterized by regular arrangement and strong regularity, and are closely related to in situ stress. In contrast, natural fractures often result from multiple tectonic movements and are subsequently modified by groundwater dissolution and precipitation, resulting in highly irregular distributions [21,22,23,24,25]. Natural fractures are often affected by dissolution and folding, leading to irregular fracture surfaces and significant variations in fracture width [26,27,28,29,30]. In contrast, DIFs exhibit relatively regular sealing shapes and minimal variations in width with limited radial extension. Therefore, careful identification and differentiation of various image features are necessary for accurate interpretation [31,32,33,34,35]. In many cases, the identification of DIFs from natural fractures is based on the collective shape of the fractures, the presence of certain characteristic surfaces, and the occurrence of mineralization [36,37,38]. In imaging logging and core analysis, DIFs appear as closely spaced delayed lines, curves, and downward-diffusing forms, sharing the same trend [39,40,41,42]. These DIFs extend at least three times the diameter of the wellbore on both sides and significantly increase the permeability compared to scenarios without these fractures [43,44,45,46]. Although the effect of DIFs on fluid production is short-term, their extension and enlargement can eventually have positive effects [47,48,49,50]. The accurate detection and identification of DIFs are crucial for effective reservoir management, wellbore design, and accurate interpretation of fractures and reservoir evaluation [51,52,53,54,55,56,57]. Therefore, this study establishes a predictive model for drilling-induced fractures around the wellbore, investigates the influence of engineering parameters, such as wellbore trajectory and internal liquid column pressure, on the characteristics of drilling-induced fractures under different stress conditions, and provides quantitative parameters for evaluating the effectiveness of drilling fluid leakage prevention and plugging.
2. Induced Fractures Prediction Model
Drilling-induced fractures (DIFs) around the wellbore refer to fractures formed in the vicinity of the wellbore during the drilling process due to changes in stress [53]. Unlike natural fractures, DIFs are generated by engineering disturbances; hence, they follow certain patterns and can be predicted under different operating conditions by establishing models to predict their morphology [54]. To predict the characteristics of the DIFs around the wellbore, it is essential to first establish a model of the stress distribution on the wellbore wall. During drilling, as the rock is removed, the hydrostatic pressure of the drilling fluid replaces the rock in balancing the in situ stress, causing the redistribution of stress around the wellbore. Many scholars have conducted research on this topic, with Kirsch being one of the earliest to establish equations for the stress around the wellbore in linear elastic formations. Building on this foundation, this study establishes a predictive model for drilling-induced fractures.
2.1. Coordinate Transformation
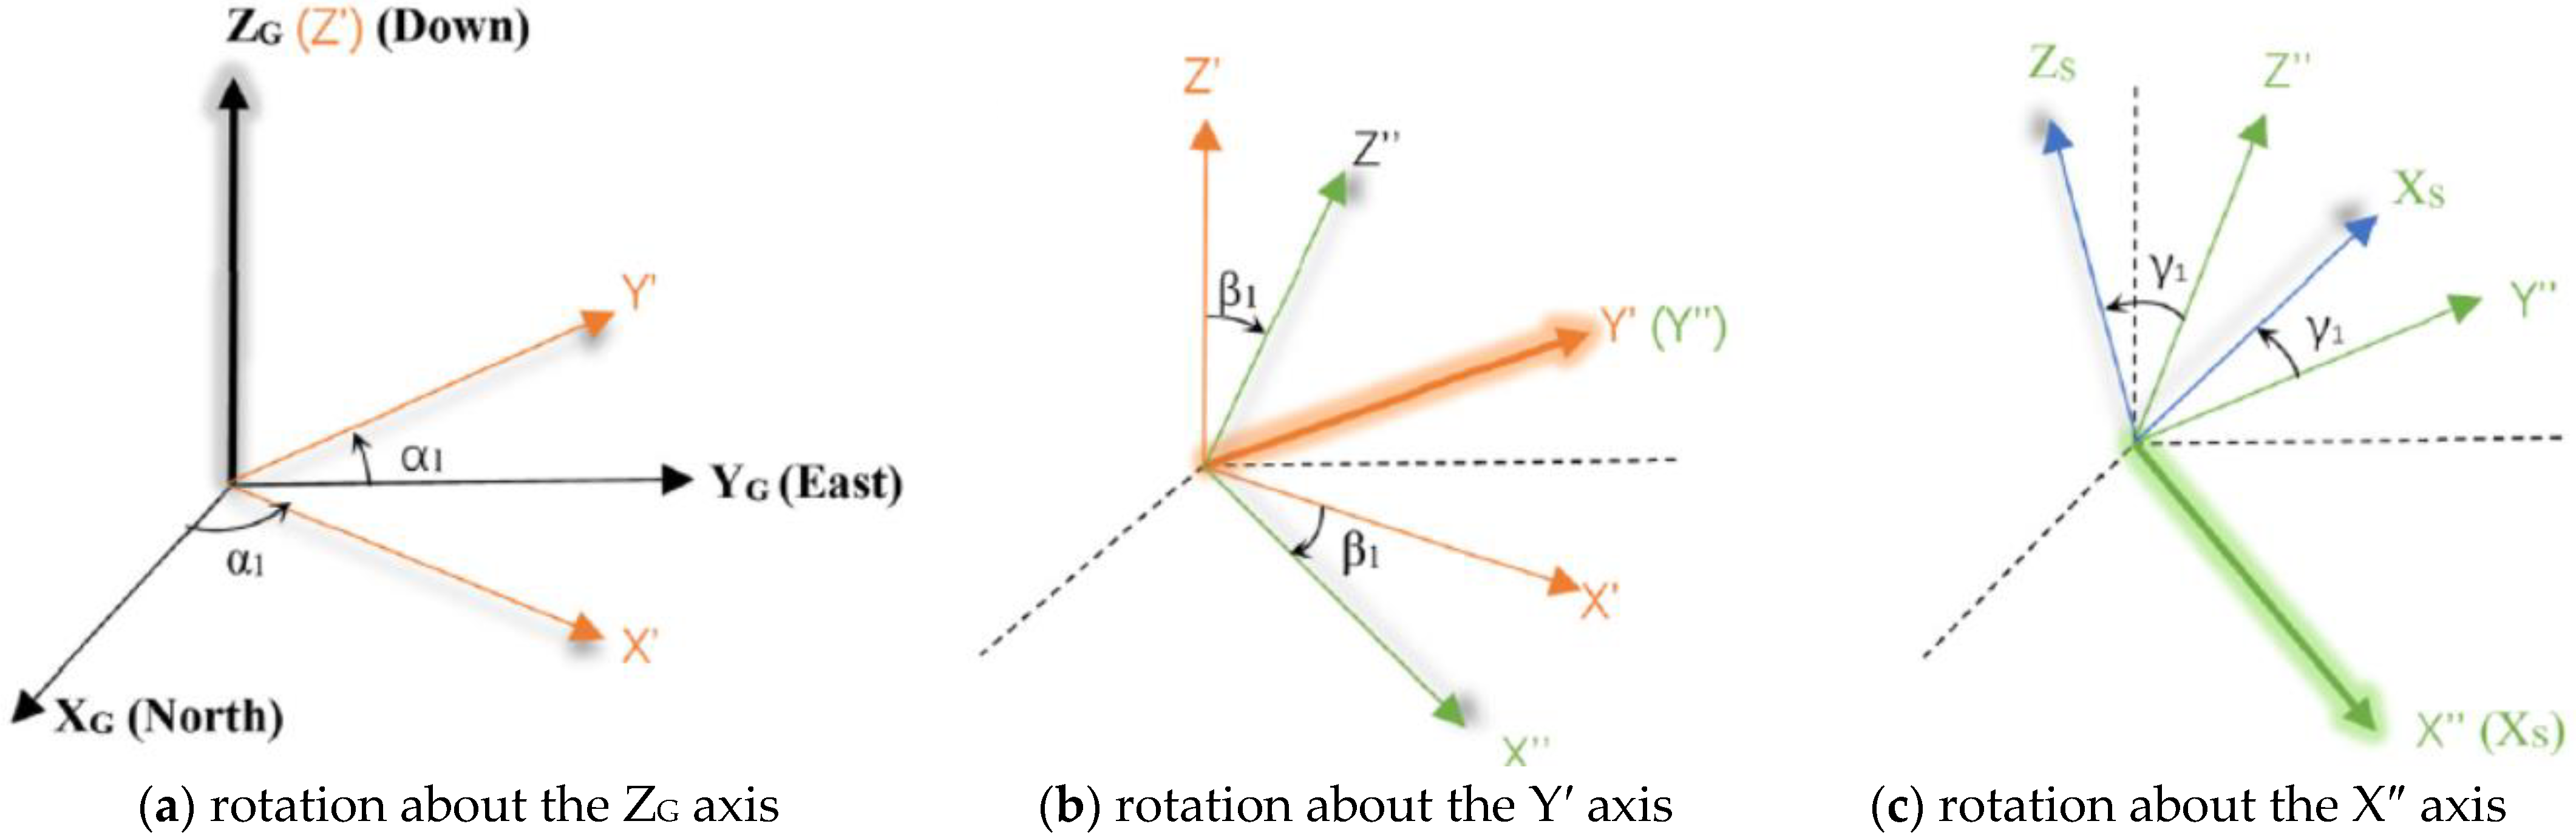
To characterize the stress distribution around the wellbore, it is essential to initially transform the in situ stress into a global coordinate system [58]. As shown in Figure 1, XG-YG-ZG represents the global coordinate system, where XG denotes the true north direction, YG denotes the true east direction, and ZG denotes the vertical direction. XS-YS-ZS represents the stress coordinate system, representing the horizontal maximum stress, horizontal minimum stress, and vertical stress, respectively. To transform the in situ stress into a global coordinate system, three coordinate transformations are necessary. Firstly, the first step involves rotating the global coordinate system around the ZG axis by an angle α1 to obtain the X′-Y′-Z′ coordinate system. Secondly, the second step involves rotating the X′-Y′-Z′ coordinate system around the Y′ axis by an angle β1 to obtain the X″-Y″-Z″ coordinate system. Thirdly, the third step involves rotating the X″-Y″-Z″ coordinate system around the X″ axis by an angle γ1 to finally convert it to the XG-YG-ZG coordinate system.
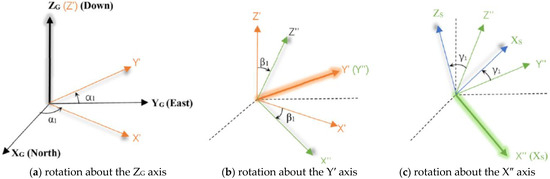
Figure 1.
Three steps of the transformation between the global coordinate system (GCS) and in situ stress coordinate system (ICS) [58].
Based on geometric knowledge, a transformation matrix is established as shown in Equation (1),
The stress tensor σG represents the stress components in the geodetic coordinate system, while σS represents the stress components in the stress coordinate system. The relationship between the two can be expressed as shown in Equation (2),
where, , σH represents the maximum horizontal stress, in MPa; σh represents the minimum horizontal stress in MPa; σv represents the vertical stress in MPa.
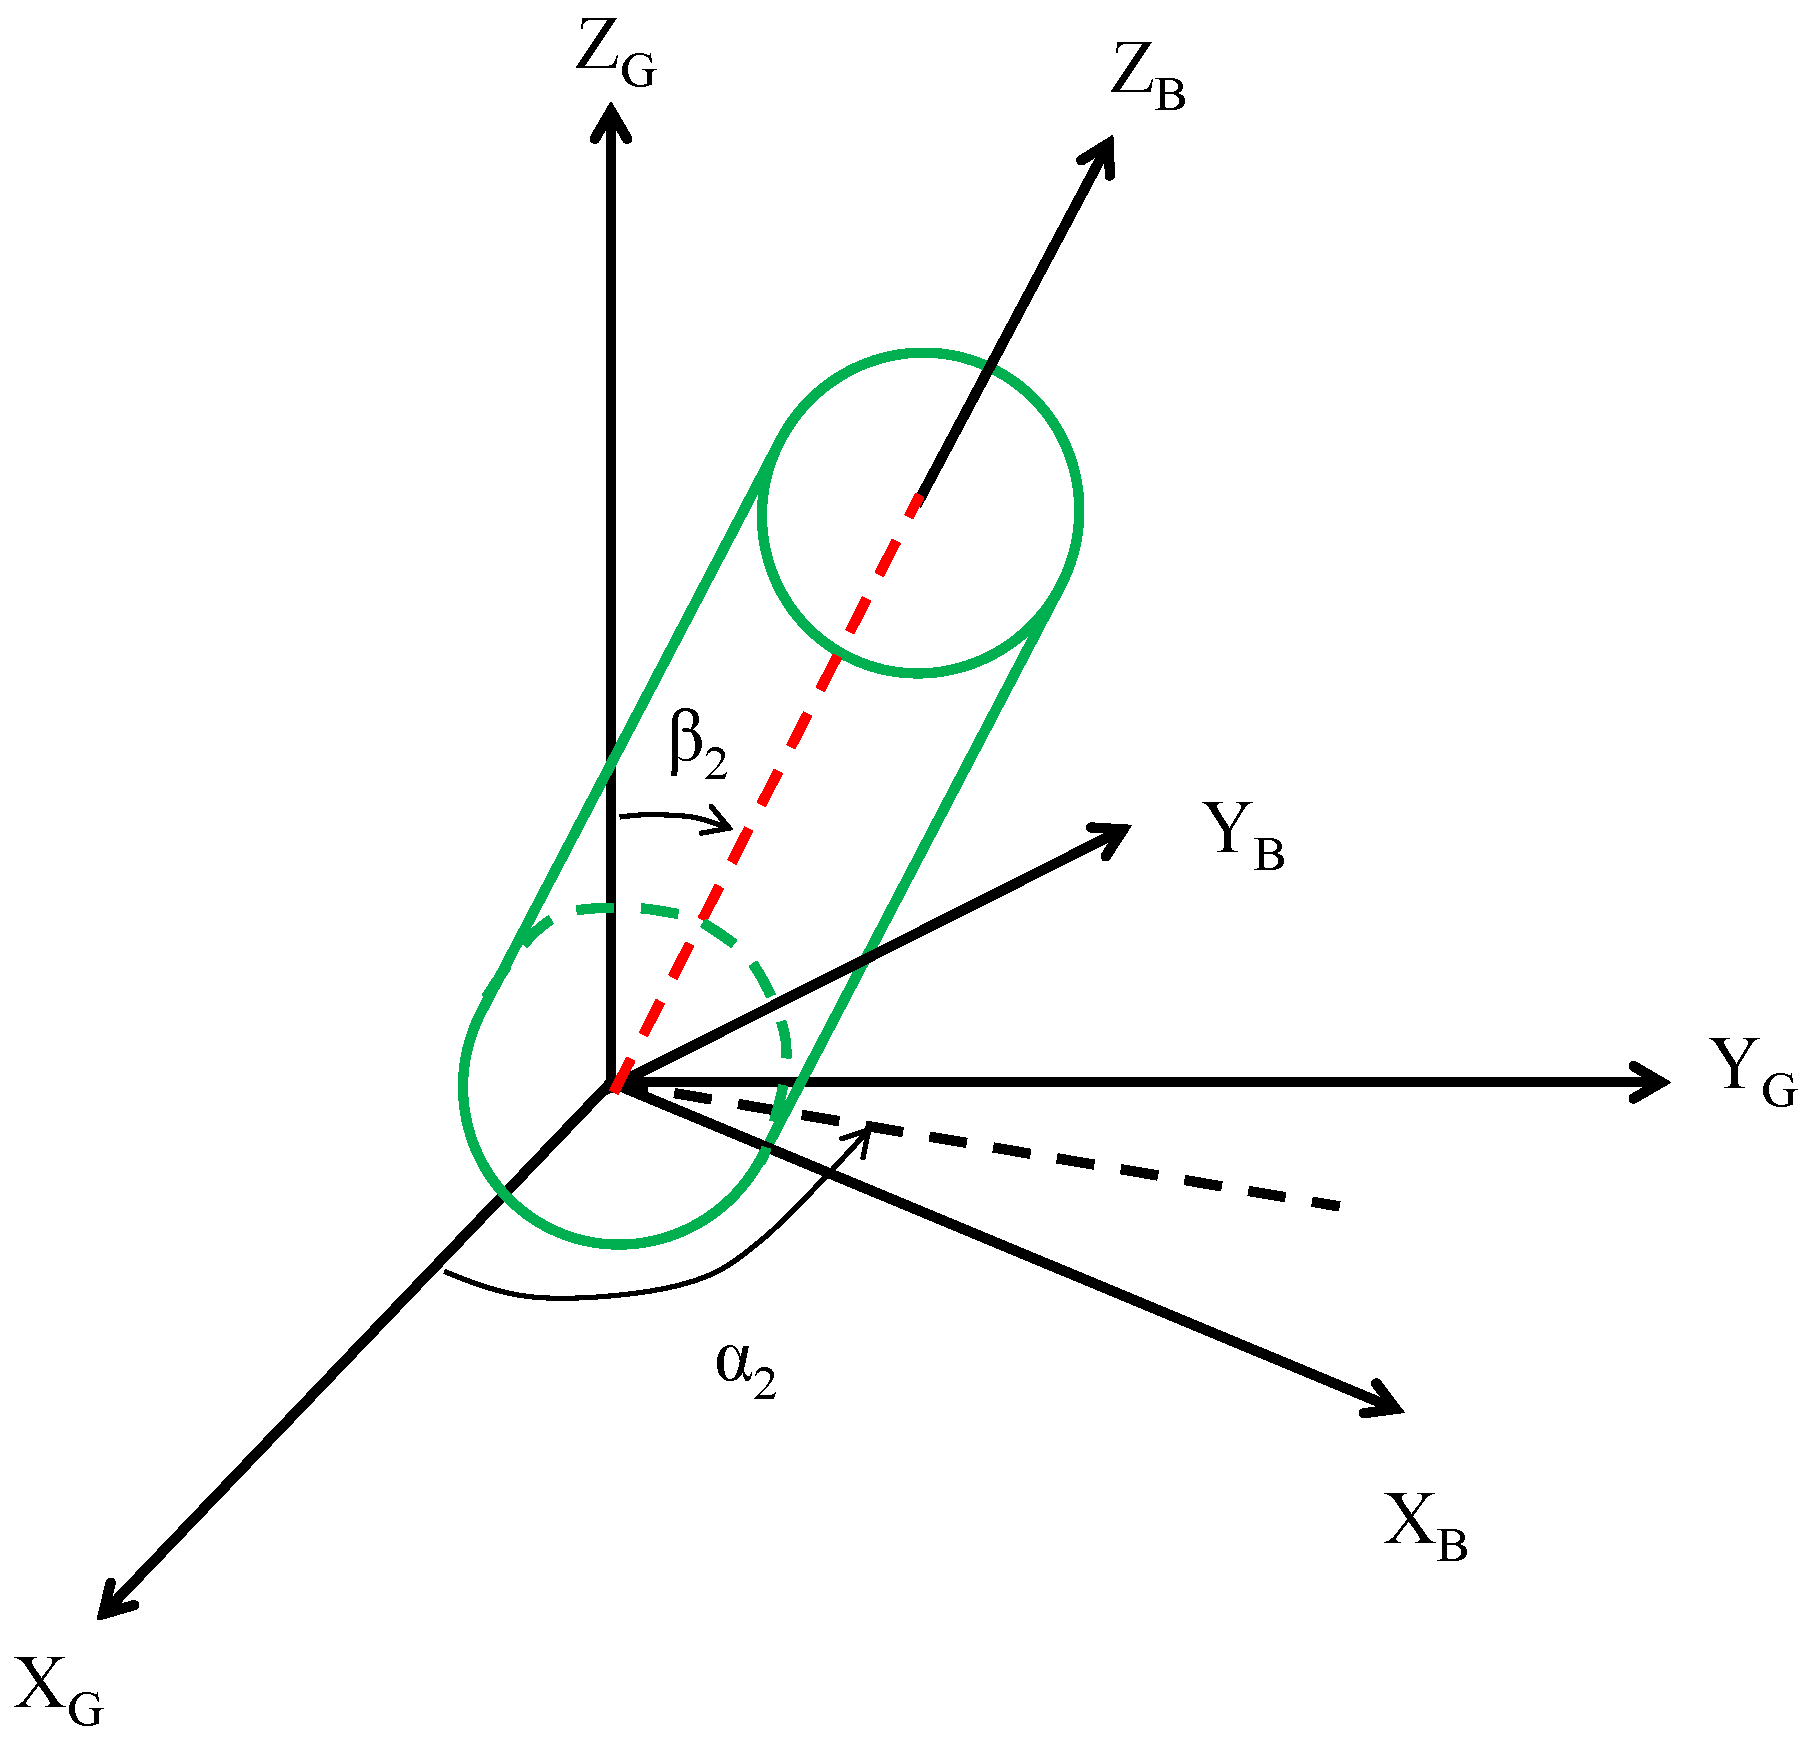
After converting the stress from the Earth coordinate system to the borehole coordinate system, further analysis should be conducted. The transformation relationship between the geodetic coordinate system (GCS) and the borehole coordinate system (BCS) is illustrated in Figure 2, where XB-YB-ZB represents the borehole coordinate system, α2 represents the angle between the borehole trend and the true north direction, commonly referred to as the azimuth angle; β2 represents the angle between the borehole axis and the vertical direction, commonly referred to as the inclination angle. Using σB to represent the stress tensor in the borehole coordinate system, according to the research by Lee et al. [15], the conversion relationship between σB and σG is shown in Equation (3),

Figure 2.
Transformation between global coordinate system (GCS) and borehole coordinate system (BCS) [58].
The transformation matrix R2 is represented as shown in Equation (4),
2.2. Wellbore Stress Distribution
The stress tensor σB, i.e., [σx, σy, σz, τxy, τxz, τyz], represents the stress distribution around a wellbore wall in a borehole rectangular coordinate system, for conveniently, the σB, should be transformed to the polar coordinate system, as shown in Equation (5), which represents the effective stress around any deviated wellbore.
where rw represents the radius of the wellbore in meters; r denotes the distance from any point around the wellbore to the axis of the wellbore in meters; Pw stands for the bottomhole hydrostatic pressure, in MPa; Pp represents the formation pore pressure, in MPa; θ denotes the azimuth angle around the wellbore, which is the angle rotated clockwise from a certain point around the wellbore to the X-axis of the coordinate system Xb, in degrees; and α signifies the Biot’s effective stress coefficient, ranging from 0 to 1, dimensionless. This equation for the stress around the wellbore is established based on the plane strain condition, assuming no displacement in the Zb direction. Kirsch initially proposed a linear elastic stress model around the wellbore, but it only describes the stress state when the wellbore axis is parallel to the principal stresses. Al-Ajmi et al. [29] have derived stress equations for deviated wellbores.
Once the stress distribution around the wellbore is determined, it needs to be integrated into the rock strength criteria to evaluate the stability of the surrounding rock. Given that rock strength criteria are typically formulated in terms of principal stresses, the stresses around the wellbore must be converted into principal stress forms. The equation for converting the stress around the wellbore in polar coordinates to principal stresses is shown as follows,
The relative magnitudes of the three principal stresses at any point around the wellbore vary with changes in the bottomhole fluid pressure. To accurately distinguish between the three principal stresses around the wellbore, substitute the expression obtained from Equation (6) into Equation (7).
where, and are the principal stresses, MPa; is the radial stress, MPa; is the circumferential stress at wellbore wall, MPa; is the vertical stress, MPa; is the is the shear stress in the radial-tangential plane, MPa.
2.3. Solution of Induced Fracture Occurrence
Extensive research has been conducted on the collapse and fracturing of wellbores and has yielded significant achievements. However, studies focusing on the prediction of the initiation location of drilling-induced fractures and the morphology of fractures around the wellbore are still scarce. Understanding the mechanisms and characteristics of drilling-induced fractures is crucial for various purposes, such as ground stress inversion, determining the optimal density window for drilling fluids, and optimizing the particle size distribution of sealing materials.
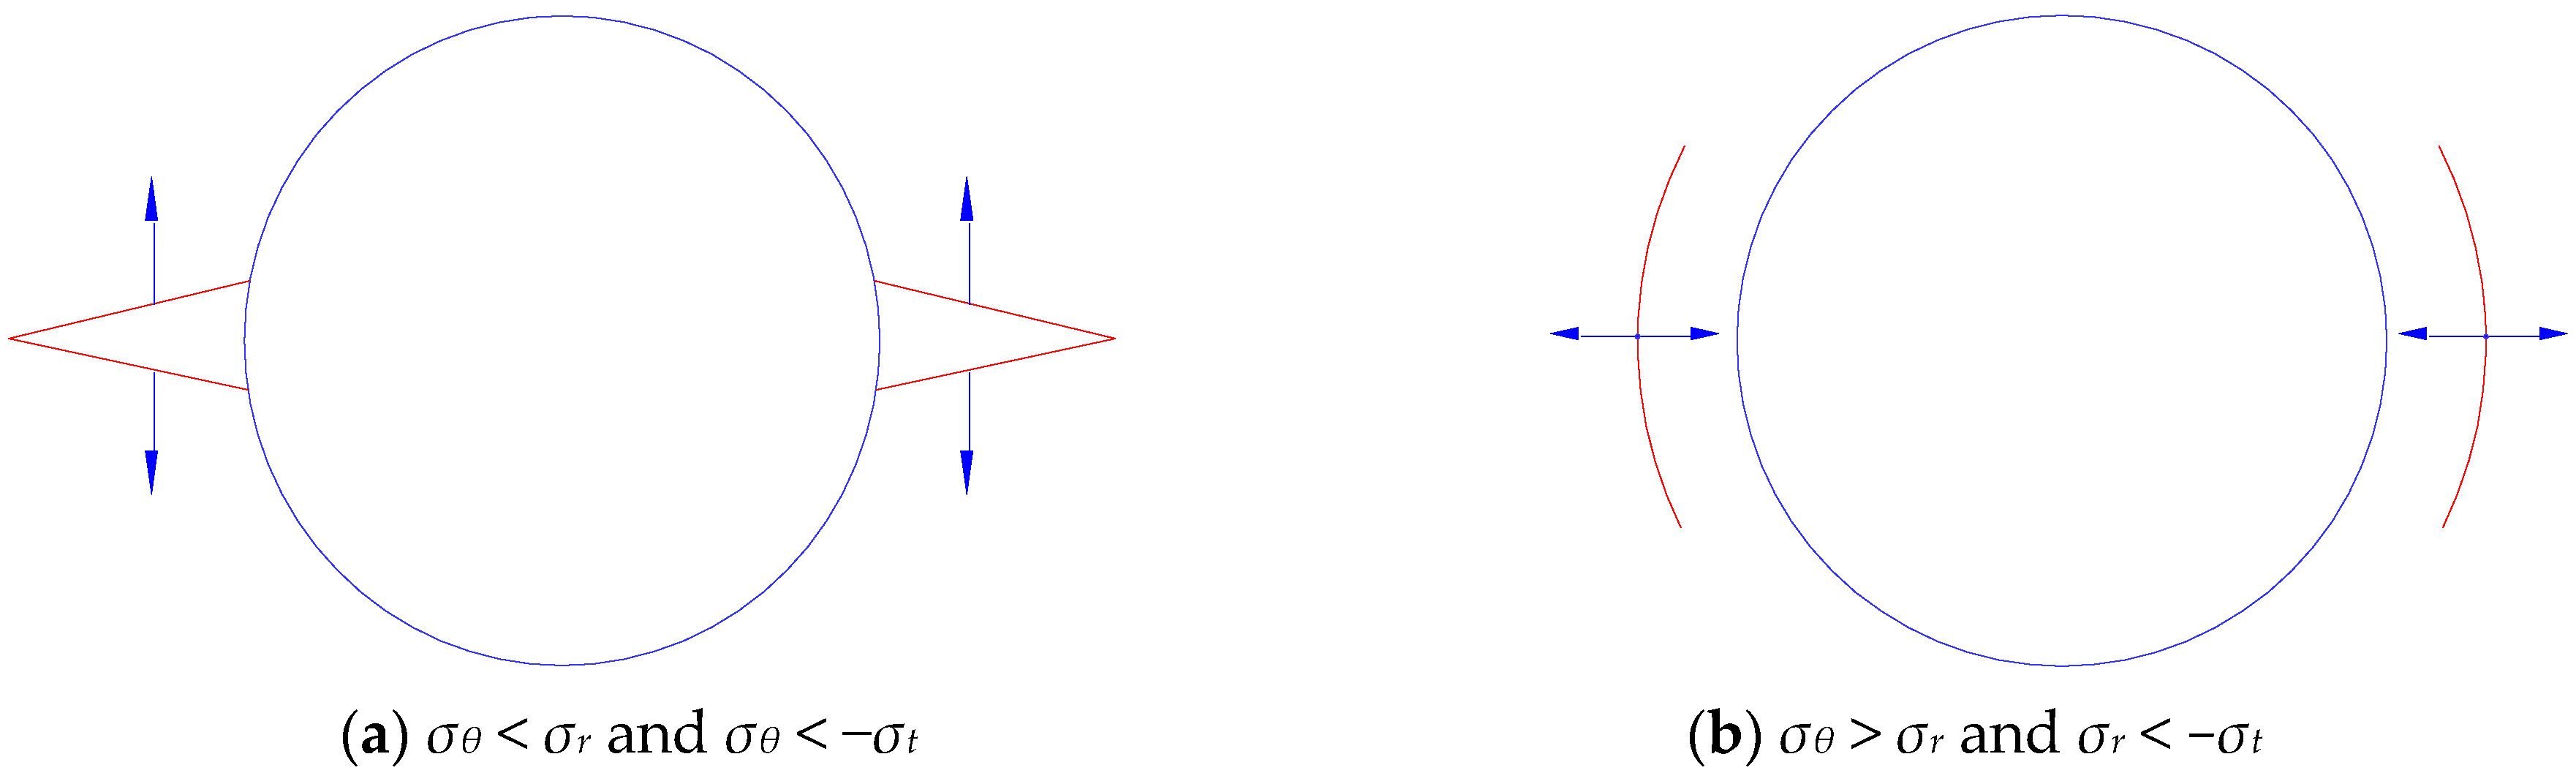
It is widely accepted in petroleum engineering rock mechanics that if the stress around the wellbore exceeds the tensile strength of the rock, it results in the initiation of induced fractures. In this field, compressive stress is conventionally regarded as positive, whereas tensile stress is viewed as negative. Therefore, as shown in Figure 3a, when σθ < σr and σθ < −σt, the effective hydrostatic stress inside the wellbore is compressive stress, and the circumferential stress around the wellbore is tensile stress. When this stress exceeds the tensile strength of the rock, the formation is stretched circumferentially, as indicated by the blue arrows in Figure 3a. At this point, no chunking occurs, but it may lead to drilling fluid leakage. Conversely, when σθ > σr and σr < −σt, the formation pressure exceeds the hydrostatic pressure inside the wellbore, resulting in an effective hydrostatic pressure inside the wellbore tensile stress. Exceeding the tensile strength of the rock leads to peeling of the rock surrounding the wellbore, as indicated by the blue arrows in Figure 3b. In this case, there is no drilling fluid leakage, but inward concave features with pointed, elongated, and plate-like chunks may form.
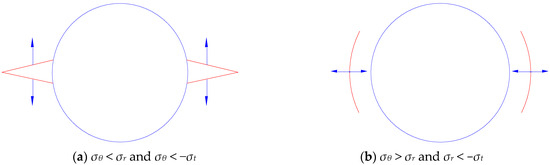
Figure 3.
Schematic diagram of induced fracture initiation mechanism around the wellbore.
To distinguish between different types of wellbore tensile failure, it is necessary to quantitatively analyze the relationship between the three major principal stresses around the wellbore. Furthermore, it is important to compare the relationship between the minimum principal stress around the wellbore and the tensile strength of the rock, as shown in Equation (8),
When σr is equal to σ3, and Equation (8) holds true, the wellbore experiences the type of failure depicted in Figure 3b. When σr is not equal to σ3, and Equation (8) holds true, the wellbore experiences the type of failure depicted in Figure 3a. When the type of tensile failure depicted in Figure 3b occurs, no induced fractures are generated around the wellbore and the uniform enlargement of the wellbore diameter along the circumference is caused by the spalling of the surrounding rock. However, when the type of failure depicted in Figure 3a occurs, induced fractures are generated around the wellbore, and when the liquid column pressure is higher than the formation pressure, it may result in drilling fluid loss. The relationship between the angle of the induced fractures and the well axis stress is given by Equation (9).
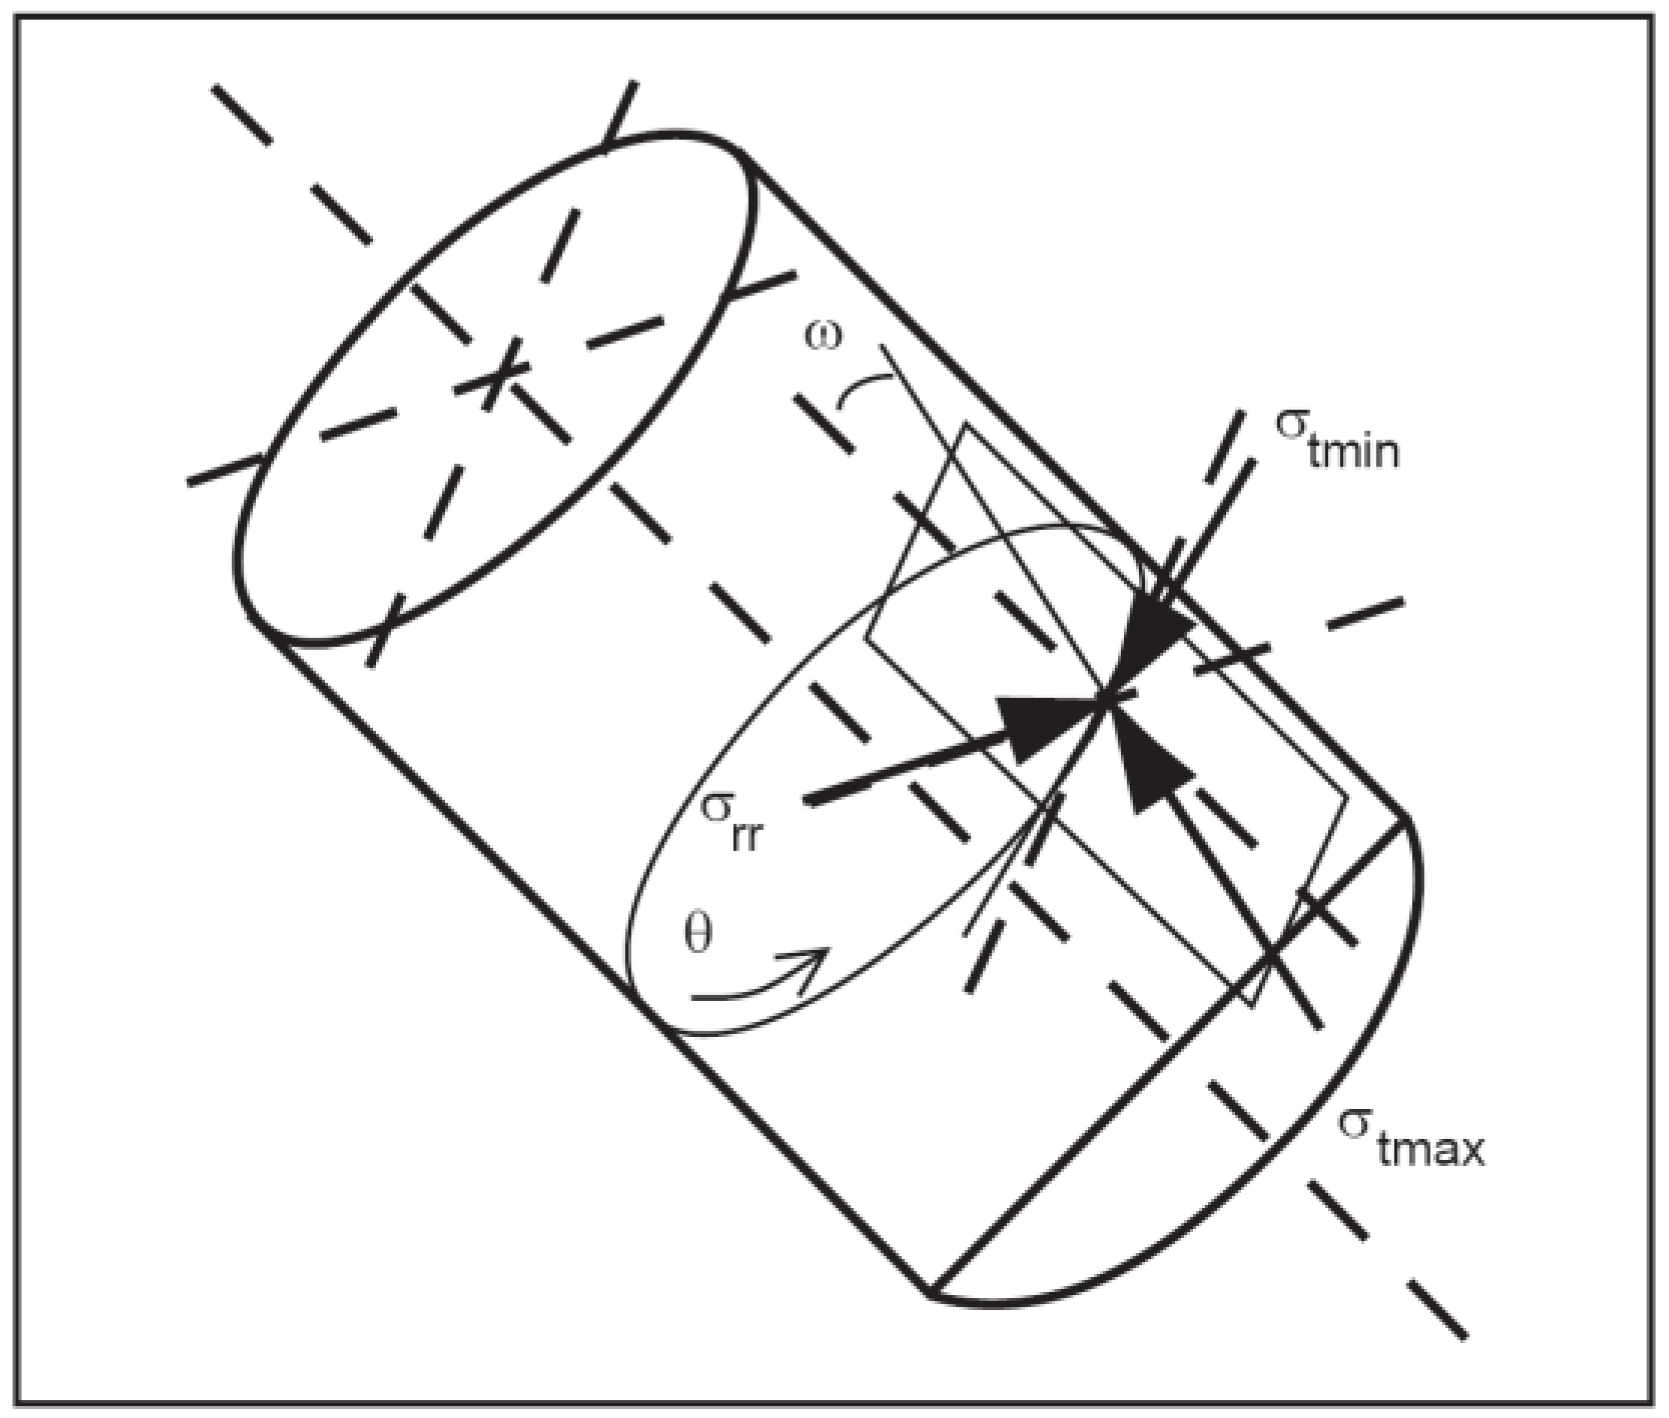
In the equation, represents the angle between the drilling-induced fractures and the wellbore axis, measured in degrees, as illustrated in Figure 4, which denotes the angle between the direction of maximum principal stress around the wellbore and the wellbore axis. After determining the stress field, well trajectory, and internal hydrostatic pressure, the principal stresses at various points around the wellbore are computed to identify the type of tensile failure. Then, the angle between each point around the wellbore and the wellbore axis is calculated, yielding the developmental morphology of the drilling-induced fractures under this particular operational condition.

Figure 4.
The angle between the minimum principal stress acting on the borehole wall and the borehole axis in any trajectory.
To prepare representative samples from fractured formations, it is crucial to comprehend the characteristics of fractures around the wellbore, encompassing both natural fractures and those induced by drilling. Accurate identification of natural fracture features can only be achieved using imaging logging techniques. However, the characteristics of drilling-induced fractures can be predicted based on construction parameters and geo-mechanical parameters. Therefore, this study established a predictive model for drilling-induced fractures and provided examples for calculating their characteristics.
3. Effect of In Situ Stress Mechanism on Induced Fracture Morphology
The Earth’s stress refers to the forces acting within the Earth’s interior, which primarily consist of three main types, as shown in Figure 5. When the vertical stress is the maximum principal stress, the stress type is normal faulting. When the vertical stress is an intermediate principal stress, the stress type is strike-slip faulting. When the vertical stress is the minimum principal stress, the stress type is reverse faulting.
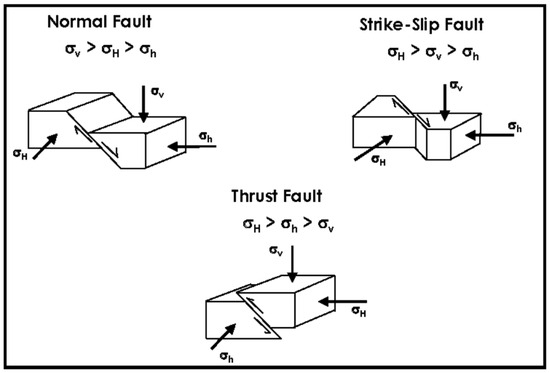
Figure 5.
Types of in situ stress.
Stress within the Earth’s crust is a significant factor in tectonic processes and rock deformation, representing a crucial physical phenomenon within the Earth’s interior. It has important implications for the Earth’s structure, seismic activity, rock mechanics, and engineering projects. Understanding the type and distribution of stress is essential for many geological and engineering applications. This study investigates the location and morphology of induced fractures in wellbores within formations of different stress types. The input parameters used in this study are presented in Table 1.

Table 1.
Inputting Parameters.
3.1. Normal Fault
Under normal faulting mechanisms, the wellbore’s circumferential principal stress, induced fracture characteristics, and their angles with respect to the wellbore axis are illustrated in Figure 6, Figure 7, Figure 8, Figure 9, Figure 10, Figure 11, Figure 12 and Figure 13 for different trajectories.

Figure 6.
Variation in principal stress and induced fracture angle in vertical wells.
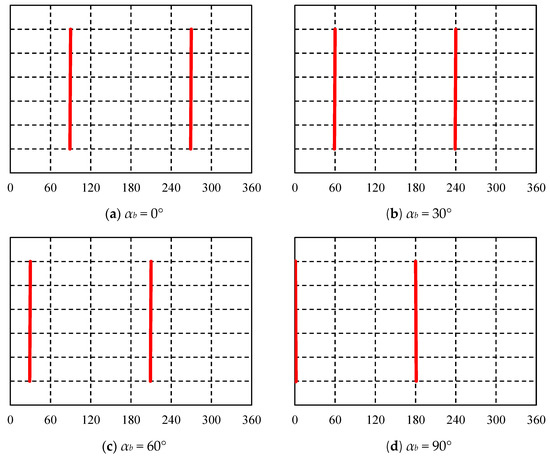
Figure 7.
Induced fracture occurrence in a vertical well at different azimuths.
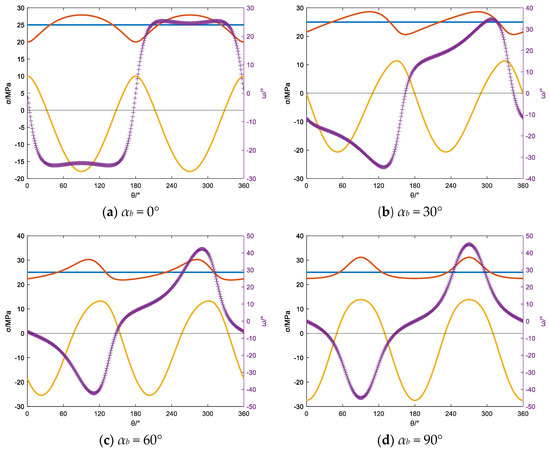
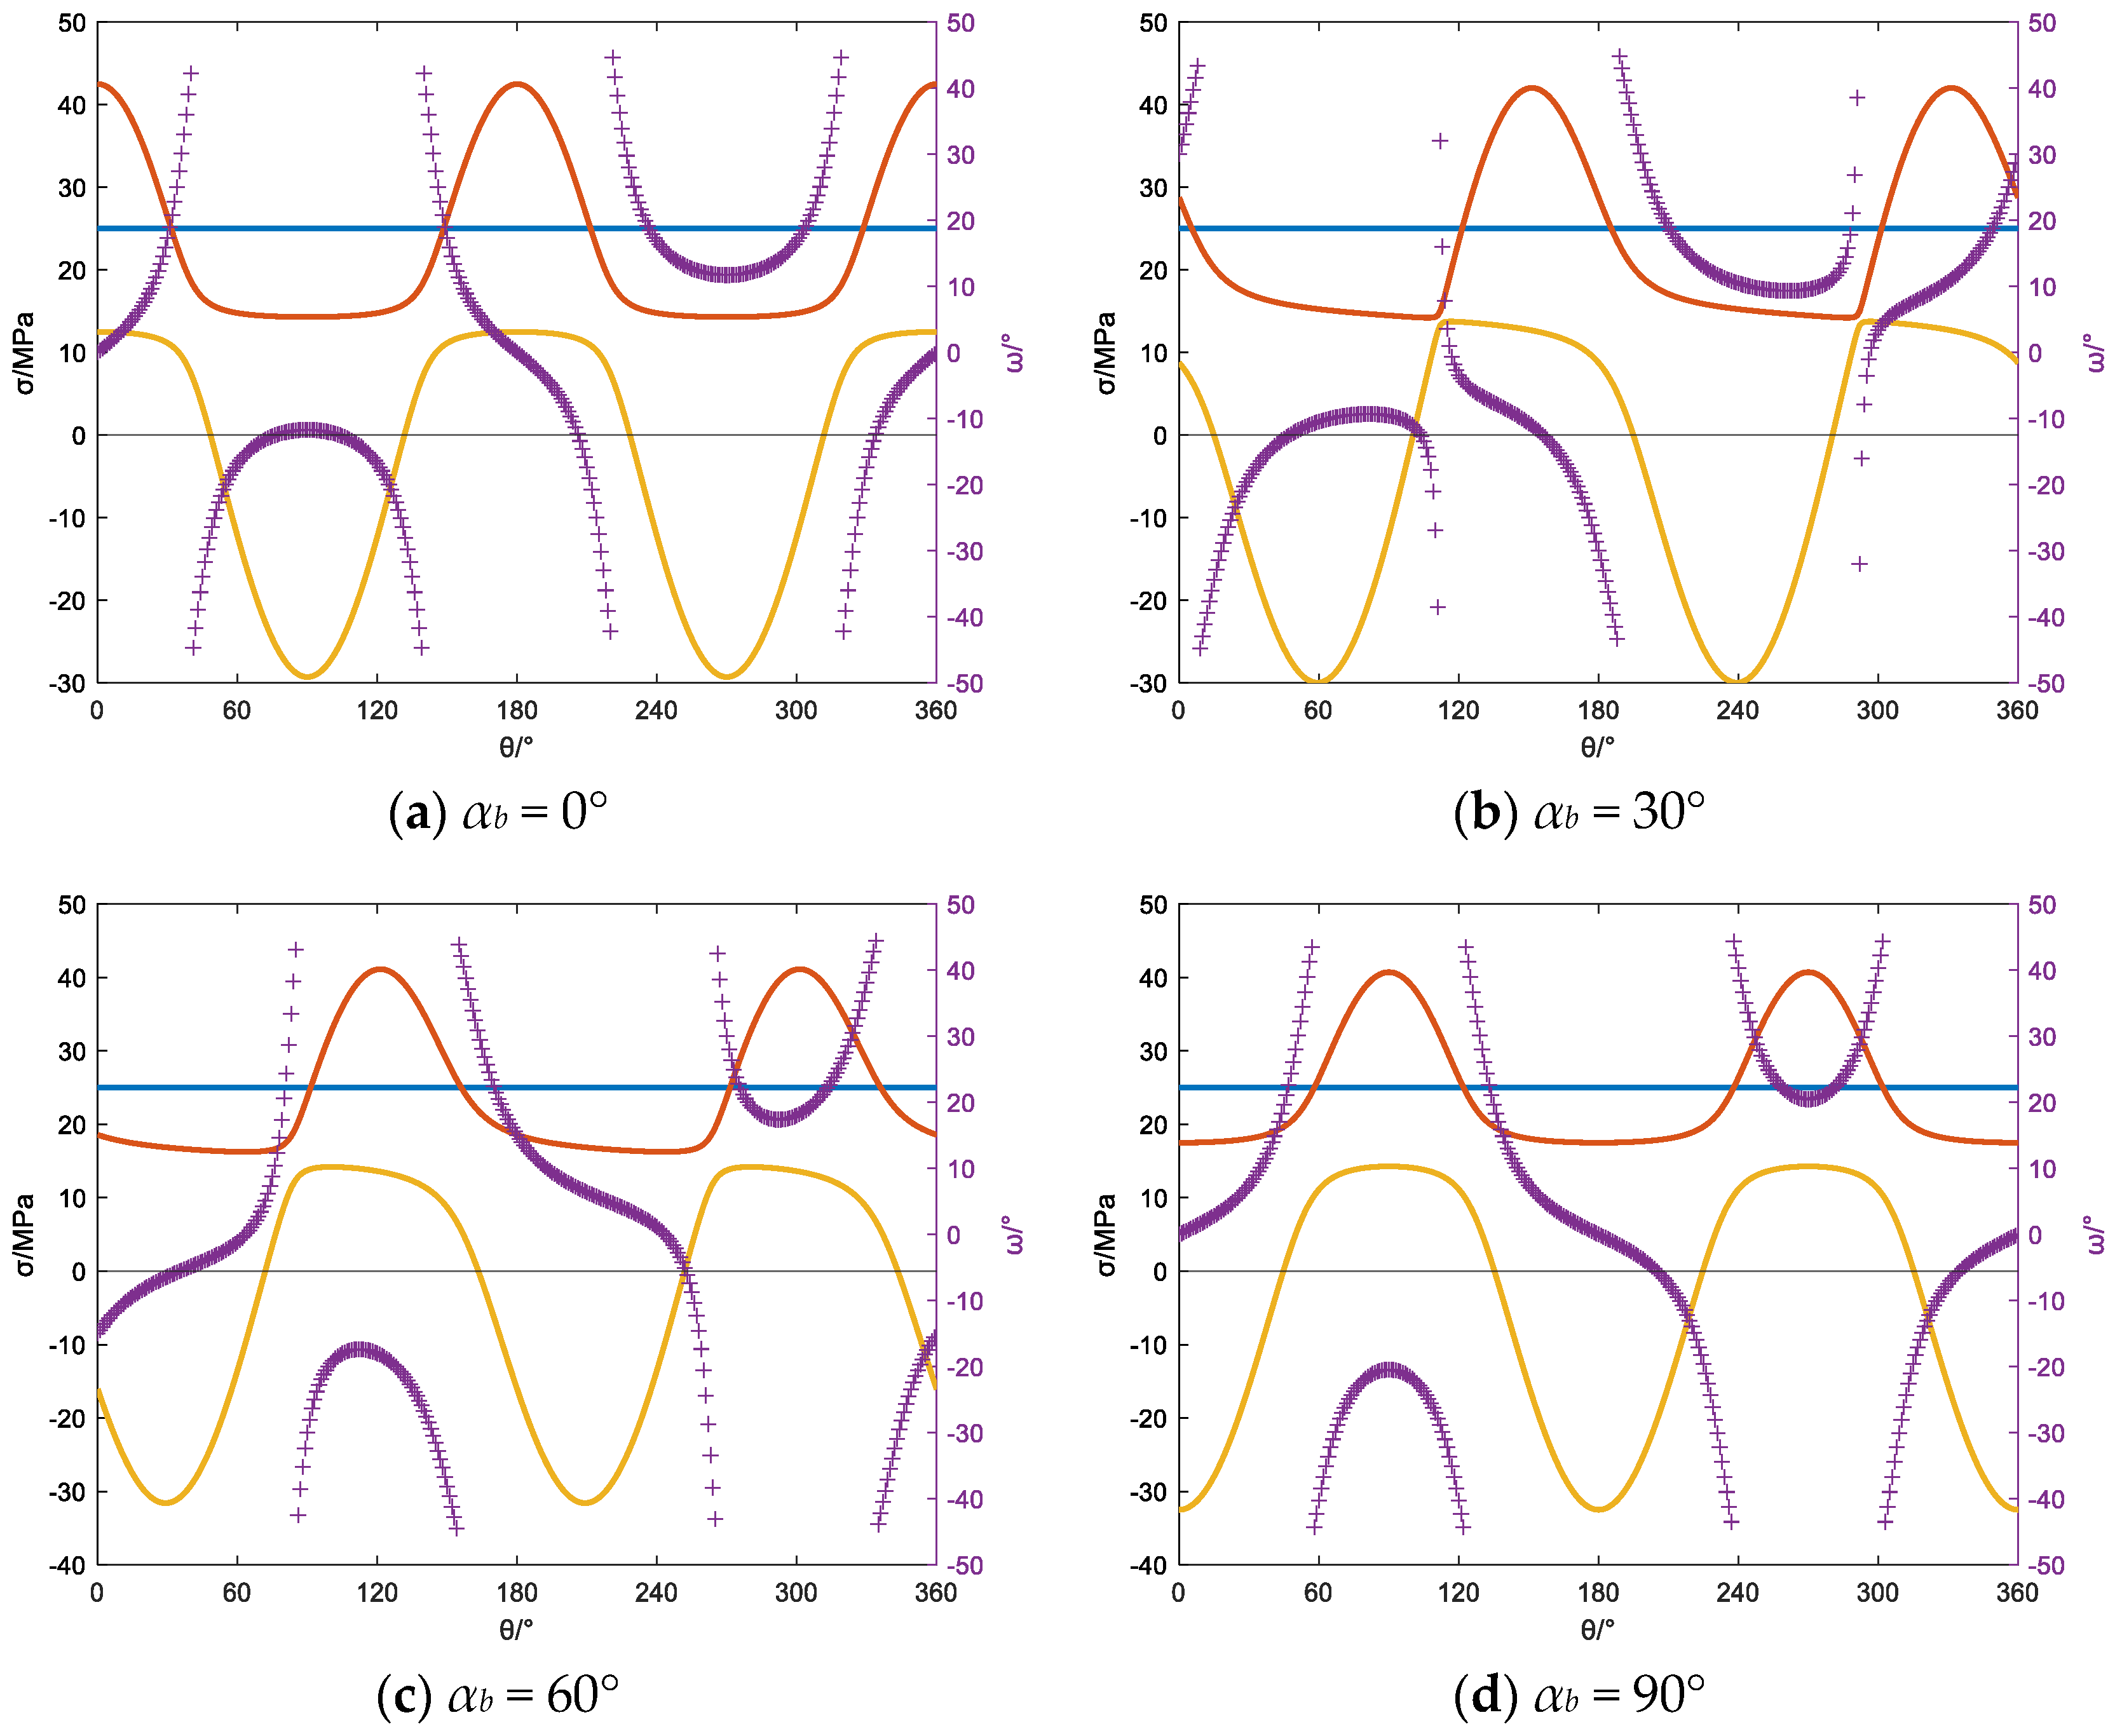
Figure 8.
Variation in the principal stress and induced fracture angle with βb = 30° at different azimuths.
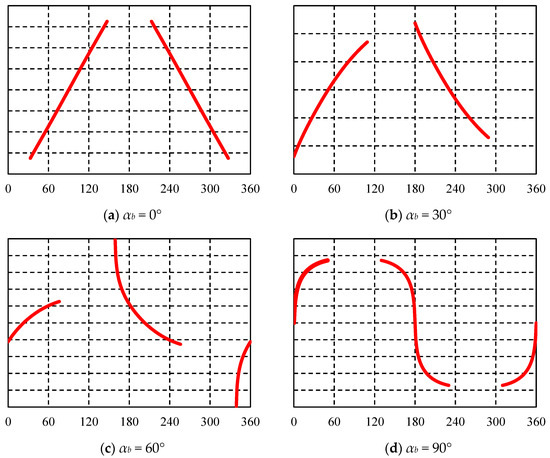
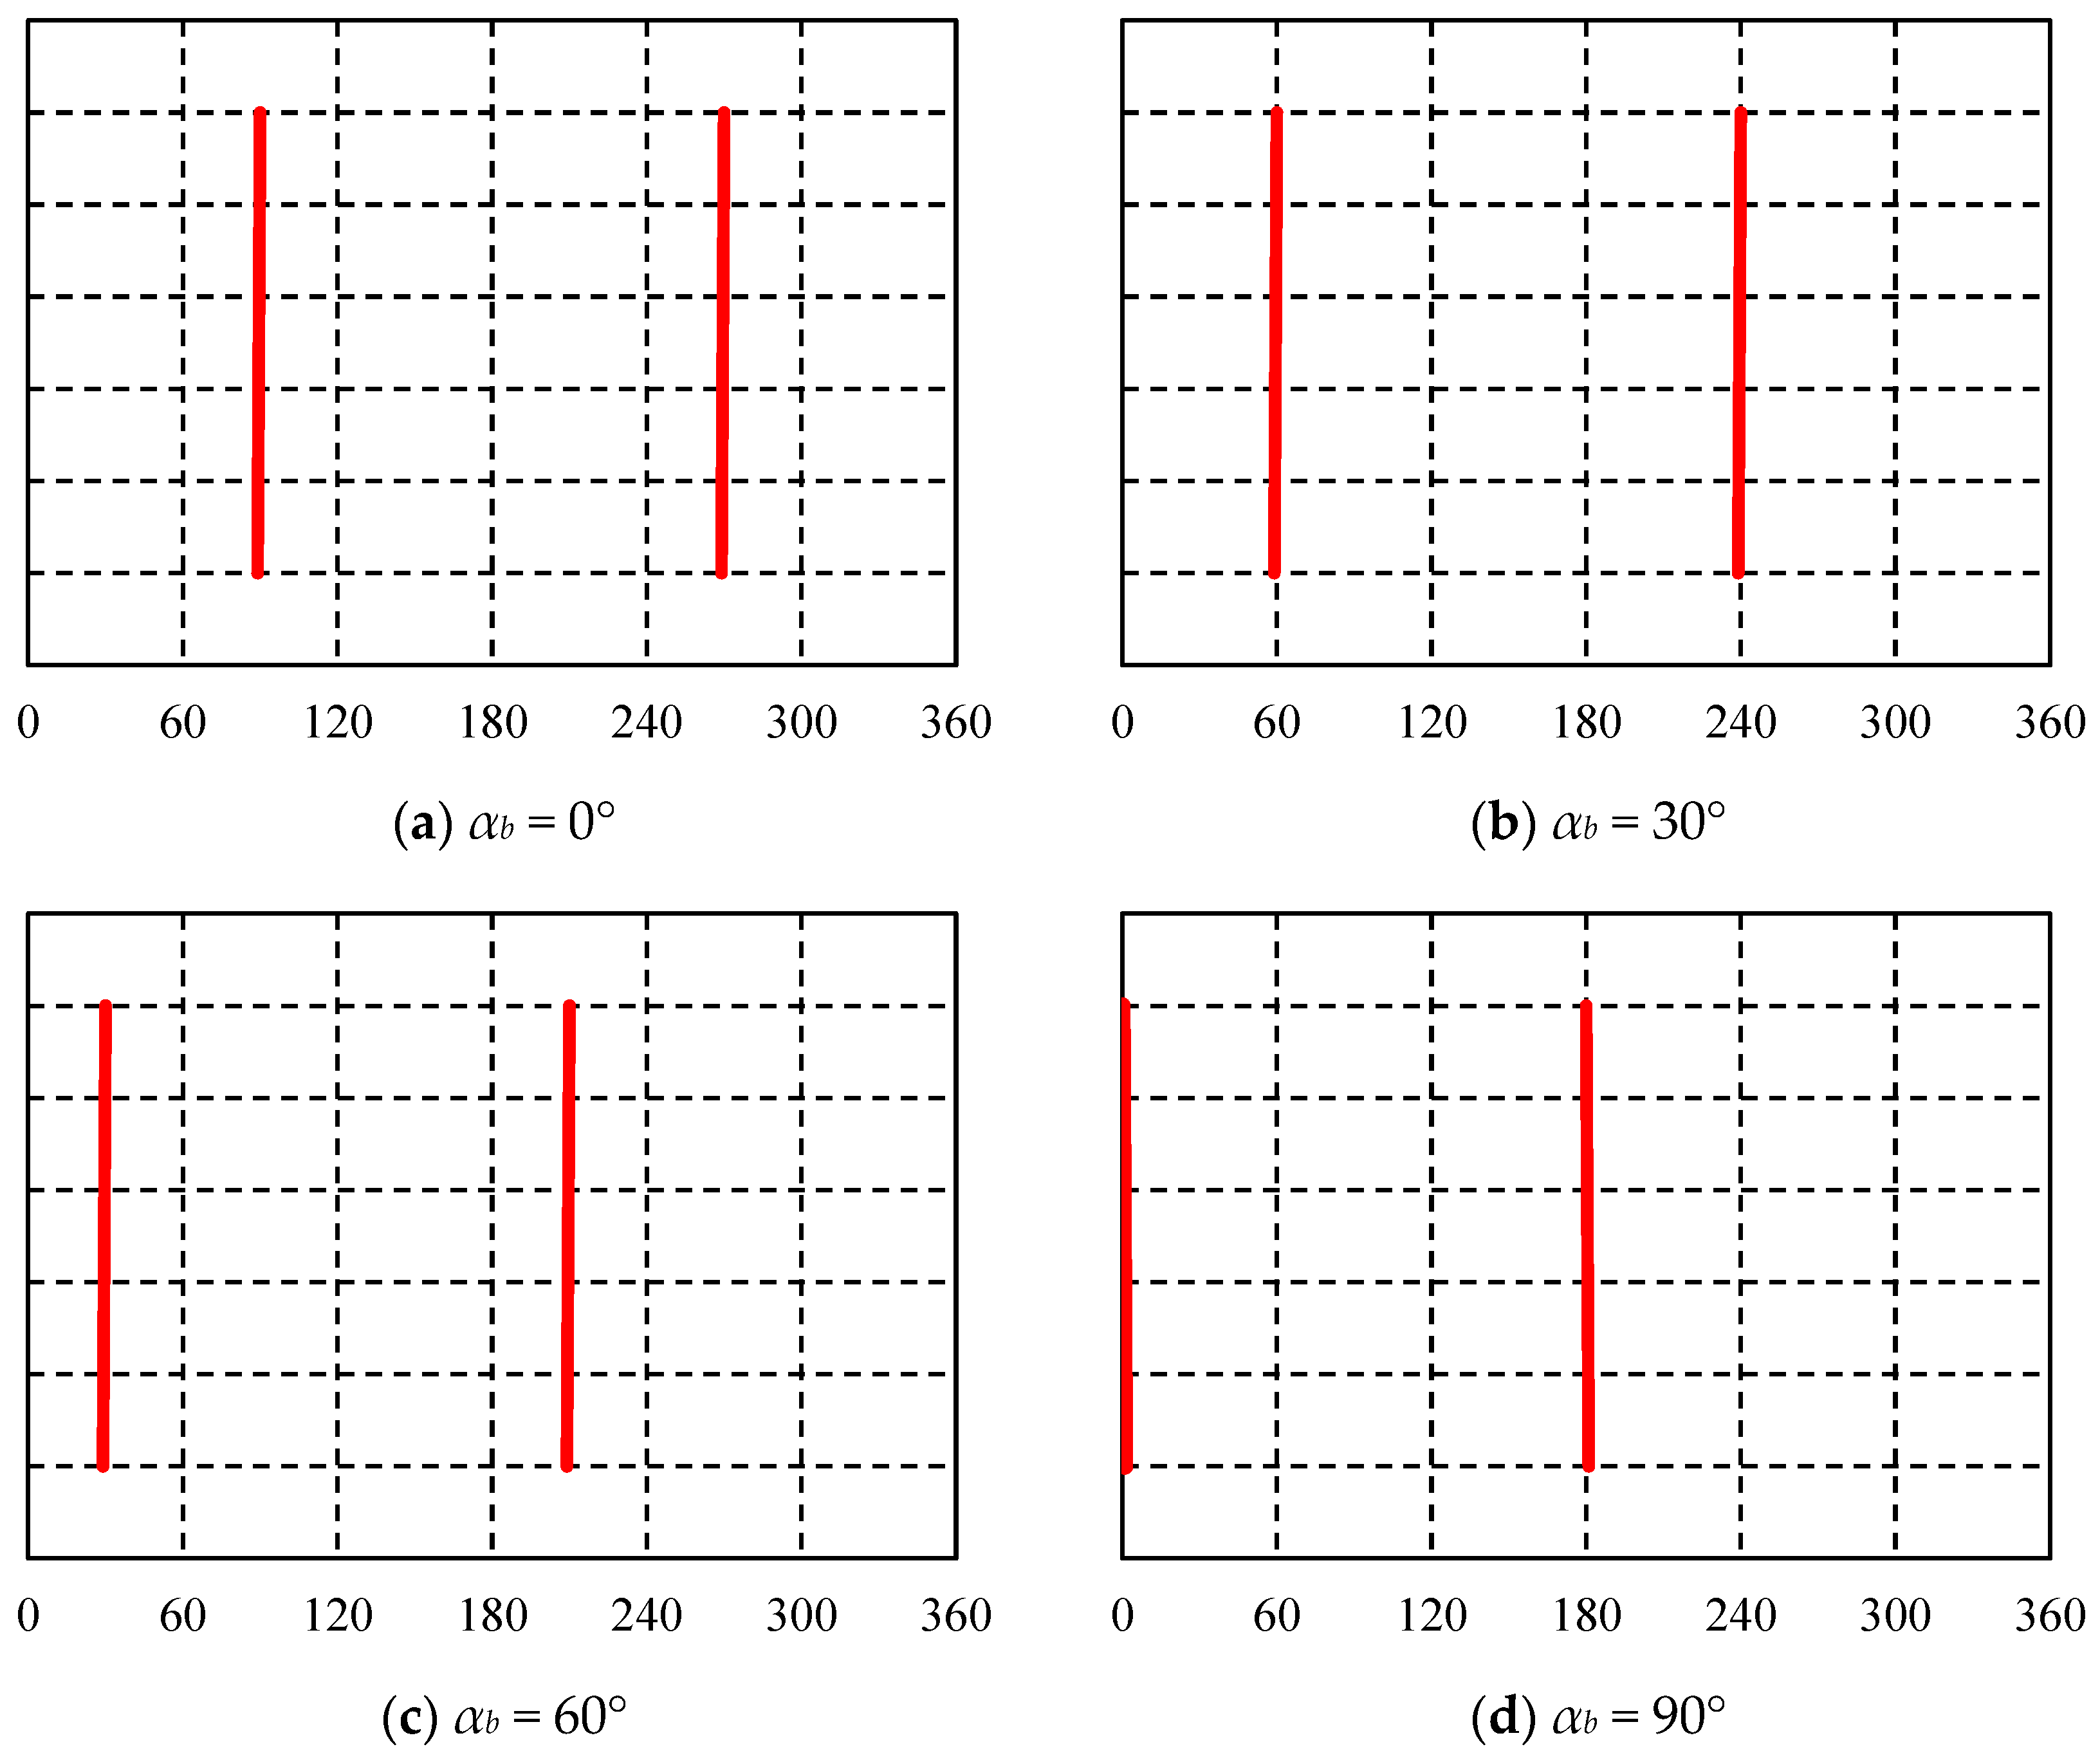
Figure 9.
Induced fracture occurrence in wells with βb = 30° at different azimuths.
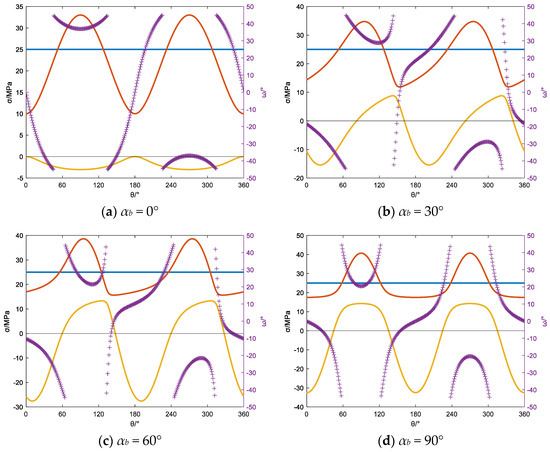
Figure 10.
Variation in the principal stress and induced fracture angle with βb = 60° at different azimuths.

Figure 11.
Induced fracture occurrence in wells at βb = 60° at different azimuths.
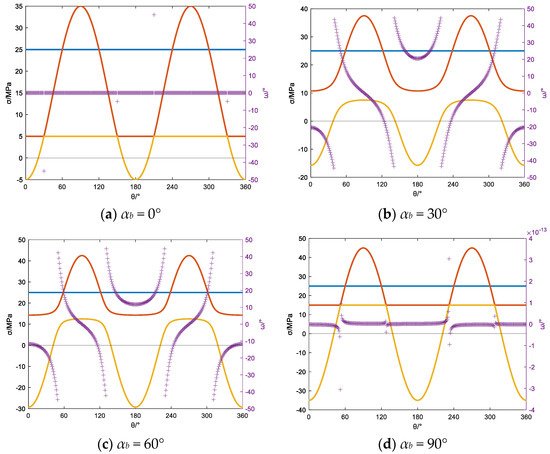
Figure 12.
Variation in the principal stress and induced fracture angle with βb = 90° at different azimuths.
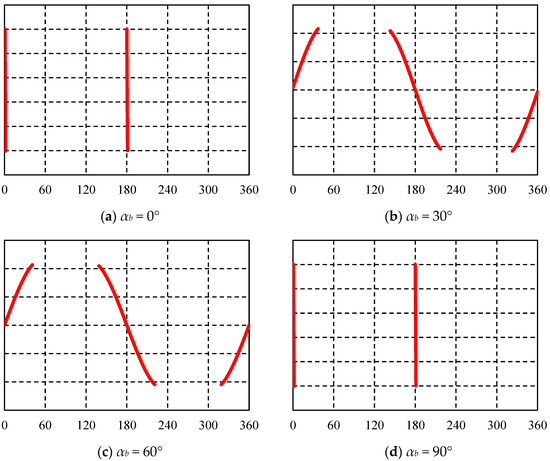
Figure 13.
Induced fracture occurrence in wells at βb = 90° at different azimuths.
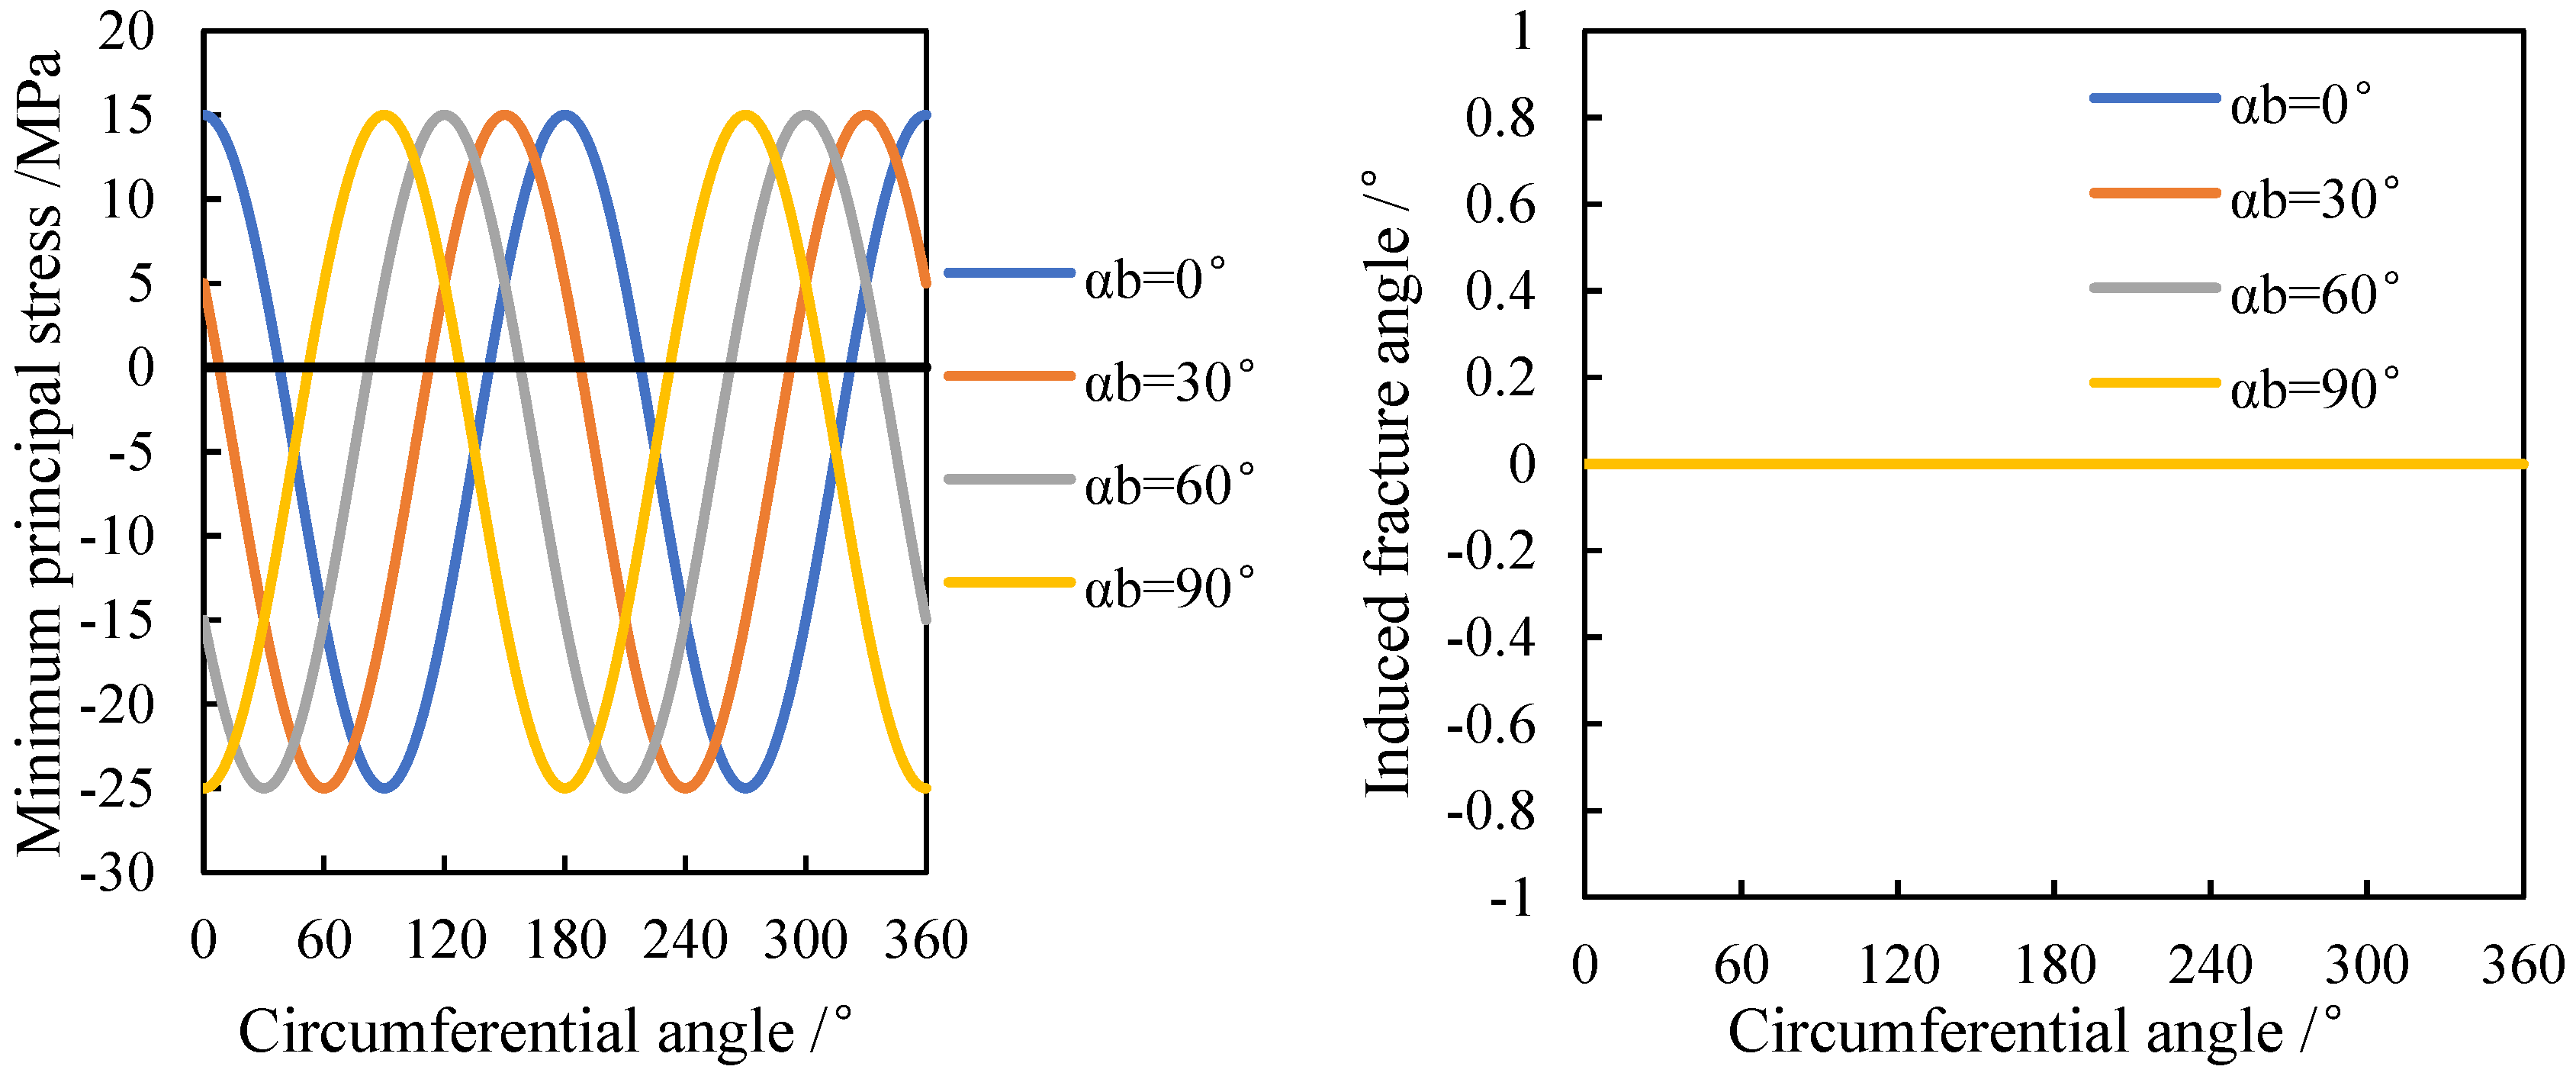
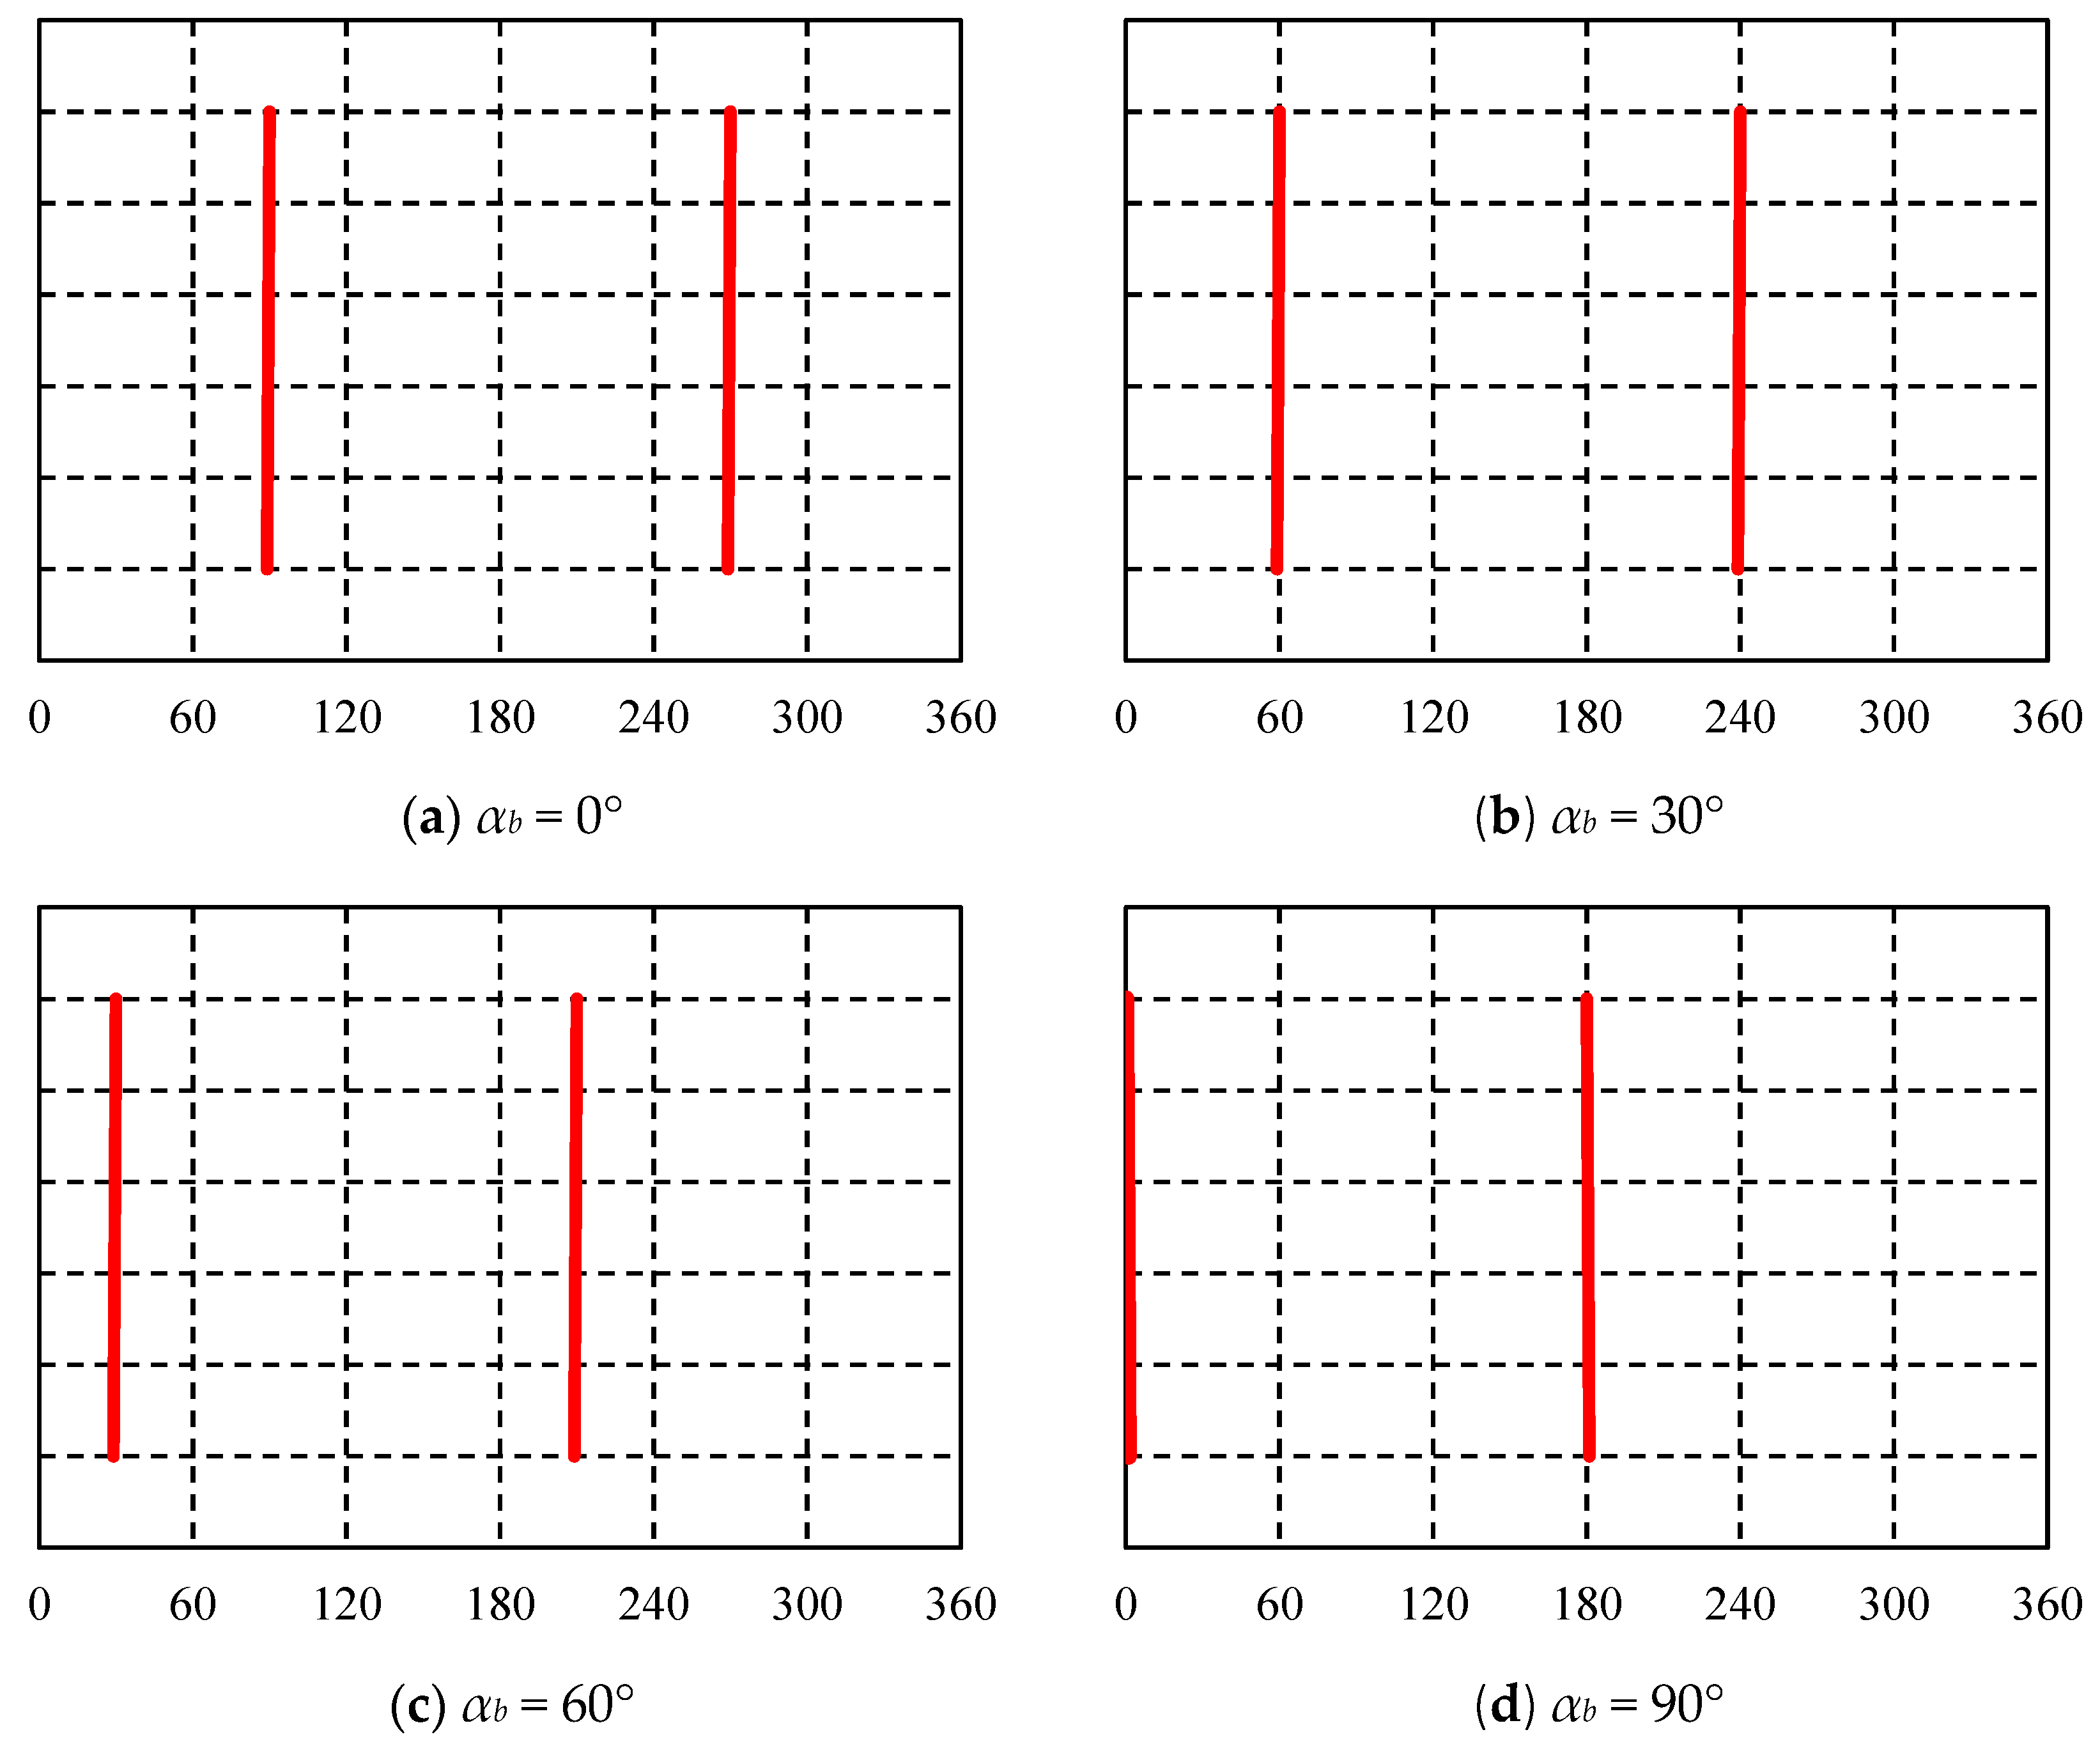
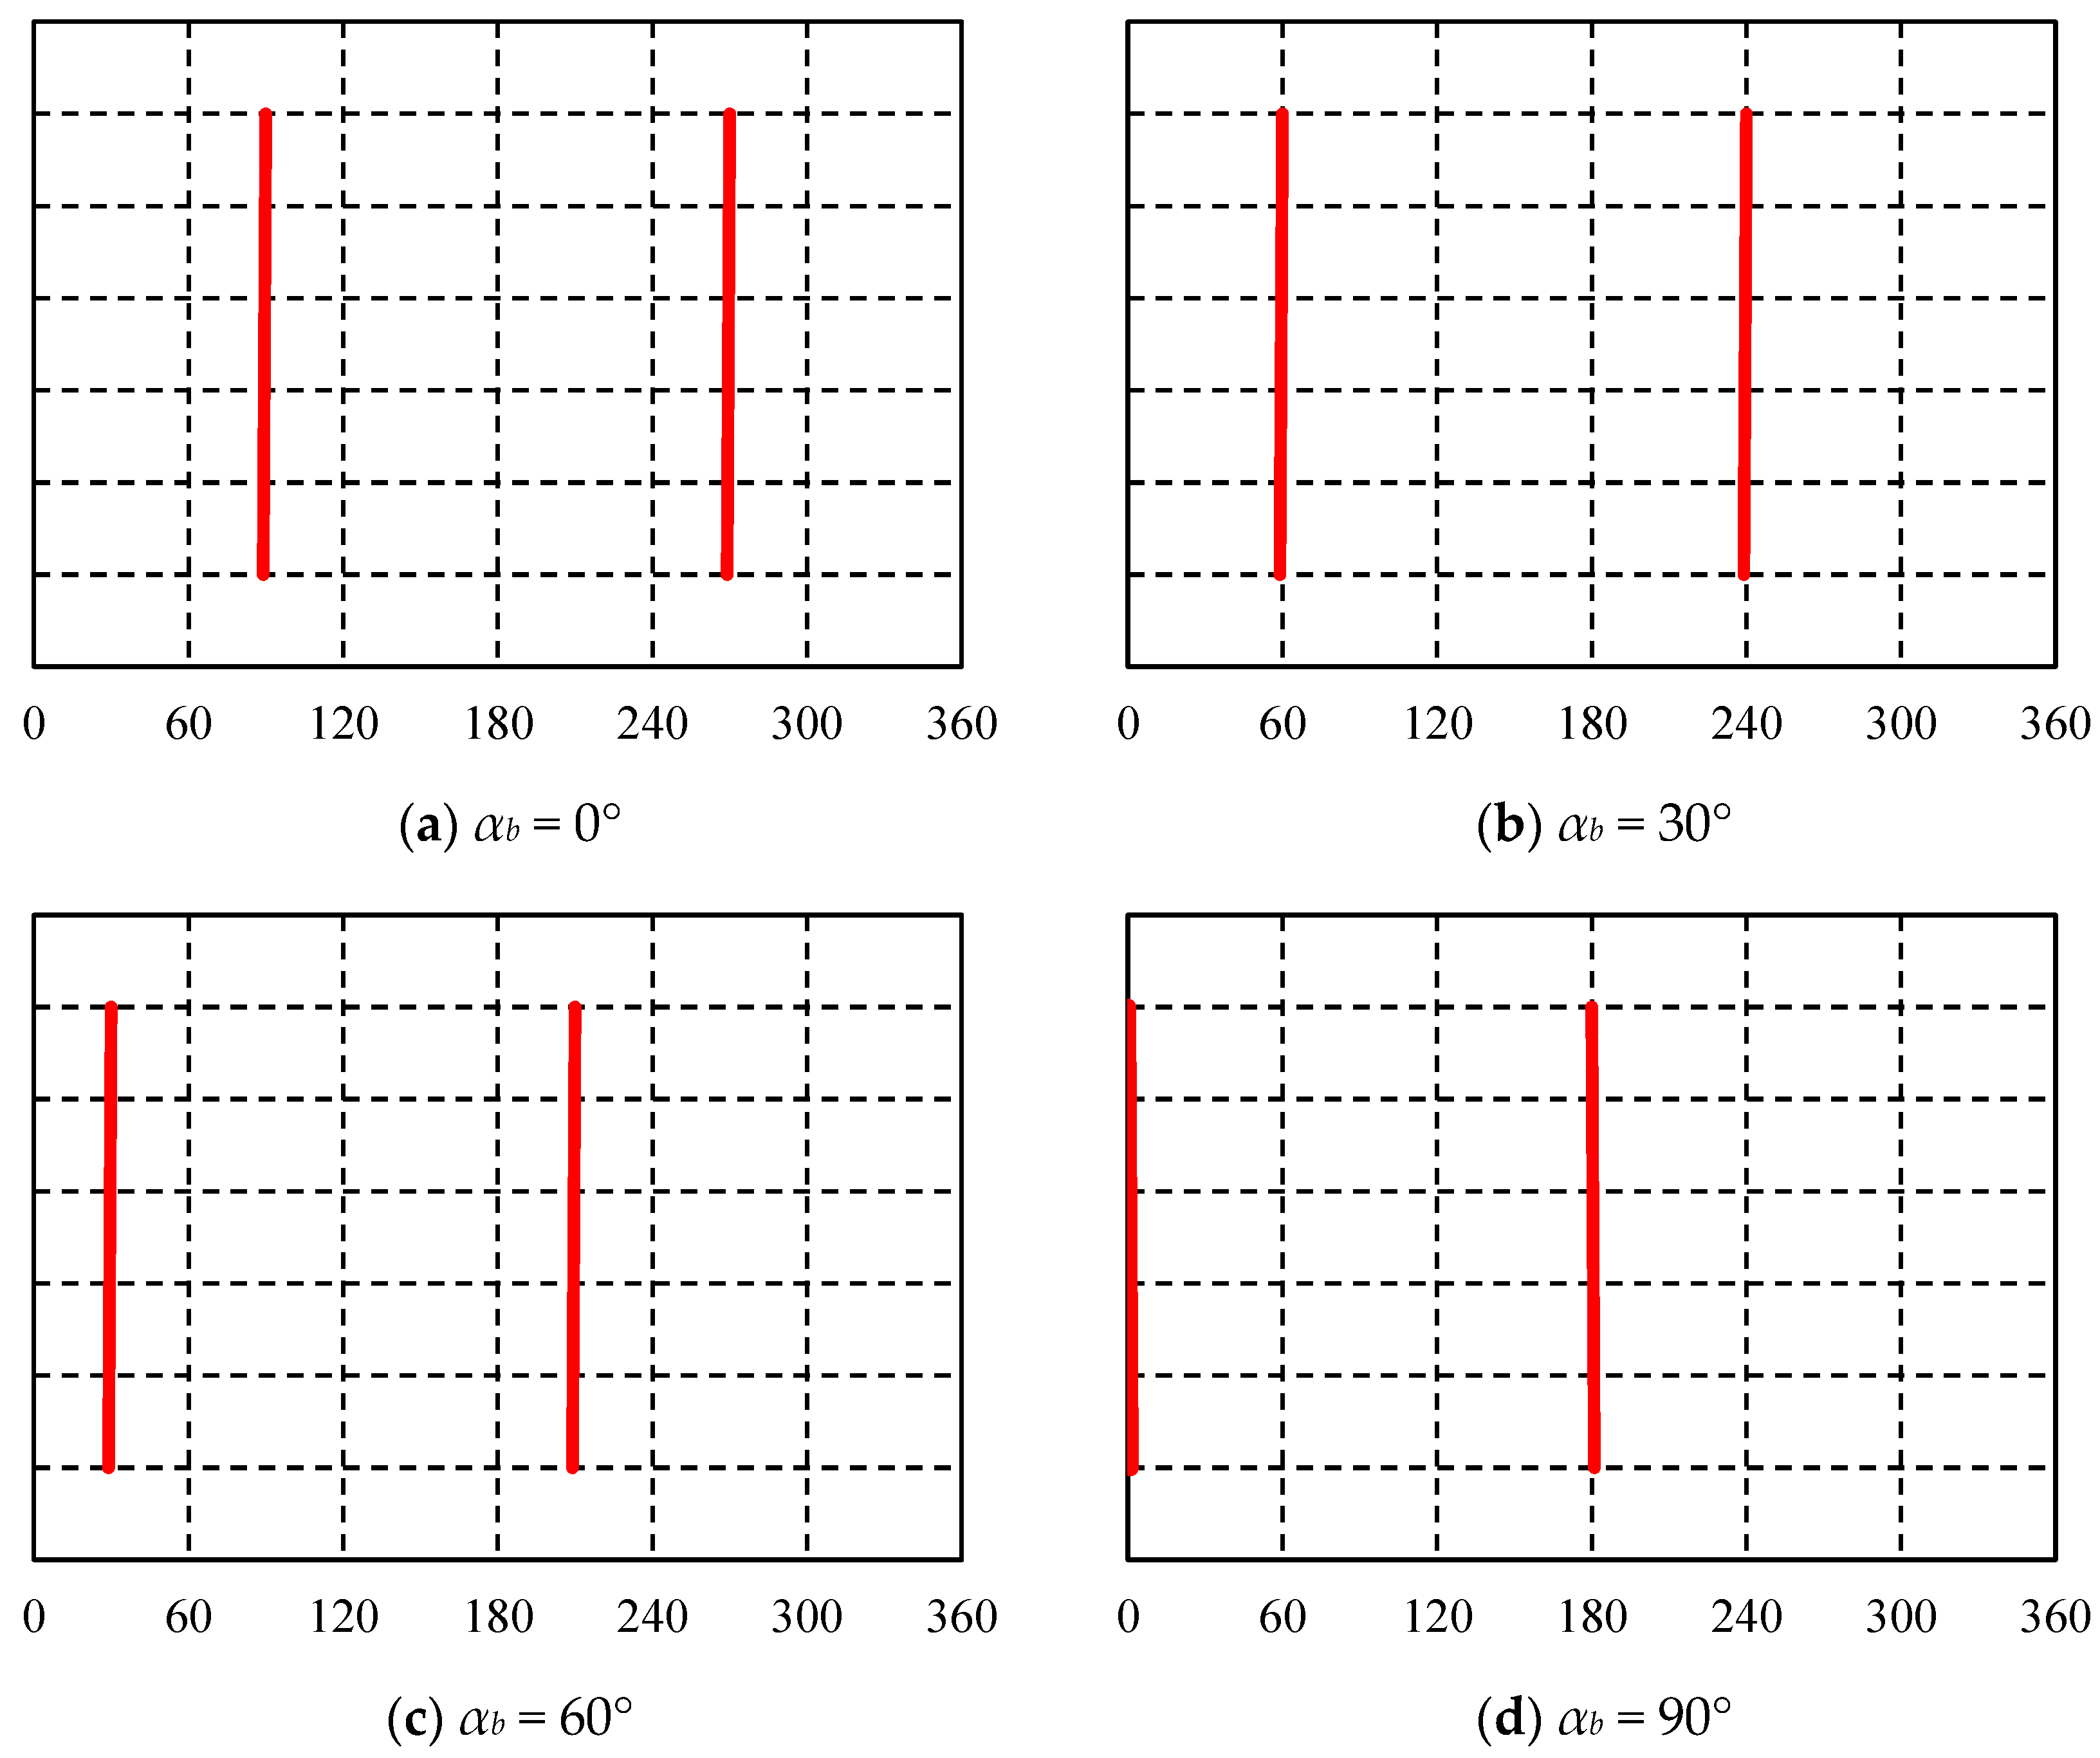
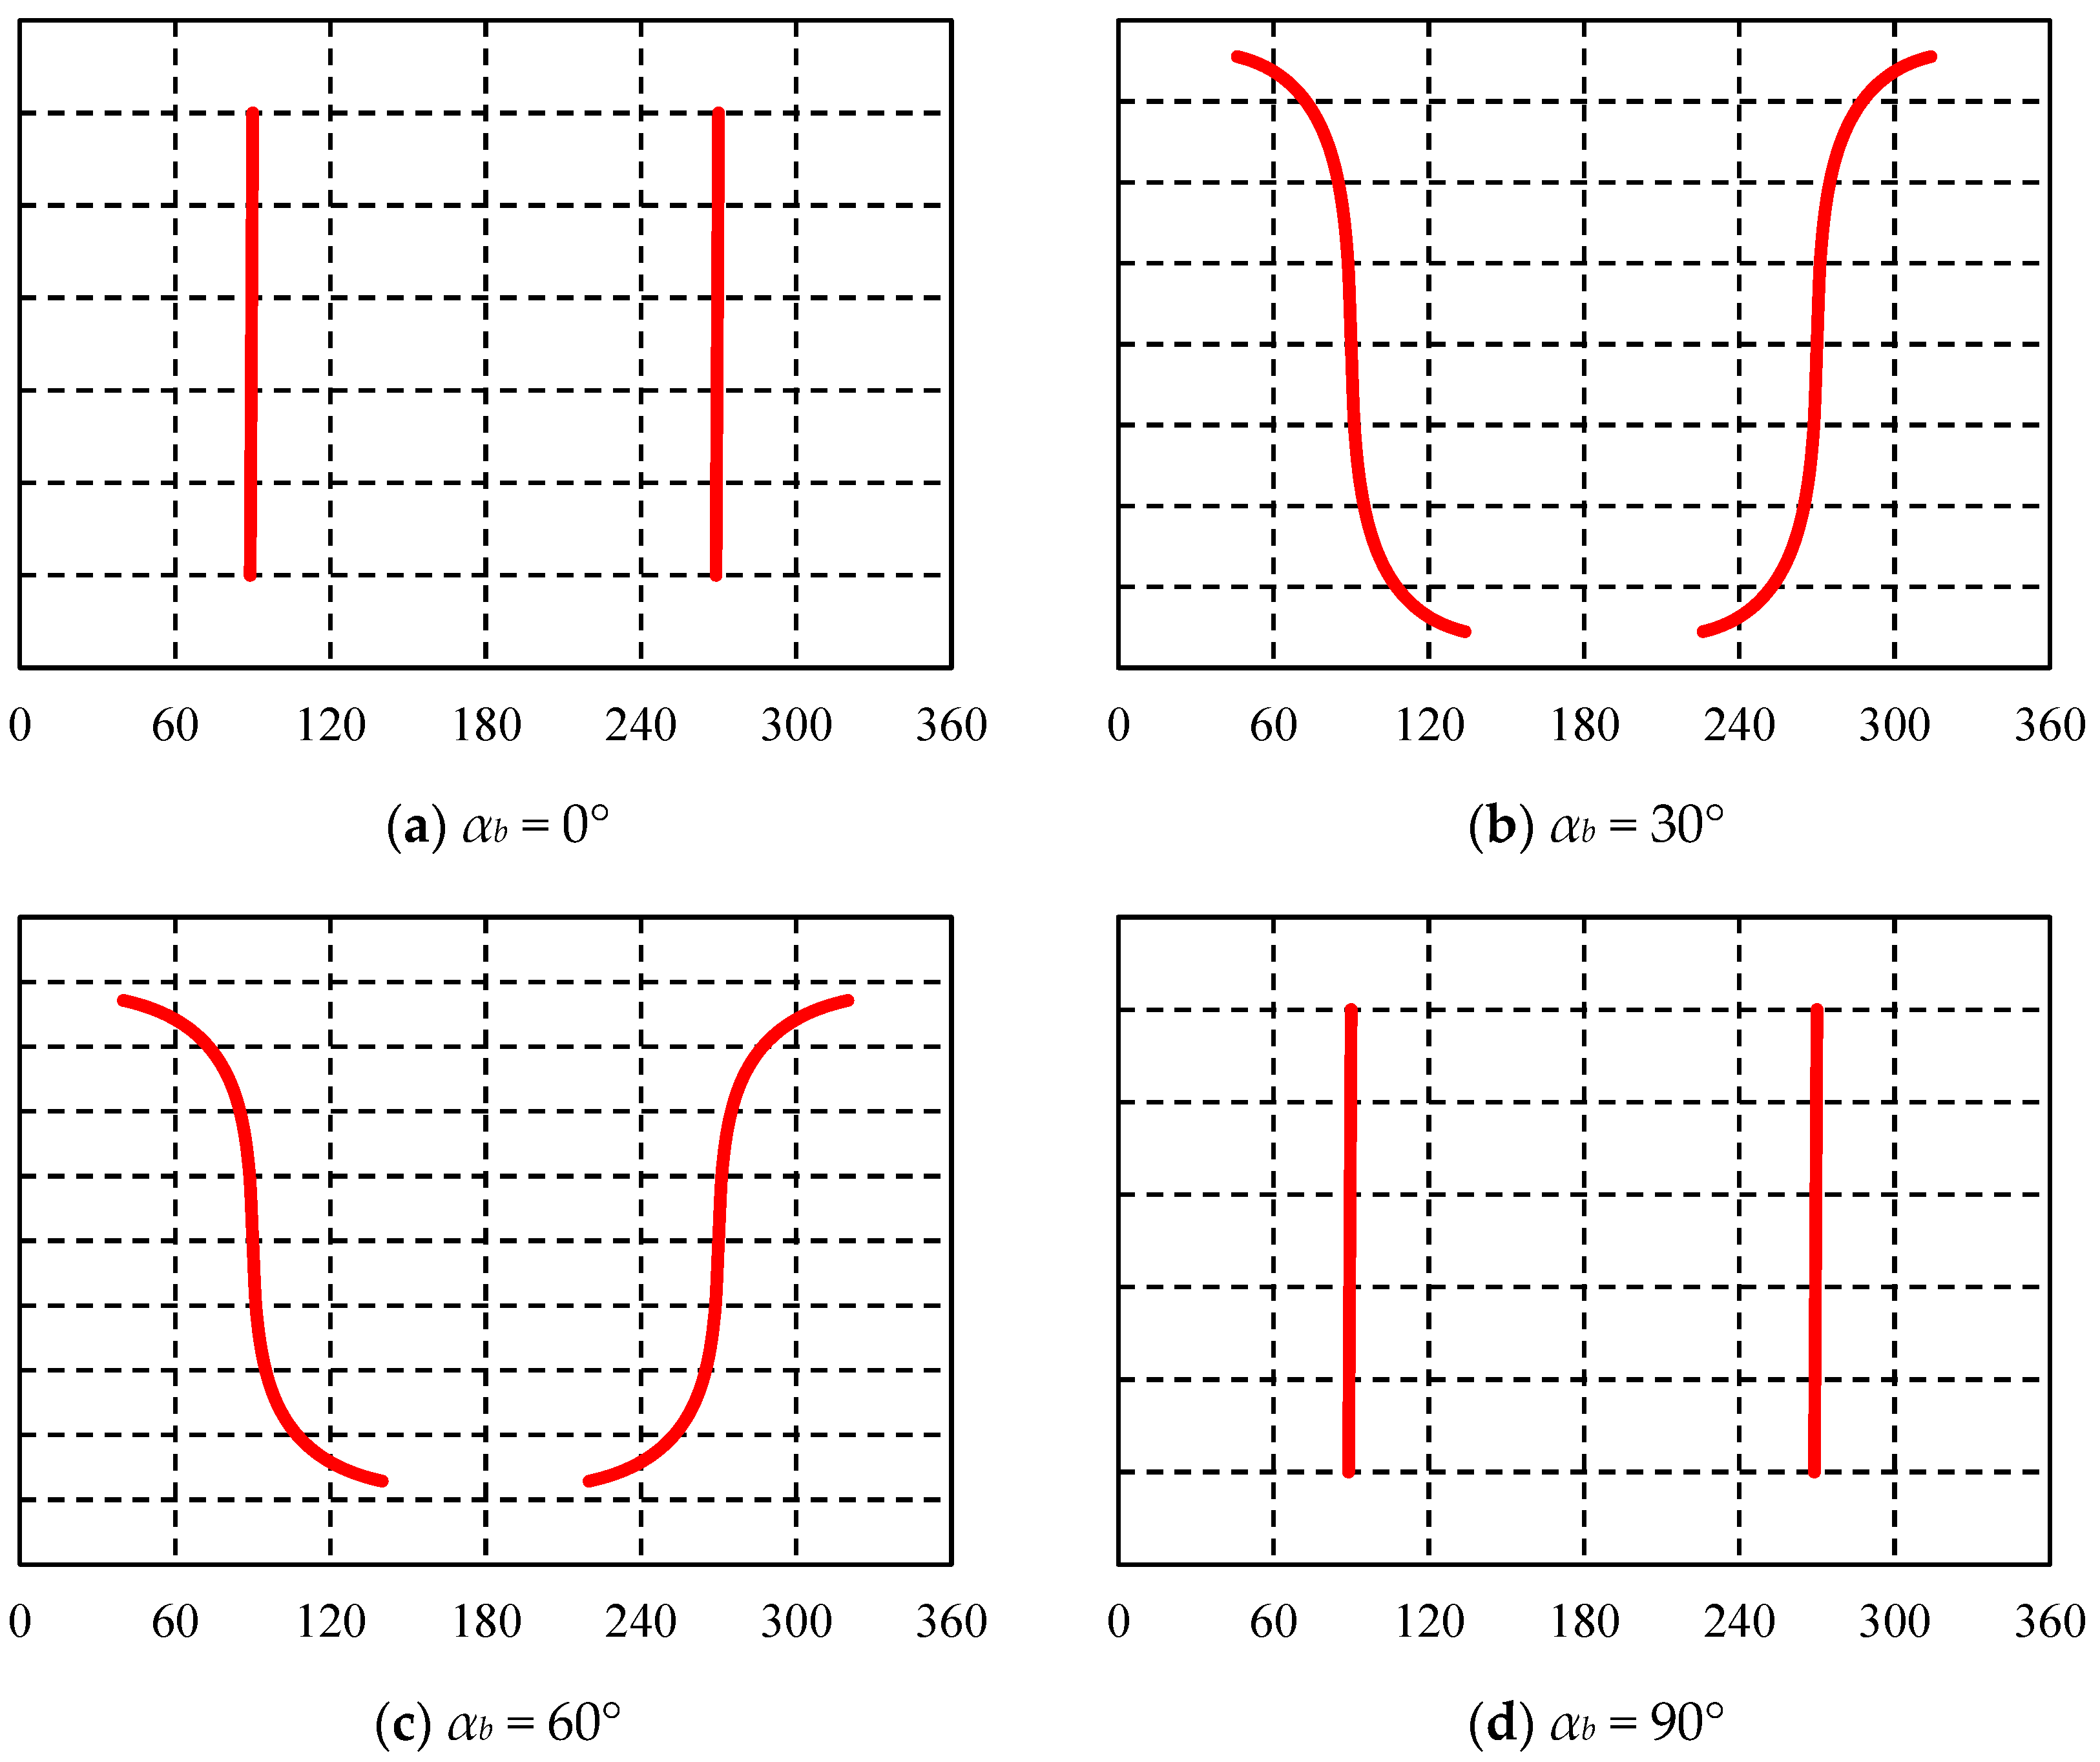
Figure 6 and Figure 7 illustrate the circumferential minimum principal stress and induced fracture characteristics around the vertical wellbore. When the azimuth angle of the wellbore is 0°, the minimum principal stress around the wellbore reaches its minimum value in the direction of the maximum horizontal stress. Additionally, the induced fractures always maintain a 0° angle with respect to the wellbore axis. Therefore, two vertically oriented fractures, spaced 180° apart and symmetrically distributed, are formed around the wellbore in the direction of the maximum horizontal stress. As the azimuth angle of the wellbore increases, the induced fractures around the vertical wellbore always appear in the direction of the maximum horizontal stress. Moreover, since no shear stress is generated in the vertical wellbore, the induced fractures always exhibit a vertical orientation.
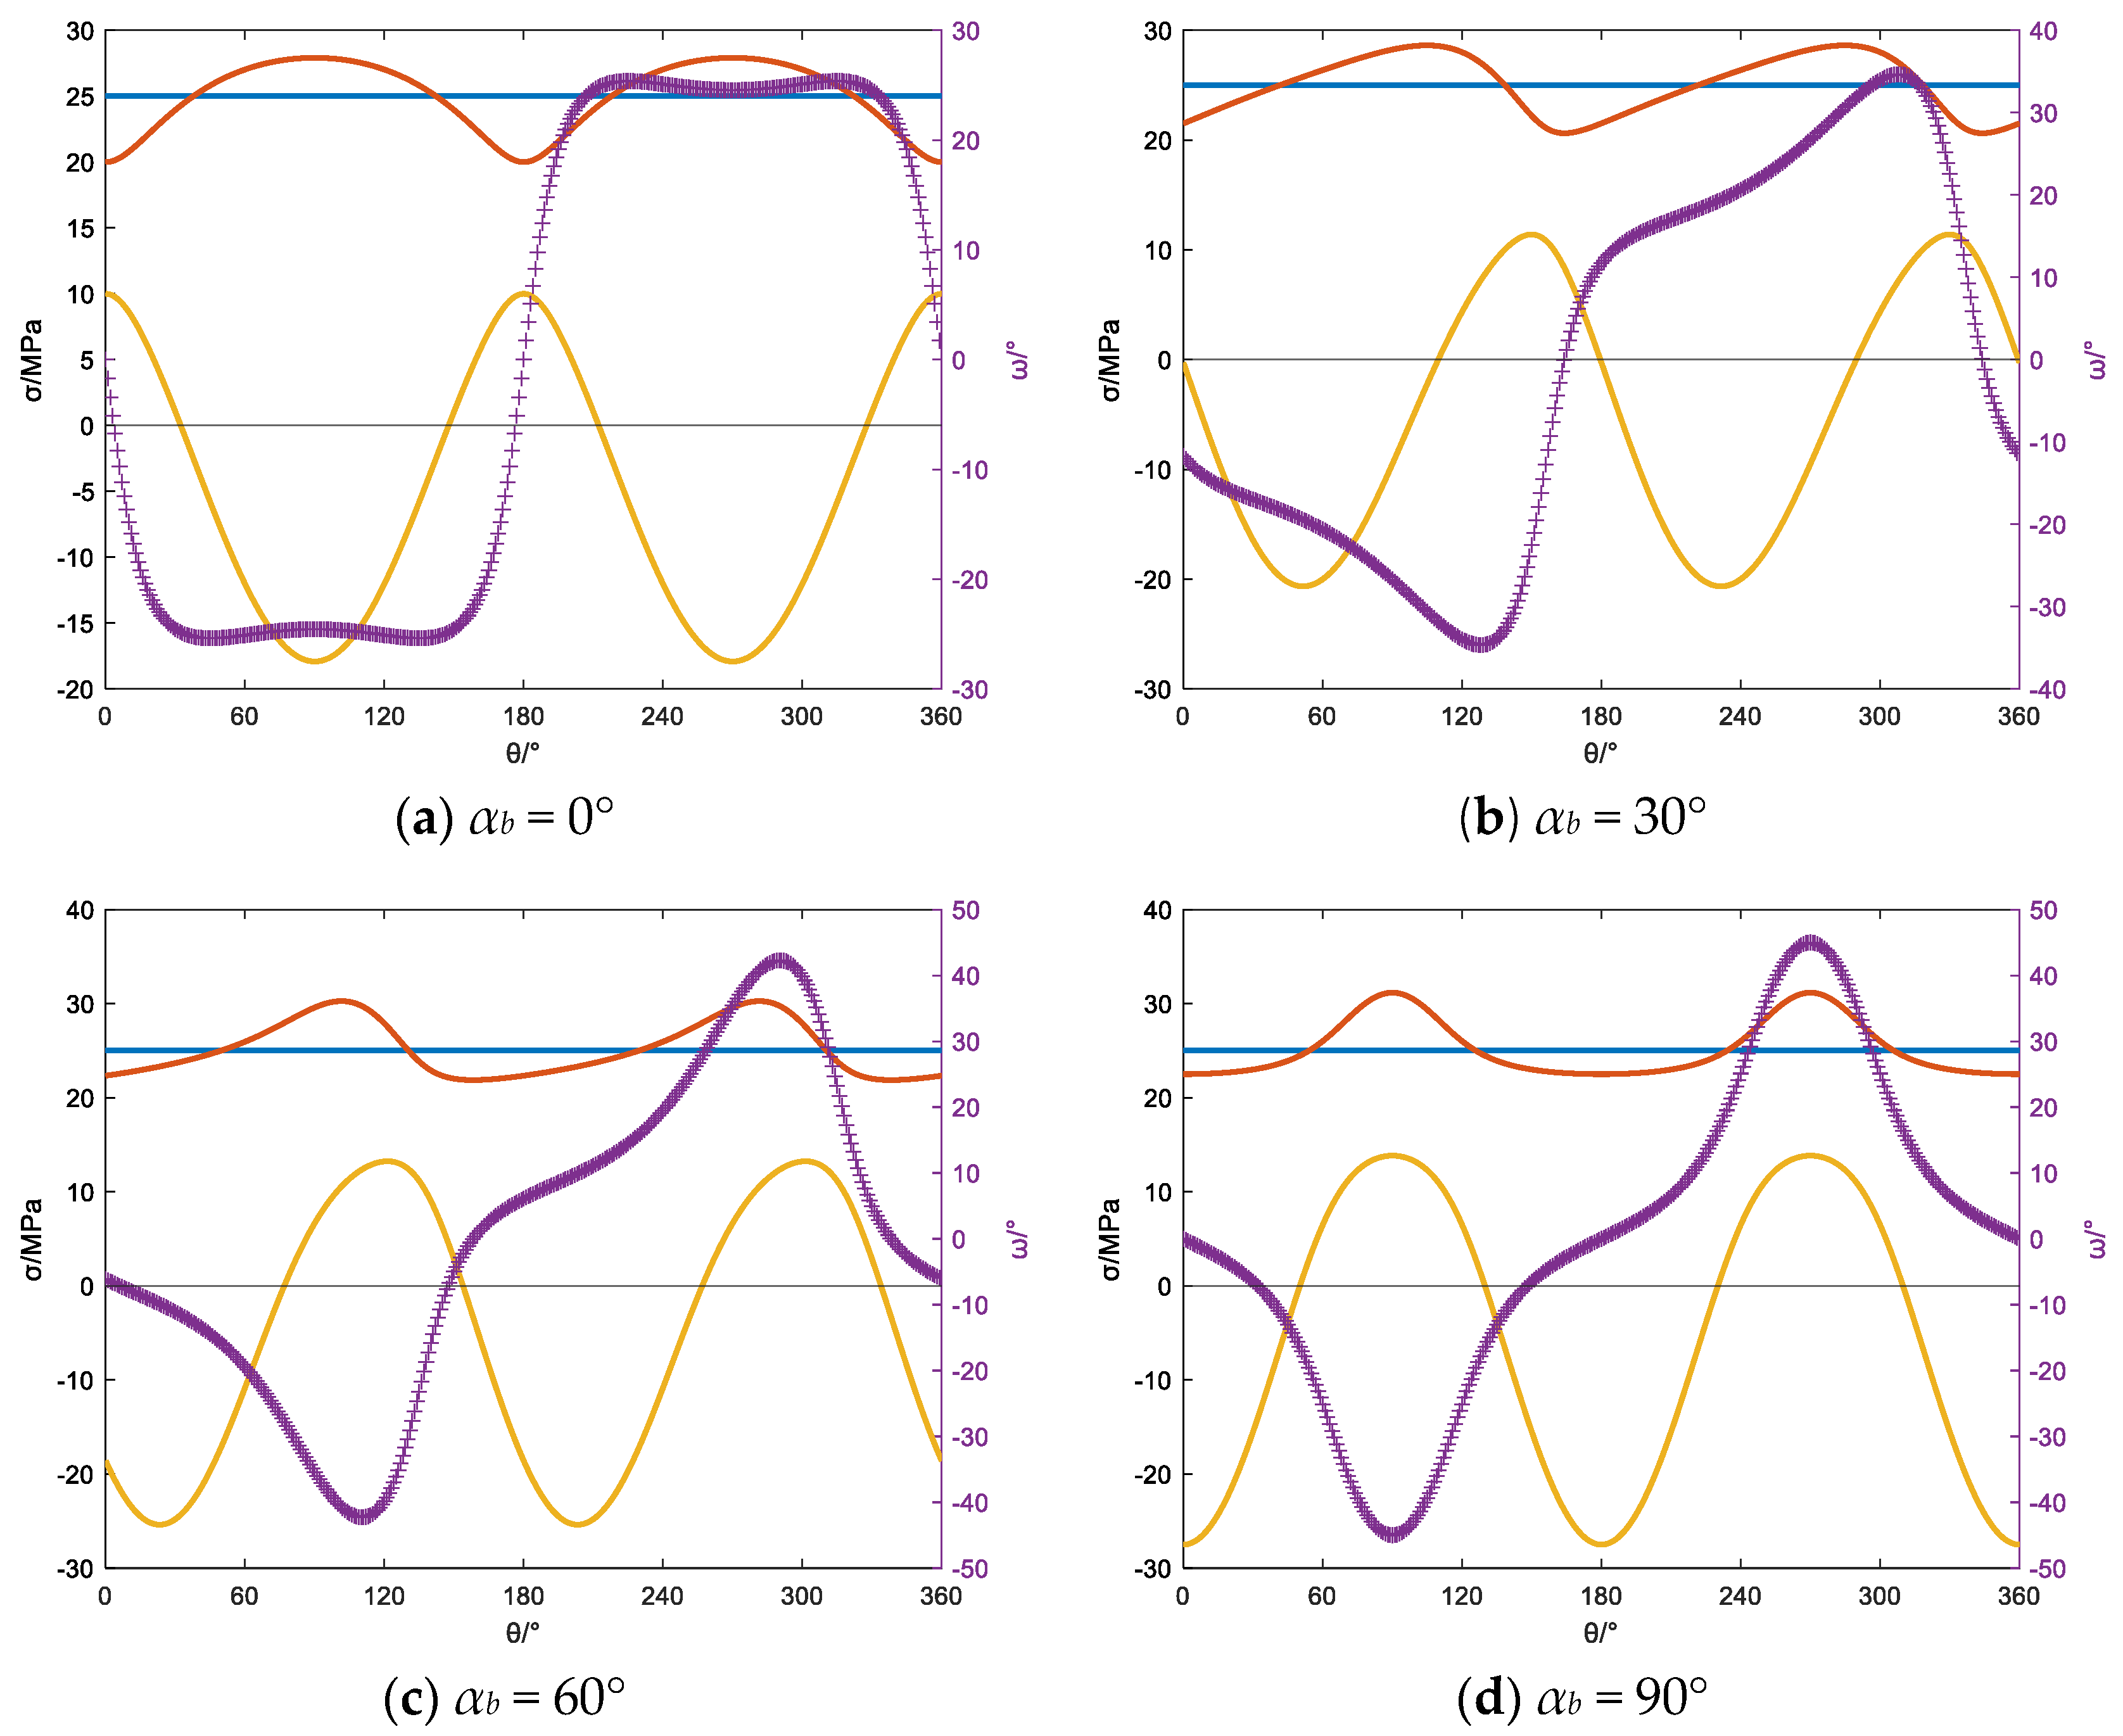
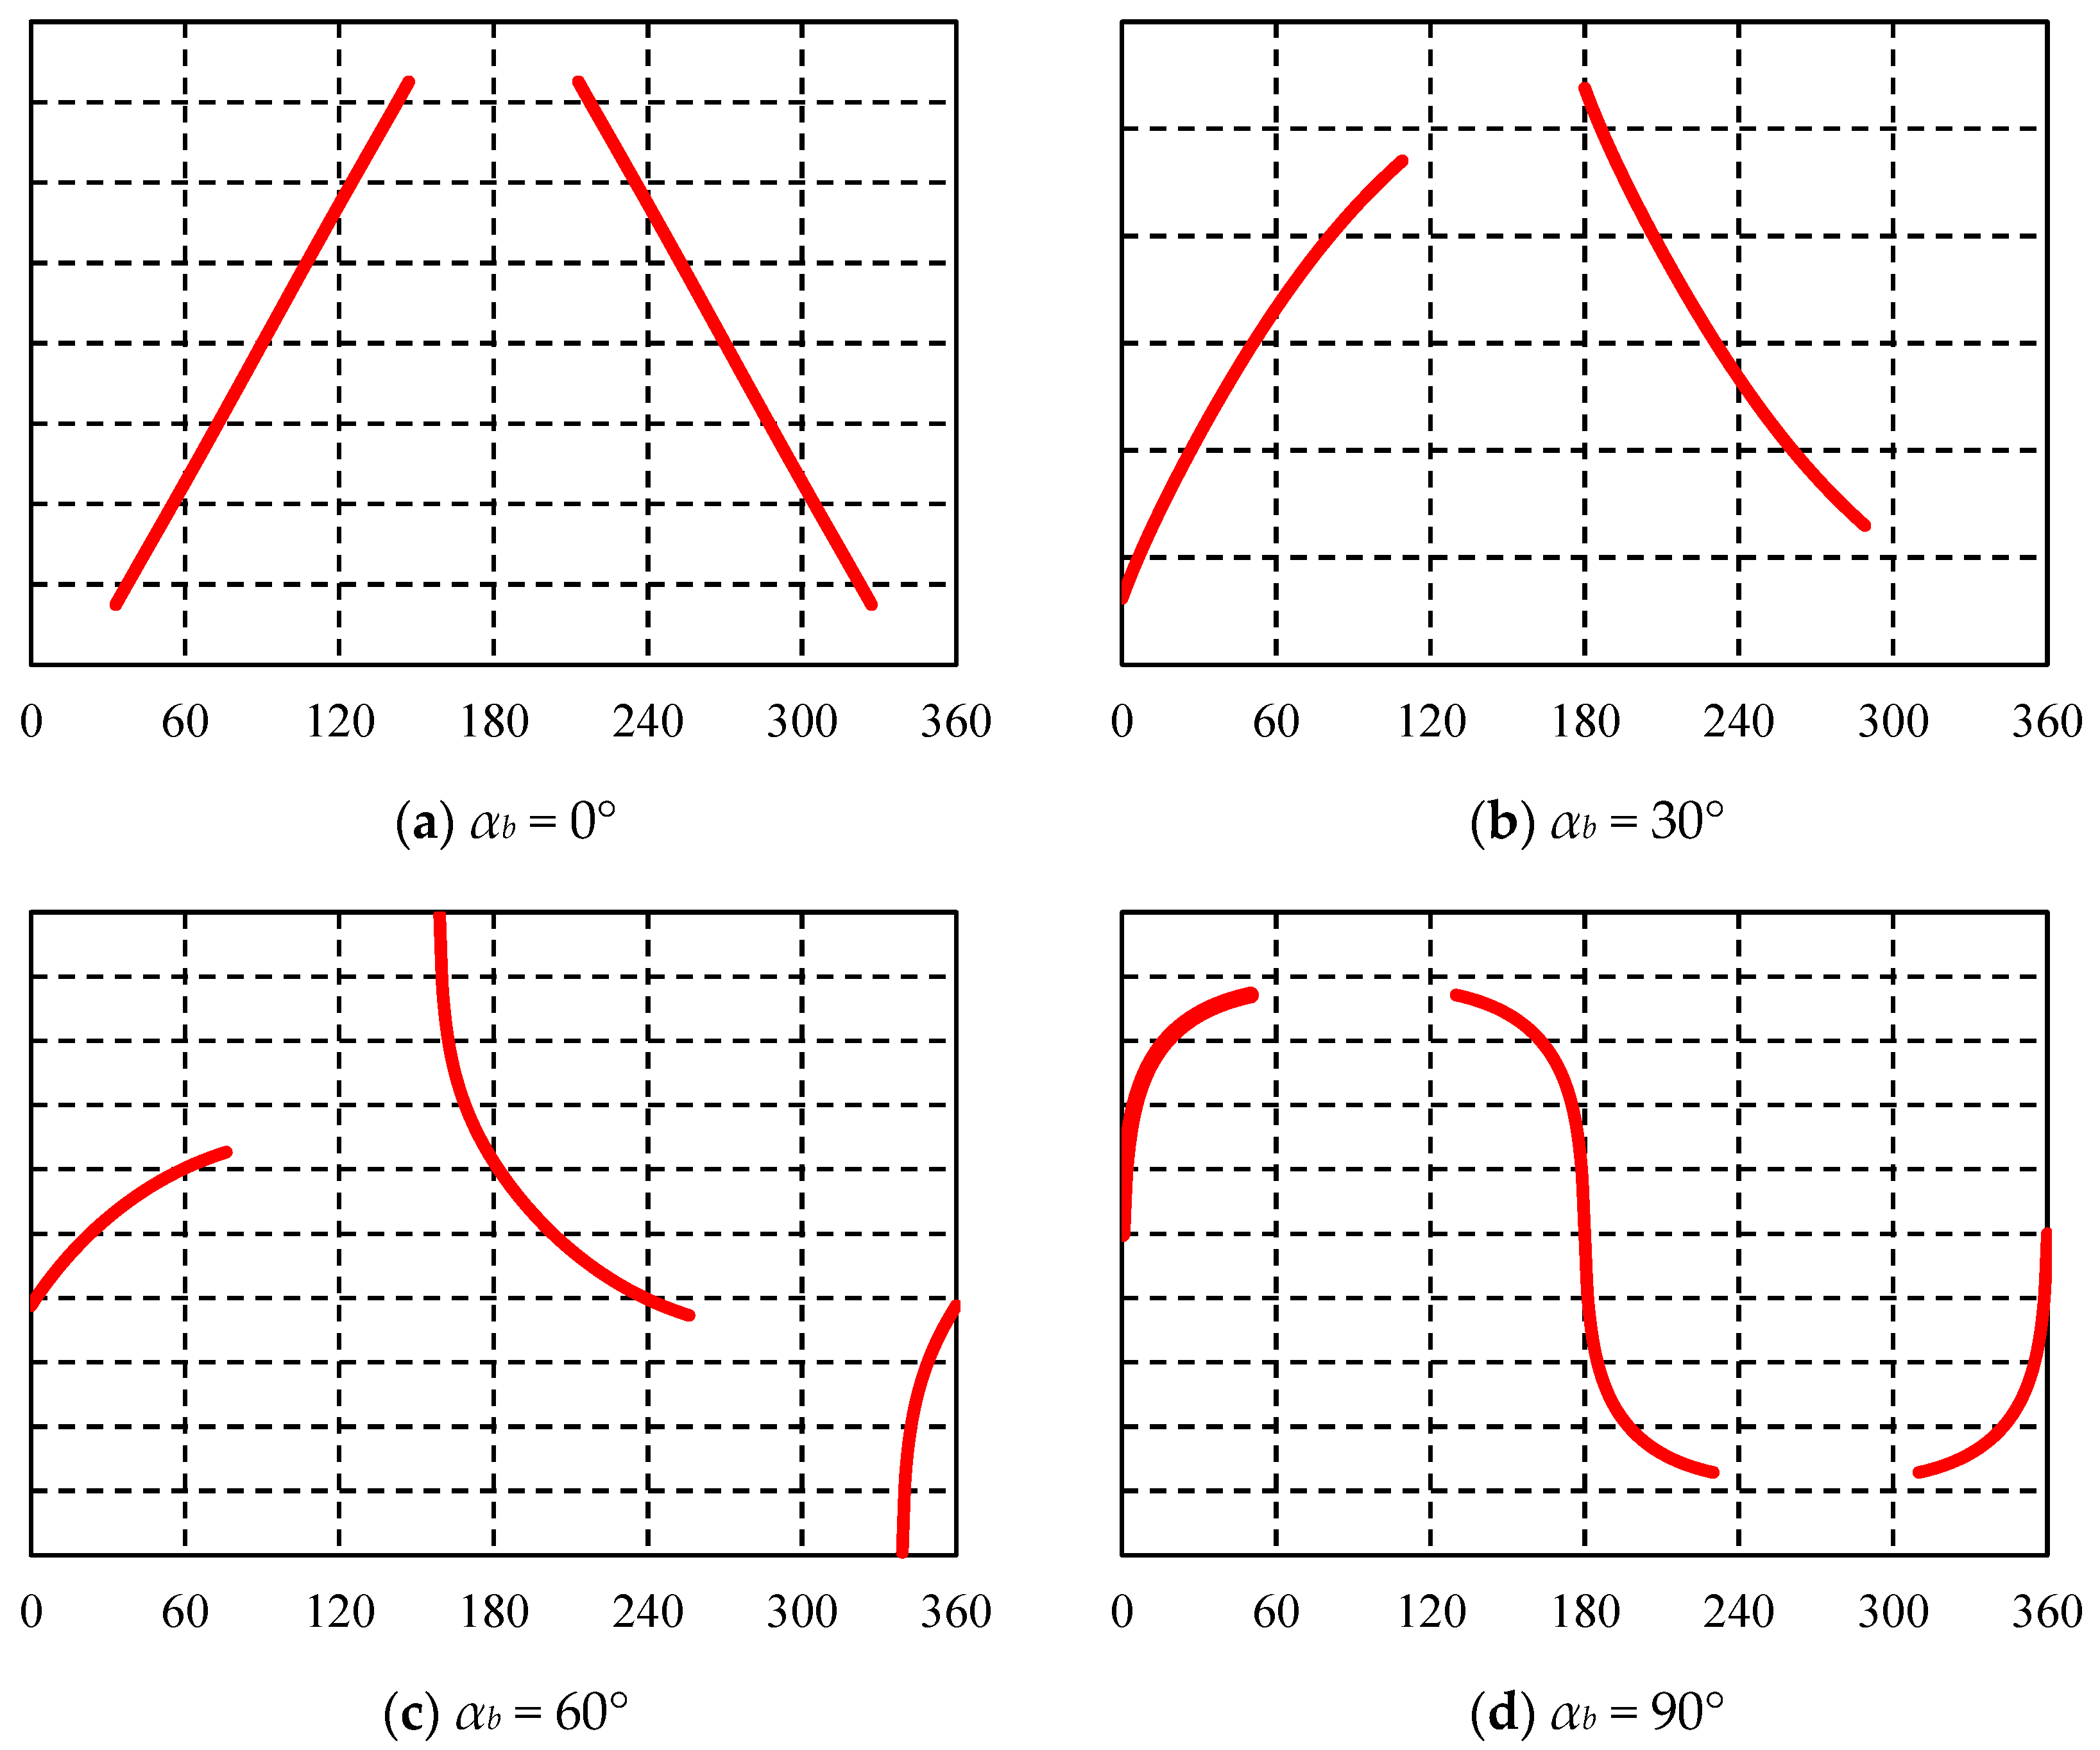
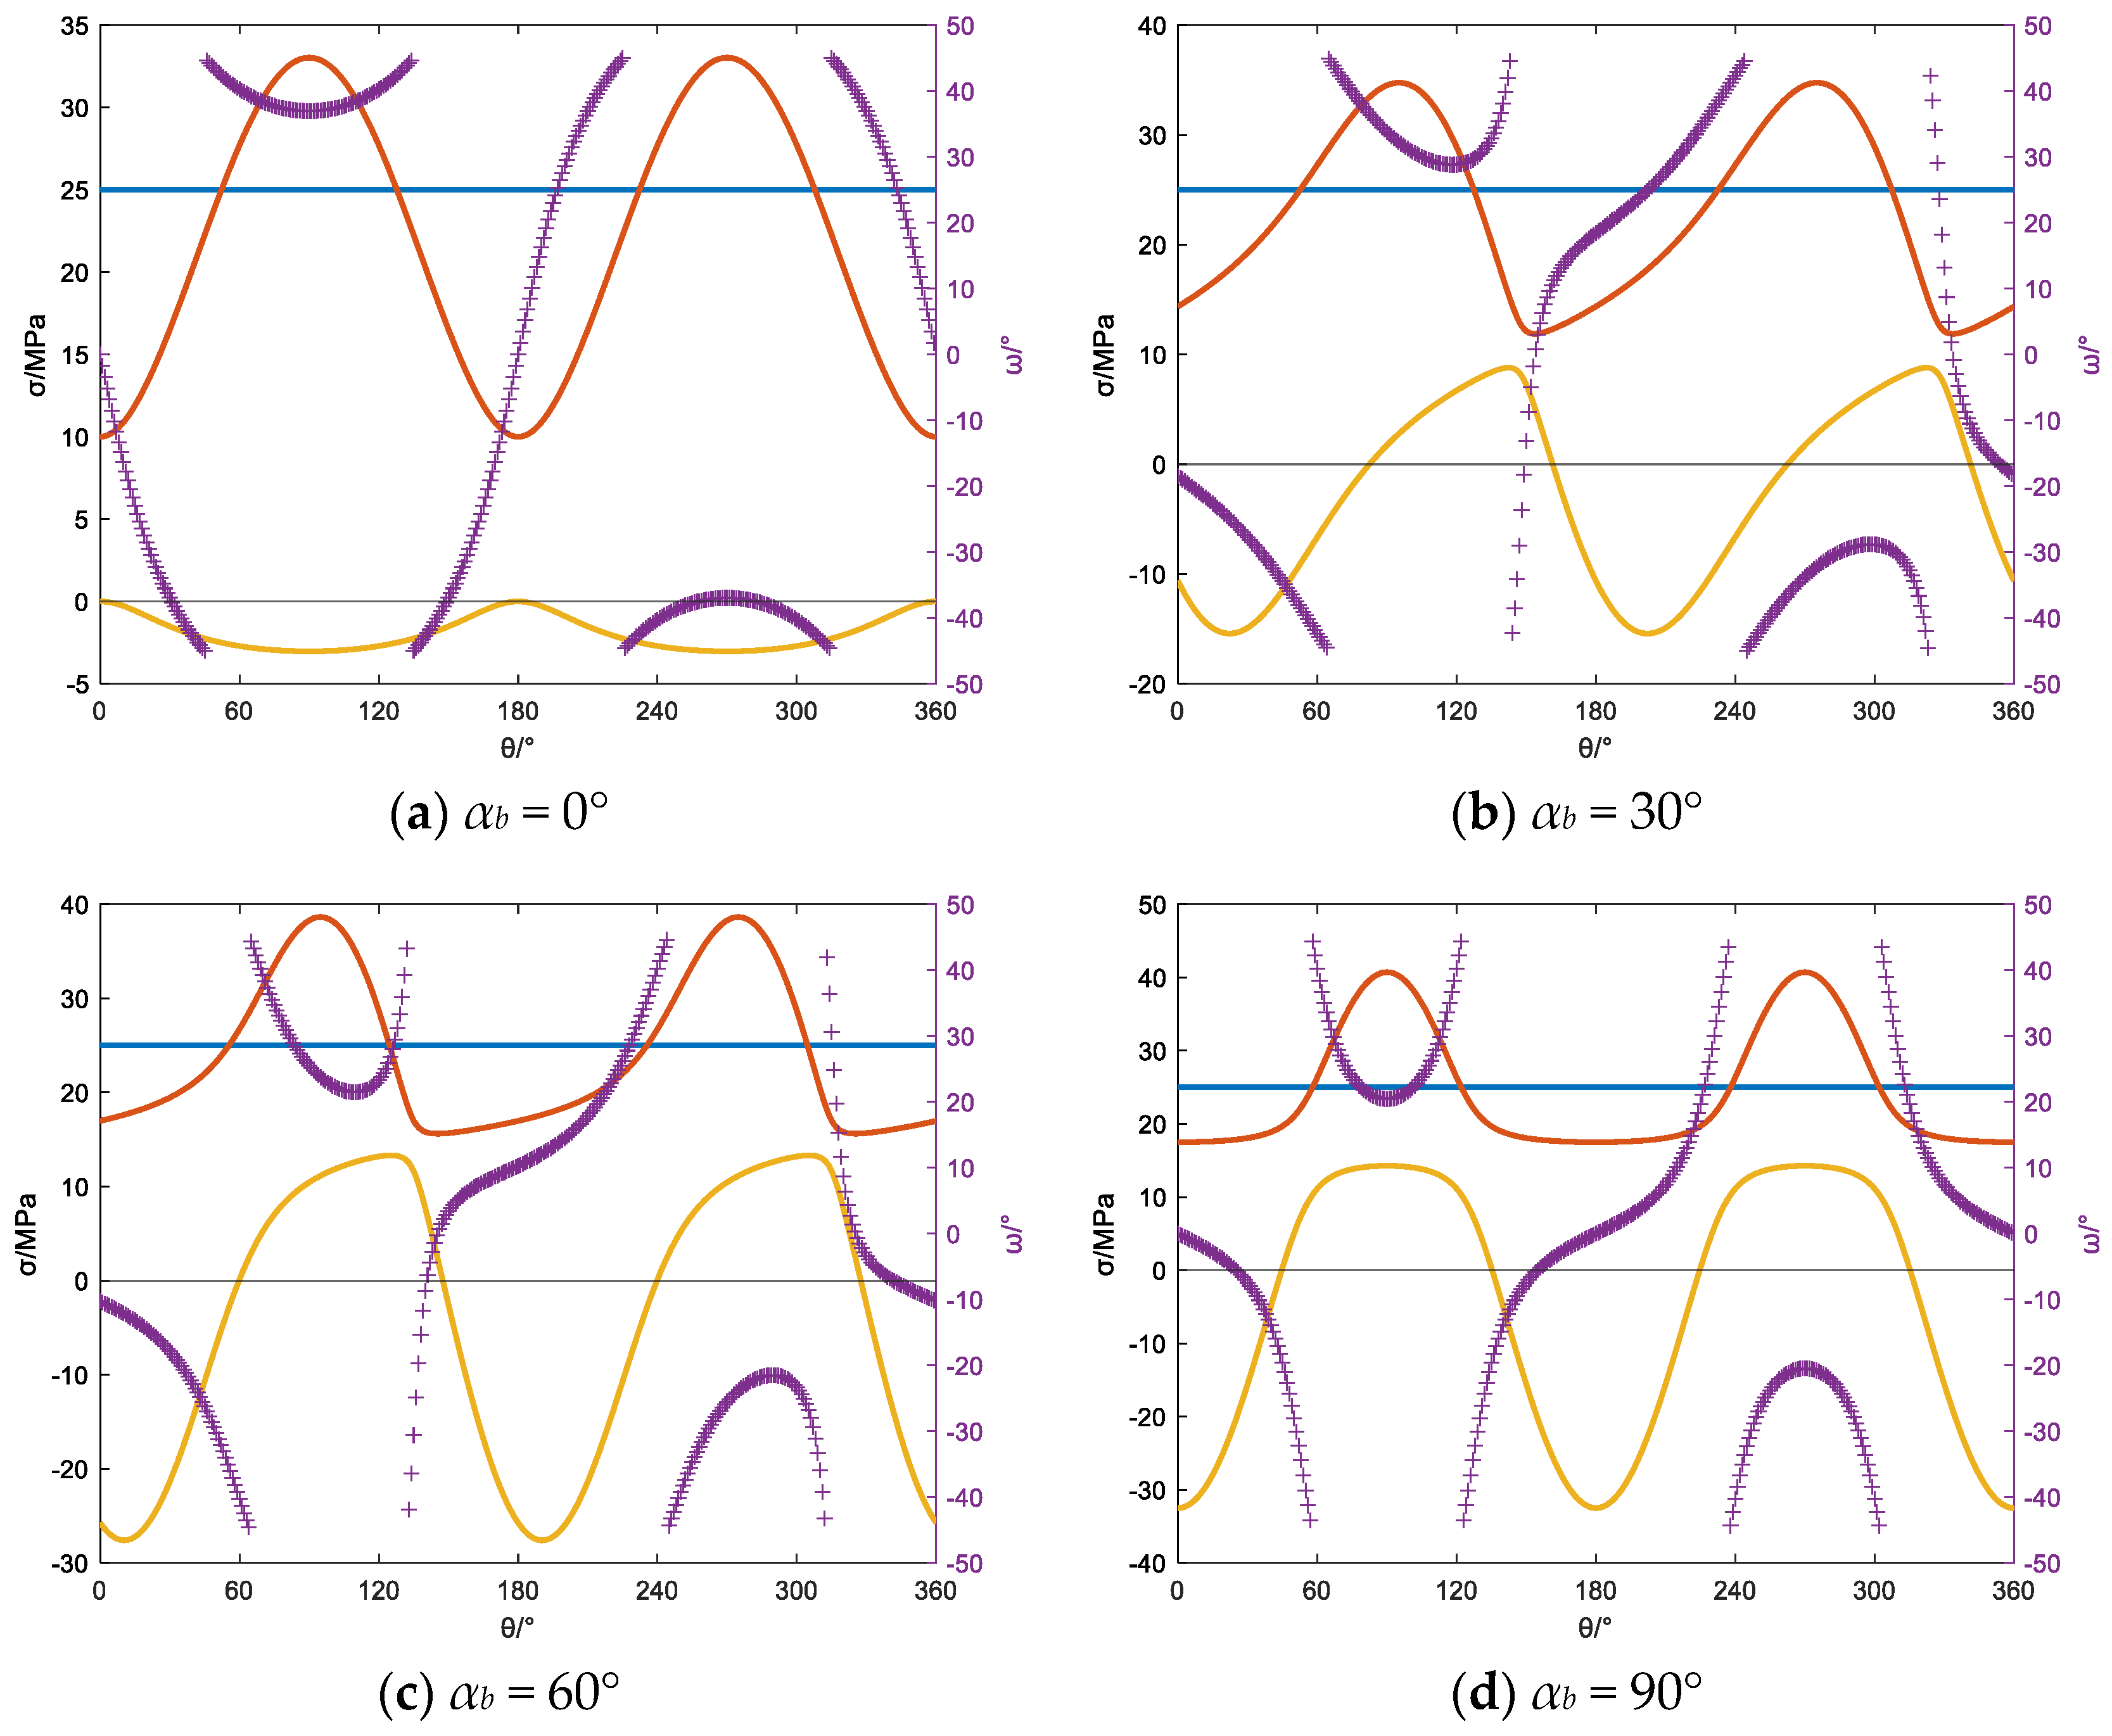
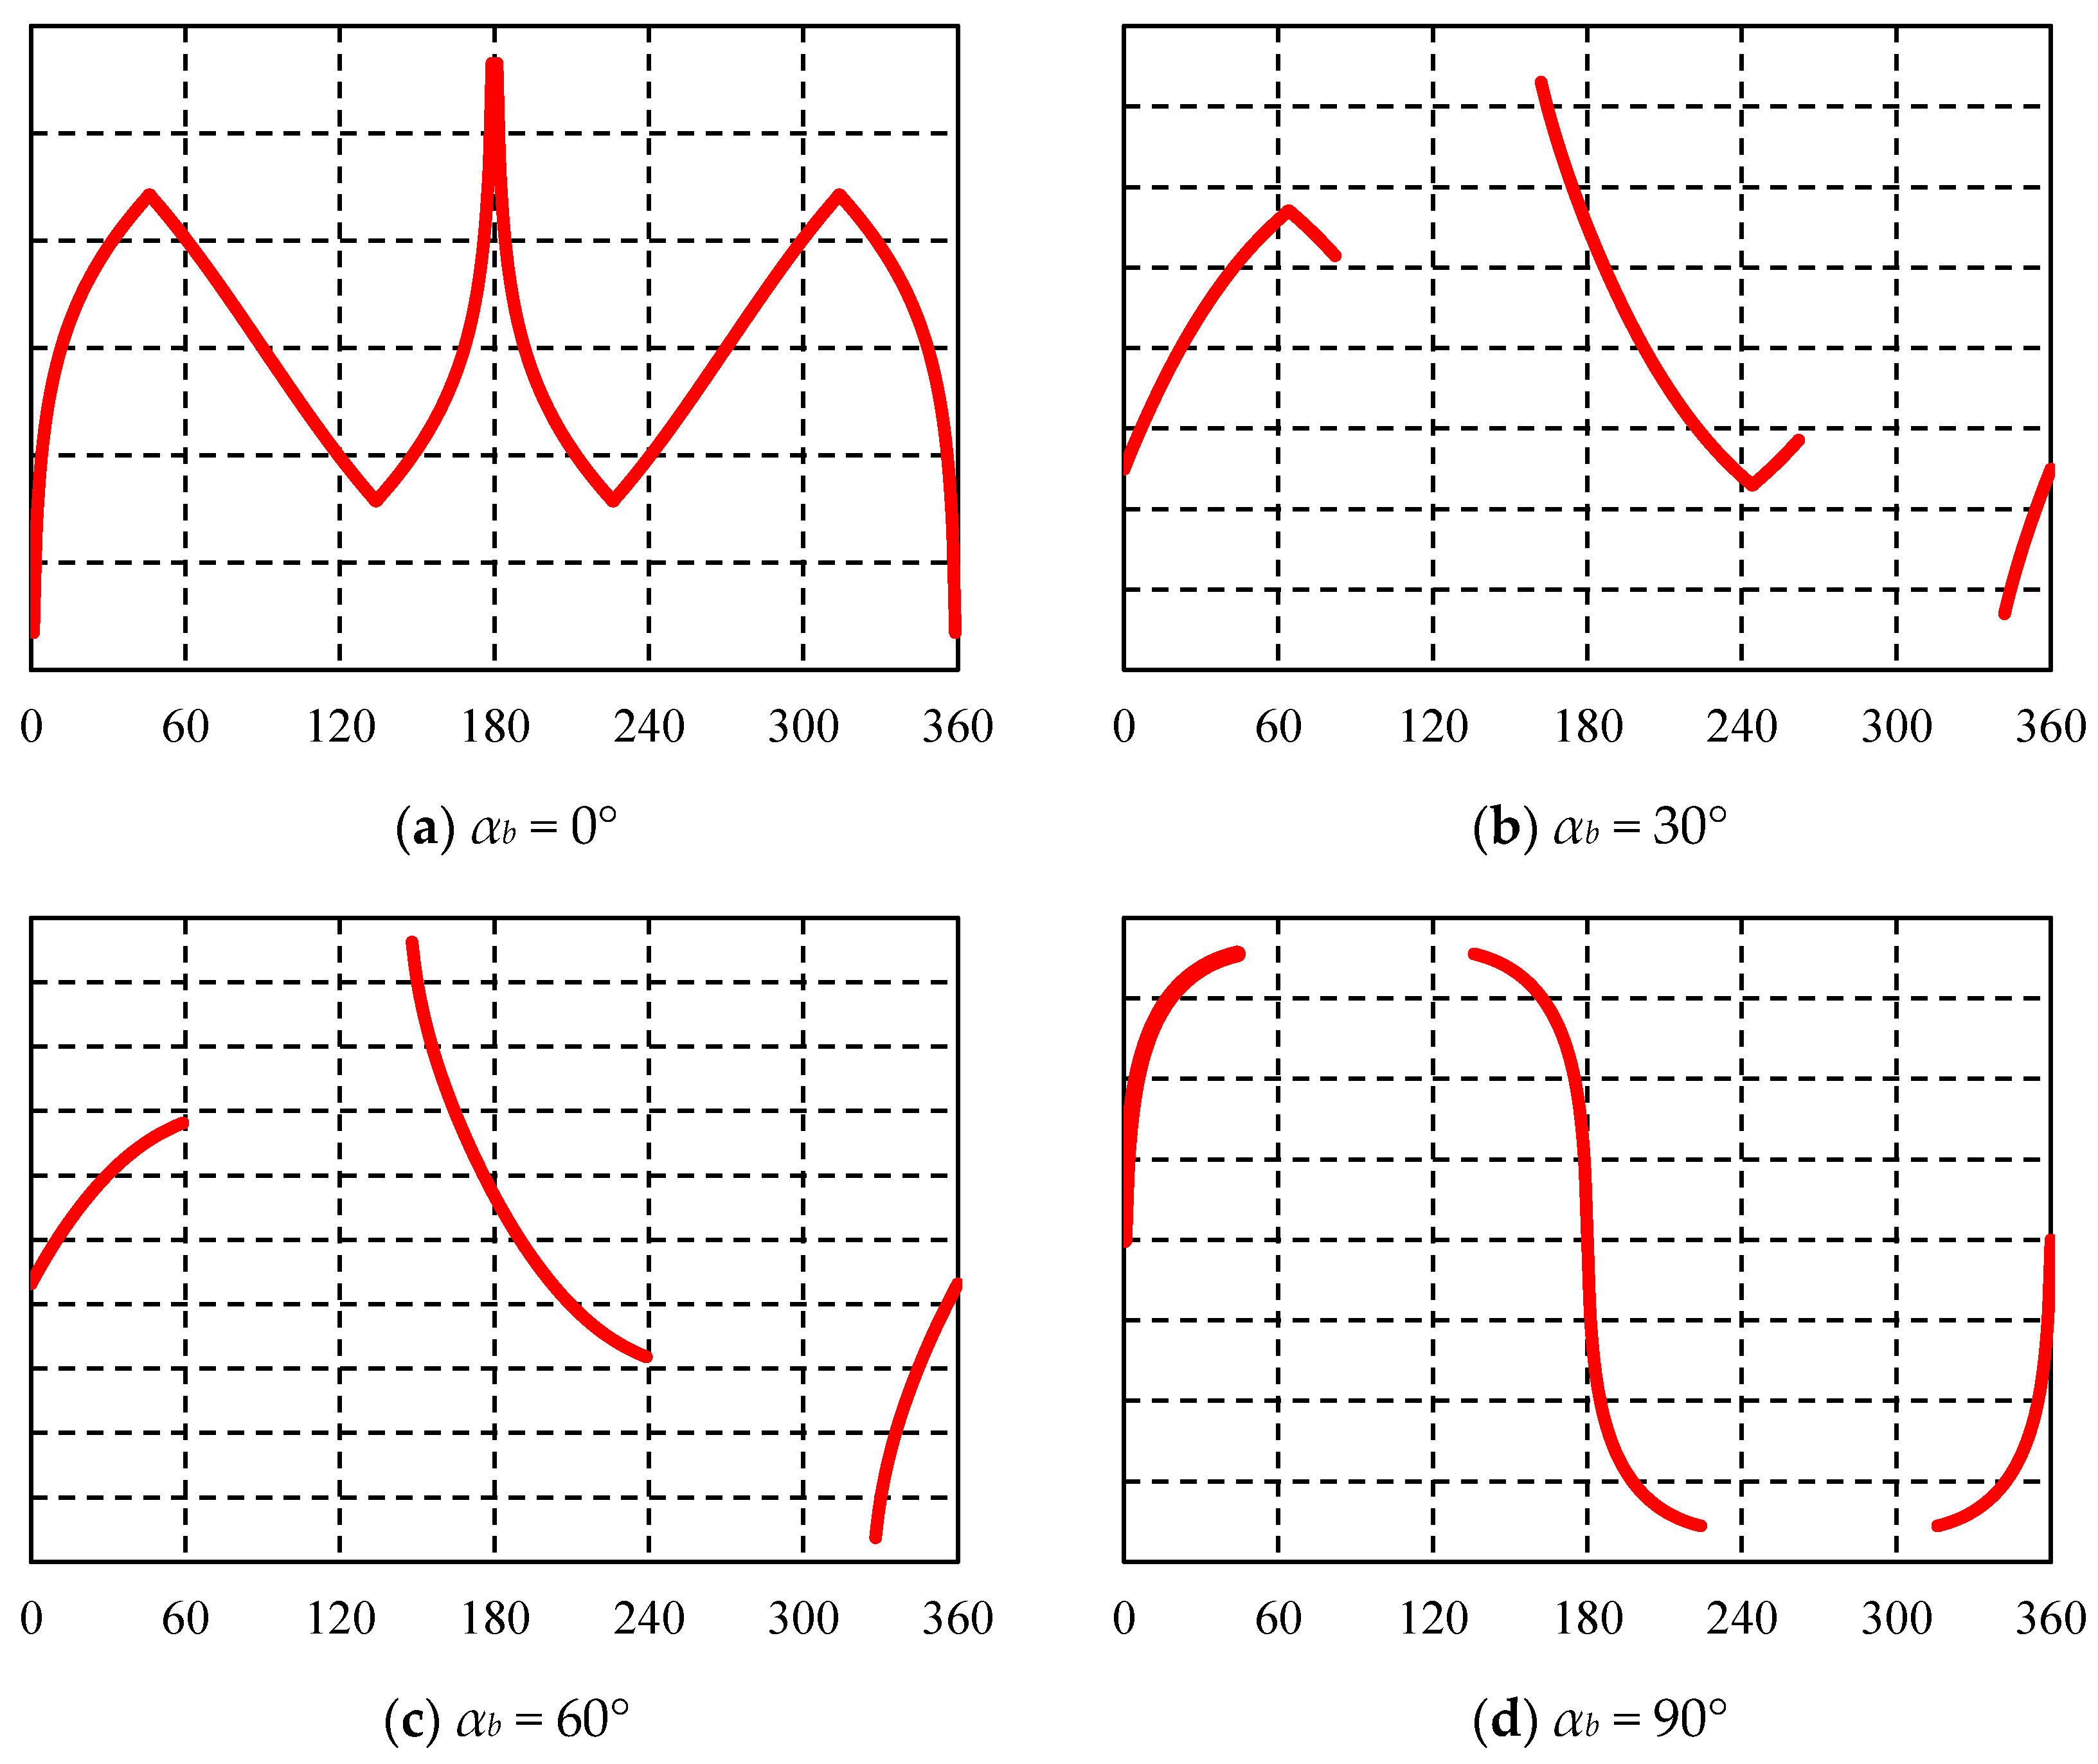
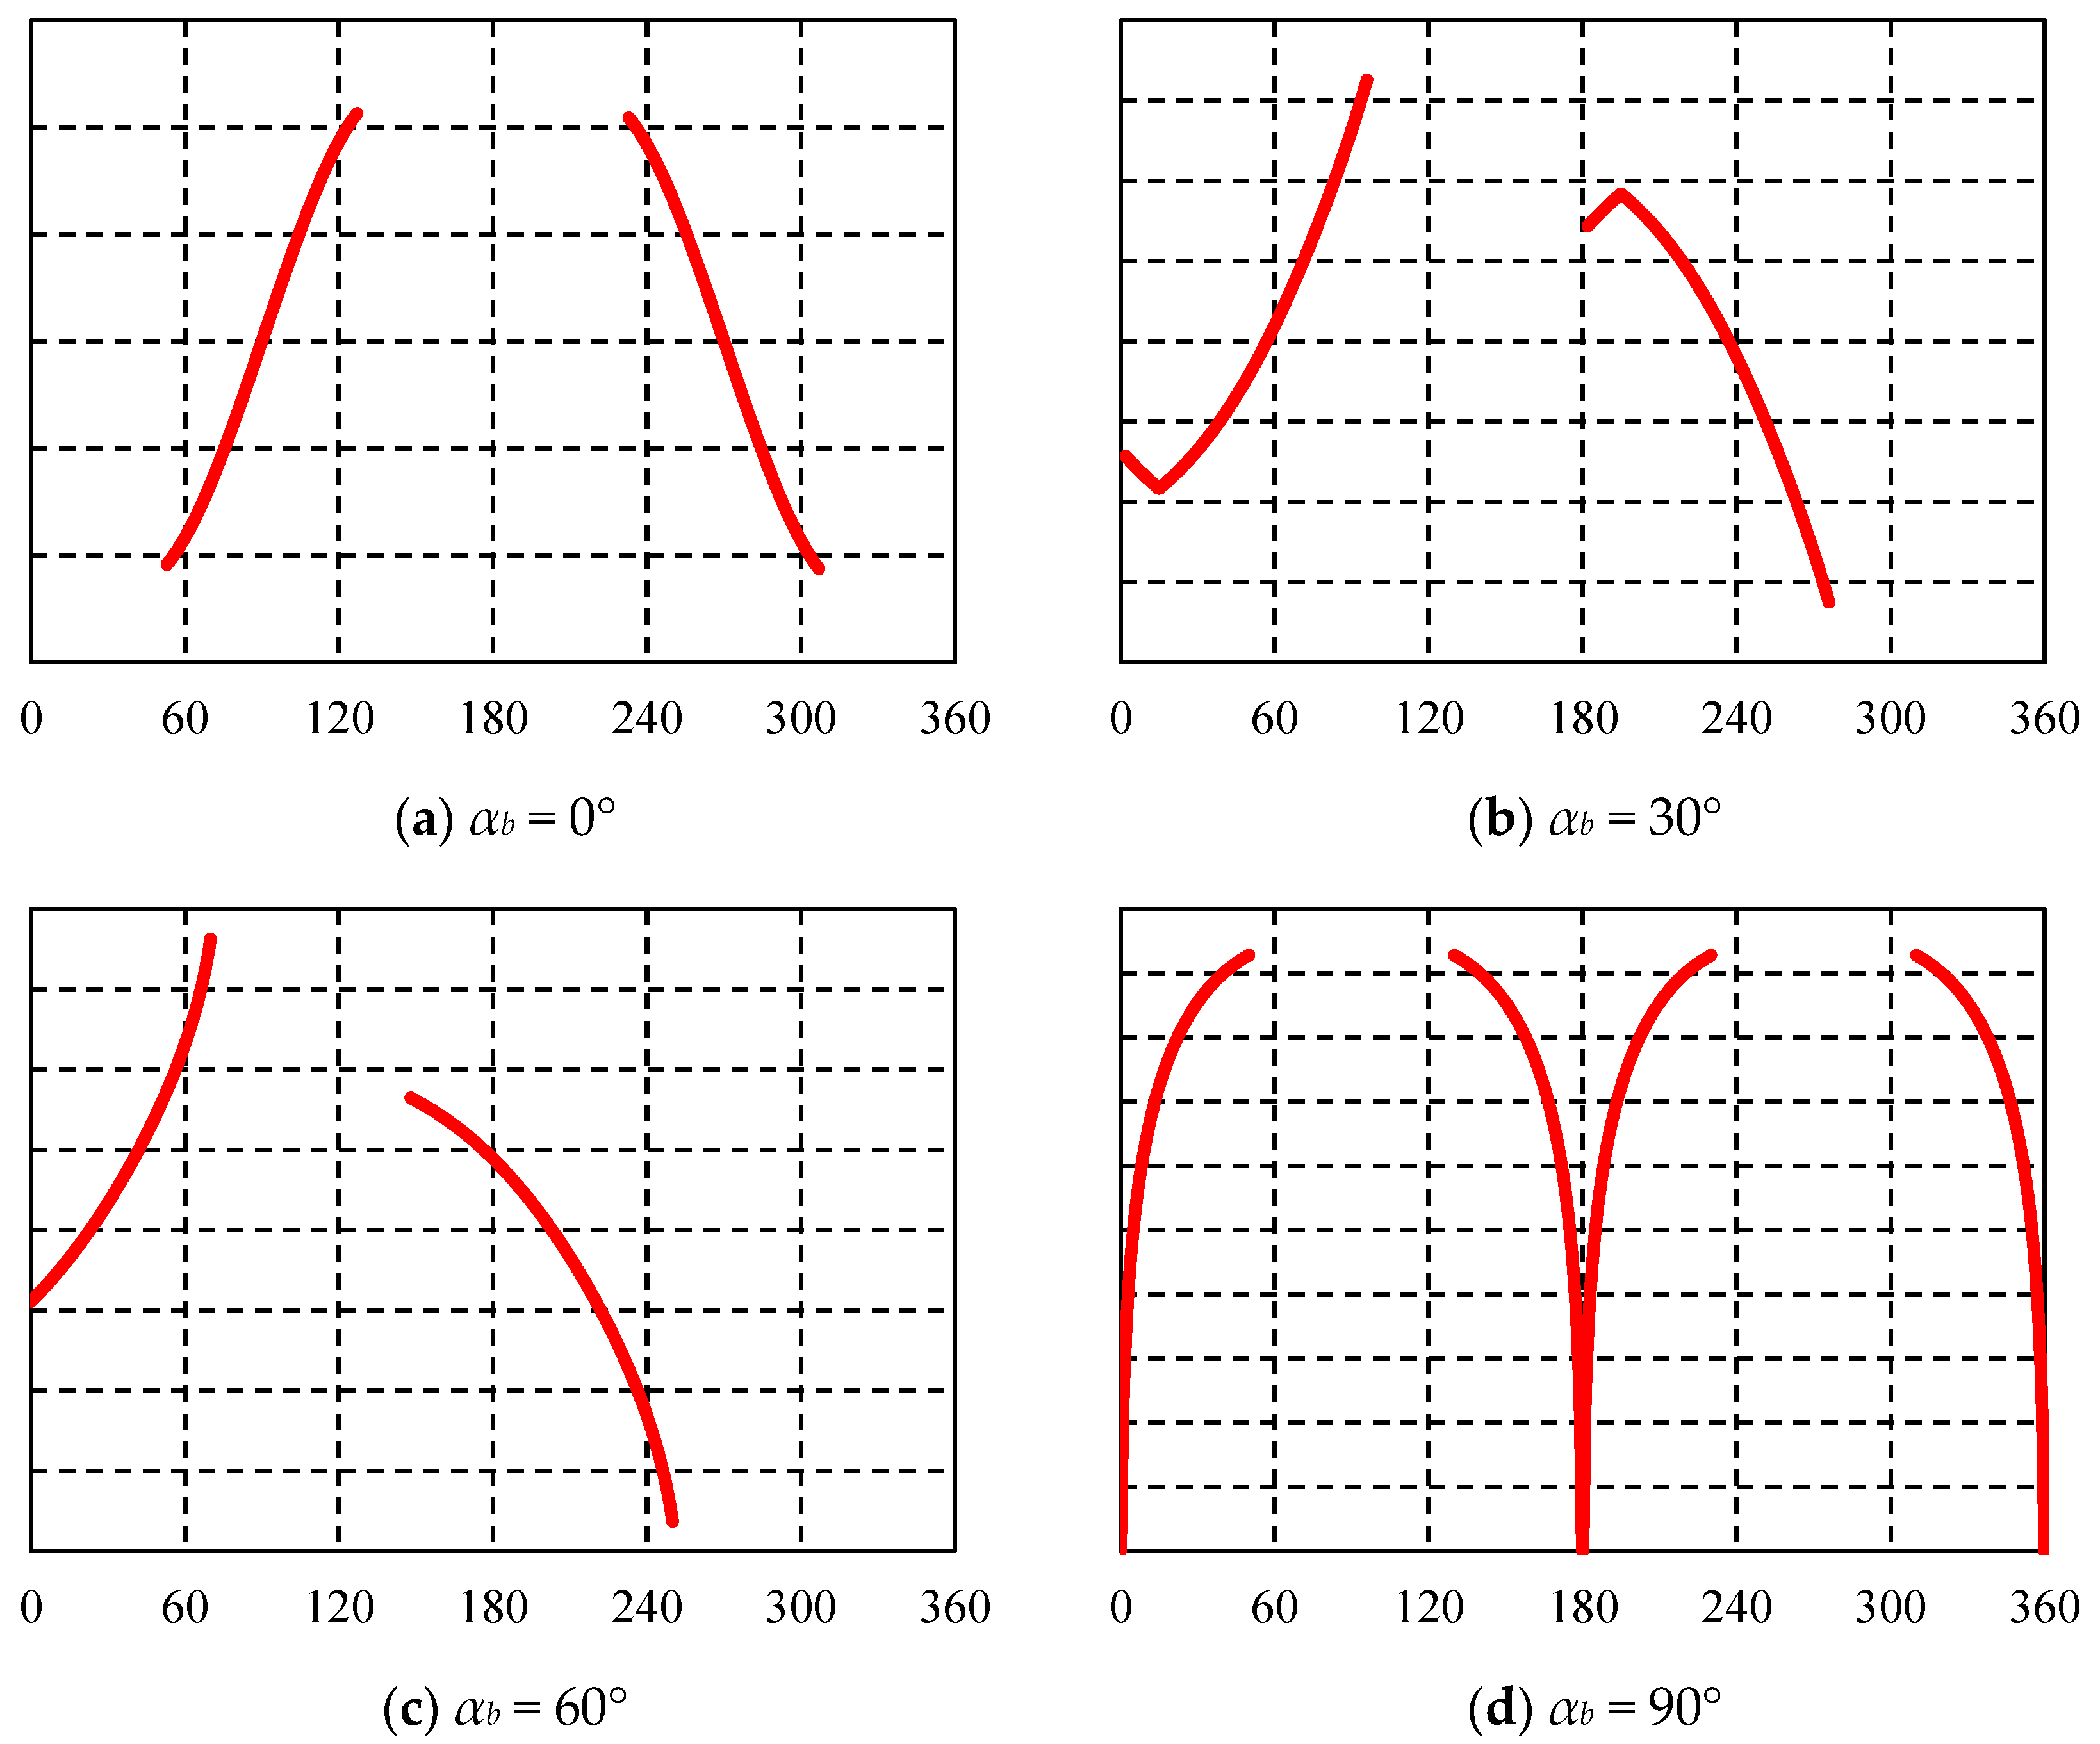
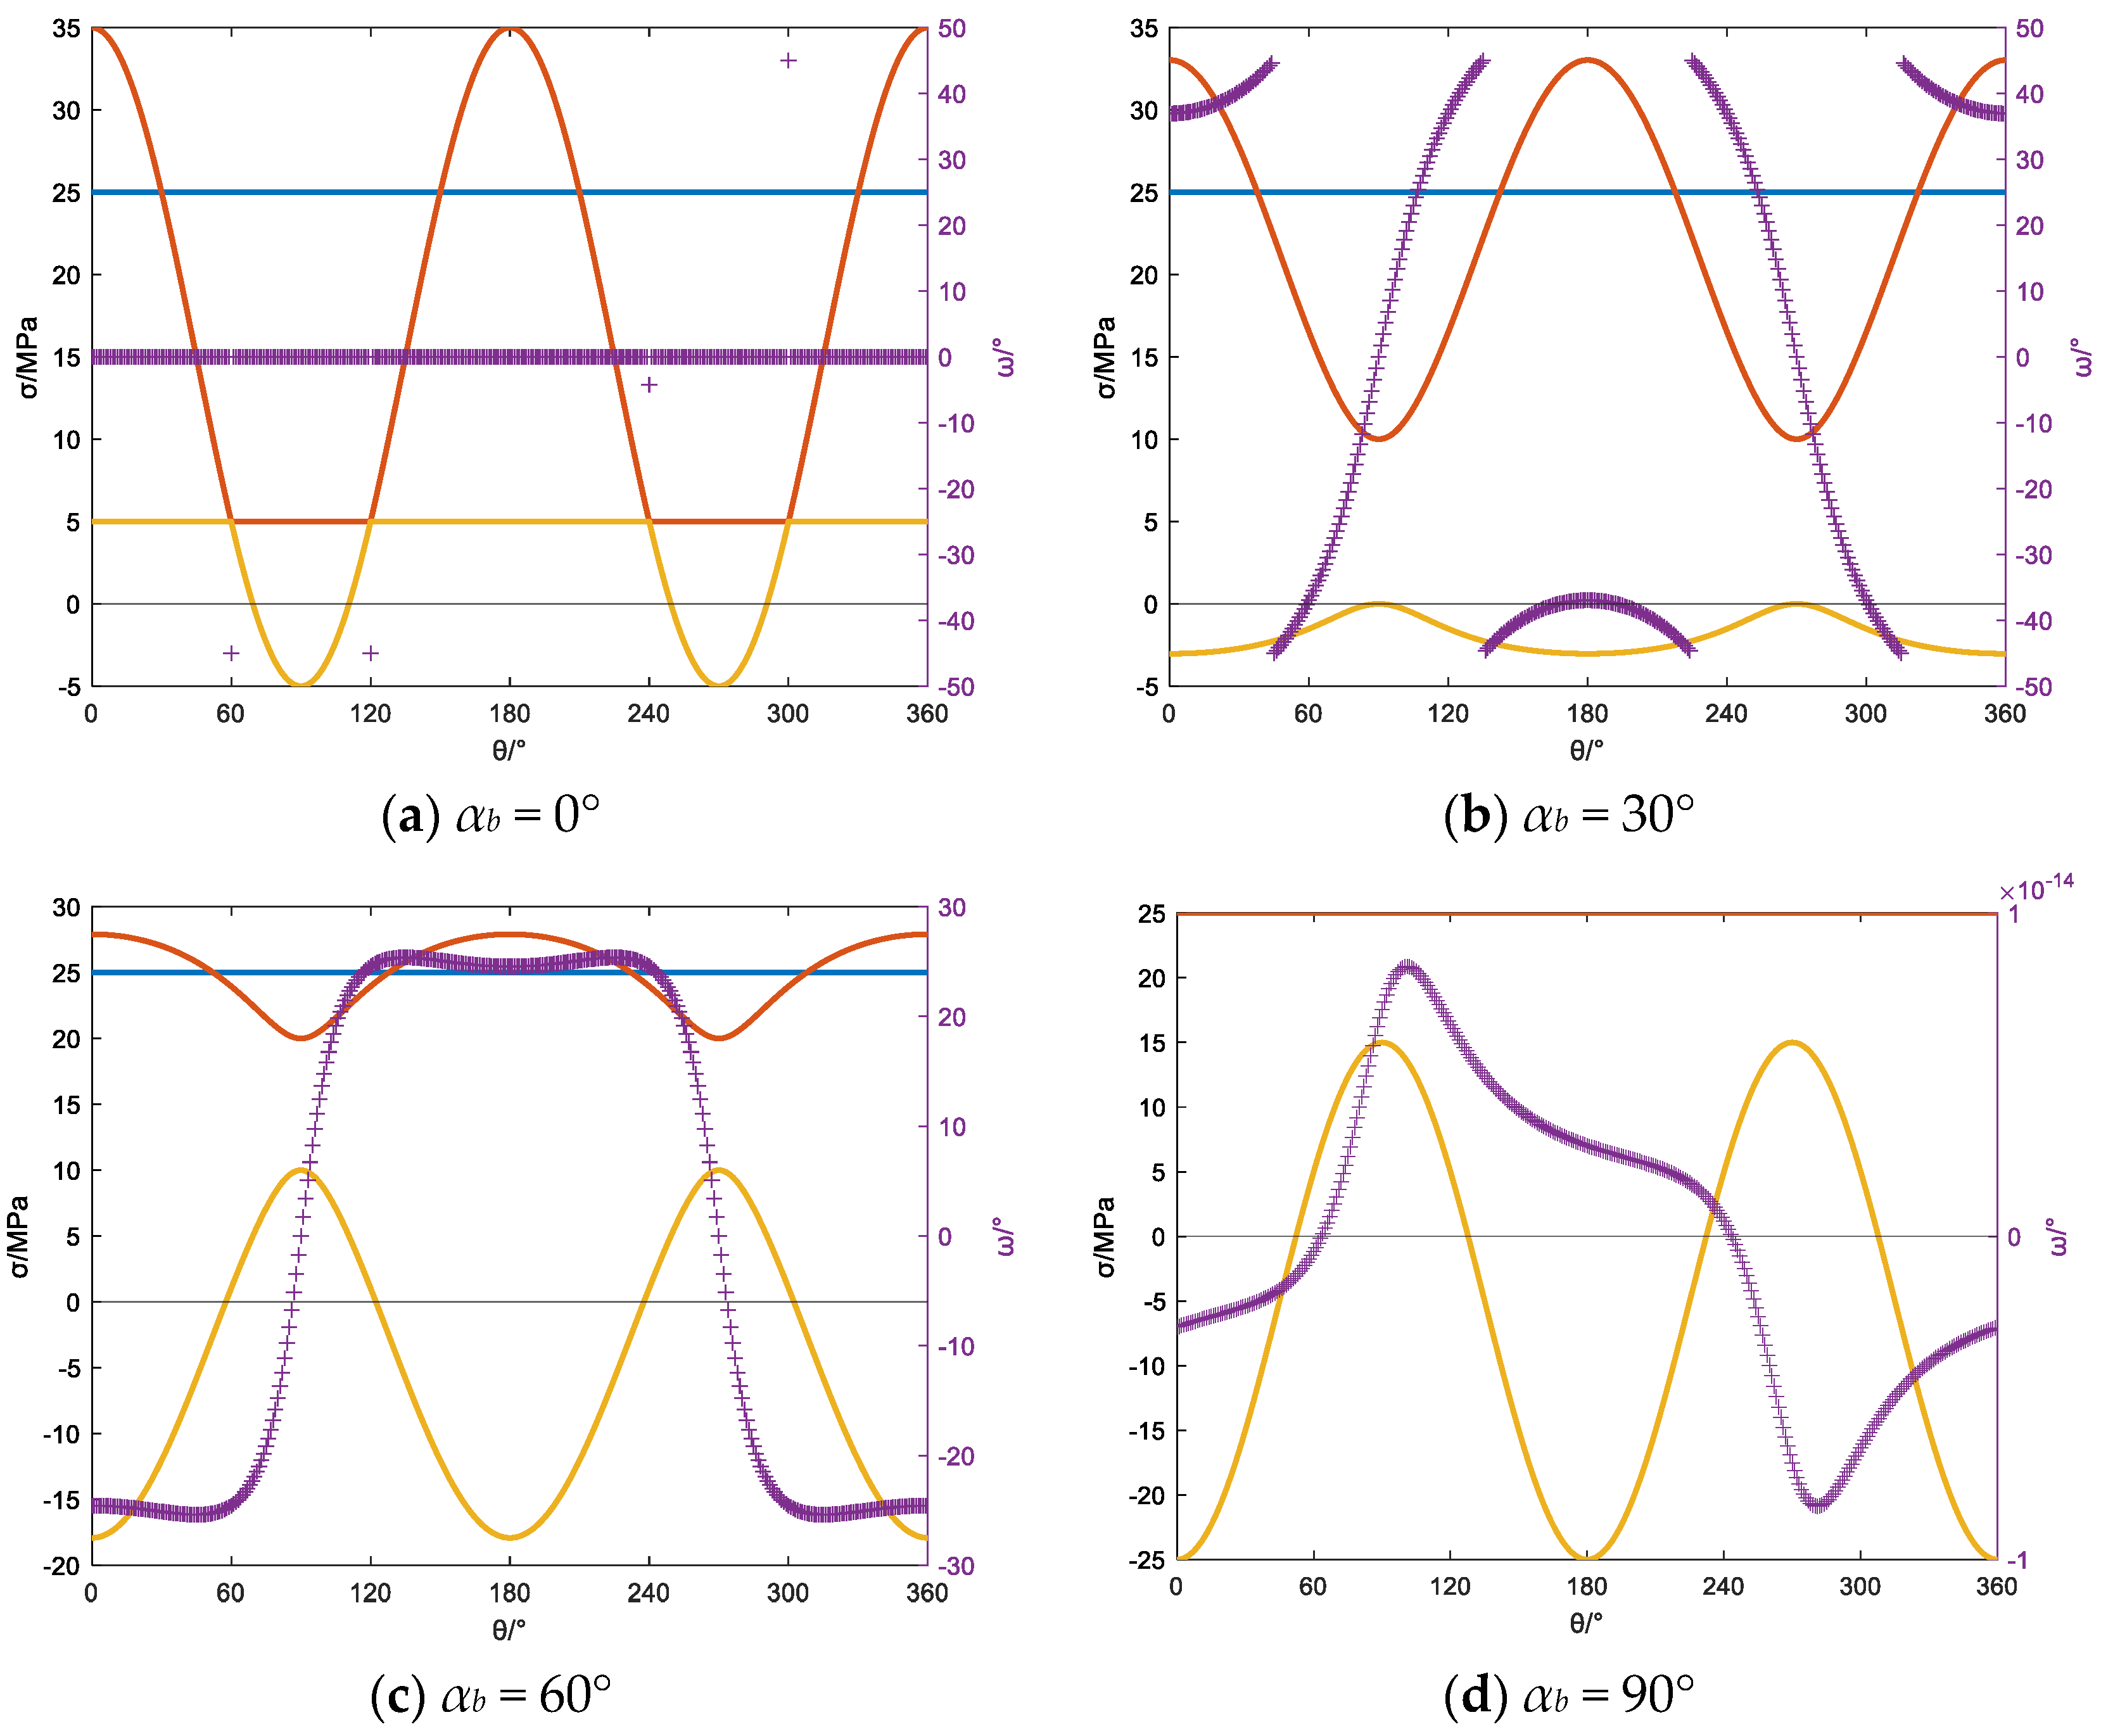
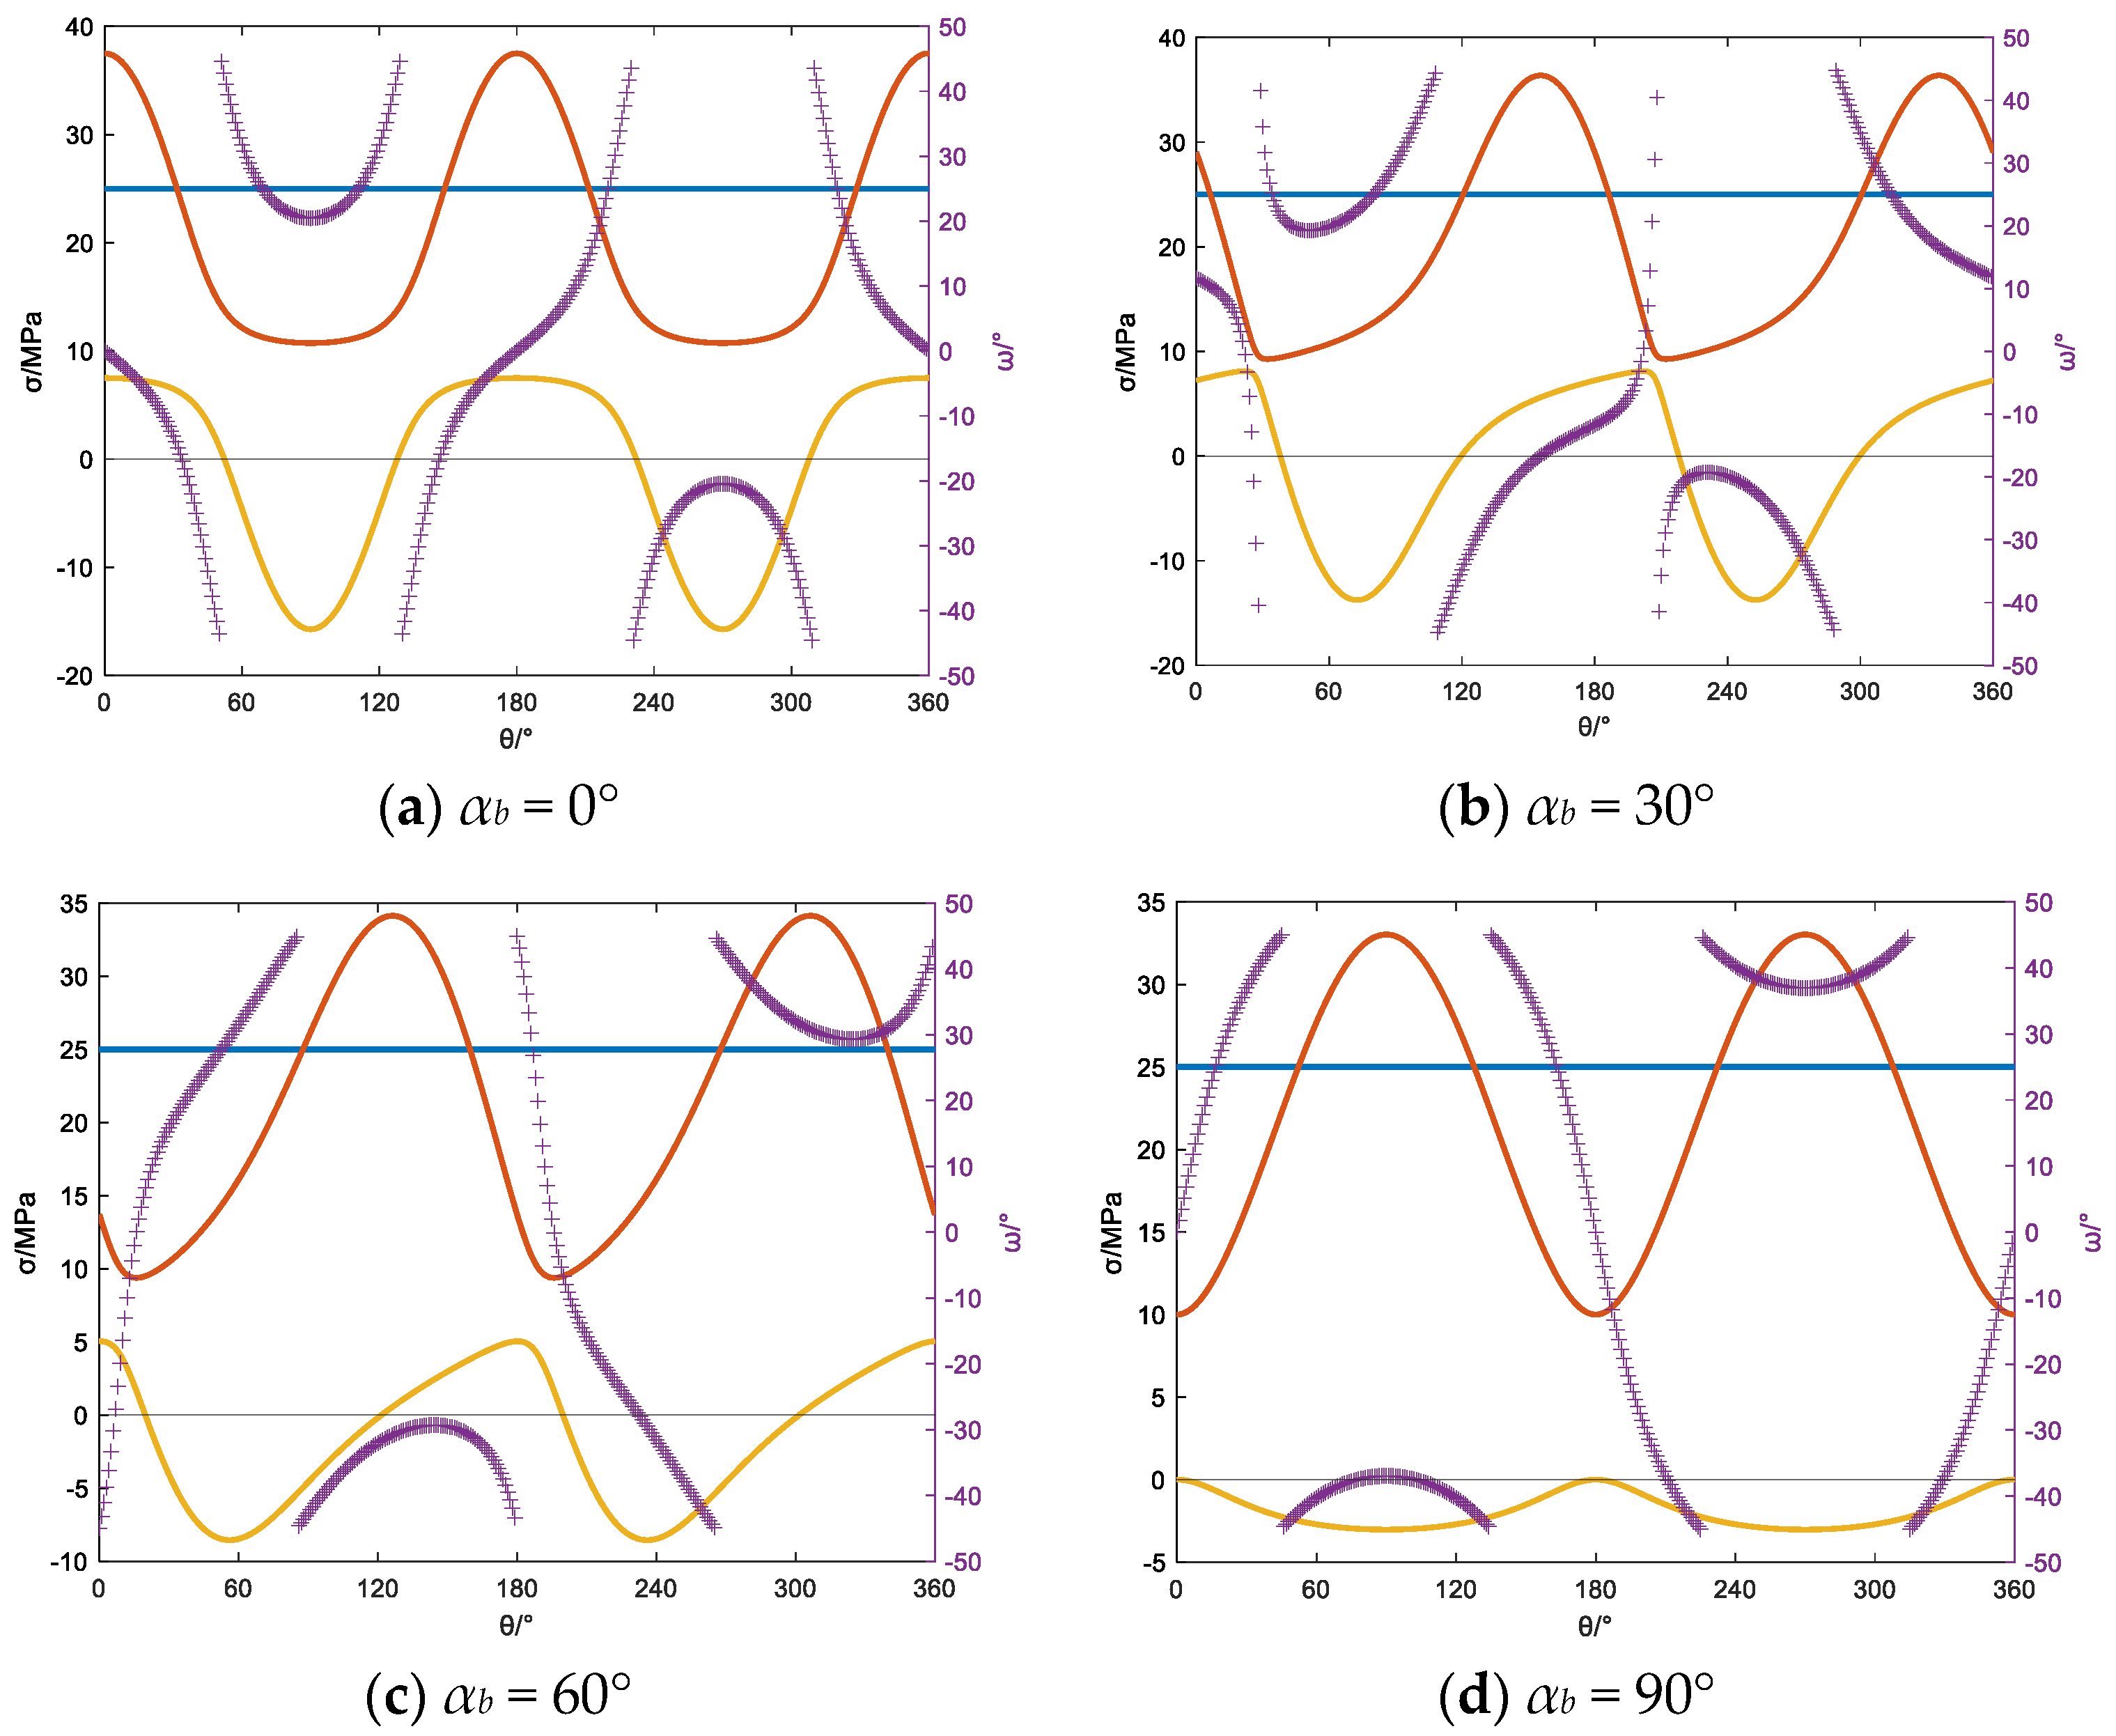
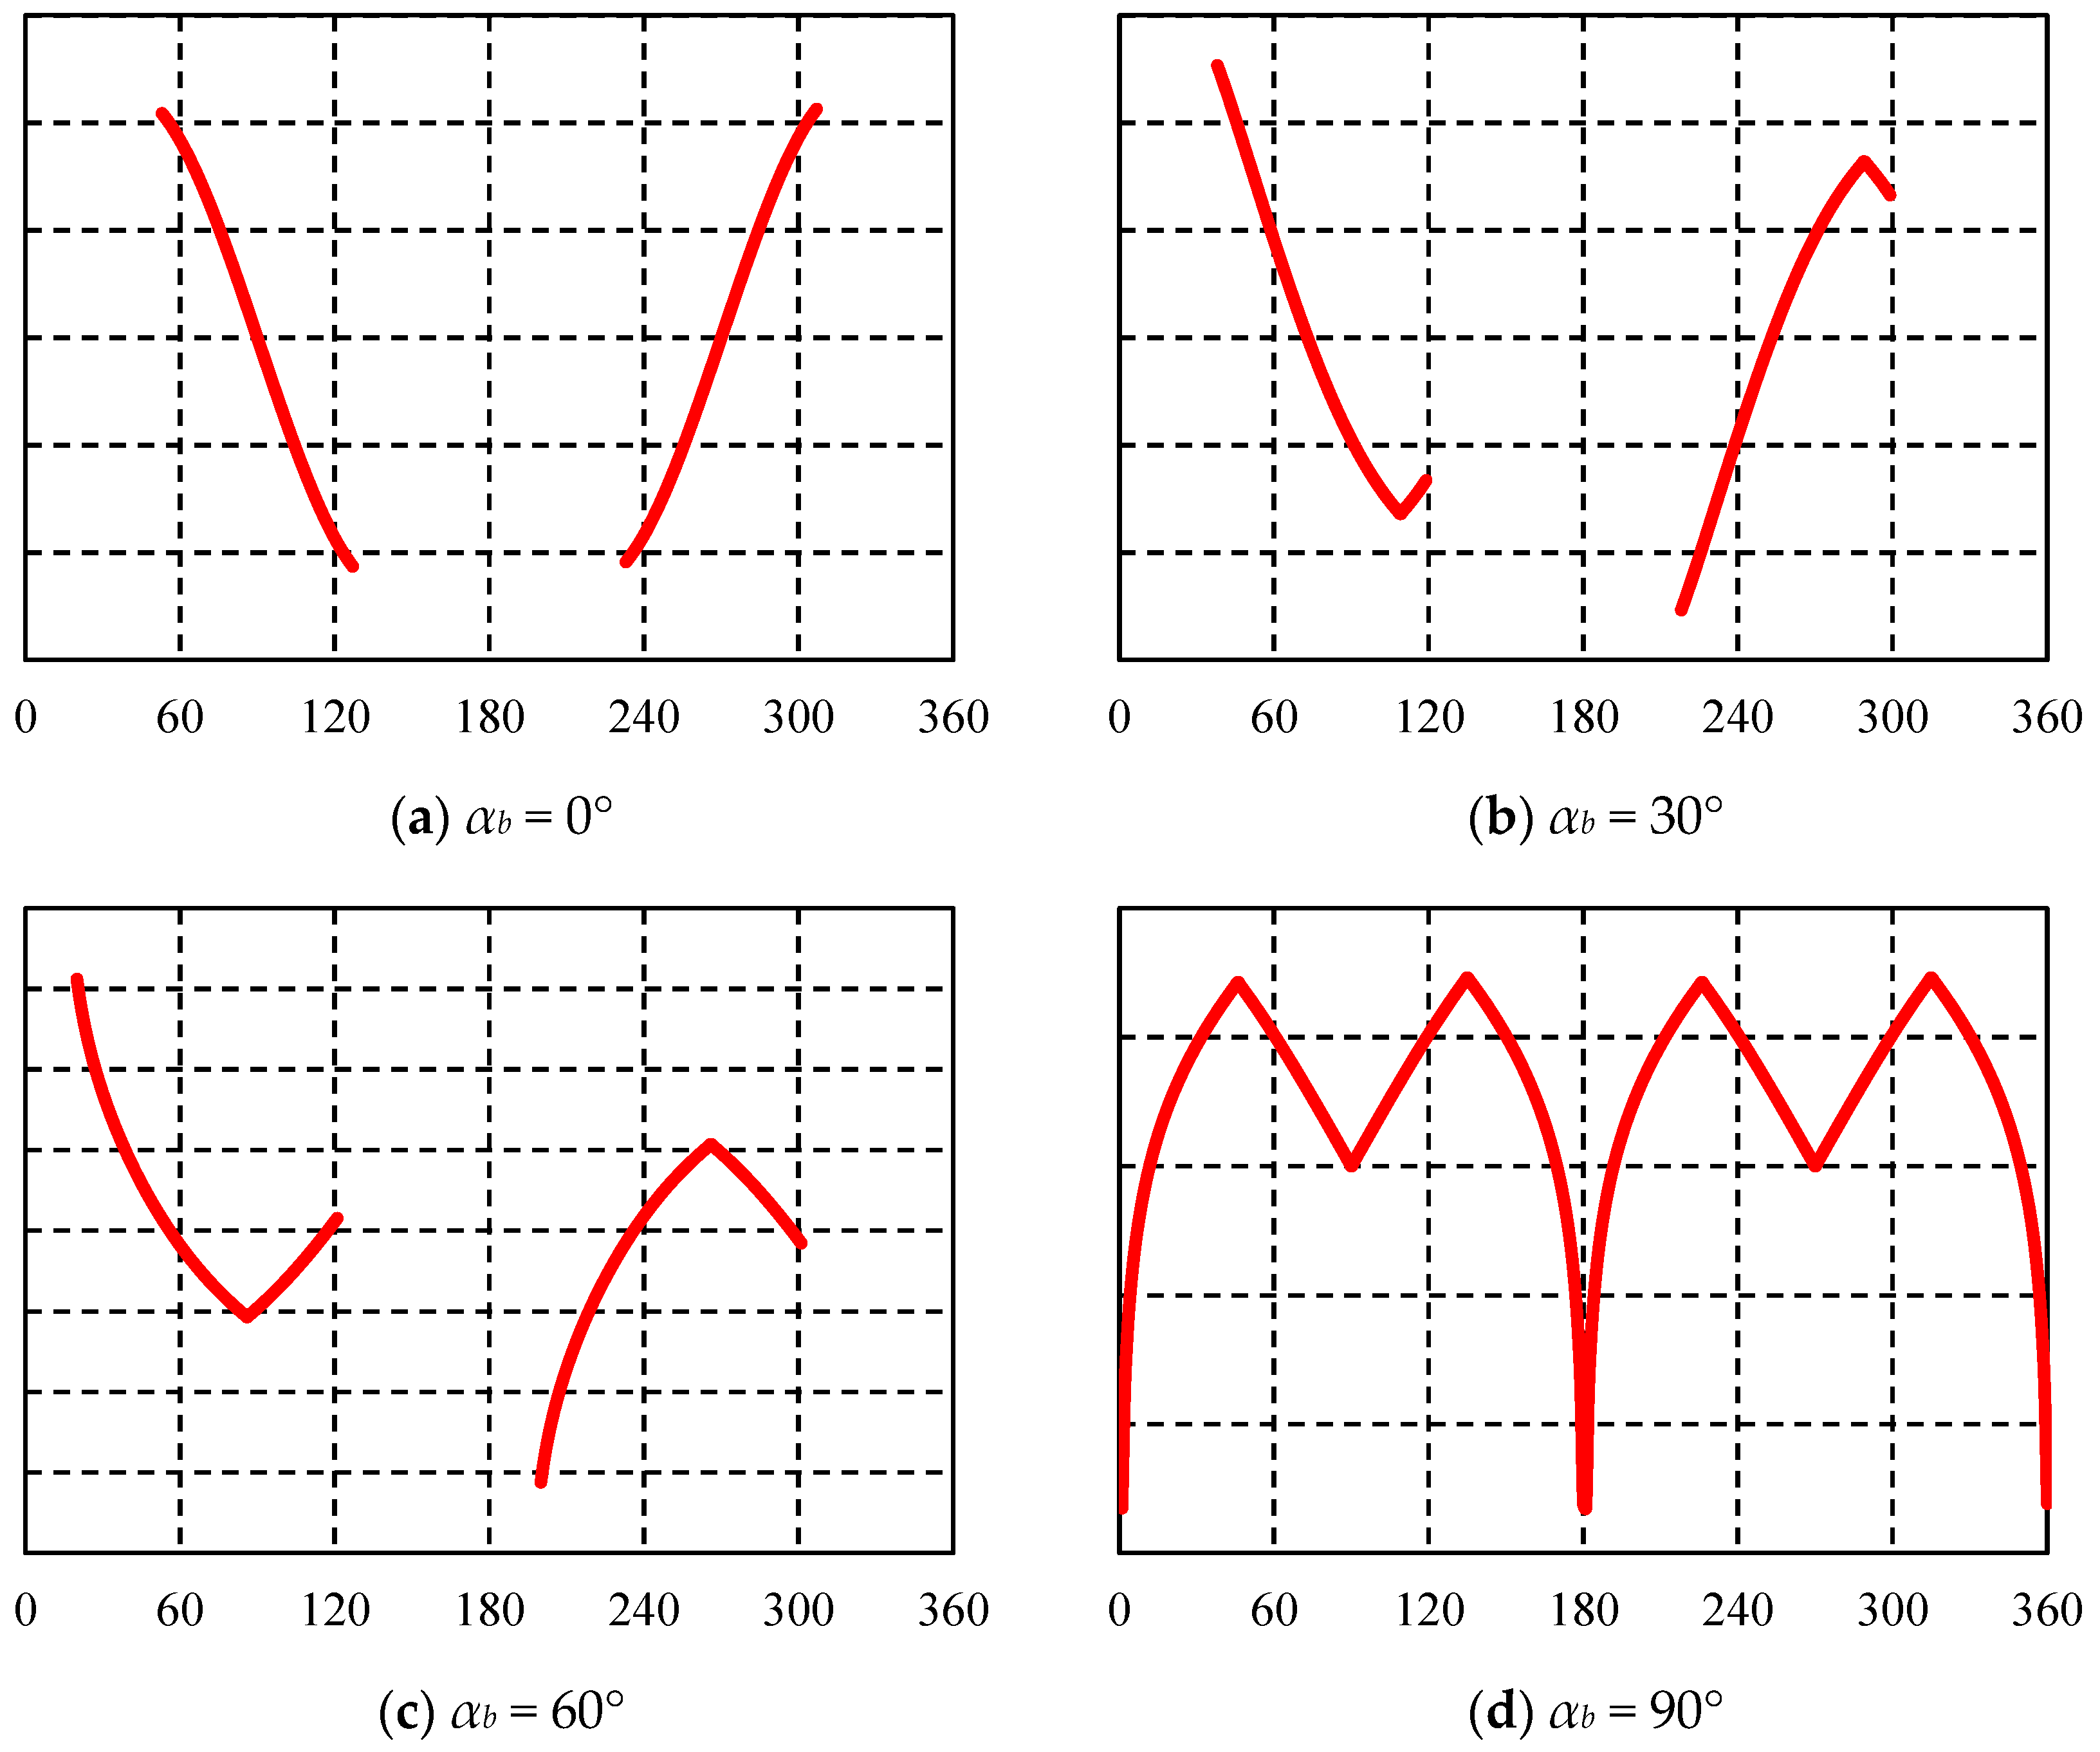
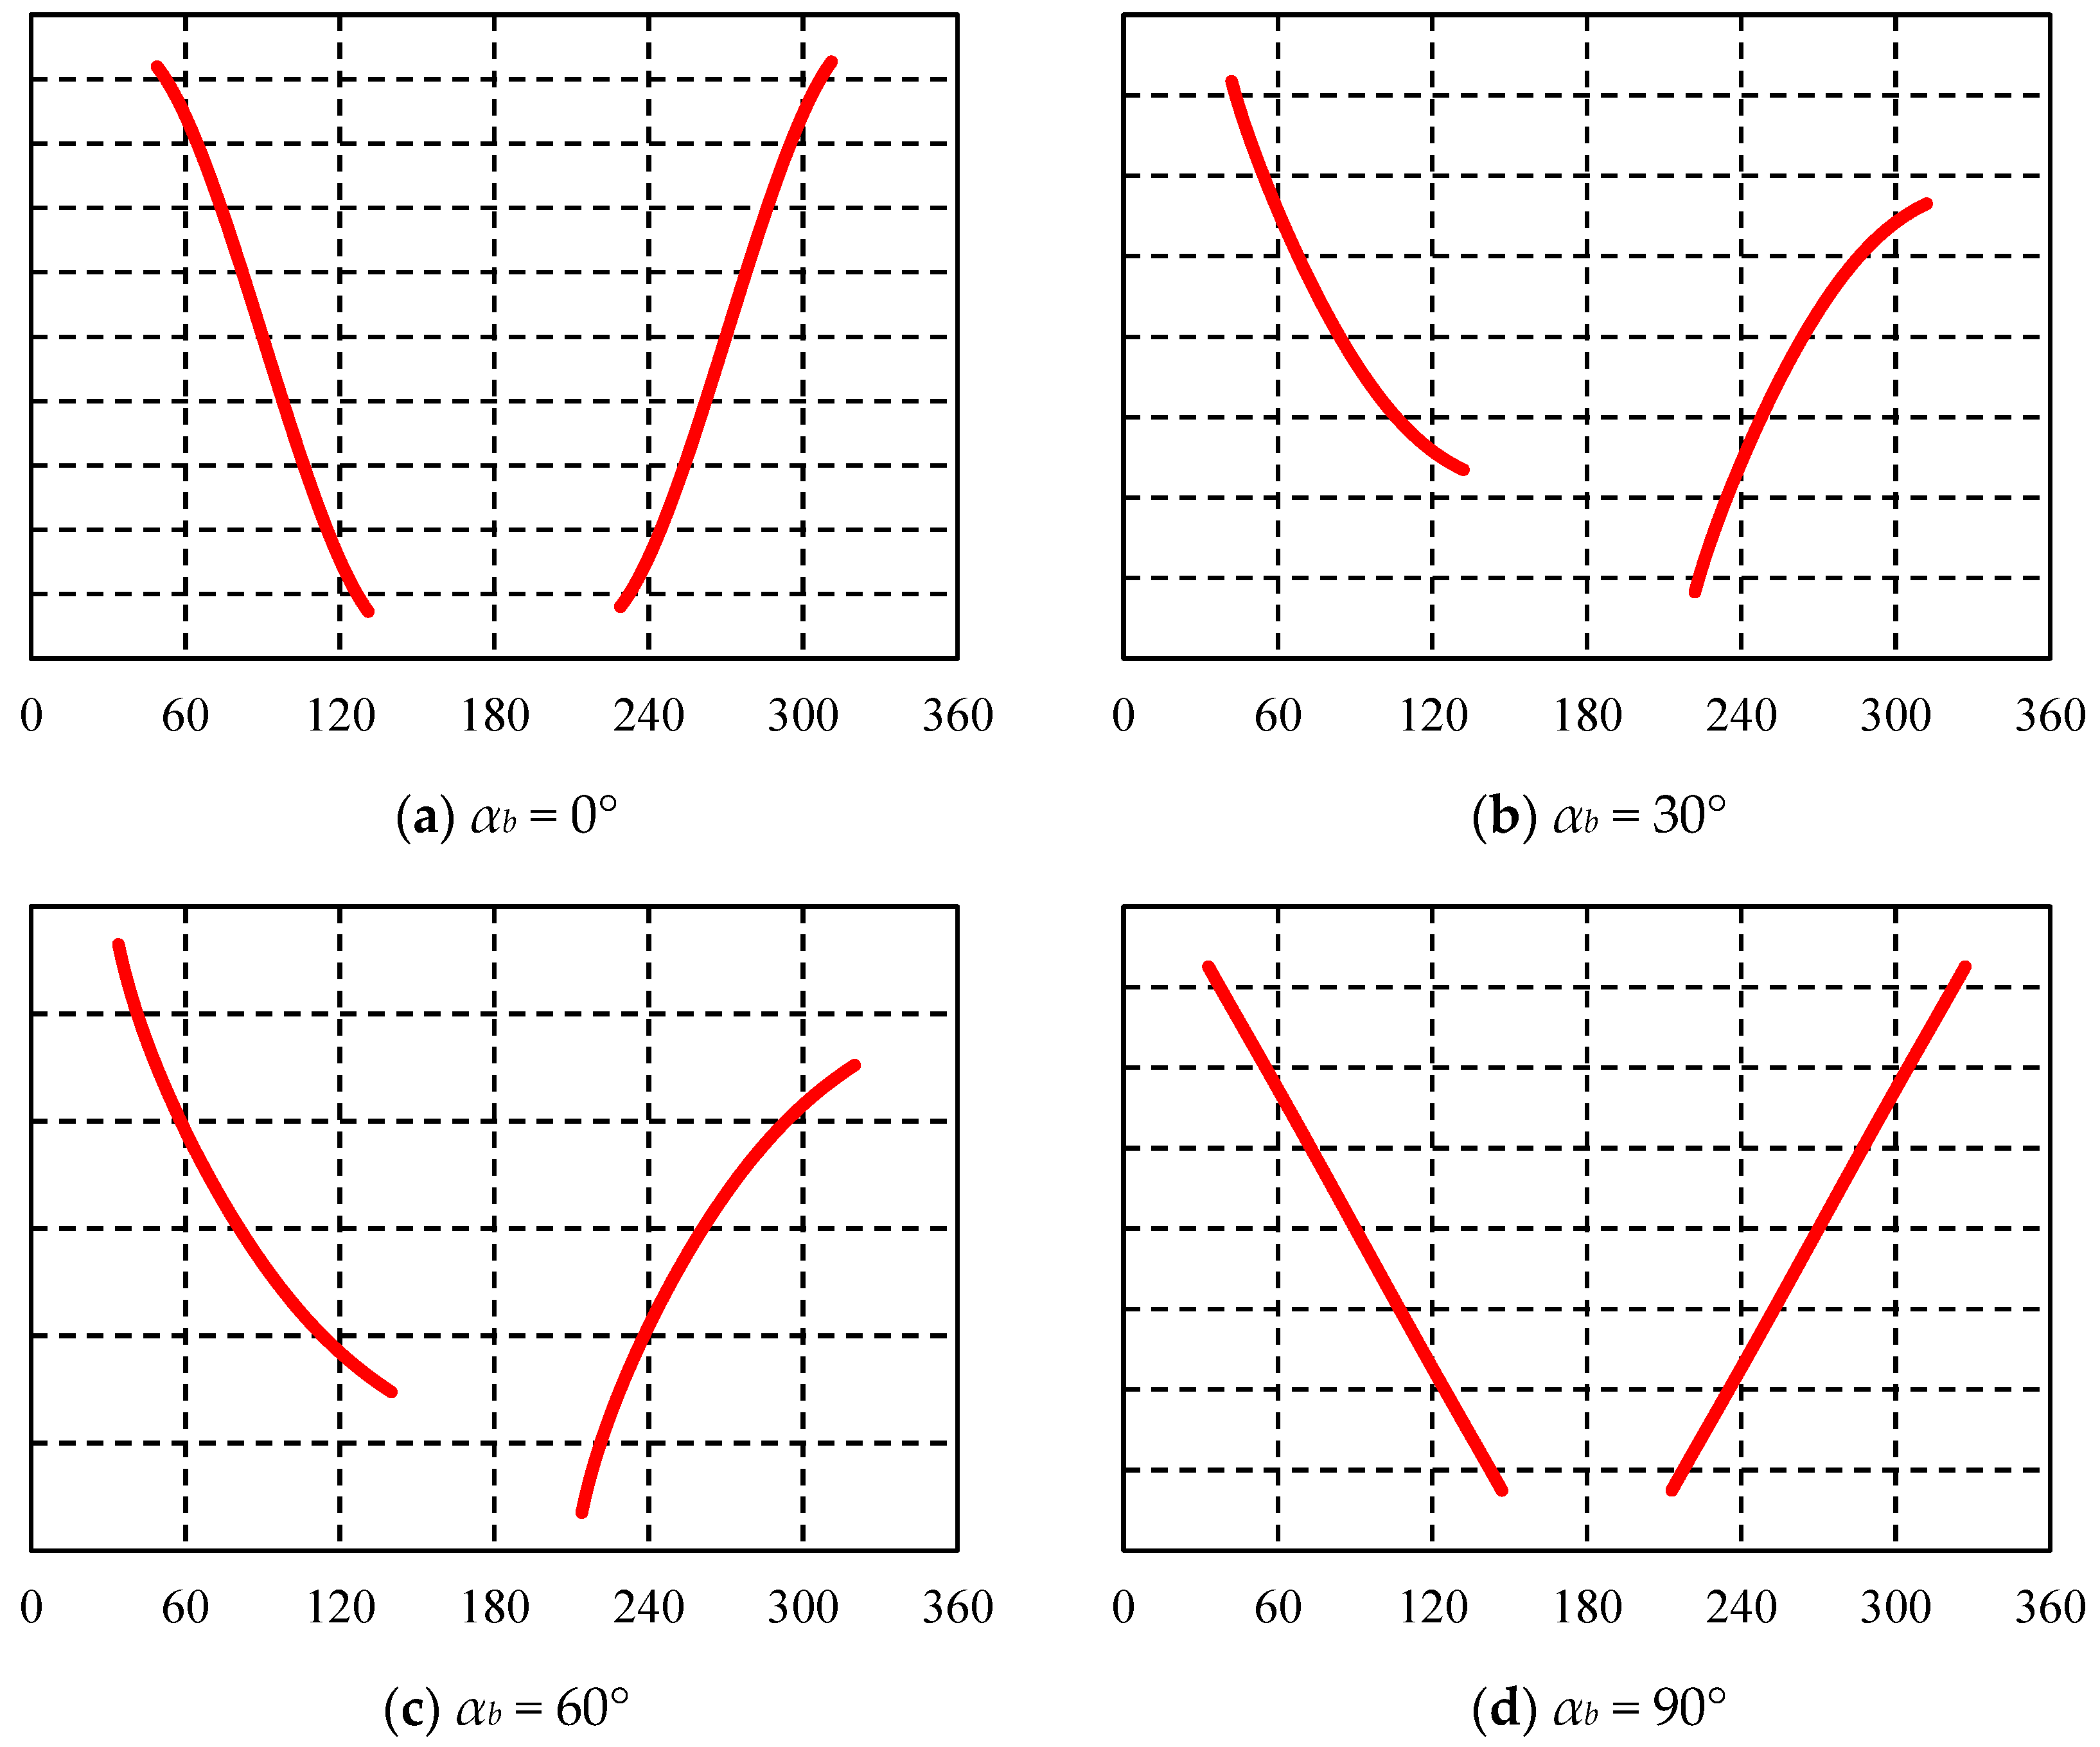
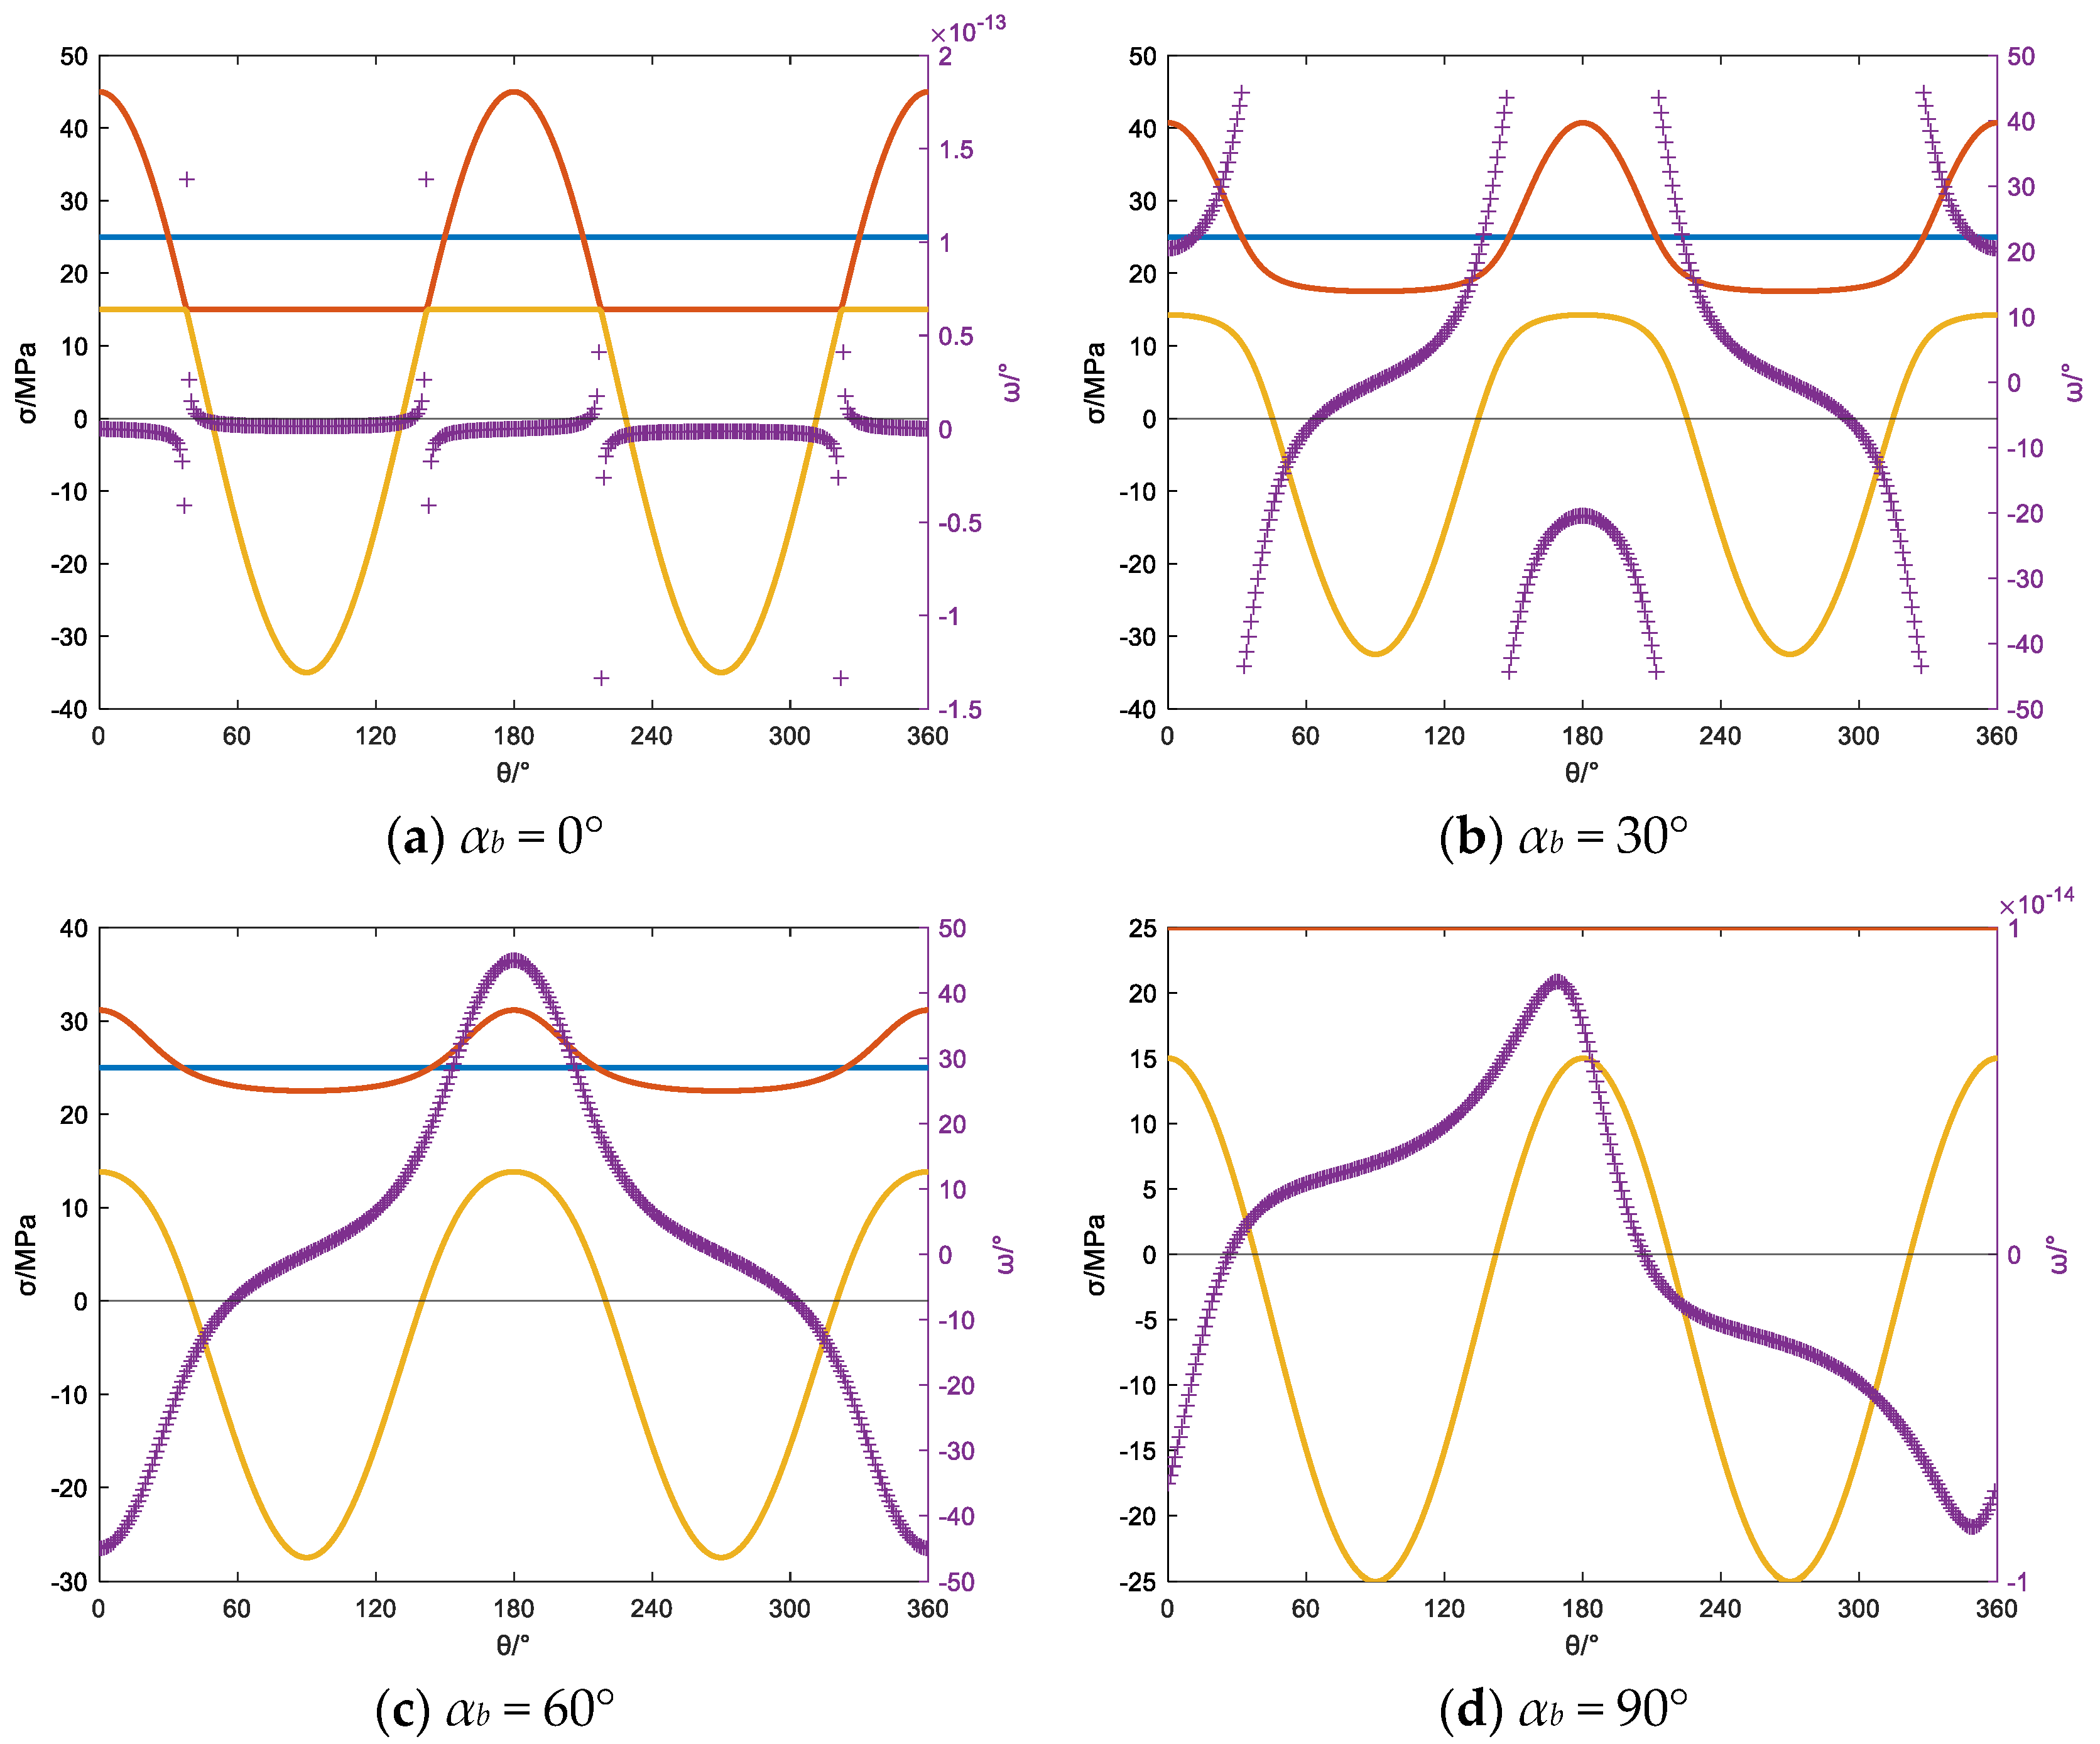
When the wellbore inclination angle is 30°, the circumferential principal stress and the angle between the induced fractures and the wellbore axis are shown in Figure 8 and Figure 9 for different azimuth angles of the wellbore. In Figure 8, the left vertical axis indicates the principal stress, and the purple “+” and right vertical axis indicate the angle between the drilling-induced fracture and the borehole axis, in addition, the orange line represents the minimum principal stress around the wellbore wall, the blue line and red line represent the maximum principal stress intermediate principal stress respectively. Analysis reveals that when the azimuth angle is 0°, the minimum principal stress around the wellbore generates tensile stress in the range of 33° to 147° and 215° to 327° around the wellbore. During this time, the angle between the induced fractures and the wellbore axis remains relatively constant, resulting in the formation of feather-shaped induced fractures around the wellbore. As the azimuth angle increases, the variation in the angle between the induced fractures and the wellbore axis gradually increases when the minimum principal stress around the wellbore is tensile stress. Consequently, the morphology of the induced fractures changes from feather-shaped to “J”-shaped and then approximates a sinusoidal shape. In the image logging interpretation shown in Figure 9d, the induced fractures are prone to be confused with natural fractures, emphasizing the need for special attention during the identification of effective fractures and reservoir evaluation.
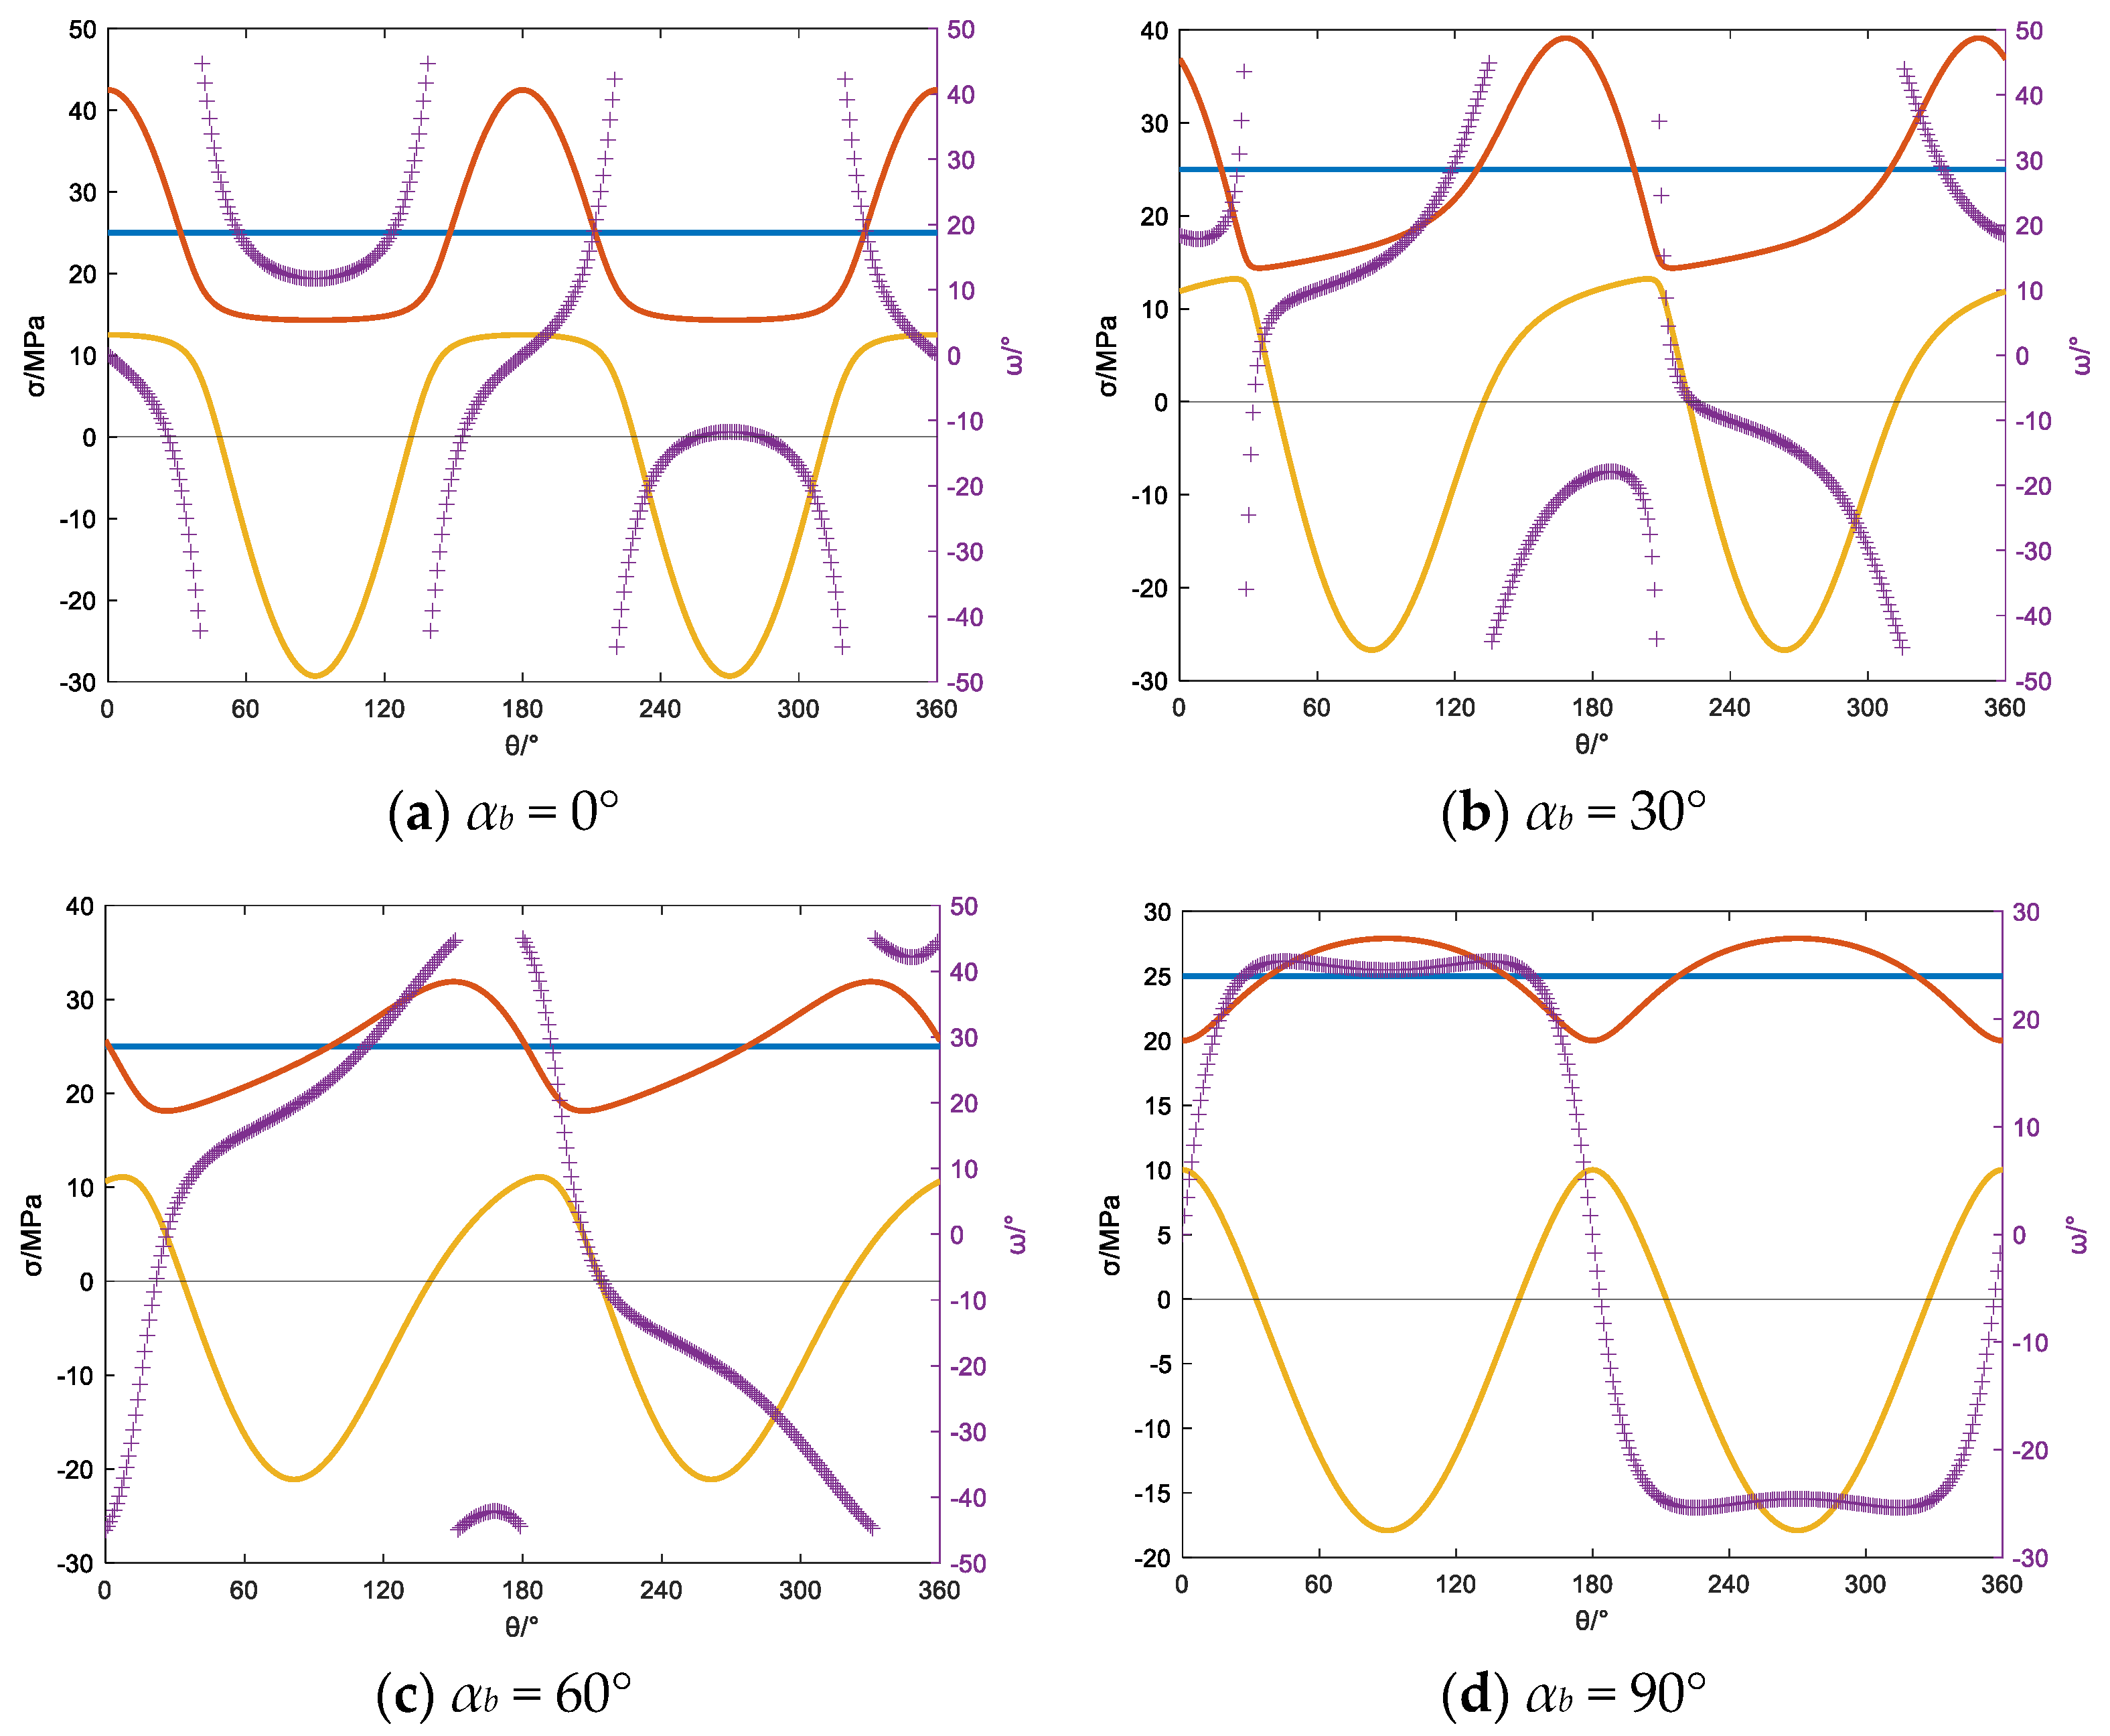
When the wellbore inclination angle is 60°, the circumferential principal stress and the induced fracture morphology for different azimuth angles of the wellbore are shown in Figure 10 and Figure 11. In Figure 10, the left vertical axis indicates the principal stress, and the purple “+” and right vertical axis indicate the angle between the drilling-induced fracture and the borehole axis, in addition, the orange line represents the minimum principal stress around the wellbore wall, the blue line and red line represent the maximum principal stress intermediate principal stress respectively. When the azimuth angle is 0°, the minimum principal stress around the wellbore is tensile stress along the entire circumference of the wellbore, and the angle between the induced fractures and the wellbore axis varies significantly, showing a complex trend. Consequently, the induced fractures exhibit the morphology as shown in Figure 11a. When the azimuth angle is 30° and 60°, the wellbore develops “J”-shaped induced fractures, while at an azimuth angle of 90°, the wellbore exhibits induced fractures with an approximately sinusoidal shape.
For horizontal wells, the circumferential principal stress and the induced fracture morphology for different azimuth angles of the wellbore are shown in Figure 12 and Figure 13. In Figure 12, the left vertical axis indicates the principal stress, and the purple “+” and right vertical axis indicate the angle between the drilling-induced fracture and the borehole axis, in addition, the orange line represents the minimum principal stress around the wellbore wall, the blue line and red line represent the maximum principal stress intermediate principal stress respectively. When drilling along the direction of the maximum or minimum horizontal stress, the wellbore axis aligns with the stress field, leading to negligible shear stress around the wellbore. Consequently, vertically induced fractures emerge in the direction of the maximum horizontal stress. When drilling a horizontal well at azimuth angles of 30° and 60°, the induced fractures exhibit a transitional morphology between feather-shaped and “J”-shaped configurations.
3.2. Strike-Slip Fault
Under the strike-slip fault mechanism, the circumferential principal stress and the induced fracture morphology for wellbores with different trajectories are illustrated in Figure 14, Figure 15, Figure 16, Figure 17, Figure 18, Figure 19, Figure 20 and Figure 21. In Figure 14, the left vertical axis indicates the principal stress, and the purple “+” and right vertical axis indicate the angle between the drilling-induced fracture and the borehole axis, in addition, the orange line represents the minimum principal stress around the wellbore wall, the blue line and red line represent the maximum principal stress intermediate principal stress respectively.
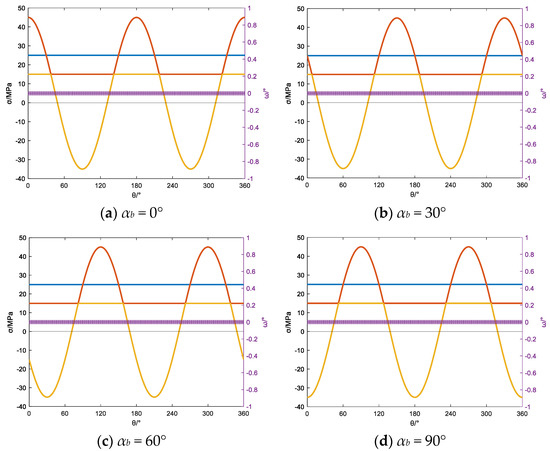
Figure 14.
Variation in principal stress and induced fracture angle in vertical wells.
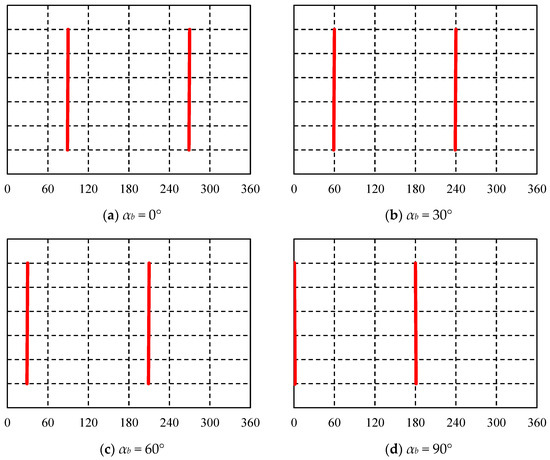
Figure 15.
Induced fracture occurrence in vertical wells at different azimuths.
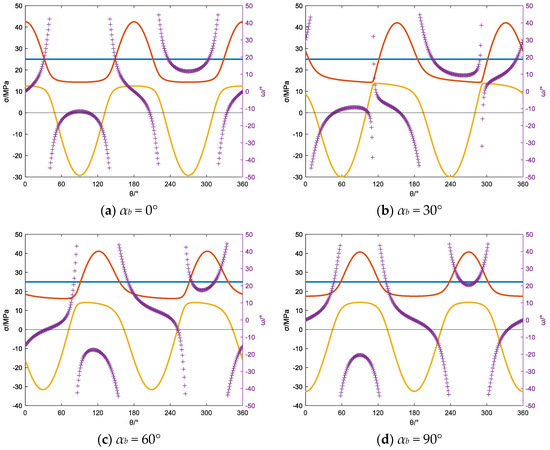
Figure 16.
Variation in the principal stress and induced fracture angle with βb = 30° at different azimuths.
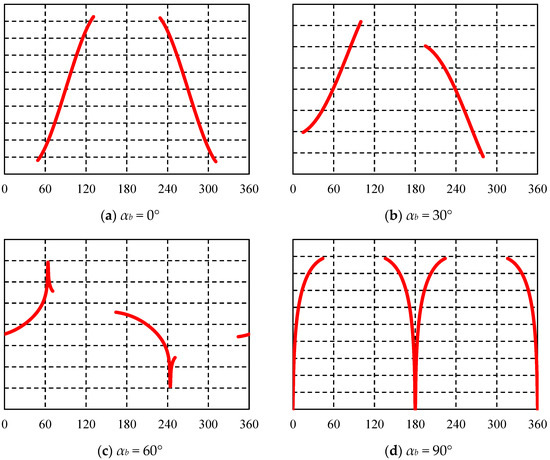
Figure 17.
Induced fracture occurrence of wells with βb = 30° at different azimuths.
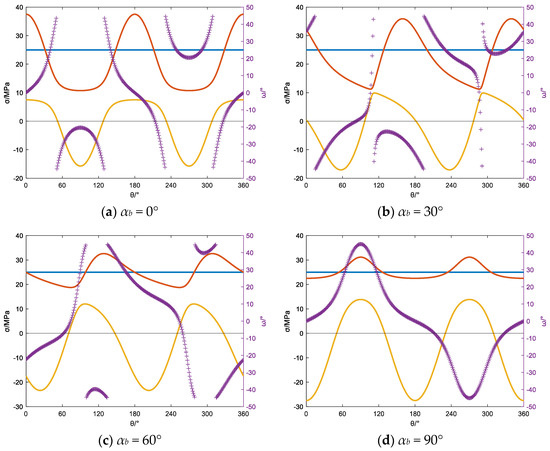
Figure 18.
Variation in the principal stress and induced fracture angle with βb = 60° at different azimuths.
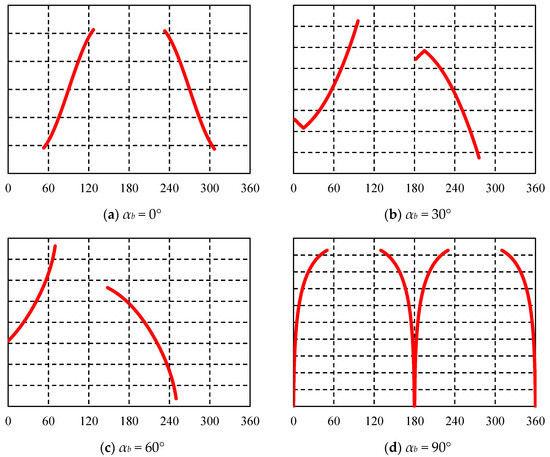
Figure 19.
Induced fracture occurrence of wells with βb = 60° at different azimuths.
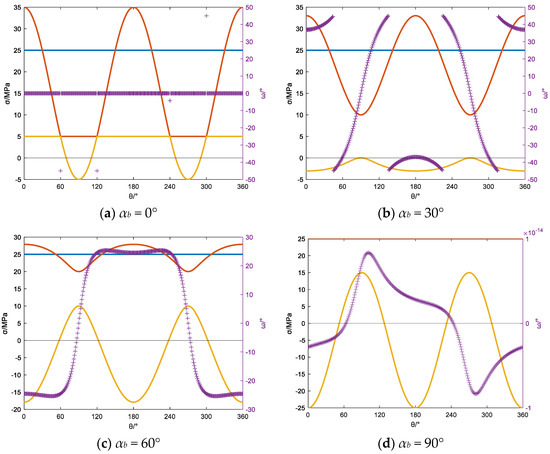
Figure 20.
Variation in the principal stress and induced fracture angle with βb = 90° at different azimuths.
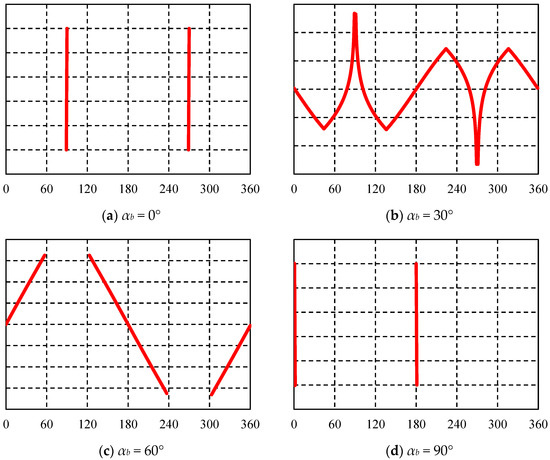
Figure 21.
Induced fracture occurrence of wells with βb = 90° at different azimuths.
Similar to the case of a normal fault, for vertical wells in which the wellbore axis is parallel to the vertical stress, no shear stress is induced around the wellbore. Therefore, fractures parallel to the wellbore axis are generated. Since tensile stress initially occurs in the direction of maximum horizontal stress, induced fractures are consistently symmetrically distributed at intervals of 180° around the direction of maximum horizontal stress.
When the well inclination angles are 30° and 60°, the variations in wellbore principal stresses and induced fracture patterns around the wellbore follow similar trends as the azimuth angle increases, as shown in Figure 16, Figure 17, Figure 18 and Figure 19. In Figure 16 and Figure 18, the left vertical axis indicates the principal stress, and the purple “+” and right vertical axis indicate the angle between the drilling-induced fracture and the borehole axis, in addition, the orange line represents the minimum principal stress around the wellbore wall, the blue line and red line represent the maximum principal stress intermediate principal stress respectively. With increasing azimuth angle, the relationship between the induced fractures and the wellbore axis becomes more complex as a function of the azimuthal angle. The induced fractures transition from feather-shaped to “J”-shaped. When the wellbore is drilled along the direction of maximum horizontal stress, “V”-shaped induced fractures are generated.
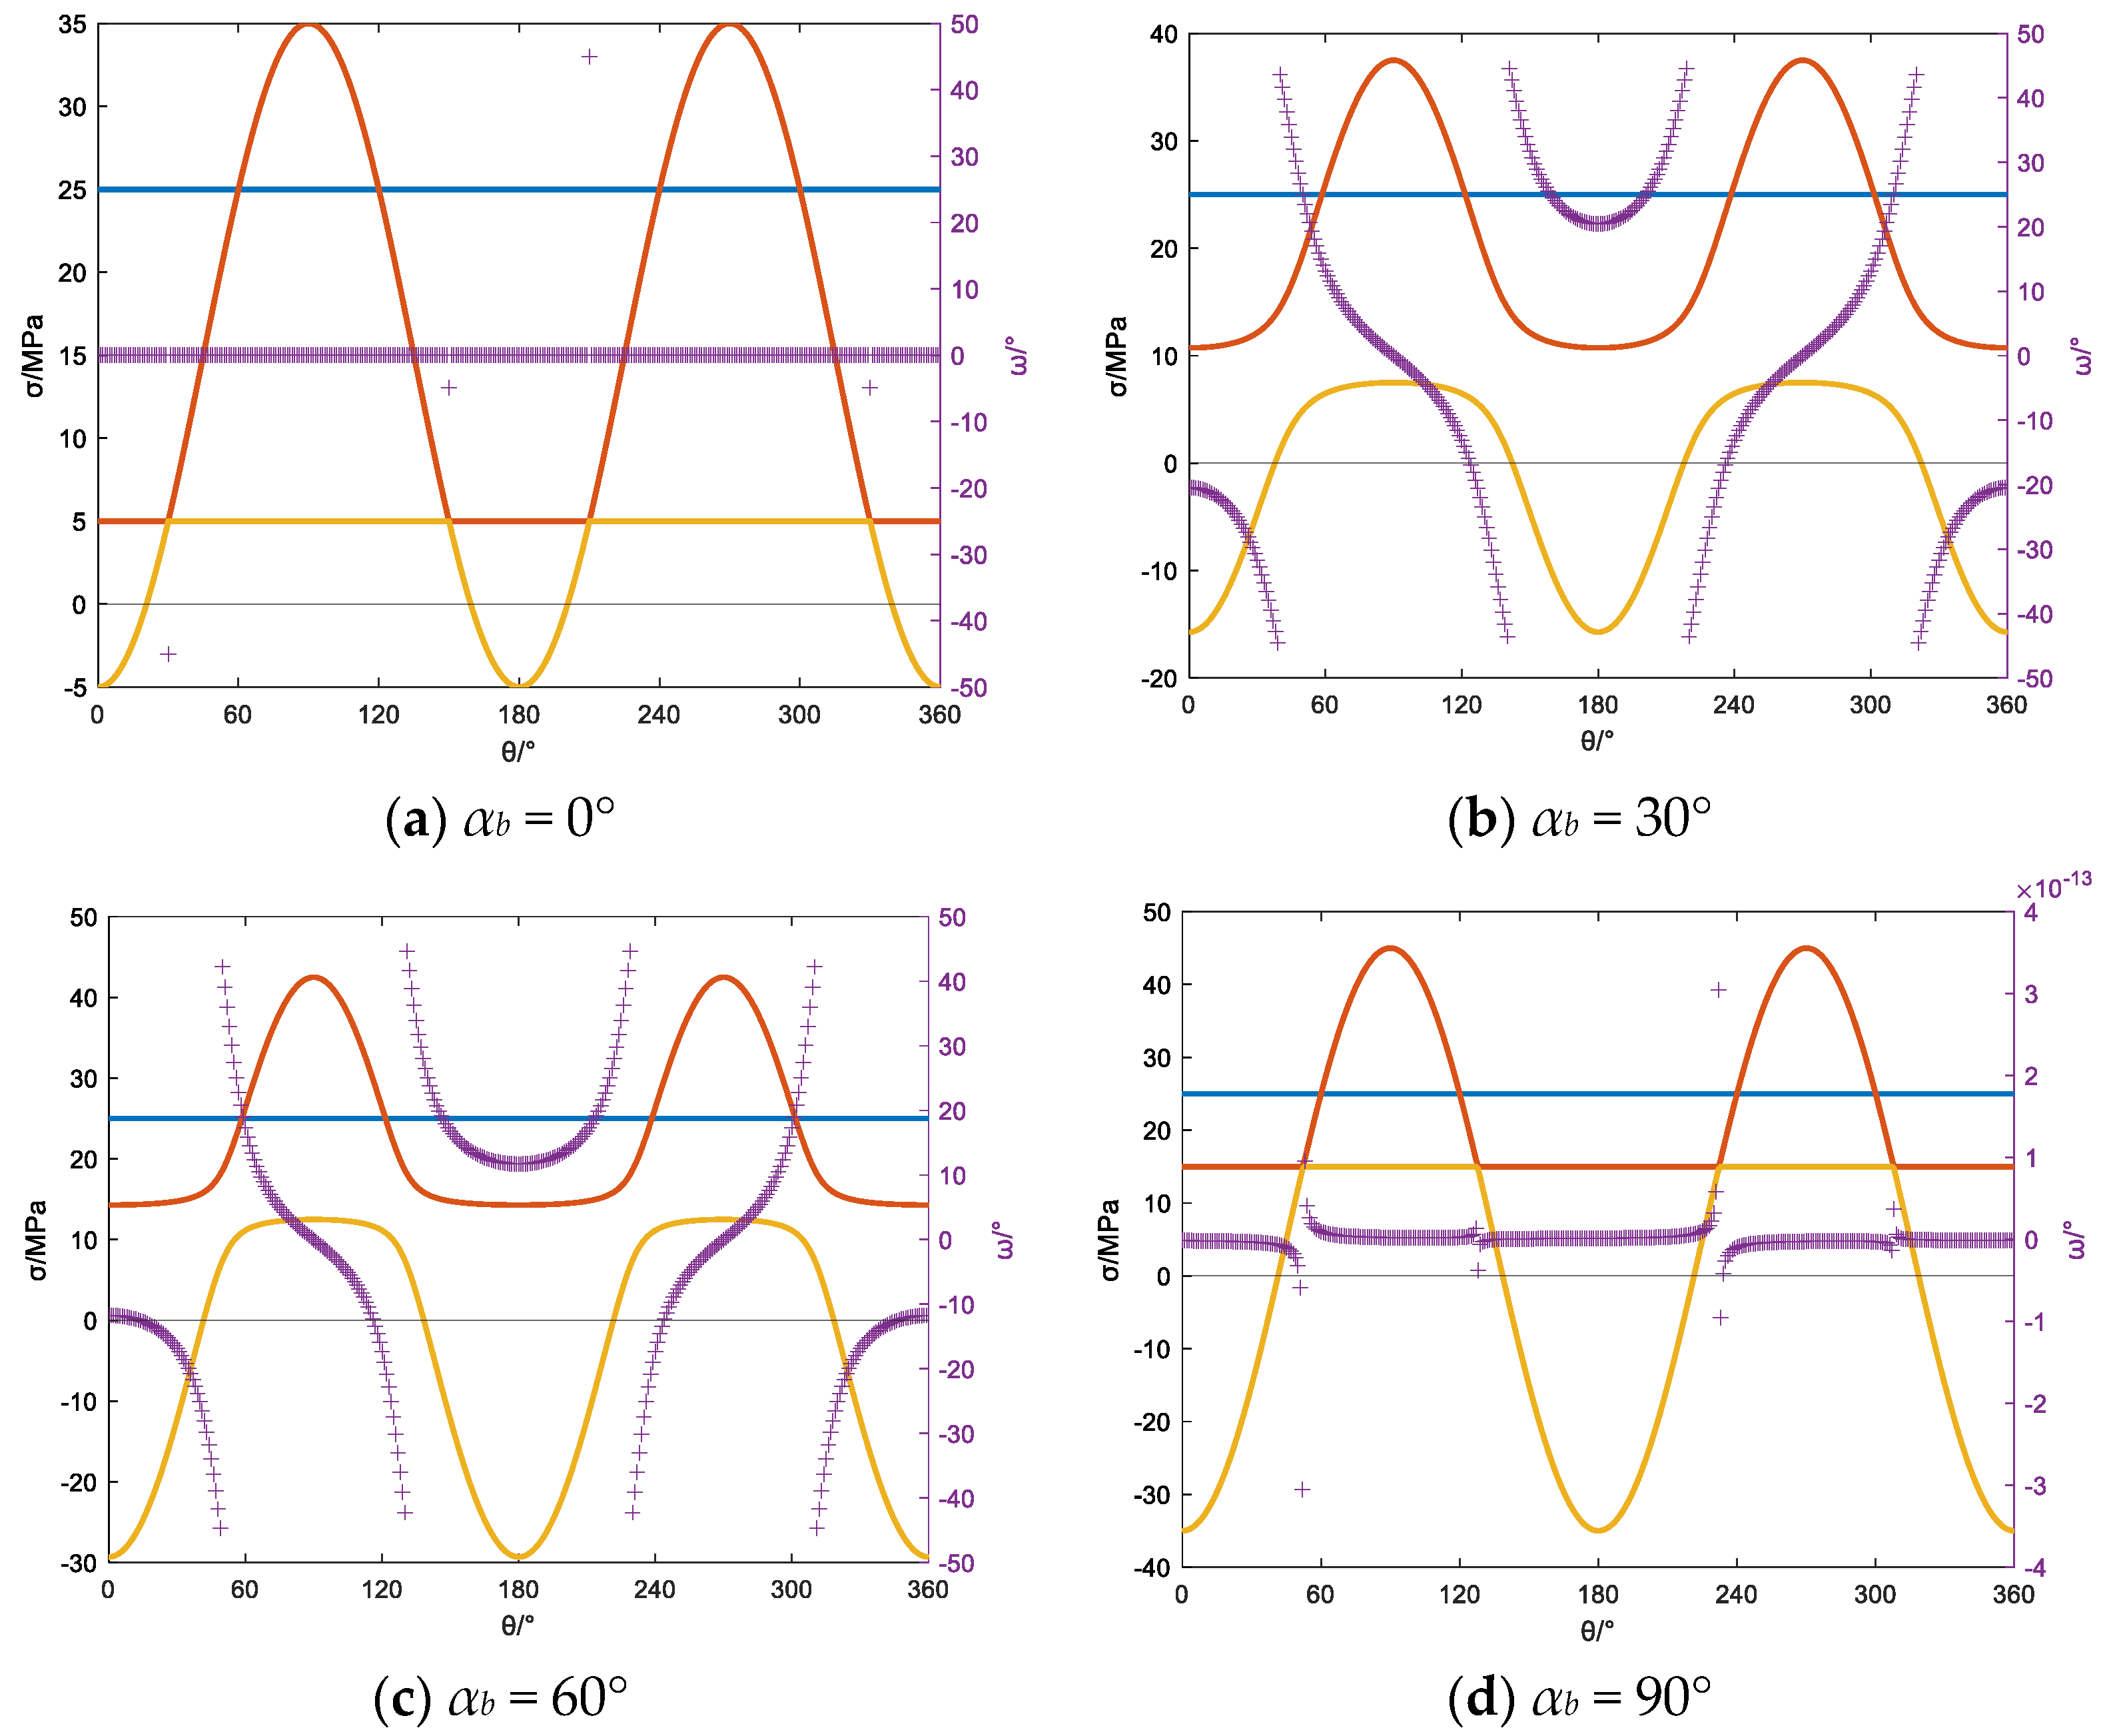
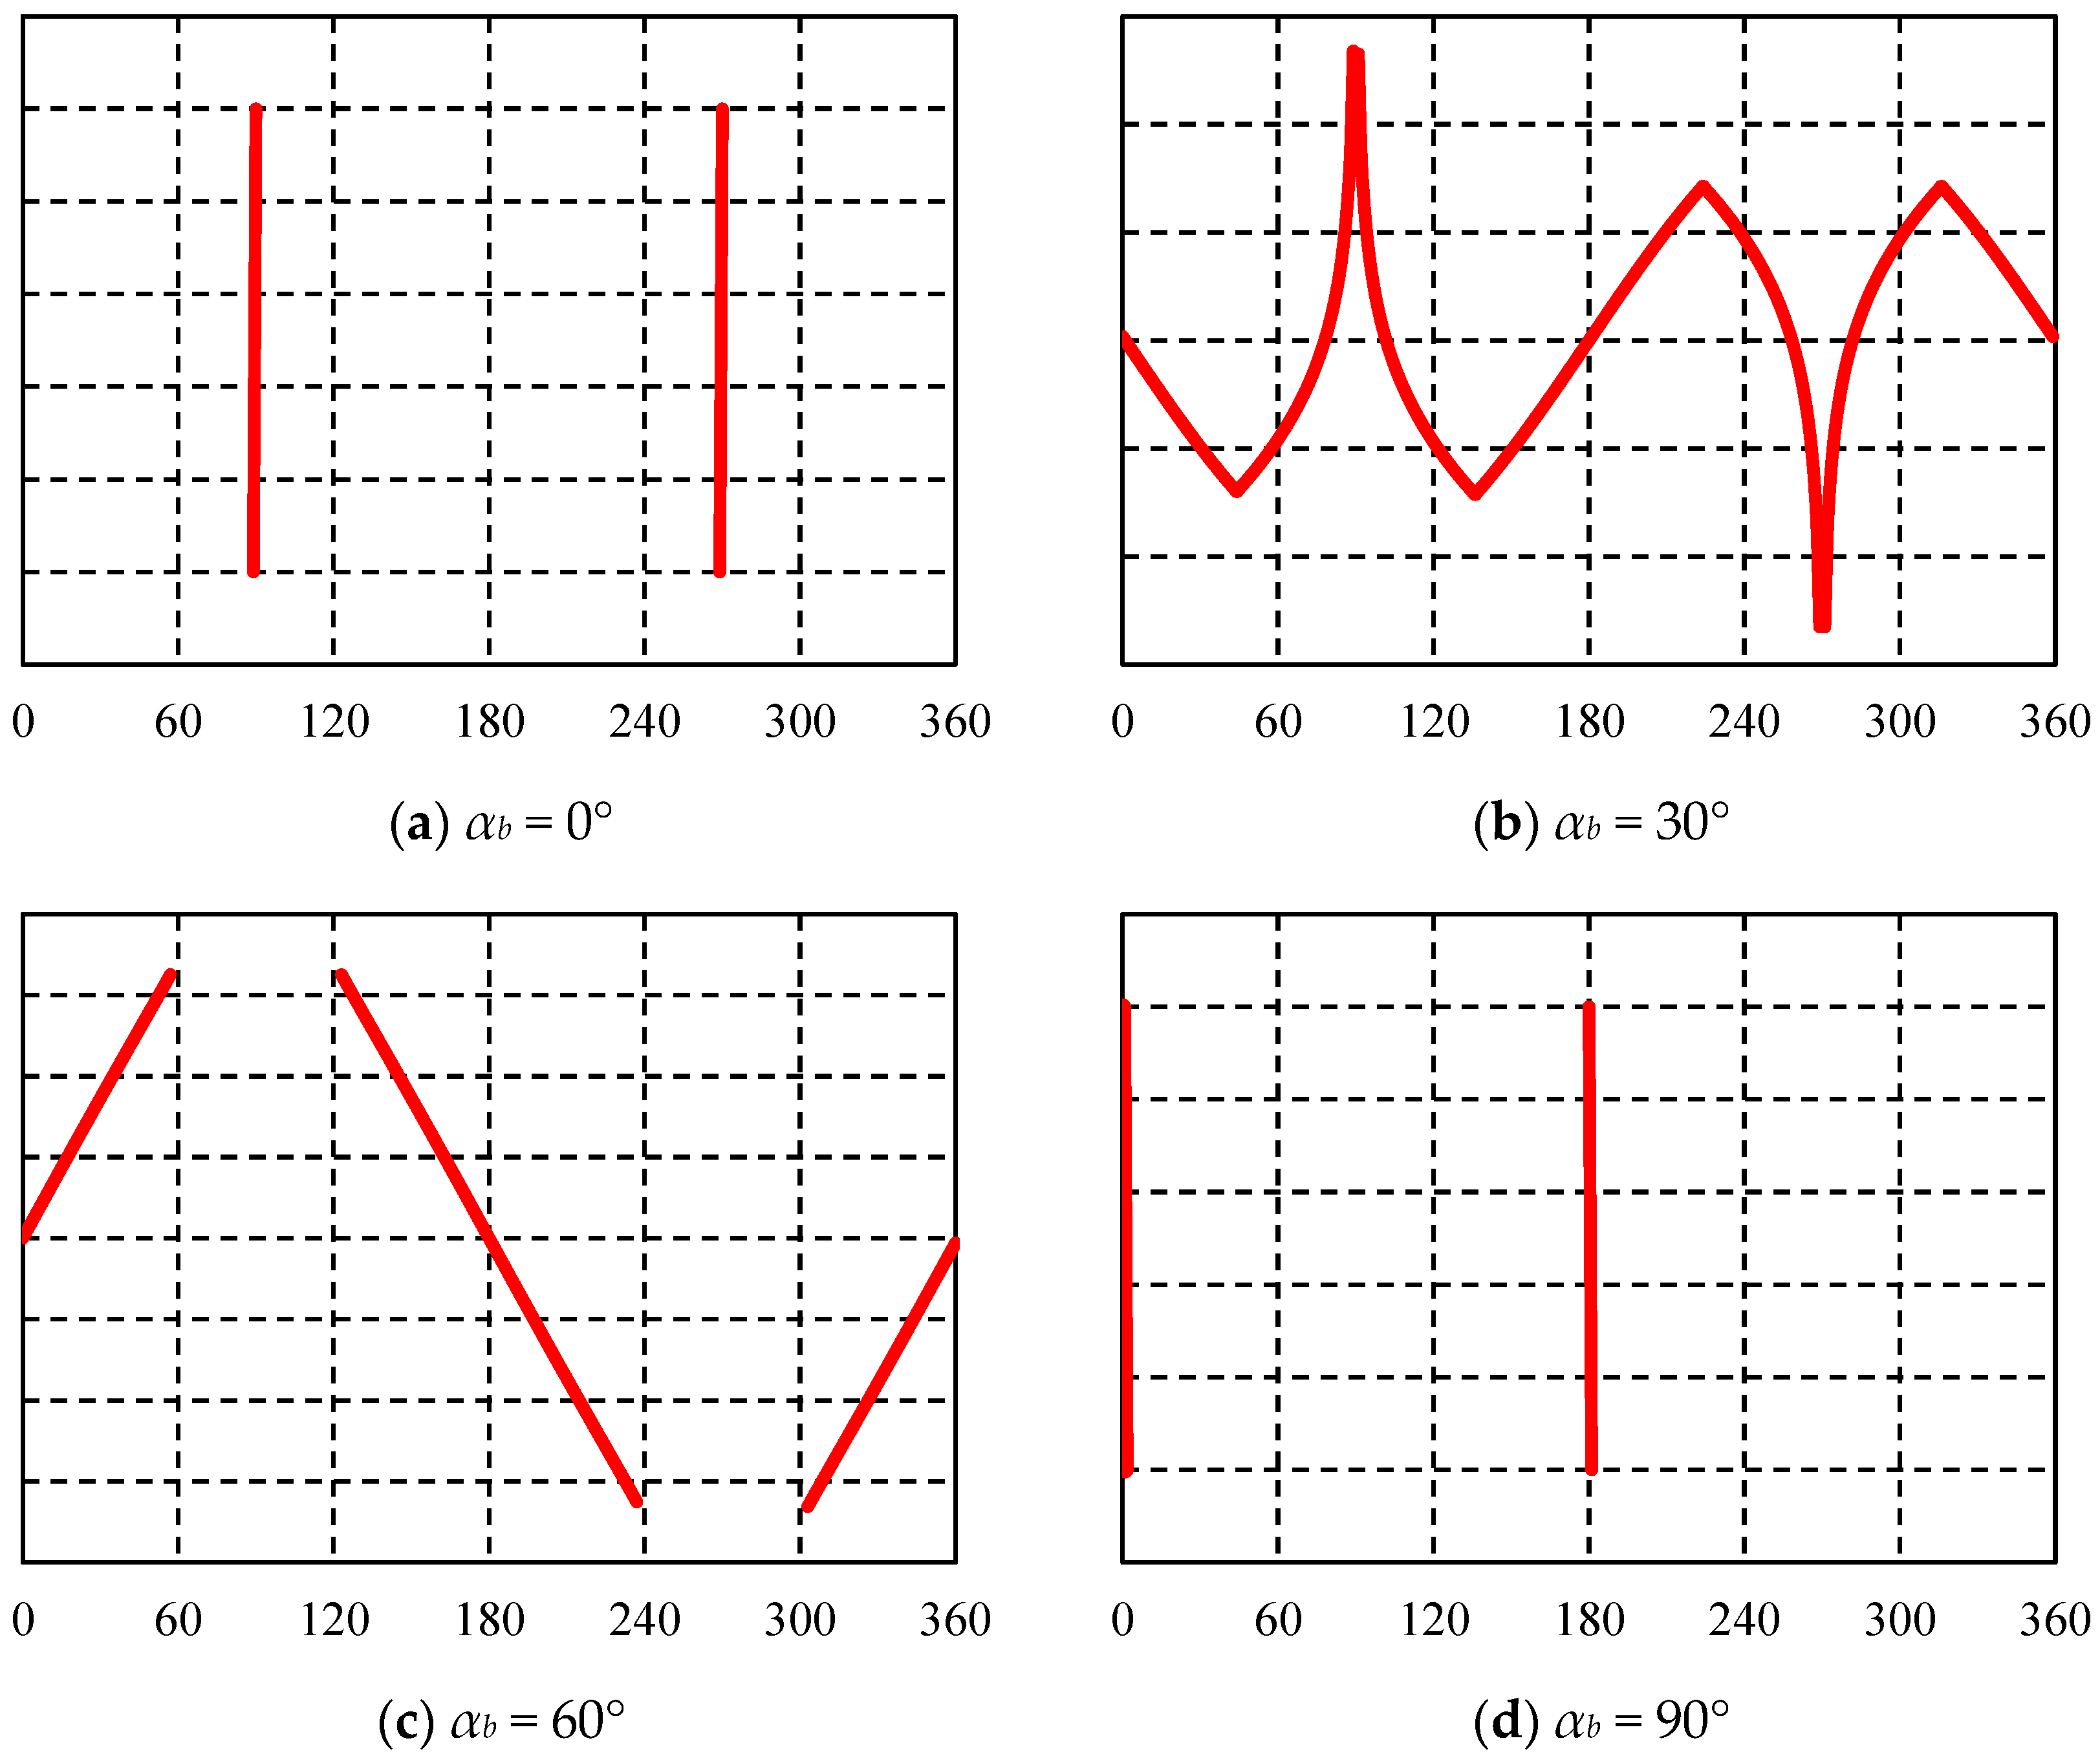
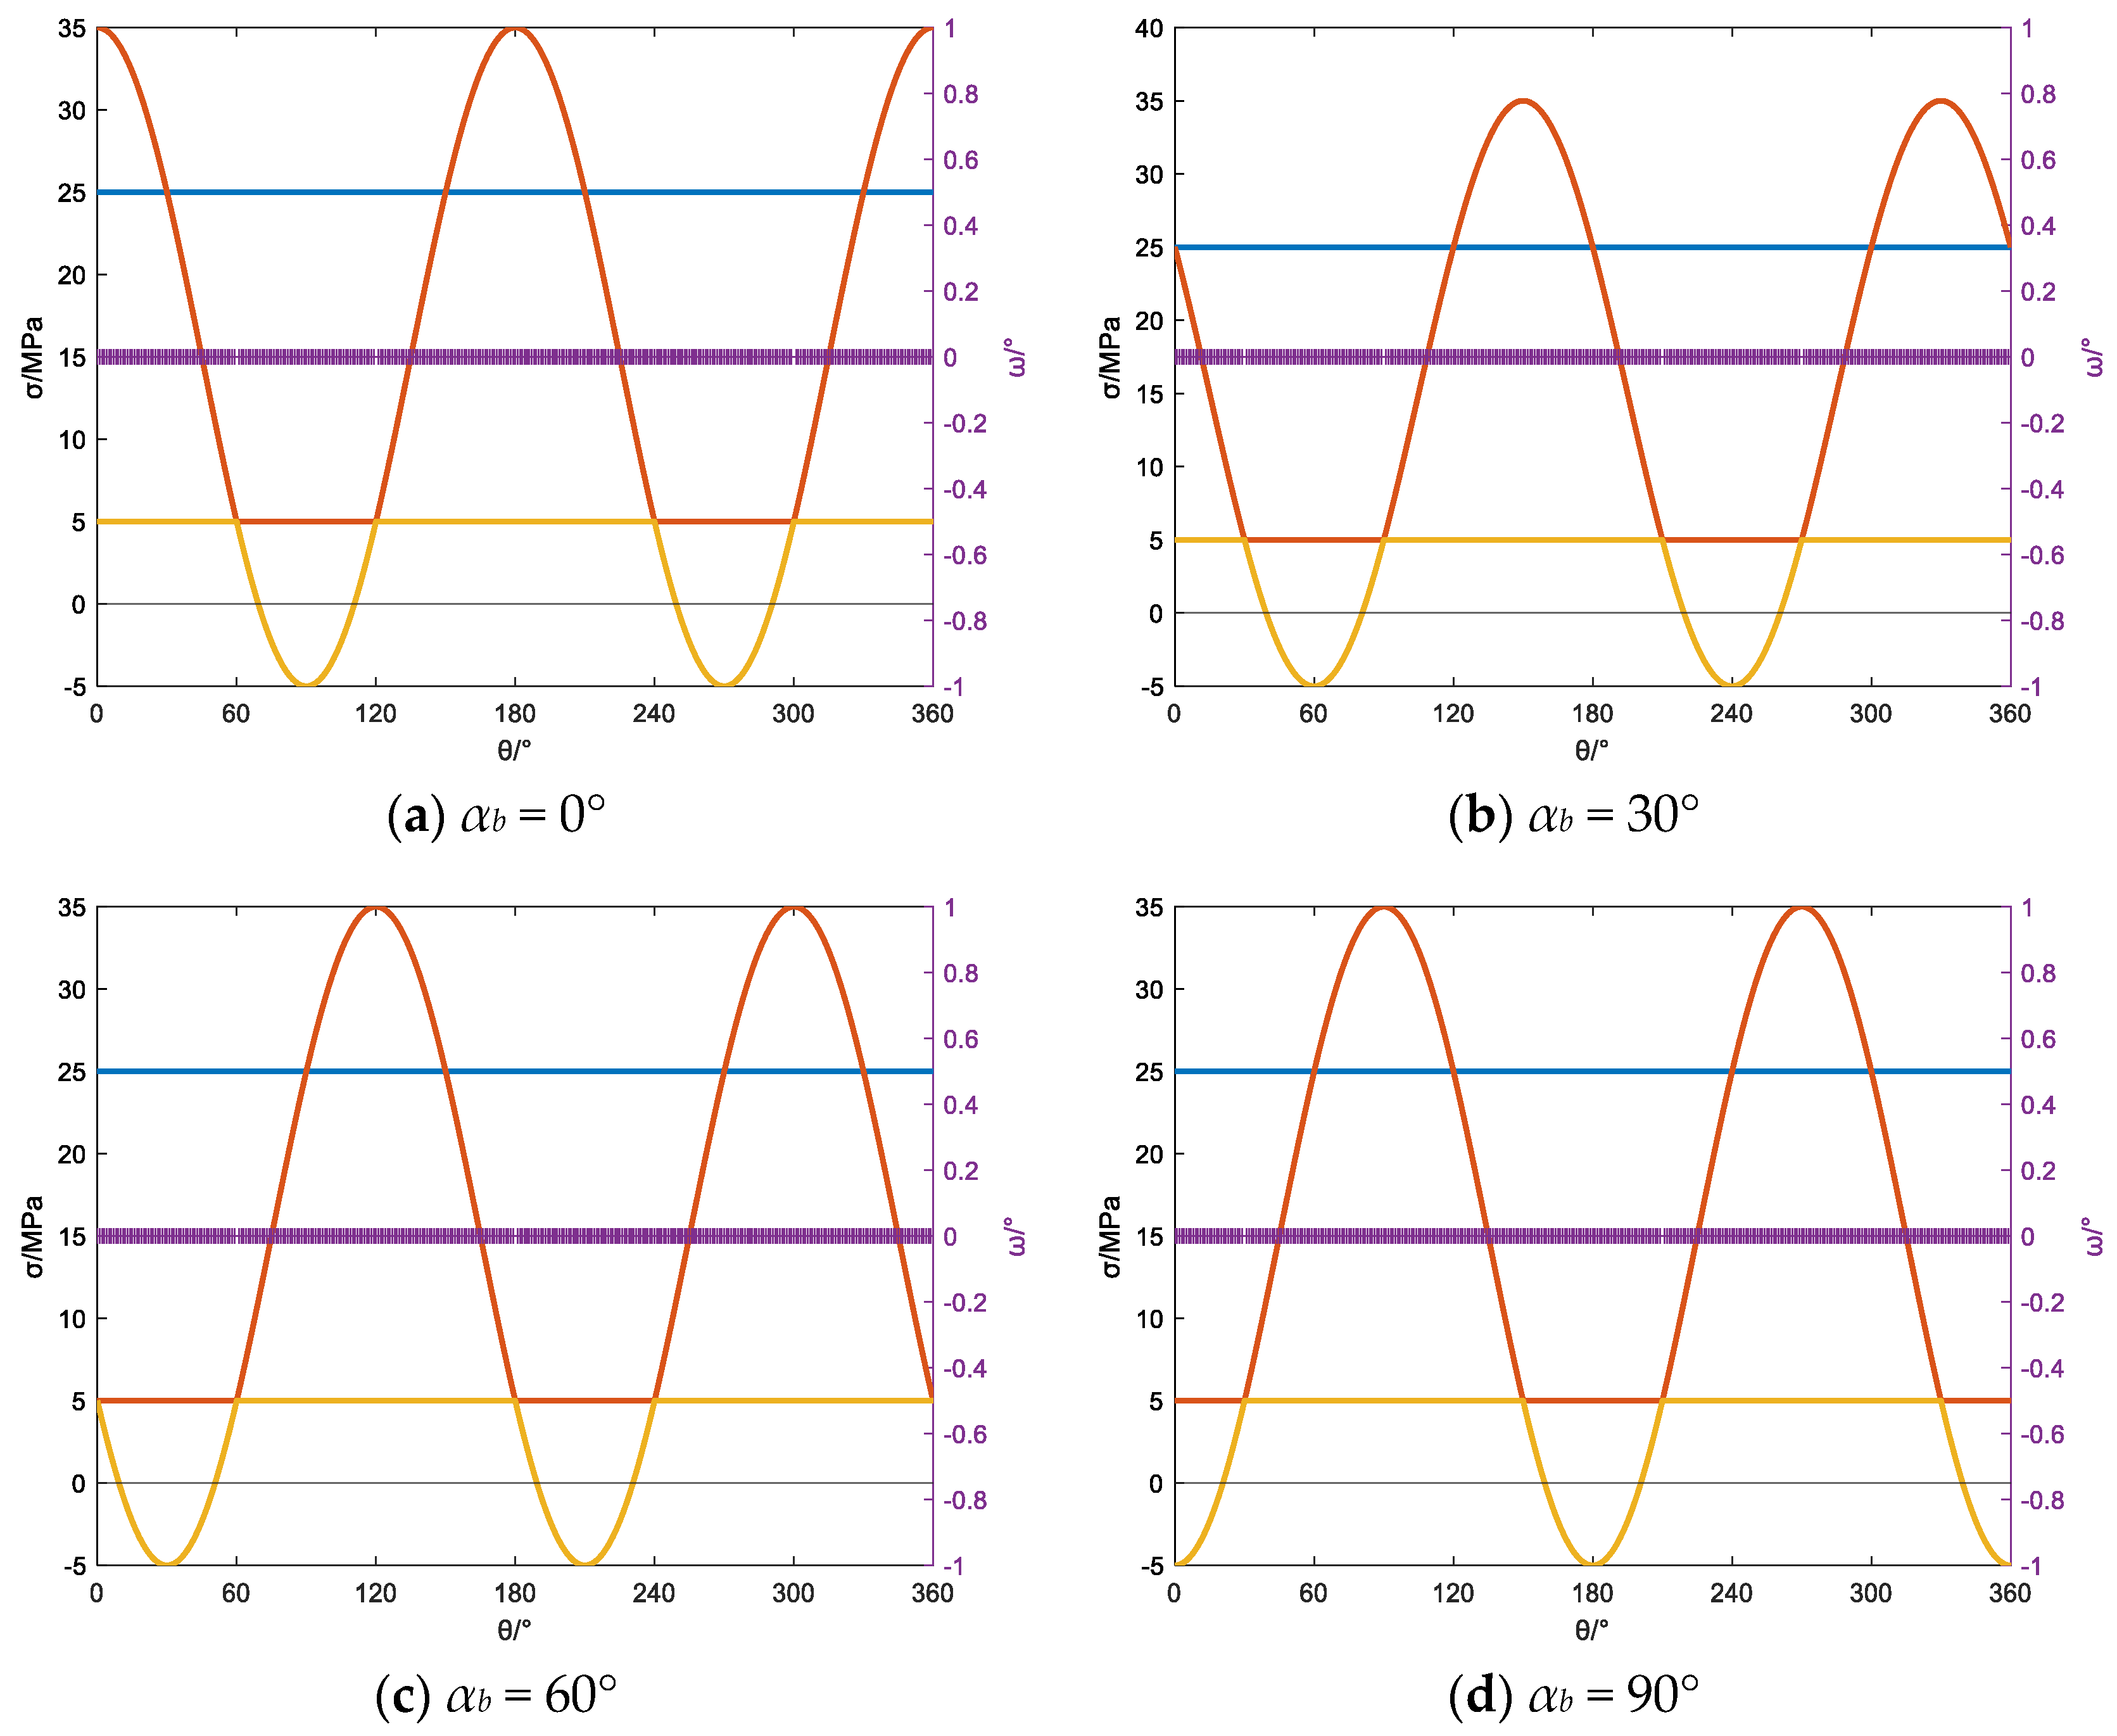
For horizontal wells drilled in different directions, the wellbore principal stresses and induced fracture patterns around the wellbore are illustrated in Figure 20 and Figure 21. In Figure 20, the left vertical axis indicates the principal stress, and the purple “+” and right vertical axis indicate the angle between the drilling-induced fracture and the borehole axis, in addition, the orange line represents the minimum principal stress around the wellbore wall, the blue line and red line represent the maximum principal stress intermediate principal stress respectively. When drilling the wellbore along the direction of the minimum horizontal stress, the minimum principal stress around the wellbore reaches its lowest values at 90° and 270°. Consequently, the angle between the induced fractures and the wellbore axis remains 0°. Therefore, two parallel fractures perpendicular to the vertical stress are generated along the direction of maximum horizontal stress. When drilling at an azimuth angle of 30°, the minimum principal stress around the wellbore rotates along the wellbore wall, resulting in tensional stresses throughout a full rotation, with the maximum tensile stress occurring at 0° and 180°. Combining this with the angle between the induced fractures and wellbore axis, the induced fracture pattern is as shown in Figure 21b. Similarly, when drilling at a 60° azimuth, the minimum principal stress around the wellbore also reaches its maximum tensile stress at 0° and 180°, but the variation in the angle between the induced fractures and wellbore axis is small. Therefore, feather-shaped induced fractures are produced. When drilling along the direction of the maximum horizontal stress, the minimum principal stress around the wellbore reaches its maximum tensile stress at 0° and 180°, resulting in two parallel fractures perpendicular to the direction of the minimum horizontal stress.
3.3. Reverse Fault
Under the reverse fault mechanism, the distribution of wellbore principal stresses and induced fracture patterns around the wellbore for different trajectories are illustrated in Figure 22, Figure 23, Figure 24, Figure 25, Figure 26, Figure 27 and Figure 28. In Figure 22, the left vertical axis indicates the principal stress, and the purple “+” and right vertical axis indicate the angle between the drilling-induced fracture and the borehole axis, in addition, the orange line represents the minimum principal stress around the wellbore wall, the blue line and red line represent the maximum principal stress intermediate principal stress respectively. For vertical wells, similar to the cases of normal faults and strike-slip faults, induced fractures around the wellbore always appear in the direction of the maximum horizontal stress, symmetrically spaced at intervals of 180°, and parallel to the wellbore axis.
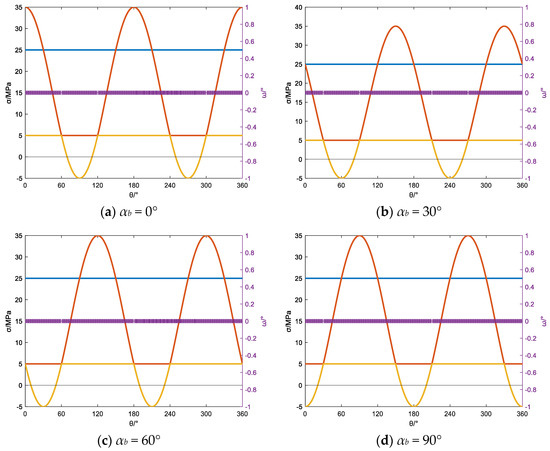
Figure 22.
Variation in principal stress and induced fracture angle in vertical wells.
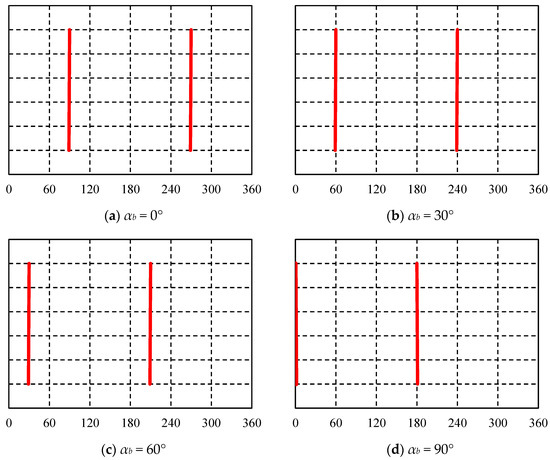
Figure 23.
Induced fracture occurrence in vertical well at different azimuths.
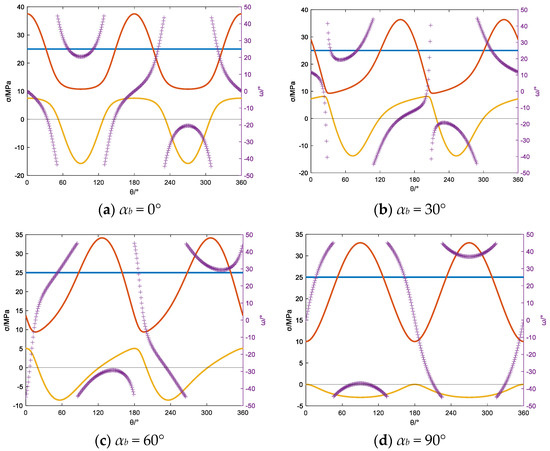
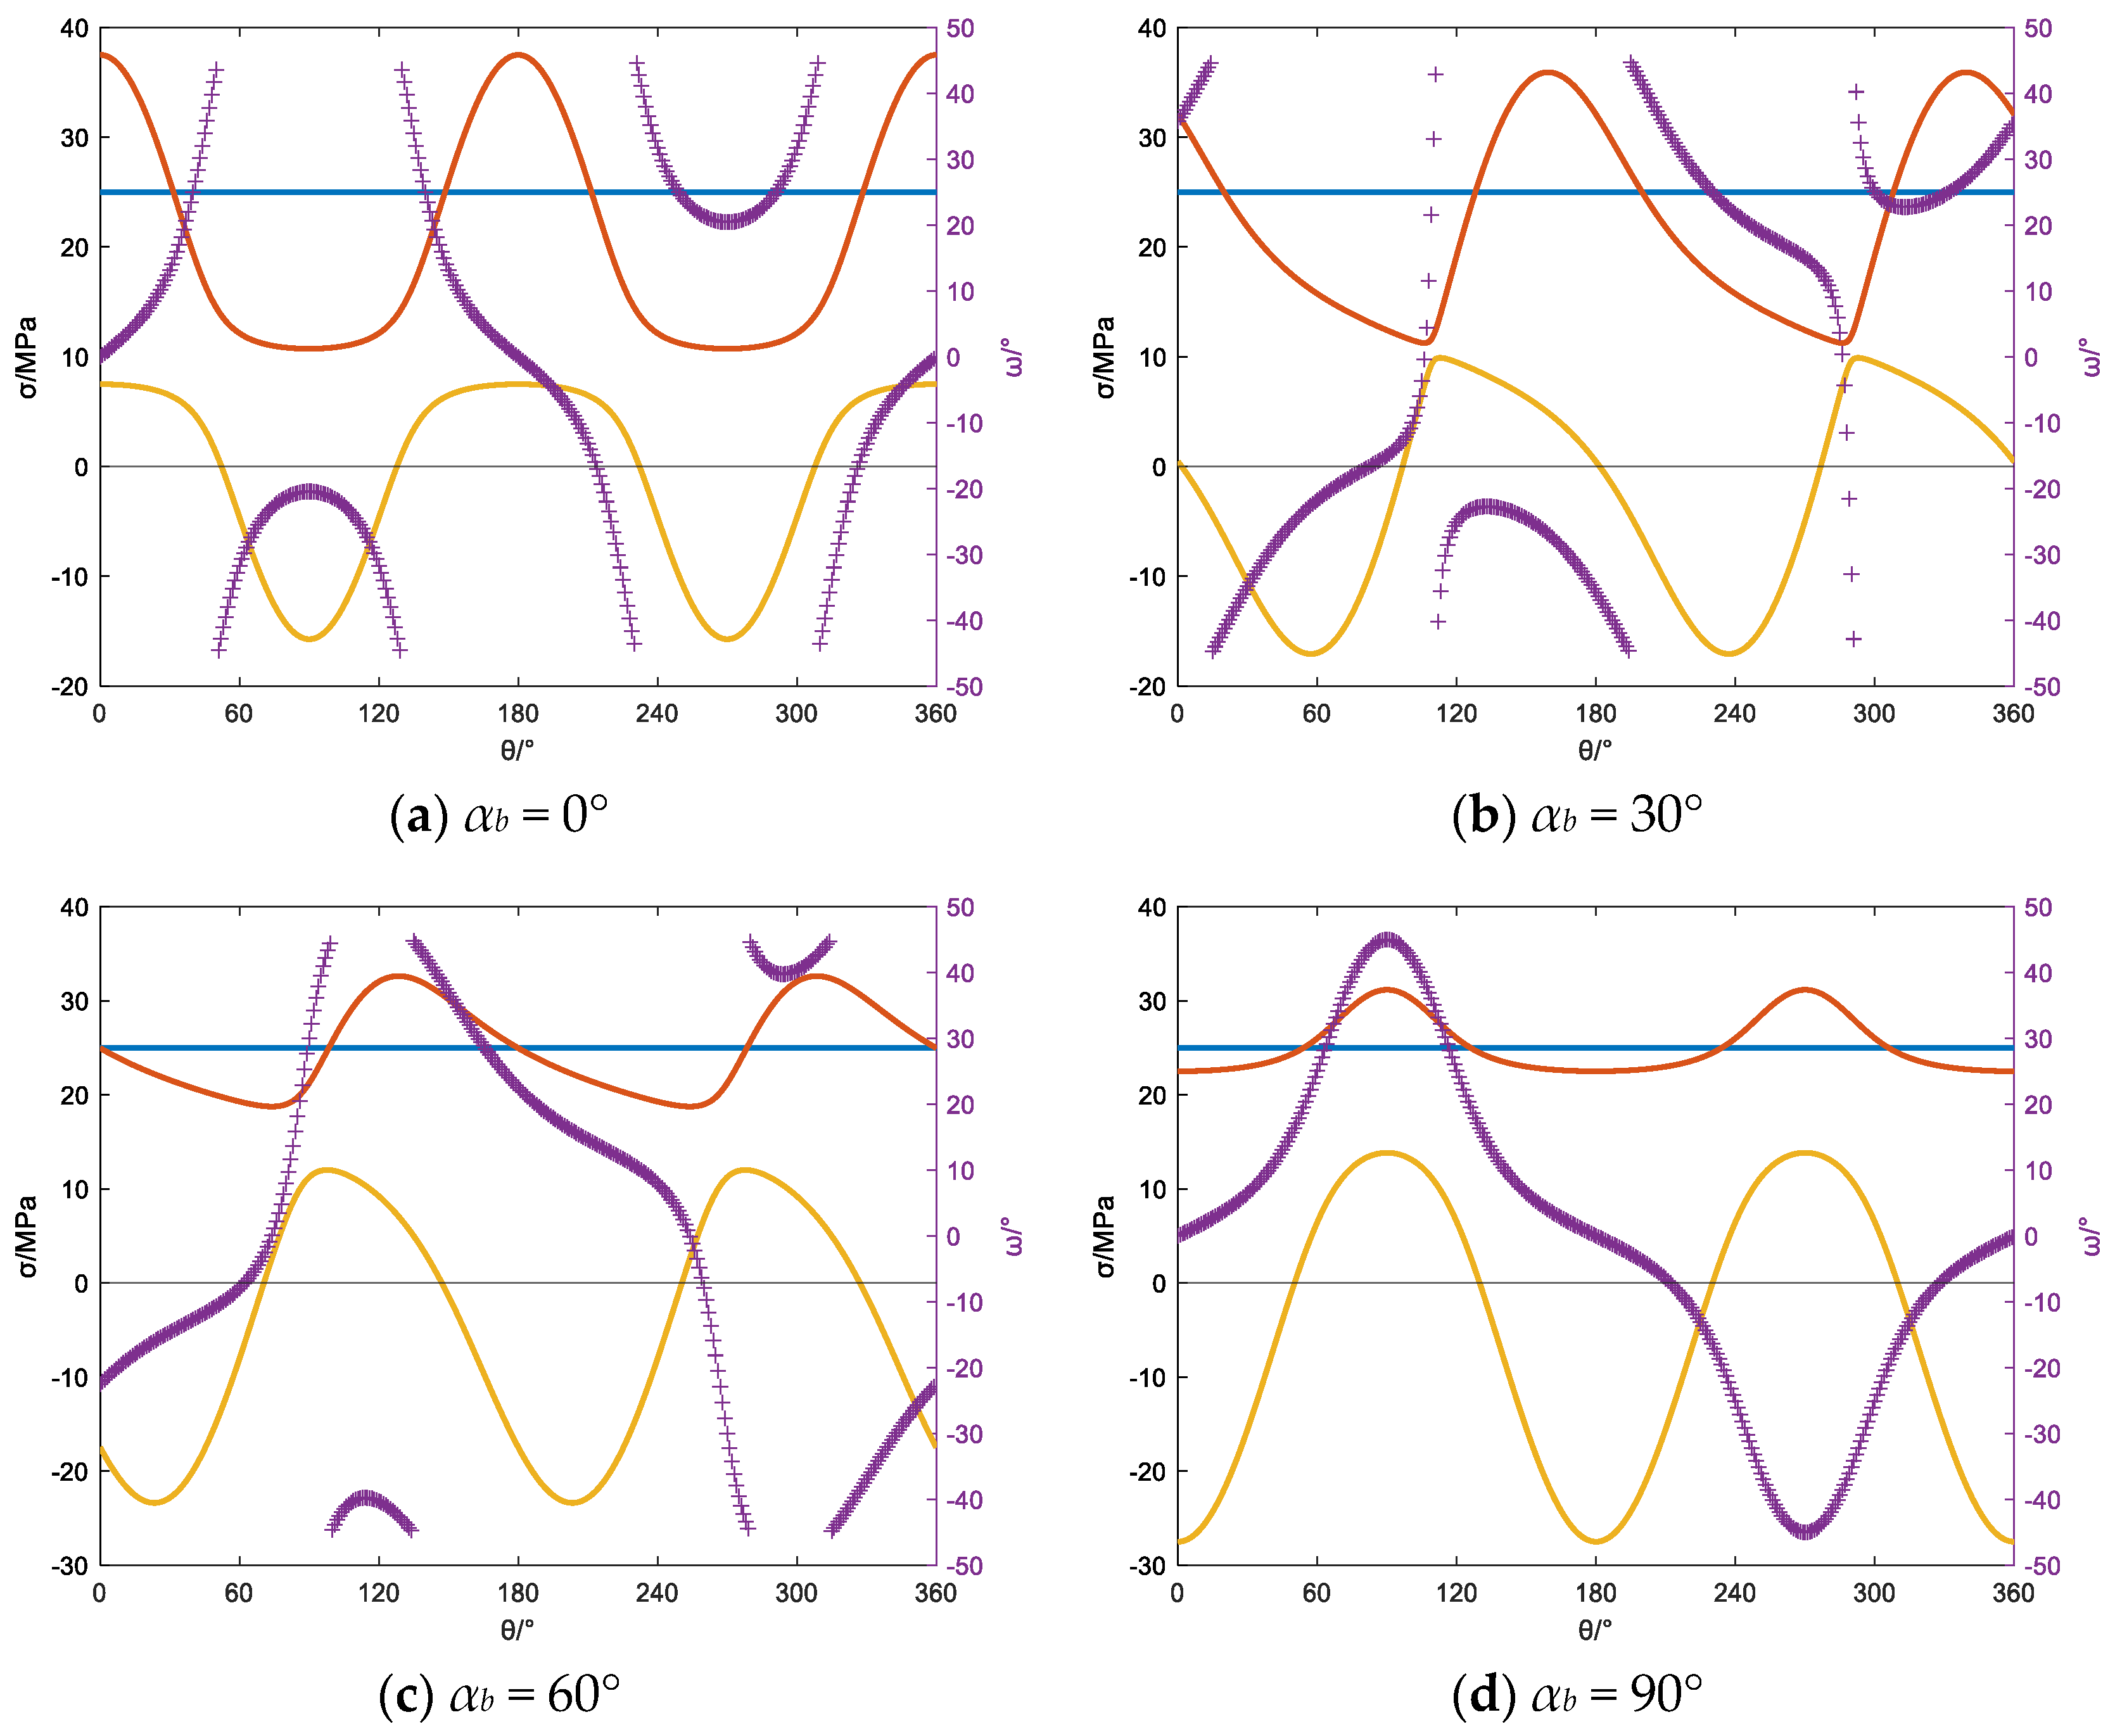
Figure 24.
Variation of the principal stress and induced fracture angle with βb = 30° at different azimuths.

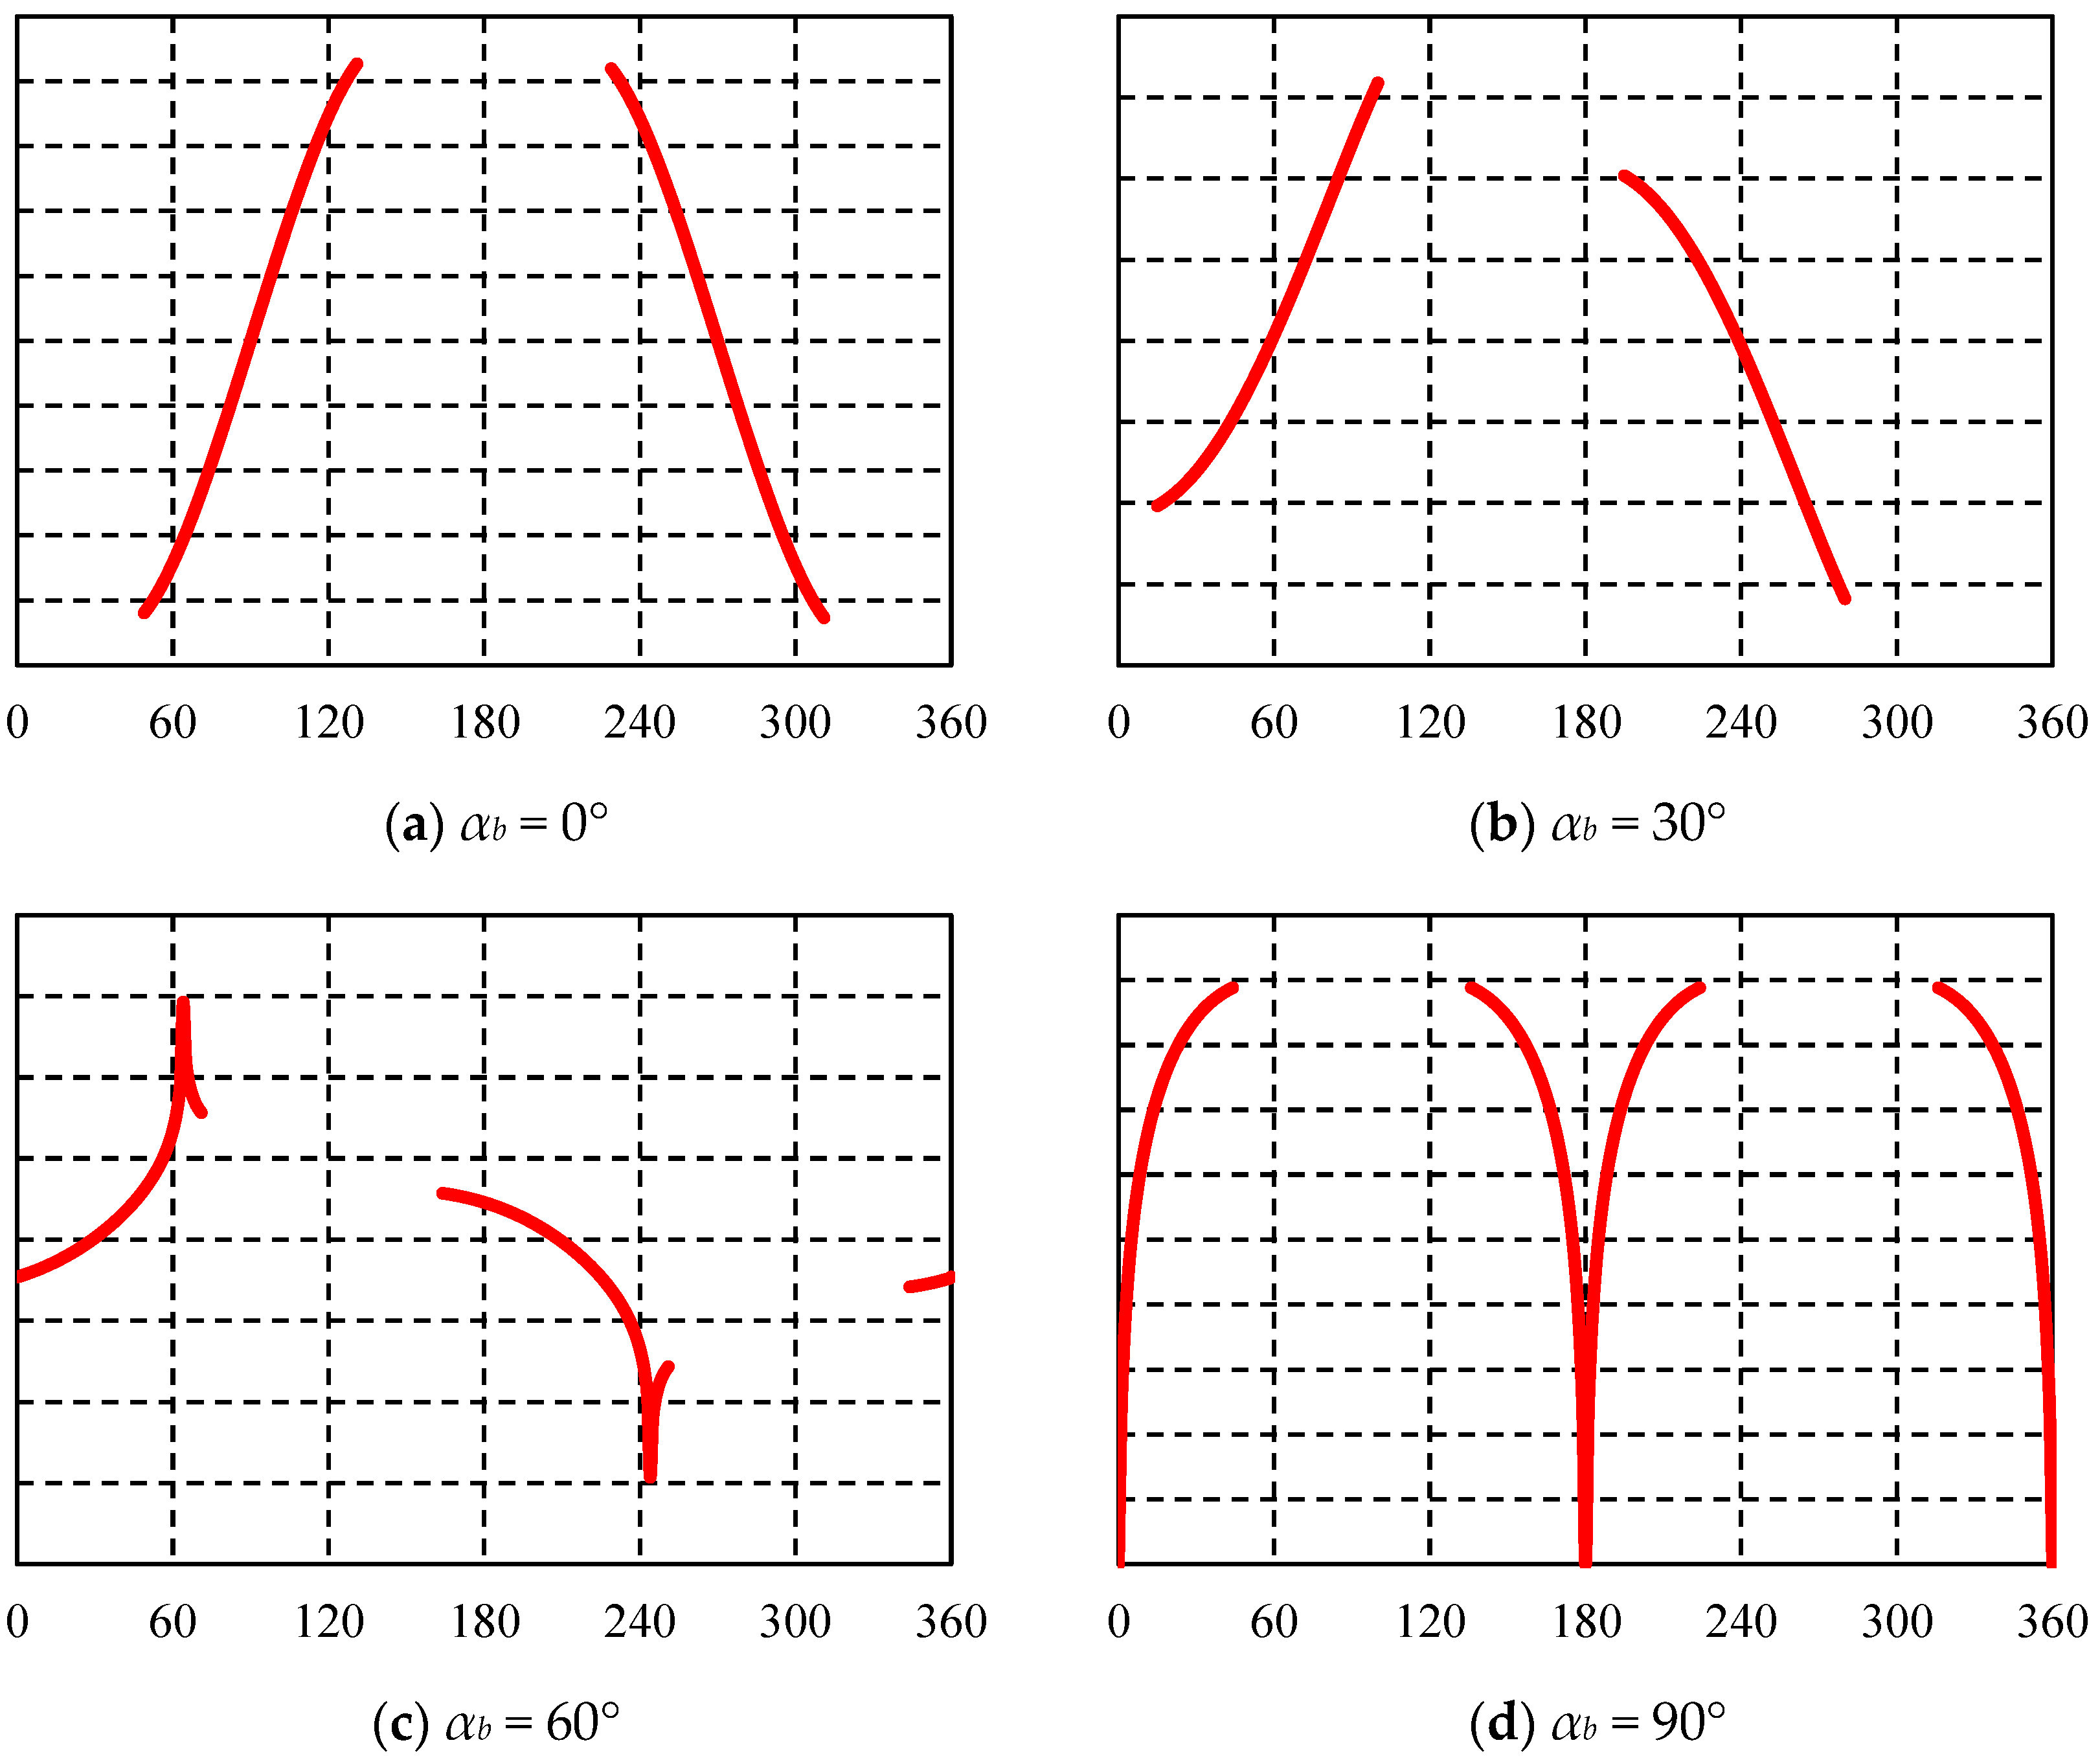
Figure 25.
Induced fracture occurrence of well with βb = 30° at different azimuths.
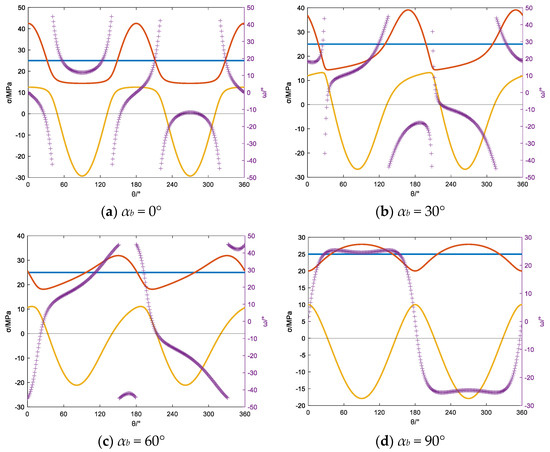
Figure 26.
Variation in the principal stress and induced fracture angle with βb = 60° at different azimuths.

Figure 27.
Induced fracture occurrence of well with βb = 60° at different azimuths.
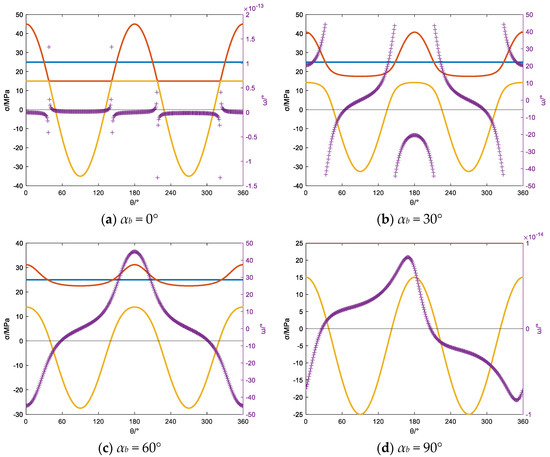
Figure 28.
Variation in the principal stress and induced fracture angle with βb = 90° at different azimuths.
When the inclination angle is 30°, the distribution of wellbore principal stresses and the induced fracture patterns around the wellbore for different azimuths are shown in Figure 24 and Figure 25. In Figure 24, the left vertical axis indicates the principal stress, and the purple “+” and right vertical axis indicate the angle between the drilling-induced fracture and the borehole axis, in addition, the orange line represents the minimum principal stress around the wellbore wall, the blue line and red line represent the maximum principal stress intermediate principal stress respectively. When drilling along the direction of minimum horizontal stress, the minimum principal stress around the wellbore exhibits tensile stress within the range of 55° to 127° and 233° to 307° around the wellbore. At this point, the variation in the angle between the induced fractures and the wellbore axis is within 20°, resulting in induced fractures in a transitional state between feather-like and “J-shaped” patterns. As the azimuth increases, the variation in the angle between the induced fractures and the wellbore axis gradually increases, and the induced fracture pattern around the wellbore evolves into fractures with pronounced “J-shaped” characteristics. Eventually, when drilling along the direction of the maximum horizontal stress, as shown in Figure 25b, “M-shaped” induced fractures occur around the wellbore.
When the inclination angle is 60°, the distribution of wellbore principal stresses and the induced fracture patterns around the wellbore for different azimuths are shown in Figure 26 and Figure 27. In Figure 26, the left vertical axis indicates the principal stress, and the purple “+” and right vertical axis indicate the angle between the drilling-induced fracture and the borehole axis, in addition, the orange line represents the minimum principal stress around the wellbore wall, the blue line and red line represent the maximum principal stress intermediate principal stress respectively. When the wellbore is drilled along the direction of minimum horizontal stress, the minimum principal stress around the wellbore exhibits tensile stress within the range of 50° to 131° and 229° to 311° around the wellbore. At this point, the variation in the angle between the induced fractures and the wellbore axis is below 20°, resulting in induced fracture patterns in a transitional state between feather-like and “J-shaped” patterns, as shown in Figure 27a. When the azimuth of the wellbore is 30° and 60°, the variation in the angle between the induced fractures and the wellbore axis increases, leading to induced fractures with “J-shaped” characteristics, as depicted in Figure 27b,c. When drilling the wellbore along the direction of maximum horizontal stress and within the range where the minimum principal stress around the wellbore becomes tensile stress, the angle variation between the induced fractures and the wellbore axis remains less than 10°. This condition leads to the formation of feather-like induced fractures around the wellbore.
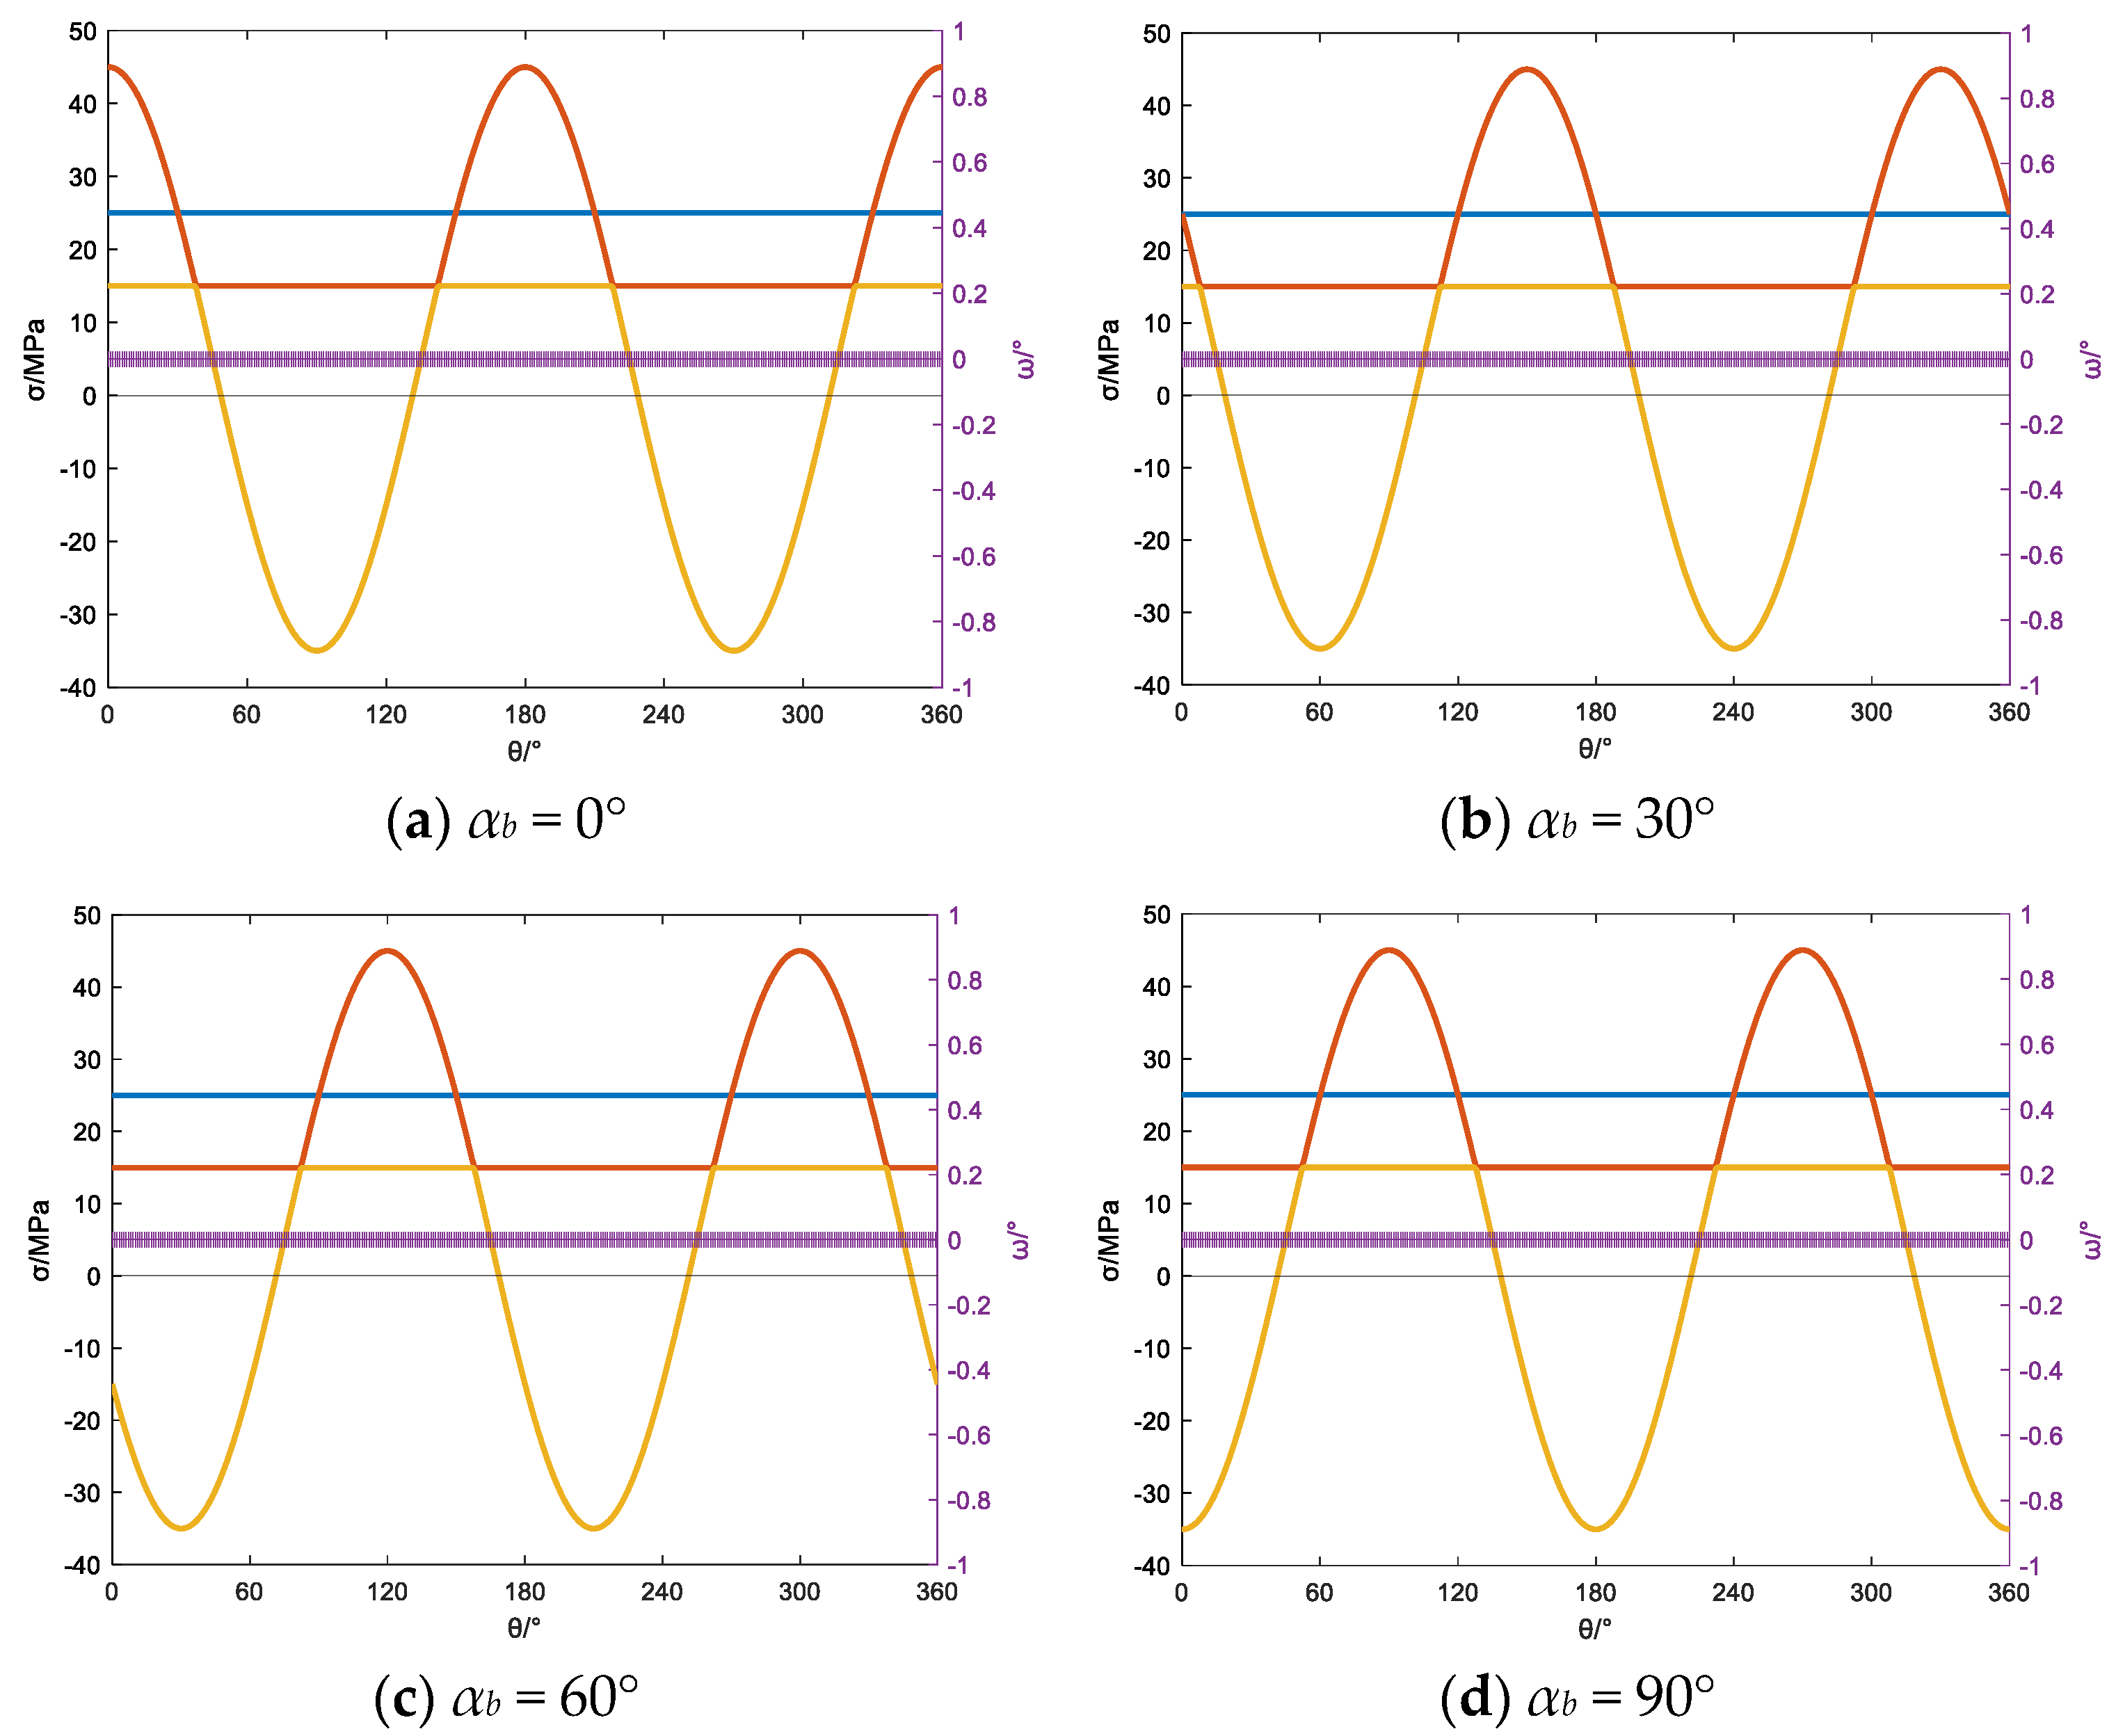
In Figure 28, the left vertical axis indicates the principal stress, and the purple “+” and right vertical axis indicate the angle between the drilling-induced fracture and the borehole axis, in addition, the orange line represents the minimum principal stress around the wellbore wall, the blue line and red line represent the maximum principal stress intermediate principal stress respectively. For horizontal wells operating under the reverse fault stress regime, where the vertical stress represents the minimum horizontal stress, the maximum tensile stress around the wellbore is observed at a wellbore angle of 90°. When the wellbore is oriented in the direction of the maximum or minimum horizontal stress, the angle between the induced fractures and the wellbore axis is 0°, resulting in two fractures perpendicular to the vertical stress. When the azimuth of the wellbore is 30° and 60°, and the minimum principal stress around the wellbore is tensile stress, the variation in the angle between the induced fractures and the wellbore axis significantly increases. This leads to induced fracture patterns resembling sine waves, as illustrated in Figure 29b,c.
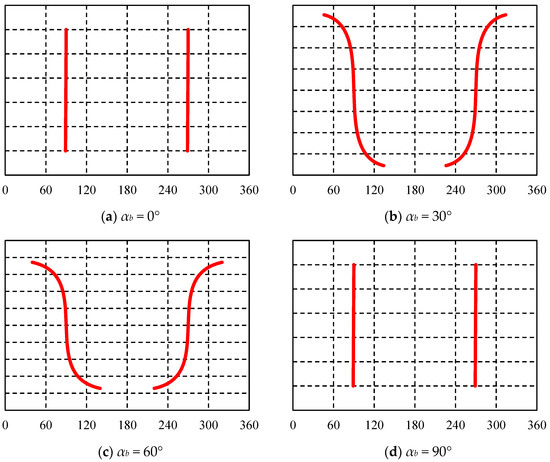
Figure 29.
Induced fracture occurrence of well with βb = 90° at different azimuths.
4. Field Application
In reservoir evaluation, accurately and effectively identifying natural fractures, as well as distinguishing and excluding the influence of induced fractures, is crucial. This is especially challenging in the Ordovician carbonate reservoirs of the Shunbei oil and gas field, where heterogeneity is significant, reservoir types vary widely, and fractures exhibit diverse morphologies. Therefore, correctly identifying induced fractures is particularly important in this context.
Shunbei oil and gas field is located in the main part of the Shuntoguole low uplift in the Tarim Basin, with an area of 2.8 × 10⁴ km2. The northern Shaya uplift in the Shunbei area generally shows the development of “X” type strike-slip fault system, while the southern part of Tazhong Uplift and Shuntogule low uplift (Shunbei 2–Shunbei 4 and Shunnan 1–Shunnan 2) mainly develops NE or NNE trending single-shear strike-slip fault system. Shunbei Area 1 is located in the transition zone between the “X” type strike-slip fault system and the single-shear strike-slip fault system. This study takes the Ordovician fractured carbonate reservoir in the Shunbei oil and gas field No. 5 fault zone as the research object. According to the actual drilling data of the exploration well in the working area, the Ordovician stratum in Shunbei has a high fracture degree and poor cementation. Taking the Shunbei No. 5 fault zone as an example, which is affected by tectonic stress, the fault zone is divided into translation, extrusion, and tension sections from south to north (Figure 30). In the process of drilling, the reservoirs in the extrusion section and the pull section are typical fractured carbonate formations, and the problem of wellbore instability is prominent.
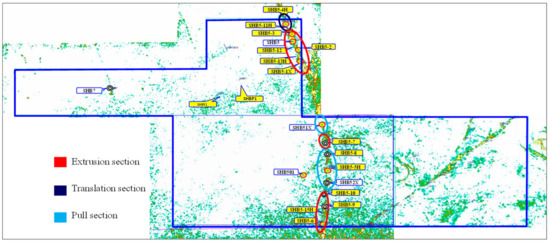
Figure 30.
Distribution of fault zones in the Shunbei oil and gas field.
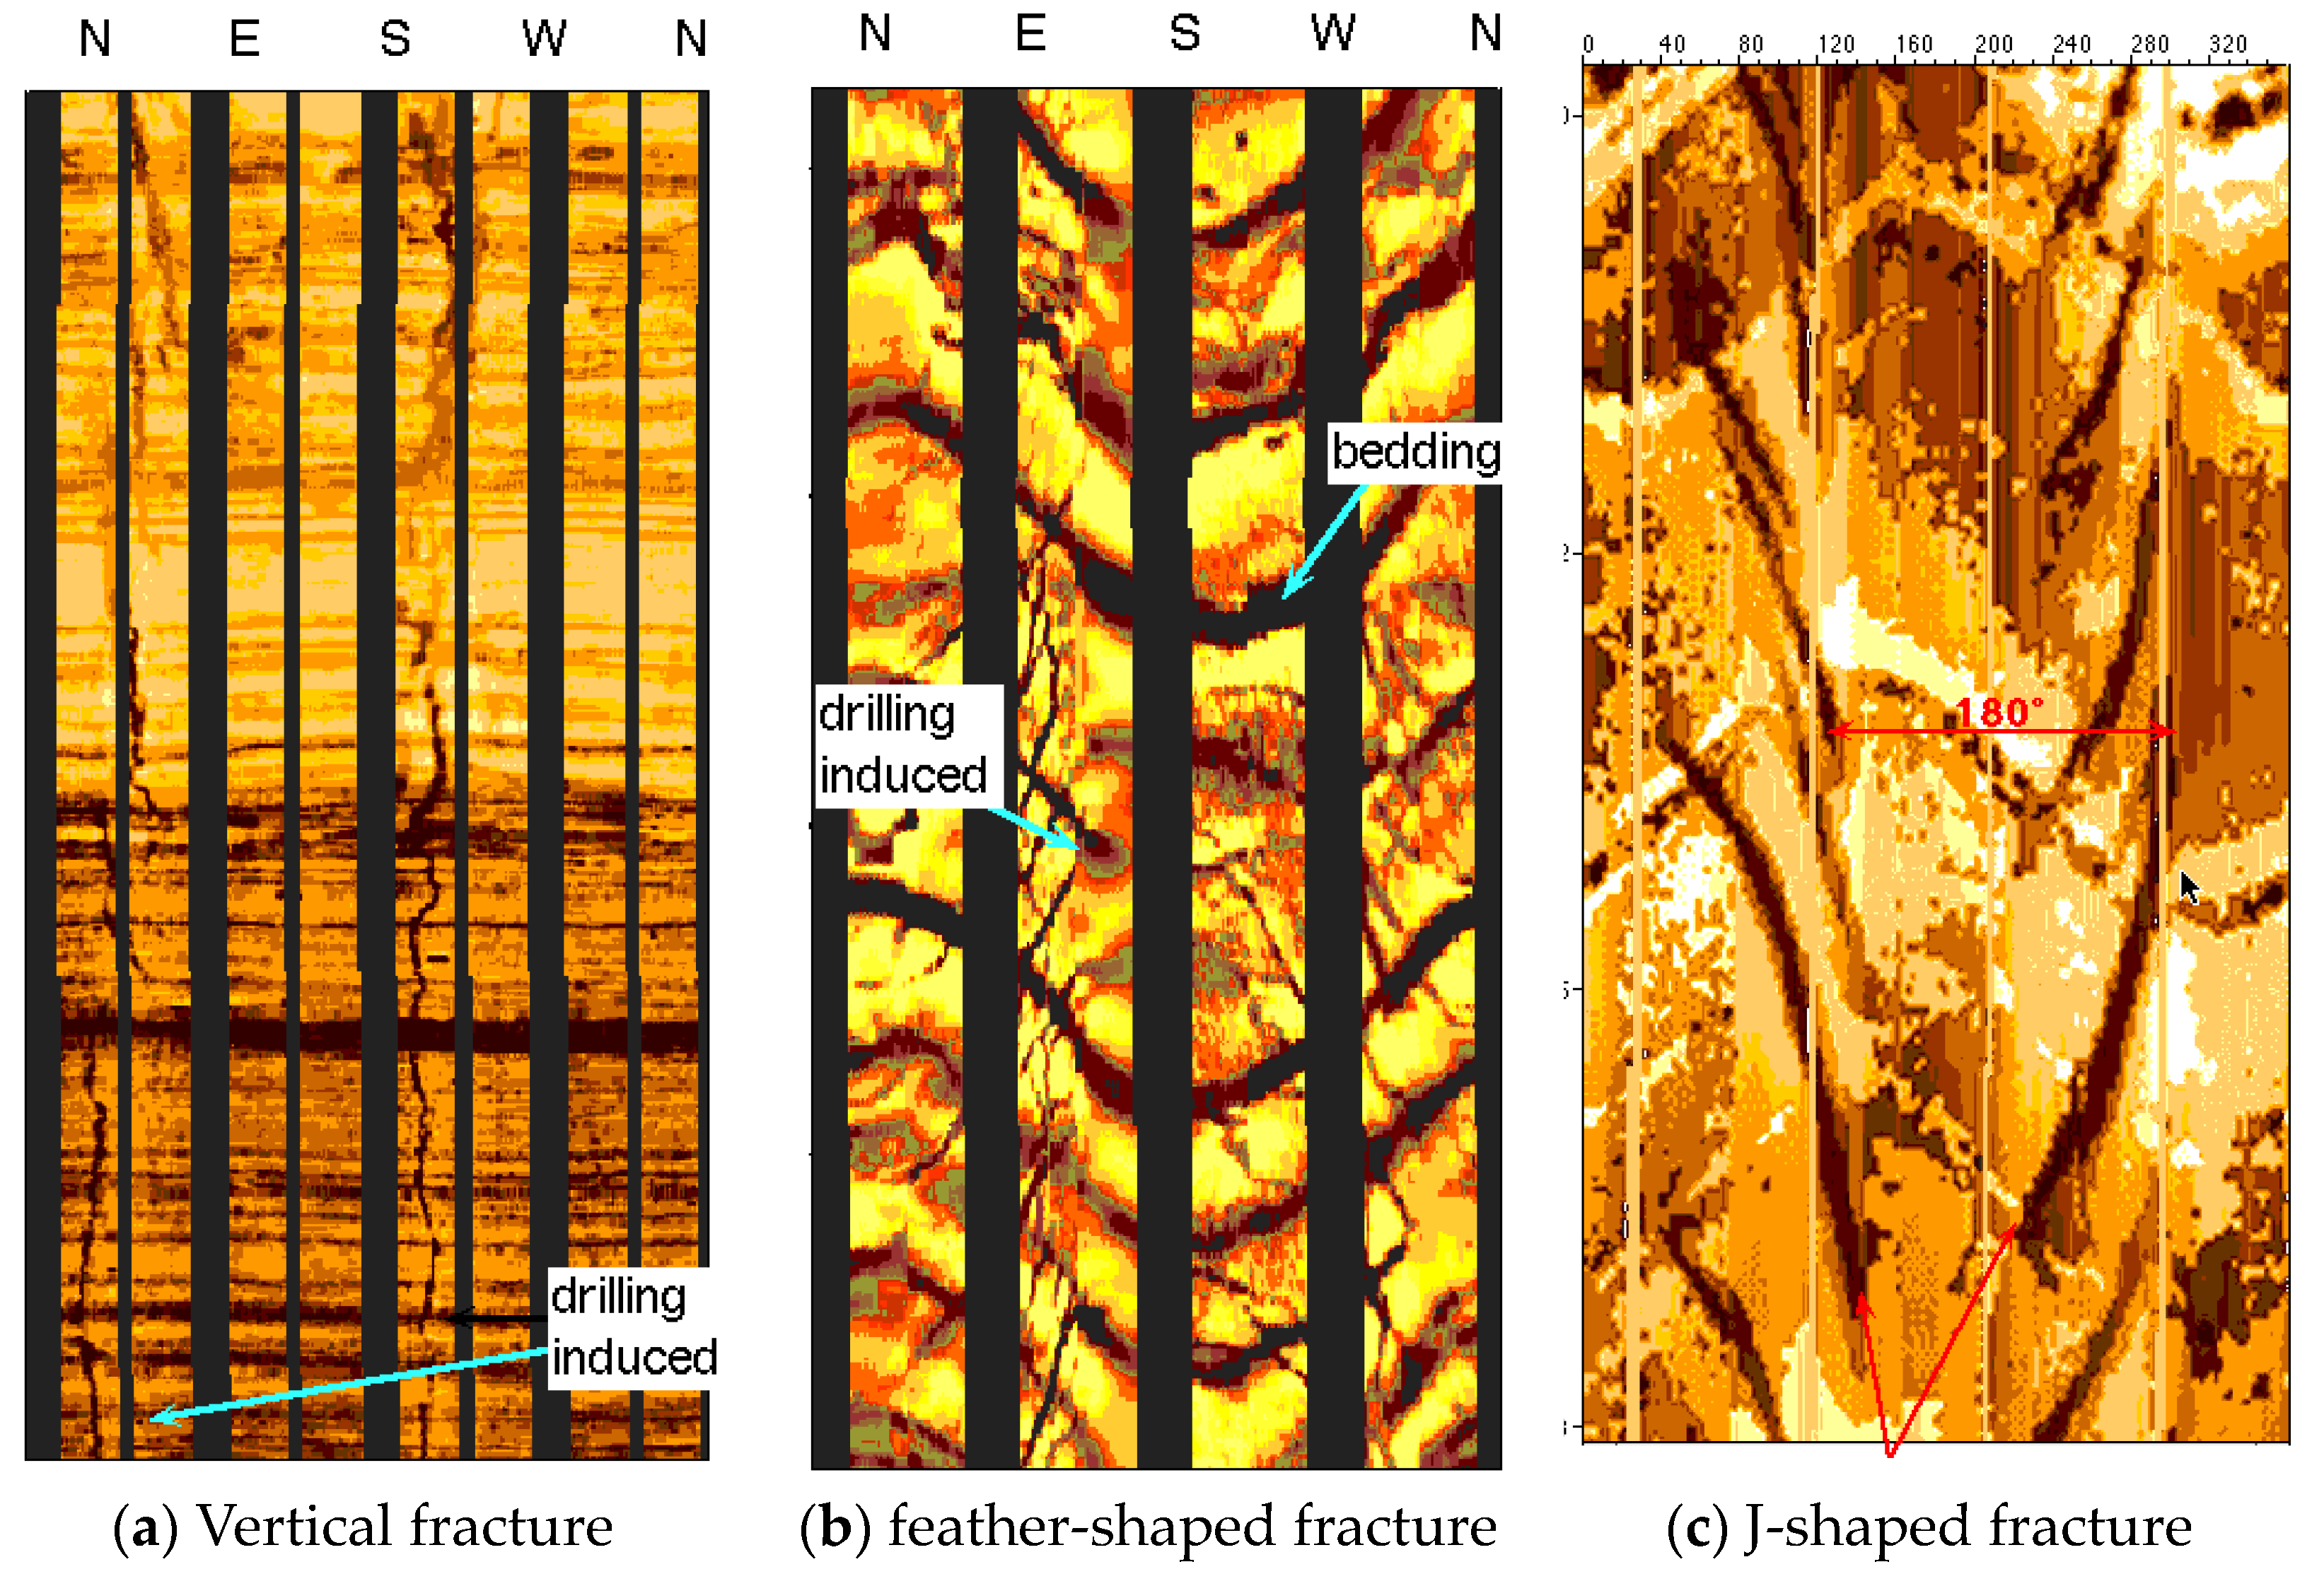
Based on the predictive model established in this study for the orientation of drilling-induced fractures, inputting the construction parameters and geological mechanical parameters of Well X in the No. 5 fault zone of the Shunbei Oil and gas field, predictions were made for the occurrence of vertical fractures, feather fractures, and “J-shaped” fractures parallel to the wellbore axis in different sections of the well. By segmentally identifying the fracture characteristics on the imaging logging chart of the well, we were able to clearly distinguish between vertical fractures, feather-shaped fractures, and “J-shaped” drilling-induced fractures, as shown in Figure 31. The model’s predicted results were in good agreement with the results shown in the well’s imaging logging chart, confirming the feasibility of the approach proposed in this study. The accurate detection and identification of induced fractures can provide assistance in the rational interpretation of reservoir fractures and reservoir evaluation in the Northwest Oilfield.

Figure 31.
Type of induced fracture in X well imaging logging map of the Northwest Oilfield.
5. Conclusions
This study yields several key conclusions. Firstly, drilling-induced fractures, swiftly formed due to stress and engineering disturbance, closely correlate with stress distribution. These fractures present distinct regularity and symmetry, typically appearing in pairs with an approximately symmetrical spacing of 180°. Their consistent characteristics offer a theoretical framework for identifying and categorizing them, effectively distinguishing them from natural fractures. Generally, these fractures exhibit uniform surfaces with minimal width variations and limited radial extensions. Secondly, when the wellbore axis aligns with any principal stress direction, shear stress is absent around the wellbore, resulting in drilling-induced fractures oriented parallel to the wellbore axis at a 0° angle. Consequently, symmetrically distributed fractures parallel to the wellbore axis typically form. For example, the induced fractures around the vertical wellbore or horizontal wells drilled in the direction of in situ horizontal stresses always appear in the direction of the maximum principal stress and always exhibit a vertical orientation. Thirdly, in the strike-slip fault, with different well trajectories, drilling-induced fractures may display varied orientations under different stress regimes, including feather-shaped, “J-shaped”, transitional states between feather and “J-shaped”, “V-shaped”, and “M-shaped” configurations. The research results are helpful in distinguishing the natural fractures in the imaging logging and the drilling-induced fractures and then accurately evaluating the degree of development of natural fractures in the reservoir.
Author Contributions
Conceptualization, P.Y. and H.S.; methodology, H.S. and P.Y.; formal Analysis, H.C. and P.Y.; resources, H.S. and F.Y.; data curation, H.C. and F.Y.; writing—original draft preparation, H.S. and P.Y.; writing—review and editing, H.S., F.Y. and P.Y.; visualization, L.C. and P.Y.; supervision, P.Y. and H.S.; project administration, H.S. All authors have read and agreed to the published version of the manuscript.
Funding
This research received no external funding.
Institutional Review Board Statement
All research activities were conducted in accordance with the ethical guidelines and principles outlined by the Committee on Publication Ethics.
Informed Consent Statement
All individuals involved in this study have provided their consent for the publication of the study findings.
Data Availability Statement
The data and materials used in this study are available upon request.
Conflicts of Interest
Authors Hongwei Song, Hong Cheng and Feiyu Yuan were employed by the company Sinopec Northwest Oilfield Branch. Authors Lin Cheng was employed by the company Sino Science and Technology Co., Ltd. The remaining authors declare that the research was conducted in the absence of any commercial or financial relationships that could be construed as a potential conflict of interest. The Sinopec Northwest Oilfield Branch and Sino Science and Technology Co., Ltd. had no role in the design of the study; in the collection, analyses, or interpretation of data; in the writing of the manuscript, or in the decision to publish the results.
References
- Rahimi, R.; Alsaba, M.; Nygaard, R. Analysis of analytical fracture models for wellbore strengthening applications: An experimental approach. J. Nat. Gas Sci. Eng. 2016, 36, 865–874. [Google Scholar] [CrossRef]
- Morita, N.; Fuh, G.F. Parametric Analysis of Wellbore-Strengthening Methods from Basic Rock Mechanics. SPE Drill. Complet. 2012, 27, 315–327. [Google Scholar] [CrossRef]
- Wang, H.; Sweatman, R.; Engelman, B.; Deeg, W.; Whitfill, D.; Soliman, M.; Towler, B.F. Best Practice in Understanding and Managing Lost Circulation Challenges. SPE Drill. Complet. 2008, 23, 168–175. [Google Scholar] [CrossRef]
- Hillerborg, A.; Modeer, M.; Petersson, P.E. Analysis of Crack Formation and Crack Growth in Concrete by Means of Fracture Mechanics and Finite Elements; Division of Building Materials Lund Institute of Technology: Pergamon, Sweden, 1976; Volume 6, pp. 773–782. [Google Scholar]
- Alberty, M.W.; McLean, M.R. A Physical Model for Stress Cages. In Proceedings of the SPE Annual Technical Conference and Exhibition, Houston, TX, USA, 26–29 September 2004. SPE-90493. [Google Scholar]
- Carbonell, R.J.K.; Detournay, E.J.K. Modeling Fracture Initiation and Propagation from a Pressurized Hole: A Dislocation-Based Approach. In Proceedings of the 35th U.S. Symposium on Rock Mechanics (USRMS), Reno, NV, USA, 5–7 June 1995. [Google Scholar]
- Zhang, J.; Yin, S.X. Fracture gradient prediction: An overview and an improved method. Pet. Sci. 2017, 14, 720–730. [Google Scholar] [CrossRef]
- Aadnøy, B.S.; Belayneh, M. Elasto-plastic fracturing model for wellbore stability using non-penetrating fluids. J. Pet. Sci. Eng. 2004, 45, 179–192. [Google Scholar] [CrossRef]
- McLean, M.R.; Addis, M.A. Wellbore stability analysis: A review of current methods of analysis and their field application. In Proceedings of the IADC/SPE drilling conference, OnePetro, Houston, TX, USA, 27 February–2 March 1990. [Google Scholar]
- Kadyrov, T.; Tutuncu, A.N. Integrated wellbore stability analysis for well trajectory optimization and field development in the West Kazakhstan Field. In Proceedings of the 46th US Rock Mechanics/Geomechanics Symposium, OnePetro, Chicago, IL, USA, 24–27 June 2012. [Google Scholar]
- Mirahmadizoghi, A. Analysis of Rock Performance under Three-Dimensional Stress to Predict Instability in Deep Boreholes. Ph.D. Thesis, University of Adelaide, Adelaide, Australia, 2012. [Google Scholar]
- Dokhani, V. The Effects of Chemical Adsorption on Wellbore Stability in Transversely Isotropic Shale Formations; University of Tulsa: Tulsa, OK, USA, 2014. [Google Scholar]
- Maleki, S.; Gholami, R.; Rasouli, V.; Moradzadeh, A.; Riabi, R.G.; Sadaghzadeh, F. Comparison of different failure criteria in prediction of safe mud weigh window in drilling practice. Earth-Sci. Rev. 2014, 136, 36–58. [Google Scholar] [CrossRef]
- Ibrahim, A. A review of mathematical modelling approaches to tackling wellbore instability in shale formations. J. Nat. Gas Sci. Eng. 2021, 89, 103870. [Google Scholar] [CrossRef]
- Lee, H.; Ong, S.H.; Azeemuddin, M.; Goodman, H. A wellbore stability model for formations with anisotropic rock strengths. J. Pet. Sci. Eng. 2012, 96, 109–119. [Google Scholar] [CrossRef]
- Wang, Y.; Li, Q.; Dong, W.; Li, Q.; Wang, F.; Bai, H.; Zhanga, R.; Owusu, A.B. Effect of different factors on the yield of epoxy-terminated polydimethylsiloxane and evaluation of CO2 thickening. RSC Adv. 2018, 8, 39787–39796. [Google Scholar] [CrossRef]
- Li, Q.; Liu, J.; Wang, S.; Guo, Y.; Han, X.; Li, Q.; Zhang, X. Numerical insights into factors affecting collapse behavior of horizontal wellbore in clayey silt hydrate-bearing sediments and the accompanying control strategy. Ocean Eng. 2024, 297, 117029. [Google Scholar] [CrossRef]
- Meng, M.; Chen, P.; Ren, R. Statistic evaluation of failure criteria in wellbore stability with temperature effects. Fuel 2019, 252, 730–752. [Google Scholar] [CrossRef]
- Gao, J.; Odunlami, T.; Osayande, N. Shale bedding impact on wellbore stability and drilling optimization. In Proceedings of the SPE/CSUR Unconventional Resources Conference–Canada, Society of Petroleum Engineers, Calgary, AB, Canada, 30 September–2 October 2014. [Google Scholar]
- He, S.; Wei, W.; Zhou, J.; Zhen, H.; Ming, T. A model for analysis of wellbore stability considering the effects of weak bedding planes. J. Nat. Gas Sci. Eng. 2015, 27, 1050–1062. [Google Scholar] [CrossRef]
- Vahid, S.; Ahmad, G. Hydraulic fracture initiation from a wellbore in transversely isotropic rock. In Proceedings of the 45th US Rock Mechanics/Geomechanics Symposium, American Rock Mechanics Association, San Francisco, CA, USA, 26–29 June 2011. [Google Scholar]
- Setiawan, N.B.; Zimmerman, R.W. Wellbore breakout prediction in transversely isotropic rocks using true-triaxial failure criteria. Int. J. Rock Mech. Min. Sci. 2018, 112, 313–322. [Google Scholar] [CrossRef]
- Chen, P.; Ma, T.; Xia, H. A collapse pressure prediction model for horizontal shale gas wells with multiple weak planes. Nat. Gas Ind. B 2015, 2, 101–107. [Google Scholar] [CrossRef]
- Liu, M.; Jin, Y.; Lu, Y.; Chen, M.; Hou, B.; Chen, W.; Wen, X.; Yu, X. A wellbore stability model for a deviated well in a transversely isotropic formation considering poroelastic effects. Rock Mech. Rock Eng. 2016, 49, 3671–3686. [Google Scholar] [CrossRef]
- Zhou, J.; He, S.; Tang, M.; Huang, Z.; Chen, Y.; Chi, J.; Yuan, P. Analysis of wellbore stability considering the effects of bedding planes and anisotropic seepage during drilling horizontal wells in the laminated formation. J. Pet. Sci. Eng. 2018, 170, 507–524. [Google Scholar] [CrossRef]
- Ottesen, S. Wellbore stability in fractured rock. In Proceedings of the IADC/SPE Drilling Conference and Exhibition, Society of Petroleum Engineers, New Orleans, LA, USA, 2–4 February 2010. [Google Scholar]
- Liu, X.; Yan, R.; Zhou, X.; Wang, R. Application of Bayesian network method in optimal selection of completion methods for gas wells. In Proceedings of the 2018 National Gas Academic Conference (04 Engineering Technology), Fuzhou, China, 15–16 November 2018. [Google Scholar]
- Li, W. Wellbore Stability Analysis and Risk Assessment Based on Uncertainty of Lithological Parameters. Ph.D. Thesis, University of Petroleum (East China), Qingdao, China, 2020. [Google Scholar]
- Al-Ajmi, A.M.; Al-Harthy, M.H. Probabilistic wellbore collapse analysis. J. Pet. Sci. Eng. 2010, 74, 171–177. [Google Scholar] [CrossRef]
- Ebrahimi, M.A.; Ahmadi, M.; Ameri, M.J. Application of unconditional simulation methods for quantifying the uncertainties in mud window design of gas reservoirs based on 3-dimensional mechanical earth modeling. J. Nat. Gas Sci. Eng. 2020, 76, 103186. [Google Scholar] [CrossRef]
- Xia, P. Impact Fracture Law and Safety Analysis of Open-Hole Wellbore in Shale Gas Wells. Master’s Thesis, China University of Petroleum (East China), Qingdao, China, 2018. [Google Scholar]
- Wen, Q. Research on Risk Assessment of Deep Well Drilling System in Complex Formation Based on Soft Computing Theory. Ph.D. Thesis, China University of Petroleum (East China), Qingdao, China, 2012. [Google Scholar]
- Udegbunam, J.E.; Fjelde, K.K.; Arild, Ø.; Ford, E.; Lohne, H.P. Uncertainty-Based Approach for Predicting the Operating Window in UBO Well Design. SPE Drill. Complet. 2013, 28, 326–337. [Google Scholar] [CrossRef]
- Hilgedick, S.A. Investigation of Wellbore Stability in a North Sea Field Development. Ph.D. Thesis, Missouri University of Science and Technology, Rolla, MO, USA, 2012. [Google Scholar]
- Adams, A.J.; Parfitt, S.H.L.; Reeves, T.B.; Thorogood, J.L. Casing System Risk Analysis Using Structural Reliability. In Proceedings of the SPE/IADC Drilling Conference, Amsterdam, The Netherlands, 22–25 February 1993. [Google Scholar]
- Nilsen, T.; Sandoy, M.; Rommetveit, R.; Guarneri, A. Risk-Based Well Control Planning: The Integration of Random and Known Quantities in a Computerized Risk Management Tool. In Proceedings of the SPE/ICoTA Coiled Tubing Roundtable, Society of Petroleum Engineers, Houston, TX, USA, 7–8 March 2001. [Google Scholar]
- Payne, M.L.; Swanson, J.D. Application of Probabilistic Reliability Methods to Tubular Designs. SPE Drill. Eng. 1990, 5, 299–305. [Google Scholar] [CrossRef]
- Tabatabaee, M.S.S.; Nikolaev, N.; Khormali, A. A comprehensive uncertainty assessment of wellbore stability models. Innov. Geosci. Time Breakthr. 2018, 2018, 44298. [Google Scholar]
- Sheng, Y.; Reddish, D.; Lu, Z. Assessment of Uncertainties in Wellbore Stability Analysis. Modern Trends in Geomechanics; Springer: Berlin, Germany, 2006; pp. 541–557. [Google Scholar]
- Moos, D.; Peska, P.; Finkbeiner, T.; Zoback, M. Comprehensive wellbore stability analysis utilizing quantitative risk assessment. J. Pet. Sci. Eng. 2003, 38, 97–109. [Google Scholar] [CrossRef]
- Fontoura, S.A.B.; Holzberg, B.B.; Teixeira, É.C.; Frydman, M. Probabilistic analysis of wellbore stability during drilling. In Proceedings of the SPE/ISRM Rock Mechanics Conference, OnePetro, Irving, TX, USA, 20–23 October 2002. [Google Scholar]
- Guan, Z.C.; Sheng, Y.N. Study on evaluation method for wellbore stability based on uncertainty analysis. J. Appl. Sci. Eng. 2017, 20, 453–457. [Google Scholar]
- Sheng, Y.; Guan, Z.; Luo, M. Sensitivity analysis of random variables for wellbore stability reliability based on Monte Carlo method. Pet. Drill. Tech. 2018, 40, 14–19. [Google Scholar]
- Qiu, K.; Chen, M.; Jin, Y. Collapse pressure model of wellbore based on statistical damage. Rock Soil Mech. 2011, 32, 2029–2033. [Google Scholar]
- Bai, G. Optimization method of drilling fluid density for Wei 202,204 shale gas wells. Drill. Fluids Complet. Fluids 2020, 37, 196–201. [Google Scholar]
- Lu, Y.; Xiao, X.; Zhao, L.; Jin, Y.; Chen, M. Influence of temperature on wellbore stability of ultra-deep fractured formations. Drill. Fluids Complet. Fluids 2020, 37, 160–167. [Google Scholar]
- Huang, Y.; Sheng, Y.; Guan, Z. Quantitative risk assessment of wellbore stability in Yingqiong Basin. Fault-Block Oil Gas Field 2019, 26, 380–384. [Google Scholar]
- Noohnejad, A.; Ahangari, K.; Goshtasbi, K. Integrated mechanical earth model and quantitative risk assessment to successful drilling. J. Pet. Explor. Prod. 2021, 11, 219–231. [Google Scholar] [CrossRef]
- Peška, P.; Zoback, M.D. Compressive and tensile failure of inclined well bores and determination of in situ stress and rock strength. J. Geophys. Res. Solid Earth 1995, 100, 12791–12811. [Google Scholar] [CrossRef]
- Brudy, M.; Zoback, M.D. Compressive and tensile failure of boreholes arbitrarily-inclined to principal stress axes: Application to the KTB boreholes, Germany. Int. J. Rock Mech. Min. Sci. Geomech. Abstr. 1993, 30, 1035–1038. [Google Scholar] [CrossRef]
- Zoback, M.D. Reservoir Geomechanics; Cambridge University Press: Cambridge, UK, 2010. [Google Scholar]
- Zhang, B.; Pan, Z.; Cao, L.; Xie, J.; Chu, S.; Jing, Y.; Lu, N.; Sun, T.; Li, C.; Xu, Y. Measurement of wellbore leakage in high-pressure gas well based on the multiple physical signals and history data: Method, technology, and application. Energy Sci. Eng. 2024, 12, 4–21. [Google Scholar] [CrossRef]
- Wang, F.; Xu, H.; Liu, Y.; Meng, X.; Liu, L. Mechanism of Low Chemical Agent Adsorption by High Pressure for Hydraulic Fracturing-Assisted Oil Displacement Technology: A Study of Molecular Dynamics Combined with Laboratory Experiments. Langmuir 2023, 39, 16628–16636. [Google Scholar] [CrossRef] [PubMed]
- Jiang, W.; Li, X.; Wen, M.; Liu, X.; Wang, K.; Wang, Q.; Li, Y.; Zhou, M.; Liu, M.; Hu, B. Increased percentage of PD-L1+ natural killer cells predicts poor prognosis in sepsis patients: A prospective observational cohort study. Crit. Care 2020, 24, 617. [Google Scholar] [CrossRef]
- Zhang, J.; Lin, C.; Tang, H.; Wen, T.; Tannant, D.D.; Zhang, B. Input-parameter optimization using a SVR based ensemble model to predict landslide displacements in a reservoir area–A comparative study. Appl. Soft Comput. 2024, 150, 111107. [Google Scholar] [CrossRef]
- Lin, J.; Dong, C.; Lin, C.; Duan, D.; Ma, P.; Zhao, Z.; Liu, B.; Zhang, X.; Huang, X. The impact of tectonic inversion on diagenesis and reservoir quality of the Oligocene fluvial sandstones: The Upper Huagang Formation, Xihu Depression, East China Sea Shelf Basin. Mar. Pet. Geol. 2024, 165, 106860. [Google Scholar] [CrossRef]
- Zhang, J.; Tang, H.; Li, C.; Gong, W.; Zhou, B.; Zhang, Y. Deformation stage division and early warning of landslides based on the statistical characteristics of landslide kinematic features. Landslides 2024, 21, 717–735. [Google Scholar] [CrossRef]
- Ding, L.; Lv, J.; Wang, Z.; Liu, B. Borehole stability analysis: Considering the upper limit of shear failure criteria to determine the safe borehole pressure window. J. Pet. Sci. Eng. 2022, 212, 110219. [Google Scholar] [CrossRef]


Disclaimer/Publisher’s Note: The statements, opinions and data contained in all publications are solely those of the individual author(s) and contributor(s) and not of MDPI and/or the editor(s). MDPI and/or the editor(s) disclaim responsibility for any injury to people or property resulting from any ideas, methods, instructions or products referred to in the content. |
© 2024 by the authors. Licensee MDPI, Basel, Switzerland. This article is an open access article distributed under the terms and conditions of the Creative Commons Attribution (CC BY) license (https://creativecommons.org/licenses/by/4.0/).