Article

Simulation and Economic Analysis of Helium Extraction Process from Natural Gas

1
Institute of Project Evaluation, Research Institute of Petroleum Exploration and Development, Beijing 100083, China
2
State Key Laboratory of Heavy Oil Processing, China University of Petroleum (Beijing) at Karamay, Karamay 834000, China
*
Authors to whom correspondence should be addressed.
Processes 2024, 12(9), 1892; https://doi.org/10.3390/pr12091892
Submission received: 22 July 2024 / Revised: 24 August 2024 / Accepted: 26 August 2024 / Published: 3 September 2024
(This article belongs to the Section Energy Systems)

Abstract

:
The investment estimation of the helium extraction project from natural gas is a crucial step in economically obtaining helium from both domestic and international projects. This article employs Aspen HYSYS to simulate the process and estimate the investment levels of Linde and Exxon Mobil integrated helium extraction processes. We investigate the influence of feed composition and processing capacity on investment costs and product returns. The results indicate that higher helium content of feed correlates with increased equipment investment costs and total capital cost (CAPEX), and that the Linde integrated process is significantly more sensitive to changes in helium content of feed than the Exxon Mobil integrated process. As the helium content of feed rises, the product returns of the two processes are evidently improved, leading to reduced investment payback periods. Both techniques exhibit favorable payback periods when the feed helium content exceeds 0.5 vol%. Nevertheless, elevated nitrogen content in the feed notably escalates the equipment investment costs and total capital costs. Furthermore, an increase in the processing capacity of feed gas leads to a nonlinear increase in total capital costs and annual operating costs. However, the cost per unit of helium extraction diminishes with increasing capacity. In general, the Linde integrated process requires higher separation energy consumption in comparison with the Exxon Mobil integrated process at similar processing capacities. Moreover, the sensitivity analysis shows that helium breakeven price is strongly affected by the price of both LNG and feed gas.

1. Introduction

Helium, being a noble gas, exhibits an extremely low boiling point of −268.6 °C at 1 atm, which renders it the most difficult gas to liquefy among all known gases [1]. Liquid helium possesses unique properties such as strong thermal conductivity and low viscosity, which give it a wide range of applications in such fields as electronic manufacturing, aerospace, and low-temperature superconductivity [2,3]. Global helium resources are mainly concentrated in the United States, Qatar, Algeria, Russia and other countries [4,5]. Japan, South Korea, India and China are the most important established helium importers [6]. For these countries, it is essential to enhance the assessment of helium resources, which can effectively address the helium energy crisis [7].
In nature, helium can be found in air, helium-bearing natural gas and geothermal hydrous dissolved gas. Among them, helium-bearing natural gas is the primary source of helium extraction [8]. The methods for helium extraction from natural gas include cryogenic distillation [9,10], membrane separation [11,12,13,14], pressure swing adsorption [15,16], and others. The cryogenic distillation method is the most widely used and versatile technology for helium separation, typically separating helium at temperatures below −65 °C to produce high recovery and high purity helium. It is estimated that over 90% of helium is extracted using the cryogenic distillation method [17,18]. In addition, the cryogenic distillation method can be further divided into three processes: flash, distillation, and integrated flash and distillation processes [19]. The process of flash is simple, but it has low helium recovery and product purity. Distillation, on the other hand, has higher helium recovery compared to flash process, but with lower heat exchange efficiency [20]. Currently, a lot of helium extraction processes are integrating flash and distillation, aiming to improve the production efficiency and economic benefits of helium [21]. Normally, cryogenic distillation is economically beneficial when the helium content in the feed natural gas exceeds 0.1 vol%. However, in the case of extracting helium from the end-flash gas of the liquefied natural gas (LNG) production unit, the increased helium content in the end-flash gas reduces the requirement for helium content in the feed gas. Furthermore, due to the synchronous production of LNG, the economic benefits of the helium extraction process are significantly enhanced. Therefore, extracting helium from LNG end-flash has become one of the major approaches.
Both Linde and Exxon Mobil companies employ helium extraction processes based on integrated flash and distillation, using the end-flash gas from the liquefied natural gas production unit for helium extraction. The end-flash gas undergoes further flash and distillation to produce helium and other byproducts, with the crude helium then undergoing purification, liquefaction, and storage.
Compared to the single helium extraction process from natural gas, utilizing the end-flash gas for helium extraction can co-produce a large quantity of liquefied natural gas, overcoming the bottleneck of a single helium extraction process, lowering the helium content requirement in the feed gas, and significantly enhancing the economic benefits of helium extraction projects [22]. Therefore, the integrated helium extraction process is analyzed for the estimation of the engineering investment. We use Aspen HYSYS simulations to investigate the influence of helium and nitrogen content in feed gas and processing capacity on engineering investment and product revenue. Additionally, we evaluate the risks by a sensitivity analysis of Linde and Exxon Mobil integrated processes.

2. Research Methods

2.1. Process Development

2.1.1. Process Model Method

This study involves process simulation of the helium extraction technology used by Linde and Exxon Mobil, which are both the integration process of flash and distillation, producing not only helium but also products such as LNG and fuel gas, exhibiting higher efficiency and cost-effectiveness compared to a single helium extraction process. The integrated process used by Exxon Mobil produces crude helium, LNG, and fuel gas. In addition to the three products produced by the Exxon Mobil process, the Linde integrated process also produces liquid nitrogen. The helium recycling rate of both helium extraction units exceeds 90%.
The simulation of the helium extraction process was implemented by Aspen HYSYS V12, and the Pent–Robinson properties package was used. From a thermodynamic perspective, different systems require suitable equations of state to evaluate. It was demonstrated that the Peng–Robinson equation exhibited high accuracy in predicting the vapor–liquid equilibrium of non-polar substances [23]. In the process simulation, the pressure drops for the heater, cooler, and LNG heat exchanger were all set to 10 kPa. Moreover, the tray efficiency was set at 100%, and the adiabatic efficiency of the compressor as well as the isentropic efficiency of the expander were both set to 75%. The distillation column was solved using the “Modified HYSIM inside-out” solution method, with a fixed damping factor set to 1.0 for iterations.

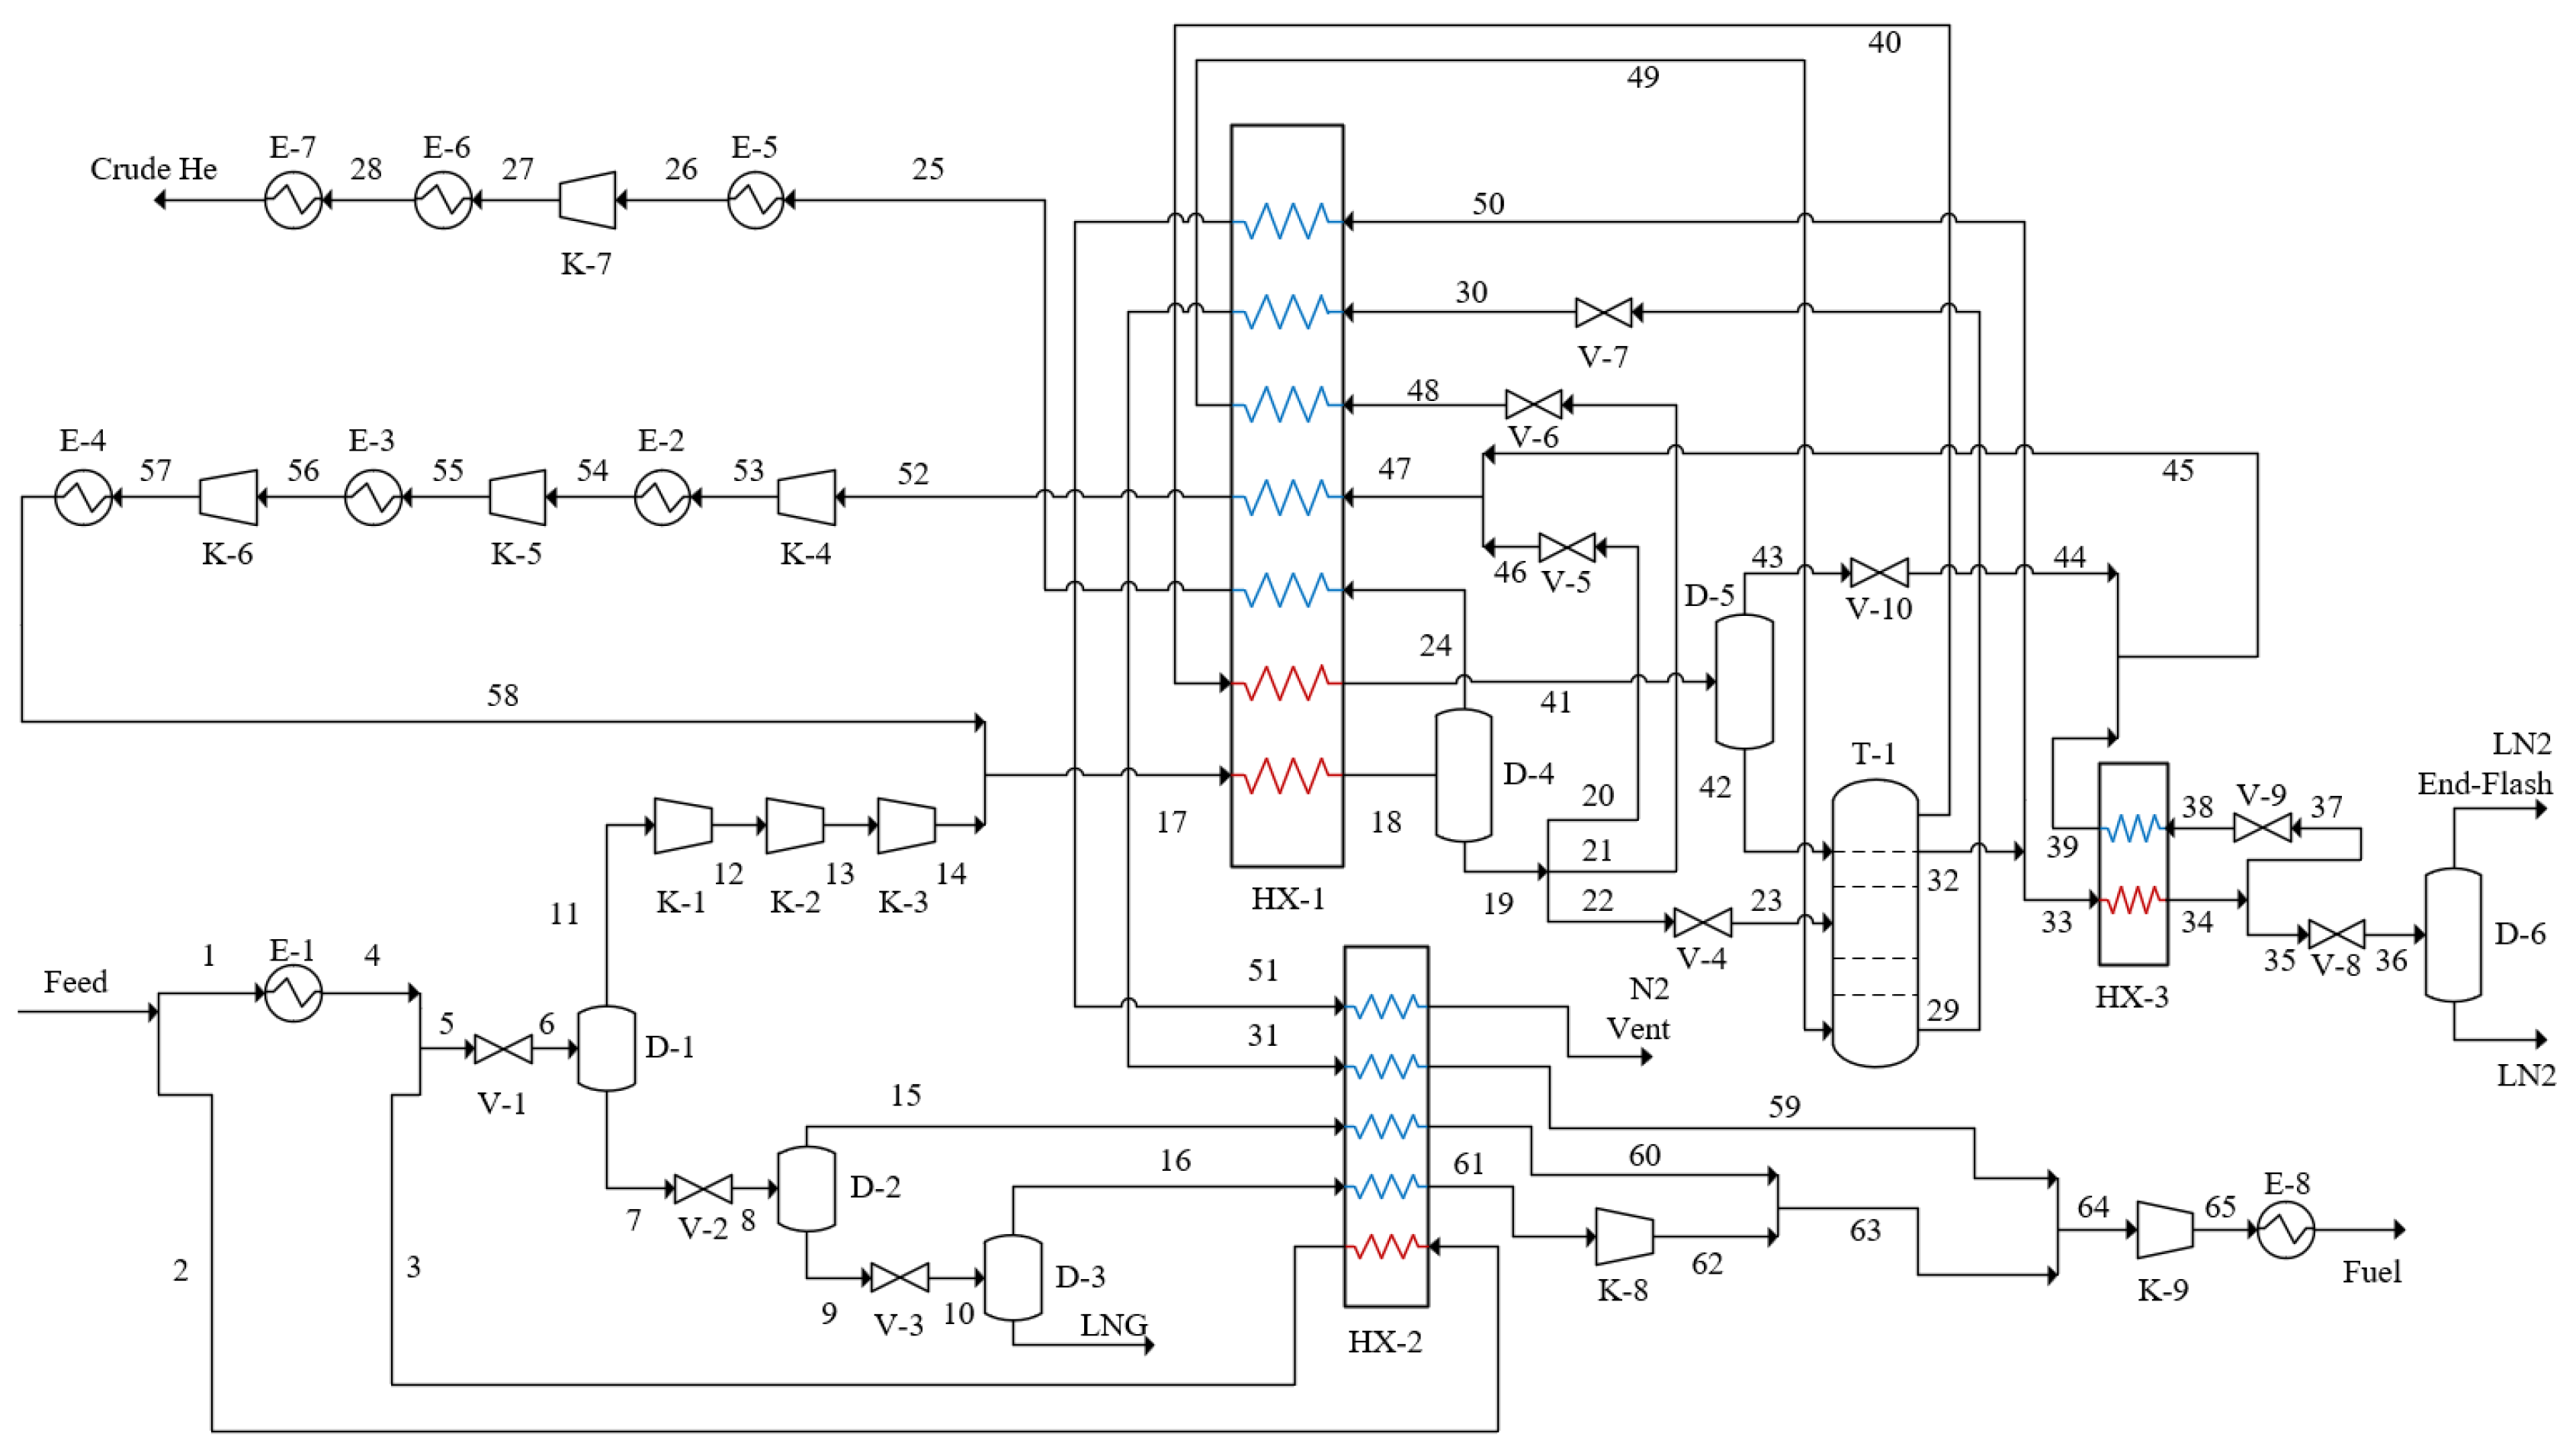
2.1.2. Linde Integrated Process

The Linde integrated process combines the methods of flash and distillation. The operating conditions, such as separating temperature, pressures, and flow rates, are set according to previous research by Arash et al. [24]. Table 1 presents the feed and product flow data. The process is illustrated in Figure 1. The specific process involves dividing the helium-bearing natural gas (Feed) into two streams (1 and 2): stream 2 undergoes cooling in a heat exchanger, while stream 1 is cooled in a refrigerator. Both streams are cooled to −145.2 °C and then mixed into stream 5. Stream 2 constitutes the main part of the helium-bearing natural gas, accounting for 96.6%. Stream 5 enters a three-stage flash separation process, with the liquid from each stage entering the next stage for flash separation. The flash pressures for each stage are 550 kPa, 340 kPa, and 130 kPa, respectively. Gases from the second and third separators (15 and 16) provide refrigeration for the refrigerator and are sent to produce fuel gas. The liquid from the third separator (16) is liquefied natural gas (LNG). The gas from the first separator (11) is a helium-rich stream, where it is compressed to 1500 kPa through a three-stage compressor with a compression ratio of 1.4 for each stage. Additionally, stream 17 undergoes refrigeration to −169 °C before flash. After separation, the gas (24) is used for the production of crude helium, while the liquid (19) is expanded through a throttling valve to 700 kPa and enters the distillation column to produce liquid nitrogen.

2.1.3. Exxon Mobil Integrated Process

The Exxon Mobil integrated process also involves a combination of flash and distillation. In comparison with the Linde integrated process, the products of Exxon Mobil do not include liquid nitrogen, and crude helium is purified through the distillation column. All process parameters are set according to the research by Mehdi et al. [25]. Table 2 presents the feed and product flow data. The process is illustrated in Figure 2. The helium-bearing natural gas (Feed) is divided into two streams (1 and 3) through a splitter. Stream 3 accounting for 96.6%, undergoes cooling in a LNG heat exchanger (HX-1), while stream 1 is cooled in a refrigerator. Both streams are cooled to −146 °C, and then enter a three-stage flash separation process. The flash pressures for each stage are 390 kPa, 260 kPa, and 130 kPa, respectively. Gases from the second and third separators (16 and 18) are utilized for the production of fuel gas and provide refrigeration for the refrigerator. The helium-rich stream (11) is compressed to 4000 kPa in the three-stage compressor, with a compression ratio of 2.2 for each compression stage. Stream 14 is cooled to −130 °C in a LNG heat exchanger (HX-2) before entering the distillation column for helium enrichment. Stream 36 is flashed after heat exchange to produce crude helium, while Stream 25 undergoes heat exchange in HX-2 to supply feed to T-1 at the bottom of the column.

2.1.4. Research on Adaptability of Feed

In order to obtain project investment and product returns under different feed compositions and natural gas processing scales, an analysis was conducted to assess the applicability of the helium extraction process. We established feed data with two variables: feed composition and processing scale of natural gas. Table 3 and Table 4 show the feed composition data with varying helium and nitrogen content, based on a processing capacity of 235,000 kmol/h. The helium content ranges from 0.05% to 2%, and the nitrogen content ranges from 5% to 20%. Both Case 1 and Case a represent the base feed composition. Different processing scales of natural gas are based on the base feed composition, with processing capacities set at 200,000 kmol/h, 235,000 kmol/h, and 270,000 kmol/h, corresponding to Case a1, a2, and a3, respectively. Table 5 shows the concentration requirement for products.

2.2. Economic Evaluation

Aspen HYSYS has a built-in economic analysis module, Aspen Process Economic Analyzer (APEA). After setting the project’s cost options and stream price parameters, it facilitates the estimation of equipment investment, utility costs, and product returns. These data are used to compute the project’s total capital cost (CAPEX) and annual operating cost (OPEX), subsequently providing internal rate of return (IRR) and payback period (PBP) data. The economic evaluation is based on the equipment investment and utility engineering data calculated by APEA. The technical and economic analysis (TEA) method is based on a technical and economic analysis report related to the helium extraction project [26].
The equipment investments and utility engineering costs, such as compressor, heat exchanger, and distillation column costs, are estimated by APEA in the technical and economic analysis. Assuming that the project has a lifespan of 20 years, a construction period of 12 months, a construction capacity of 70%, and an operational duration of 8000 h per year. The economic analysis by APEA was set for 2020.
The stream price data [27,28,29] are set as NG Feed: 3.5 USD/MMBTU, LNG: 9 USD/MMBTU, Fuel Gas: 137.2 USD/tonne, Crude Helium: 119 USD/MSCF (thousand standard cubic foot), LN2: 5.7 USD/kg.

3. Results and Discussion

3.1. Effect of Feed Composition

3.1.1. Analysis of Linde Integrated Process

When the helium content and nitrogen content in the feed gas are 0.05% and 5%, respectively (for Case 1 and Case a), the equipment investment cost for the Linde integrated process is USD 104.65 m, with a total capital cost of USD 238.80 m. Higher helium or nitrogen content in the feed gas results in increasing equipment investment costs and total capital costs. When the helium content of the feed is 2% (Case 7), the equipment investment cost and the total capital cost are USD 132.47 m and USD 296.41 m, respectively. As the nitrogen content in the feed gas is raised to 20% (Case d), the equipment investment cost and the total capital cost are USD 271.22 m and USD 543.85 m, respectively. Therefore, it can be seen that the higher nitrogen content in the feed gas will lead to significantly higher costs. This is because the cooling temperature of the feed stream needs to be raised in order to satisfy the separation requirements as the nitrogen content increases. When the nitrogen content increases from 5% to 20%, the cooling temperature rises from −145.2 °C to −110 °C, which results in a decreased LNG production and an increased amount of vapor from the first stage flash unit. The compressors and expanders in the process are set for the production of byproducts other than LNG. Consequently, the higher nitrogen content of feed results in a significant increase in the electricity power of the compressors and expanders, leading to a significant increase in equipment investment costs and total capital costs.
Table 6 shows the profitability analysis under different feed compositions, assuming that feed prices with different helium contents are the same. The profit data show that as the helium content in the feed increases, the product revenue also increases. When the helium content in the feed gas is 0.5% or higher, the payback period will meet the common PBP threshold (3 years) [30]. Therefore, under this processing scale, there will be considerable profits when the feed helium content is higher than 0.5%. As the nitrogen content in the feed increases, the product revenue decreases accordingly, since the increase in nitrogen content leads to a reduction in LNG production, which constitutes the majority of the revenue.

3.1.2. Analysis of Exxon Mobil Integrated Process

As for Case 1 (or Case a), the equipment investment cost for the Exxon Mobil integrated process is USD 94.99 m, and the CAPEX is USD 217.37 m. The helium content in the feed has no significant impact on the equipment investment cost and CAPEX for the Exxon Mobil process. When the helium content of the feed reaches 2%, the equipment investment cost and CAPEX are USD 102.16 m and USD 231.71 m, respectively. However, the higher nitrogen content of feed results in the increasing equipment investment cost and the total capital cost. When the nitrogen content is increased to 20%, the equipment investment cost and the total capital cost are USD 126.63 m and USD 281.09 m, respectively, and the cooling temperature rises from −146 °C to −110 °C as the nitrogen content increases from 5% to 20%. Table 7 shows the profitability analysis under different feed compositions for Exxon Mobil’s integrated process. When the helium content of the feed is 0.2% or higher, the payback period is less than 3 years.

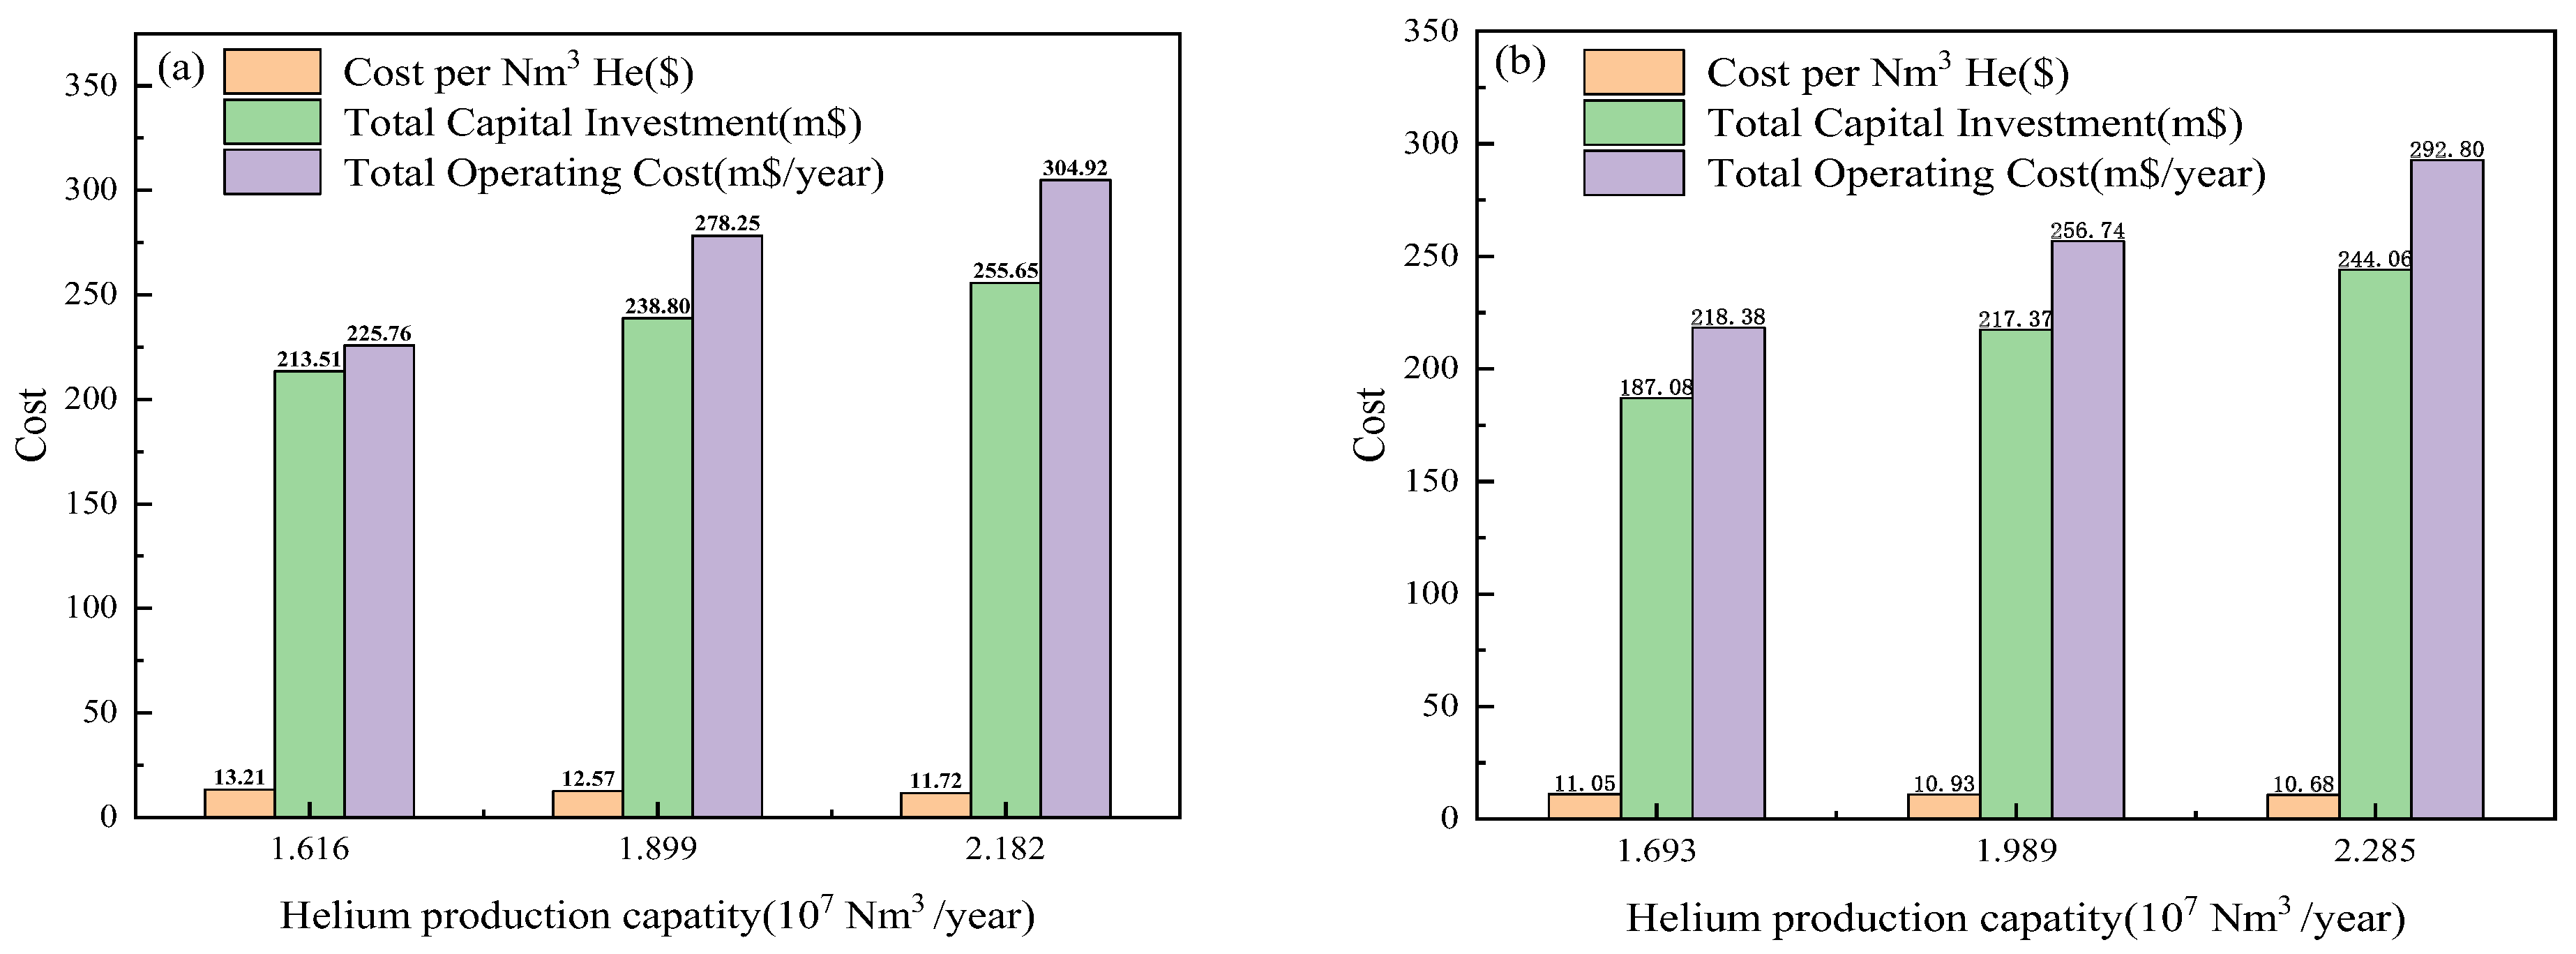
3.2. Effect of Processing Capacity

Figure 3 shows the trend of the CAPEX, OPEX and cost of helium extraction per Nm3 of both the Linde and Exxon Mobil integrated process with the annual production of helium. The annual production of helium corresponds to the data under the feed processing capacity ranging from Case a1 to Case a3. As the processing scale enlarges, CAPEX and OPEX increase, while the cost of producing per Nm3 helium decreases. Additionally, as the processing scale increases, the magnitude of the increase in CAPEX and OPEX decreases, and the magnitude of the decrease in the project’s total investment per Nm3 helium increases. As most industrial equipment is cylindrical in shape, the material of the equipment undergoes non-linear changes with variations in processing volume. Thus when the processing volume increases, the rate of increase in equipment material decreases. Table 8 and Table 9, respectively, summarize the economic evaluation data of Linde and Exxon Mobil integrated processes at different feed scales, respectively. The product returns of both processes at different feed scales are above USD 1000 m, and the investment payback period is around 3 years.

3.3. Comparative Analysis of Linde and Exxon Mobil Integrated Processes

There are differences in the Linde and Exxon Mobil integrated processes for helium production. In Exxon Mobil’s process, the flash vapor is distilled before being cooled, throttled, and then flashed to produce crude helium. In contrast, the Linde process does not involve a distillation step. Instead, the flash vapor is directly cooled and depressurized before being flashed to separate the helium. The products of the two processes are similar, with the Linde process additionally producing liquid nitrogen. The liquid nitrogen is produced by cooling and throttling the nitrogen gas extracted from the top of the tower, followed by flashing. The purity requirement for the liquid nitrogen product is greater than 99%.
Table 10 summarizes the economic data of the Linde and Exxon Mobil integrated processes with the feed gas of 0.05% helium content and 5% nitrogen content. The equipment investment cost, CAPEX, utility investment, and OPEX of Linde integrated process are all higher than that of Exxon Mobil, while the product revenue data for both processes are basically on par. Figure 4 and Figure 5 illustrate the variation of equipment investment cost and CAPEX for the Linde and ExxonMobil processes in different cases. Increasing the helium content in the feed leads to an increase in the equipment investment cost and CAPEX for both the Linde and ExxonMobil processes, but the magnitude of change is smaller for the ExxonMobil process. On the other hand, increasing the nitrogen content in the feed also results in an increase in the equipment investment cost and CAPEX for both the Linde and ExxonMobil processes, with the Linde process showing a significantly higher magnitude. The reason is a portion of streams (39, 44, 45, 46, 47 in Figure 1) was recovered for helium extraction, which required more compressor equipment (K-4, K-5, K-6 in Figure 1). Moreover, under different feed conditions, the equipment investment cost and total capital cost of the Linde process are both higher than that of the Exxon Mobil process. Thus, at similar production capacities, the Linde integrated process requires higher energy consumption, primarily attributed to the larger total compressor load, greater electricity consumption, and higher utility costs, leading to higher equipment investment as calculated by APEA.
At different processing scales, the trends and magnitudes of change for CAPEX, OPEX, and the cost per Nm3 of crude helium product are similar for both processes. The CAPEX, OPEX, and cost per Nm3 of the crude helium product for the Linde process are higher than those for the ExxonMobil process, consistent with the results obtained from varying feed compositions.

3.4. Sensitivity Analysis

Sensitivity analysis involves analyzing and predicting the impact of changes in the main factors of a project on economic evaluation indicators. Through this process, we can identify sensitive factors and determine their degree of impact. This study considers product prices (LNG, crude helium, fuel gas) and feedstock prices as sensitivity factors. Single-factor sensitivity analysis was performed for both the Linde and Exxon Mobil processes. The results show that the change in net cash flow with the percentage change of the sensitivity factors is similar. Therefore, the analysis focuses only on the Exxon Mobil process here. The sensitivity analysis for the Linde process can be viewed in Supplementary Information (Figure S1).
As is shown in Figure 6, product prices have a positive impact on net cash flow, while feedstock prices have a negative impact on net cash flow (NCF). The sensitivity is 1.543 for LNG product price, 0.023 for crude helium product price, 0.081 for fuel gas product price, and 0.616 for feedstock prices. Specifically, the change in LNG product price has a significant positive impact on net cash flow, while the change in feedstock prices has a certain negative impact. The changes in prices of both crude helium and fuel gas products have a relatively small impact on net cash flow.

4. Conclusions

In this work, two helium extraction processes, which integrate flash and distillation to produce helium, fuel gas and liquified natural gas synchronously, are simulated by Aspen HYSYS and evaluated in a technical and economic analysis. The results indicate that higher helium and nitrogen content in the feed will increase the equipment investment cost and CAPEX, with nitrogen content having a more significant impact on costs. Higher helium content in the feed will increase the product revenue and reduce the payback period. However, an increase in nitrogen content will lead to a reduction in LNG production and product revenue. Therefore, the economic viability of the helium extraction process can be improved by removing nitrogen from the feed gas. The Linde process is more sensitive to changes in helium and nitrogen content compared to the Exxon Mobil process, with equipment investment costs and CAPEX varying more significantly with changes in helium and nitrogen content of feed. Increasing the feed scale results in higher CAPEX, OPEX, and product revenue, while reducing the cost of helium extraction per Nm3. The Linde process requires higher separation energy at the same scales, primarily manifested in higher total compressor power and increased utility costs. Additionally, the influence of various stream prices on net cash flow is investigated by sensitivity analysis. The sensitivity analysis shows that the helium breakeven price is strongly affected by the LNG price and feed gas price.

Supplementary Materials

The following supporting information can be downloaded at: https://www.mdpi.com/article/10.3390/pr12091892/s1, Figure S1: NCF with change percentage in Linde integrated process; Table S1: Specifications of the Linde integrated process streams at base case “1” and “a”; Table S2: Specifications of the Exxon Mobil integrated process streams at base case “1” and “a”; Table S3: Installed equipment cost of Linde process and Exxon Mobil process at the base case “1” and “a”.

Author Contributions

Methodology, Y.H. and R.C.; software, G.X.; validation, Y.H.; formal analysis, Y.H. and R.C.; investigation, Y.H.; resources, Y.H., R.Y., C.Y., Y.W., G.X., X.X. and Y.L.; writing—original draft, Y.H.; writing—review and editing, Y.H., R.C. and W.L. All authors have read and agreed to the published version of the manuscript.

Funding

This research was funded by Xinjiang Uygur Region “One Case, One Policy” Strategic Talent Introduction Project, grant number No. XQZX20240054.

Data Availability Statement

The data presented in this study are available on request from the corresponding author.

Conflicts of Interest

The authors declare no conflict of interest.

References

  1. Mokhatab, S.; Poe, W.A.; Mak, J.Y. Nitrogen Rejection and Helium Recovery. In Handbook of Natural Gas Transmission and Processing; Elsevier: Amsterdam, The Netherlands, 2019; pp. 395–408. ISBN 978-0-12-815817-3. [Google Scholar]
  2. Grynia, E.; Griffin, P.J. Helium in Natural Gas—Occurrence and Production. J. Nat. Gas Eng. 2016, 1, 163–215. [Google Scholar] [CrossRef]
  3. Quader, M.A.; Rufford, T.E.; Smart, S. Integration of Hybrid Membrane-Distillation Processes to Recover Helium from Pre-Treated Natural Gas in Liquefied Natural Gas Plants. Sep. Purif. Technol. 2021, 263, 118355. [Google Scholar] [CrossRef]
  4. Weh, R.; Xiao, G.; Pouya, E.S.; May, E.F. Direct Helium Recovery from Natural Gas by Dual Reflux Pressure Swing Adsorption Cascade. Chem. Eng. J. 2022, 450, 137894. [Google Scholar] [CrossRef]
  5. McElroy, L.; Xiao, G.; Weh, R.; May, E.F. A Case Study of Helium Recovery from Australian Natural Gas. Case Stud. Chem. Environ. Eng. 2022, 5, 100200. [Google Scholar] [CrossRef]
  6. Boreham, C.J.; Edwards, D.S.; Poreda, R.J.; Darrah, T.H.; Zhu, R.; Grosjean, E.; Main, P.; Waltenberg, K.; Henson, P.A. Helium in the Australian Liquefied Natural Gas Economy. APPEA J. 2018, 58, 209. [Google Scholar] [CrossRef]
  7. Bi, Y.; Ju, Y. Design and Analysis of an Efficient Hydrogen Liquefaction Process Based on Helium Reverse Brayton Cycle Integrating with Steam Methane Reforming and Liquefied Natural Gas Cold Energy Utilization. Energy 2022, 252, 124047. [Google Scholar] [CrossRef]
  8. Fan, Y.; Li, M.; Li, B.; Li, Q. Progress of Helium Purification Technology. Pet. Process. Petrochem. 2022, 53, 127–134. [Google Scholar]
  9. Rufford, T.E.; Chan, K.I.; Huang, S.H.; May, E.F. A Review of Conventional and Emerging Process Technologies for the Recovery of Helium from Natural Gas. Adsorpt. Sci. Technol. 2014, 32, 49–72. [Google Scholar] [CrossRef]
  10. Ansarinasab, H.; Mehrpooya, M.; Pouriman, M. Advanced Exergoeconomic Evaluation of a New Cryogenic Helium Recovery Process from Natural Gas Based on the Flash Separation—APCI Modified Process. Appl. Therm. Eng. 2018, 132, 368–380. [Google Scholar] [CrossRef]
  11. Moganti, S.; Noble, R.D.; Koval, C.A. Analysis of a Membrane/Distillation Column Hydrid Process. J. Membr. Sci. 1994, 93, 31–44. [Google Scholar] [CrossRef]
  12. Alders, M.; Winterhalder, D.; Wessling, M. Helium Recovery Using Membrane Processes. Sep. Purif. Technol. 2017, 189, 433–440. [Google Scholar] [CrossRef]
  13. Scholes, C.A.; Ghosh, U. Helium Separation through Polymeric Membranes: Selectivity Targets. J. Membr. Sci. 2016, 520, 221–230. [Google Scholar] [CrossRef]
  14. Dai, Z.; Deng, J.; He, X.; Scholes, C.A.; Jiang, X.; Wang, B.; Guo, H.; Ma, Y.; Deng, L. Helium Separation Using Membrane Technology: Recent Advances and Perspectives. Sep. Purif. Technol. 2021, 274, 119044. [Google Scholar] [CrossRef]
  15. Jahromi, P.E.; Fatemi, S.; Vatani, A.; Ritter, J.A.; Ebner, A.D. Purification of Helium from a Cryogenic Natural Gas Nitrogen Rejection Unit by Pressure Swing Adsorption. Sep. Purif. Technol. 2018, 193, 91–102. [Google Scholar] [CrossRef]
  16. Burgers, I.; Dehdari, L.; Xiao, P.; Li, K.G.; Goetheer, E.; Webley, P. Techno-Economic Analysis of PSA Separation for Hydrogen/Natural Gas Mixtures at Hydrogen Refuelling Stations. Int. J. Hydrogen Energy 2022, 47, 36163–36174. [Google Scholar] [CrossRef]
  17. Jia, L.; Ma, B.; Wang, H.; Yu, Y.; Xu, J.; Cheng, J.; Xing, J. Progress and Utilization Status of Global Helium Exploration and Development. Geol. China 2022, 49, 1427–1437. [Google Scholar]
  18. Jiang, H.; Chen, Y.; Cheng, X. Process Design and Analysis of Extracting Helium from Low Helium Natural Gas and Co-Producing LNG. Low-Carbon Chem. Chem. Eng. 2023, 48, 169–175. [Google Scholar]
  19. Froehlich, P.; Clausen, J.J.; Weisend, J.G.; Barclay, J.; Breon, S.; Demko, J.; DiPirro, M.; Kelley, J.P.; Kittel, P.; Klebaner, A.; et al. Large Scale Helium Liquefaction and Considerations for Site Services for a Plant Located in Algeria. In Proceedings of the AIP Conference Proceedings, Chattanooga, TN, USA, 16–20 July 2007; AIP: College Park, MD, USA, 2008; Volume 985, pp. 549–556. [Google Scholar]
  20. Mehrpooya, M.; Shafaei, A. Advanced Exergy Analysis of Novel Flash Based Helium Recovery from Natural Gas Processes. Energy 2016, 114, 64–83. [Google Scholar] [CrossRef]
  21. Jiang, H.; Gao, P.; Li, H. Optimization of Co-Production Process of Cryogenic Helium Concentration and Liquefied Natural Gas. Appl. Therm. Eng. 2023, 225, 120153. [Google Scholar] [CrossRef]
  22. Li, J.; He, L.; Chai, L. Present Situation and Suggestion of Helium Extraction from Natural Gas. Chem. Eng. Oil Gas 2018, 47, 41–44. [Google Scholar]
  23. Jiang, H.; Zhu, M.; Zhang, W. Study on Technology for Recovering Helium from Natural Gas by Double-Tower. Mod. Chem. Ind. 2022, 42, 214–218+222. [Google Scholar] [CrossRef]
  24. Shafaei, A.; Mehrpooya, M. Process Development and Sensitivity Analysis of Novel Integrated Helium Recovery from Natural Gas Processes. Energy 2018, 154, 52–67. [Google Scholar] [CrossRef]
  25. Mehrpooya, M.; Mood, N.G.; Ansarinasab, H.; Alsagri, A.S.; Mehdipourrad, M. A Novel Sensitivity Analysis of a New Integrated Helium Extraction Process through the Interaction of Costs and Environmental Impacts. Appl. Therm. Eng. 2019, 159, 113787. [Google Scholar] [CrossRef]
  26. Kim, D.; Gundersen, T. Helium Extraction from Lng End-Flash. Chem. Eng. Trans. 2015, 45, 595–600. [Google Scholar] [CrossRef]
  27. Hamedi, H. An Innovative Integrated Process for Helium and NGL Recovery and Nitrogen Removal. Cryogenics 2021, 113, 103224. [Google Scholar] [CrossRef]
  28. Al-Sobhi, S.A.; AlNouss, A.; Alsaba, W.; Elkamel, A. Sustainable Design and Analysis for Helium Extraction from Sale Gas in Liquefied Natural Gas Production. J. Nat. Gas Sci. Eng. 2022, 102, 104599. [Google Scholar] [CrossRef]
  29. Bureau of Land Management Crude Helium Price. Available online: https://www.blm.gov/sites/blm.gov/files/docs/2021-06/FY2022%20Posted%20Price.pdf (accessed on 3 March 2024).
  30. Rosewall, T.; Lane, K. Bulletin June Quarter 2015; Reserve Bank of Australia: Sydney, Australia, 2015; pp. 1–8. [Google Scholar]
Figure 1. Process flow diagram of the Linde integrated process.
Processes 12 01892 g001
Figure 2. Process flow diagram of the Exxon Mobil integrated process.
Processes 12 01892 g002
Figure 3. CAPEX, OPEX and cost per Nm3 he changes with Nm3 pa for Case a1 to a3 in Linde integrated process (a) and Exxon Mobil process (b).
Processes 12 01892 g003
Figure 4. Comparison of CAPEX and TIC changes with He content between Linde and ExxonMobil integrated process.
Processes 12 01892 g004
Figure 5. Comparison of CAPEX and TIC changes with N2 content between Linde and ExxonMobil integrated process.
Processes 12 01892 g005
Figure 6. NCF with change percentage in Exxon Mobil integrated process.
Processes 12 01892 g006
Table 1. Specifications of the Linde integrated process streams.
ParameterFeedLNGFuelLN2Crude He
Composition (mol%)
Helium0.050.000.040.0154.66
Nitrogen5.001.0028.3999.2442.30
Methane87.8590.7371.560.753.04
Ethane4.735.510.010.000.00
Propane1.641.910.000.000.00
n-Butane0.380.450.000.000.00
i-Butane0.340.400.000.000.00
Temperature (°C)25.0−160.835.0−194.0−43.0
Pressure (kPa)600013020001302000
Flow rate (kmol/h)235,000201,83932,588104.0192.7
Table 2. Specifications of the Exxon Mobil integrated process streams.
ParameterFeedLNGFuelCrude He
Composition (mol%)
Helium0.050.000.0246.02
Nitrogen5.000.9930.5851.83
Methane87.8590.8169.392.15
Ethane4.735.470.010.00
Propane1.641.900.000.00
n-Butane0.380.440.000.00
i-Butane0.340.390.000.00
Temperature (°C)25.0−160.726.825.0
Pressure (kPa)600013020002000
Flow rate (kmol/h)235,000203,32931,487241.3
Table 3. Different He content in feed for Cases 1 to 7.
Composition (mol%)Case 1Case 2Case 3Case 4Case 5Case 6Case 7
Helium0.050.100.200.501.001.502.00
Nitrogen5.005.005.005.005.005.005.00
Methane87.8687.8187.7187.4186.9186.4185.91
Ethane4.734.734.734.734.734.734.73
Propane1.641.641.641.641.641.641.64
n-Butane0.380.380.380.380.380.380.38
i-Butane0.340.340.340.340.340.340.34
Table 4. Different nitrogen content in feed for Case a to d.
Composition (mol%)Case aCase bCase cCase d
Helium0.050.050.050.05
Nitrogen5.0010.0015.0020.00
Methane87.8682.8677.8672.86
Ethane4.734.734.734.73
Propane1.641.641.641.64
n-Butane0.380.380.380.38
i-Butane0.340.340.340.34
Table 5. The Specifications of Products.
PropertyValue
Helium extraction rate≥90%
Crude He content≥50%
N2 content in LNG≤1%
N2 content in fuel gas≤40%
Table 6. Profitability analysis results of Linde integrated process.
ParameterCase 1Case 2Case 3Case 4Case 5Case 6Case 7
Total Capital Cost238.80243.18245.62253.65275.52285.96296.41
Total Income (m$)1391140814391532162018451984
IRR (%)101.30101.63105.25116.21126.02151.90170.21
Payback Period (year)3.083.073.032.902.812.652.53
ParameterCase aCase bCase cCase d
Total Capital Cost238.80393.63505.63543.85
Total Income (m$)1391130112251127
IRR (%)101.3084.3273.6562.57
Payback Period (year)3.083.463.774.19
Table 7. Profitability analysis results of Exxon Mobil integrated process.
ParameterCase 1Case 2Case 3Case 4Case 5Case 6Case 7
Total Capital Cost217.37224.56226.59226.89227.42229.15231.71
Total Income (m$)1391140814421552173919392139
IRR (%)101.30103.27107.31120.43143.34167.71192.42
Payback Period (year)3.073.042.982.842.662.522.41
Case aCase bCase cCase d
Total Capital Cost217.37249.70268.92281.09
Total Income (m$)1391124711231007
IRR (%)101.3087.4475.4064.62
Payback Period (year)3.073.343.684.11
Table 8. Economic evaluation for Case a1 to a3 in Linde integrated process.
Components (m$)Case a1Case a2Case a3
Total Capital Investment213.51238.80255.65
Installed equipment costs94.71104.65111.81
Construction cost47.3652.3255.91
Total Operating Cost225.76278.25304.92
Total Utilities Cost211.29262.47285.63
Feed gas442.97520.62598.01
Cost per Nm3 he($)13.2112.5711.72
Total Income118613911601
IRR(%)101.75101.30100.14
Payback Period(year)3.033.083.11
Table 9. Economic evaluation for Case a1 to a3 in Exxon Mobil integrated process.
Components (m$)Case a1Case a2Case a3
Total Capital Investment187.08217.37244.06
Installed equipment costs81.9694.99106.54
Construction cost40.9847.5053.27
Total Operating Cost218.38256.74292.80
Total Utilities Cost205.58241.23276.78
Feed gas442.97520.62598.01
Cost per Nm3 he($)11.0510.9310.68
Total Income118413911598
IRR(%)102.13101.30100.77
Payback Period(year)3.033.073.10
Table 10. Comparison of economic data for Linde and Exxon Mobil integrated process.
ParameterLindeExxon Mobil
Total Utilities Cost (m$)262.47241.23
Total Operating Cost (m$)278.25256.74
Total Income (m$)13911391
IRR (%)101.30101.30
Payback Period (year)3.083.07
Disclaimer/Publisher’s Note: The statements, opinions and data contained in all publications are solely those of the individual author(s) and contributor(s) and not of MDPI and/or the editor(s). MDPI and/or the editor(s) disclaim responsibility for any injury to people or property resulting from any ideas, methods, instructions or products referred to in the content.

