Article

Determination of the Main Production Factors and Production Predictions of Test Wells in the Offshore Tight Oil Reservoirs in the L Formation of the Beibu Basin Using Multivariate Statistical Methods

School of Geosciences, Yangtze University, Wuhan 430100, China
*
Author to whom correspondence should be addressed.
Processes 2024, 12(9), 1922; https://doi.org/10.3390/pr12091922
Submission received: 19 July 2024 / Revised: 3 September 2024 / Accepted: 5 September 2024 / Published: 6 September 2024
(This article belongs to the Section Energy Systems)

Abstract

:
This study addresses the challenge of rapidly and accurately predicting the production of test wells in offshore tight oil reservoirs, specifically within the L Formation of the Beibu Basin. This challenge is particularly pronounced in situations where drill stem tests are limited and evaluating each untested well layer is difficult. To achieve this objective, we analyzed fifteen typical test wells in the L Formation, taking into account both geological and engineering factors. Initially, Pearson correlation analysis, partial correlation analysis, and grey relational analysis were used to identify the main production factors. Based on these analyses, two types of production prediction models were developed: one employing the comprehensive production index method and the other utilizing the production coefficient method. The research identified effective permeability, porosity, oil saturation, and shale content as the main production factors for the test wells in the study area. The model verification results showed that the comprehensive production index model performs effectively for the L Formation, with an average prediction error of 20.40% compared to the actual production values. This research is significant for optimizing and stabilizing production in tight oil reservoirs.

1. Introduction

The focus of exploration is shifting from conventional to unconventional resources, from shallow to deep reservoirs, and from terrestrial to marine environments [1,2,3,4,5]. Previous studies indicate that formations deeper than 3000 m contain substantial resource reserves and offer a significant potential for exploration [1,4]. As a result, offshore deep tight reservoirs have emerged as a key area of research in unconventional resources [1,6,7]. These reservoirs are typically located in high-temperature and high-pressure environments [8] and exhibit notable heterogeneity, complex pore structures, limited pore connectivity, and intricate fluid occurrence and distribution compared to conventional reservoirs [9,10]. Oil production is a critical factor in evaluating the potential of geological resources [11], and economic viability hinges on ensuring that production exceeds extraction costs, highlighting the need for accurate predictions of oil production.
Numerous researchers have employed statistical methodologies, including information theory, univariate analysis, and grey theory, to investigate principal production factors [12,13,14]. The principal production factors within the study area encompass both geological and engineering factors. Researchers such as Hu et al. have concentrated on tight oil reservoirs, developing a numerical model to evaluate production factors [15,16,17,18]. The findings suggest that the initial pressure gradient, permeability, reservoir pressure, and stress sensitivity are the primary geological factors impacting production. Furthermore, the length of the horizontal well section emerges as a pivotal engineering factor affecting production. The principal production factors in tight oil reservoirs can be classified as follows: geological factors, comprising porosity, permeability, reservoir thickness, the initial pressure gradient, and natural fractures [12,13,14,15,16,18,19,20]. The fluid properties include the viscosity and relative density of the crude oil [15,21,22,23]. Additionally, engineering factors such as the oil well radius [15,17,18] are considered.
The main production prediction methods in tight oil reservoirs are the well test method [24], the logging method [25,26], the analytical method, the numerical simulation method [15,16,17,18], and the machine learning method [27,28]. In actuality, it is challenging to consider all these factors comprehensively. Therefore, it becomes essential to identify and prioritize the main production factors. While analyzing production factors, the focus is often on discussing the production variations resulting from various factors rather than comparing the varying degrees of influence caused by the different factors. The number of drill stem test assessments conducted in offshore tight oil reservoirs is limited, making it challenging to assess the production of untested sections. Due to the complexities involved in obtaining crucial factors for offshore reservoirs and the intricate nature of tight oil reservoirs, the commonly employed production prediction methods also exhibit limitations.
The primary objective of this research is to construct two rapid-production prediction models for test wells in the L Formation of the Beibu Basin. The paper is structured as follows (Figure 1): The comprehensive production index method begins with a Pearson correlation analysis and partial correlation analysis to identify the main production factors: effective permeability, porosity, and oil saturation. Subsequently, a detailed analysis of each individual production factor is performed to determine the correlation coefficient between each factor and the specific oil production index. The corresponding weight coefficients are then calculated based on these correlation coefficients. Using these weight coefficients, a comprehensive production index model is constructed, which is then used to develop a production prediction model. The production coefficient method starts with a grey relational analysis to identify the key production factors: effective permeability, shale content, and porosity. These three factors are then combined to compute the production coefficient. Finally, the production coefficient and the specific oil production index are analyzed and fitted, leading to the development of a production prediction model in the form of a power function. Finally, the effectiveness and feasibility of the two proposed methods are validated using actual oil production data.

2. Selection of Production Factors

2.1. Calculation of Specific Oil Production

After the drill stem test, the specific oil production index served as a crucial metric for the production analysis [29].
The production index [30,31] is given as follows:
J o = q o Δ p = q o p R p w f
where Jo is the production index, m3/d/MPa; qo is the oil production rate, m3/d; Δp is the pressure differential, MPa; pR is the original formation pressure; MPa; and pwf is the well bottom pressure, MPa.
The specific oil production index [30,31] is given as follows:
J o s = J o h = q o Δ p h = q o p R p w f h
where Jos is the specific oil production index, m3/d/MPa; and h is the effective thickness, m.
Typically, the pressure differential and oil flow under stable well-bottom flow conditions conform to the plane radial flow production formula [29,31,32]:
J o s = q o Δ p h = C K o h B o μ o lg r e r w + S Δ p
where C is the unit conversion coefficient, constant; Ko is the effective permeability, mD; Bo is the oil volume factor, m3/m3; μo is the viscosity, MPa/s; re is the supply oil radius, m; rw is the well radius, m; and S is the skin coefficient, dimensionless.
We collected fifteen layers of drill stem test data from fifteen wells in the L Formation of the Beibu Basin. Using Formulas (1) and (2), we calculated the production index and the specific oil production index for each well (Table 1).

2.2. Determination of Production Factors

Reservoir production is intricately linked to reservoir properties, oil characteristics, supply oil radius, and various other factors (Formula (3)). Based on the formula of the specific oil production index (Formula (3)), eight production factors were identified (Table 2). The shale content was obtained from logging data; the original formation pressure, porosity, viscosity, oil saturation, and well radius were obtained from reservoir physical property data and oil test data; and the effective permeability and skin coefficient were determined through well test interpretation.

3. Construction of Comprehensive Production Index Model

The process for constructing the comprehensive production index model can be summarized in five steps: (a) Determination of main production factors; (b) Data normalization; (c) Calculation of weight coefficients; (d) Construction of comprehensive index model; and (e) Verification (Figure 2).

3.1. Analysis of Main Production Factors

Using a Pearson correlation analysis and a partial correlation analysis, we identified three main production factors, which were then used to construct the comprehensive production index model. A single-factor analysis was performed on these three main production factors to obtain the correlation coefficients associated with production.

3.1.1. Pearson Correlation Analysis

The Pearson correlation analysis is a widely used method for evaluating single factors and can be employed to assess the linear correlation between variables [28,33]. The calculation formula for the Pearson correlation coefficient is as follows [34]:
p x y = cov x , y var x var y
where pxy is the Pearson correlation coefficient, pxy ∈ [–1, 1]. If pxy < 0, the two variables are negatively correlated, while if pxy = 0, the two variables are not correlated, and if pxy > 0, the two variables are positively correlated. Additionally, cov (x, y) is the covariance of x and y, var (x) is the variance of x, and var (y) is the variance of y.
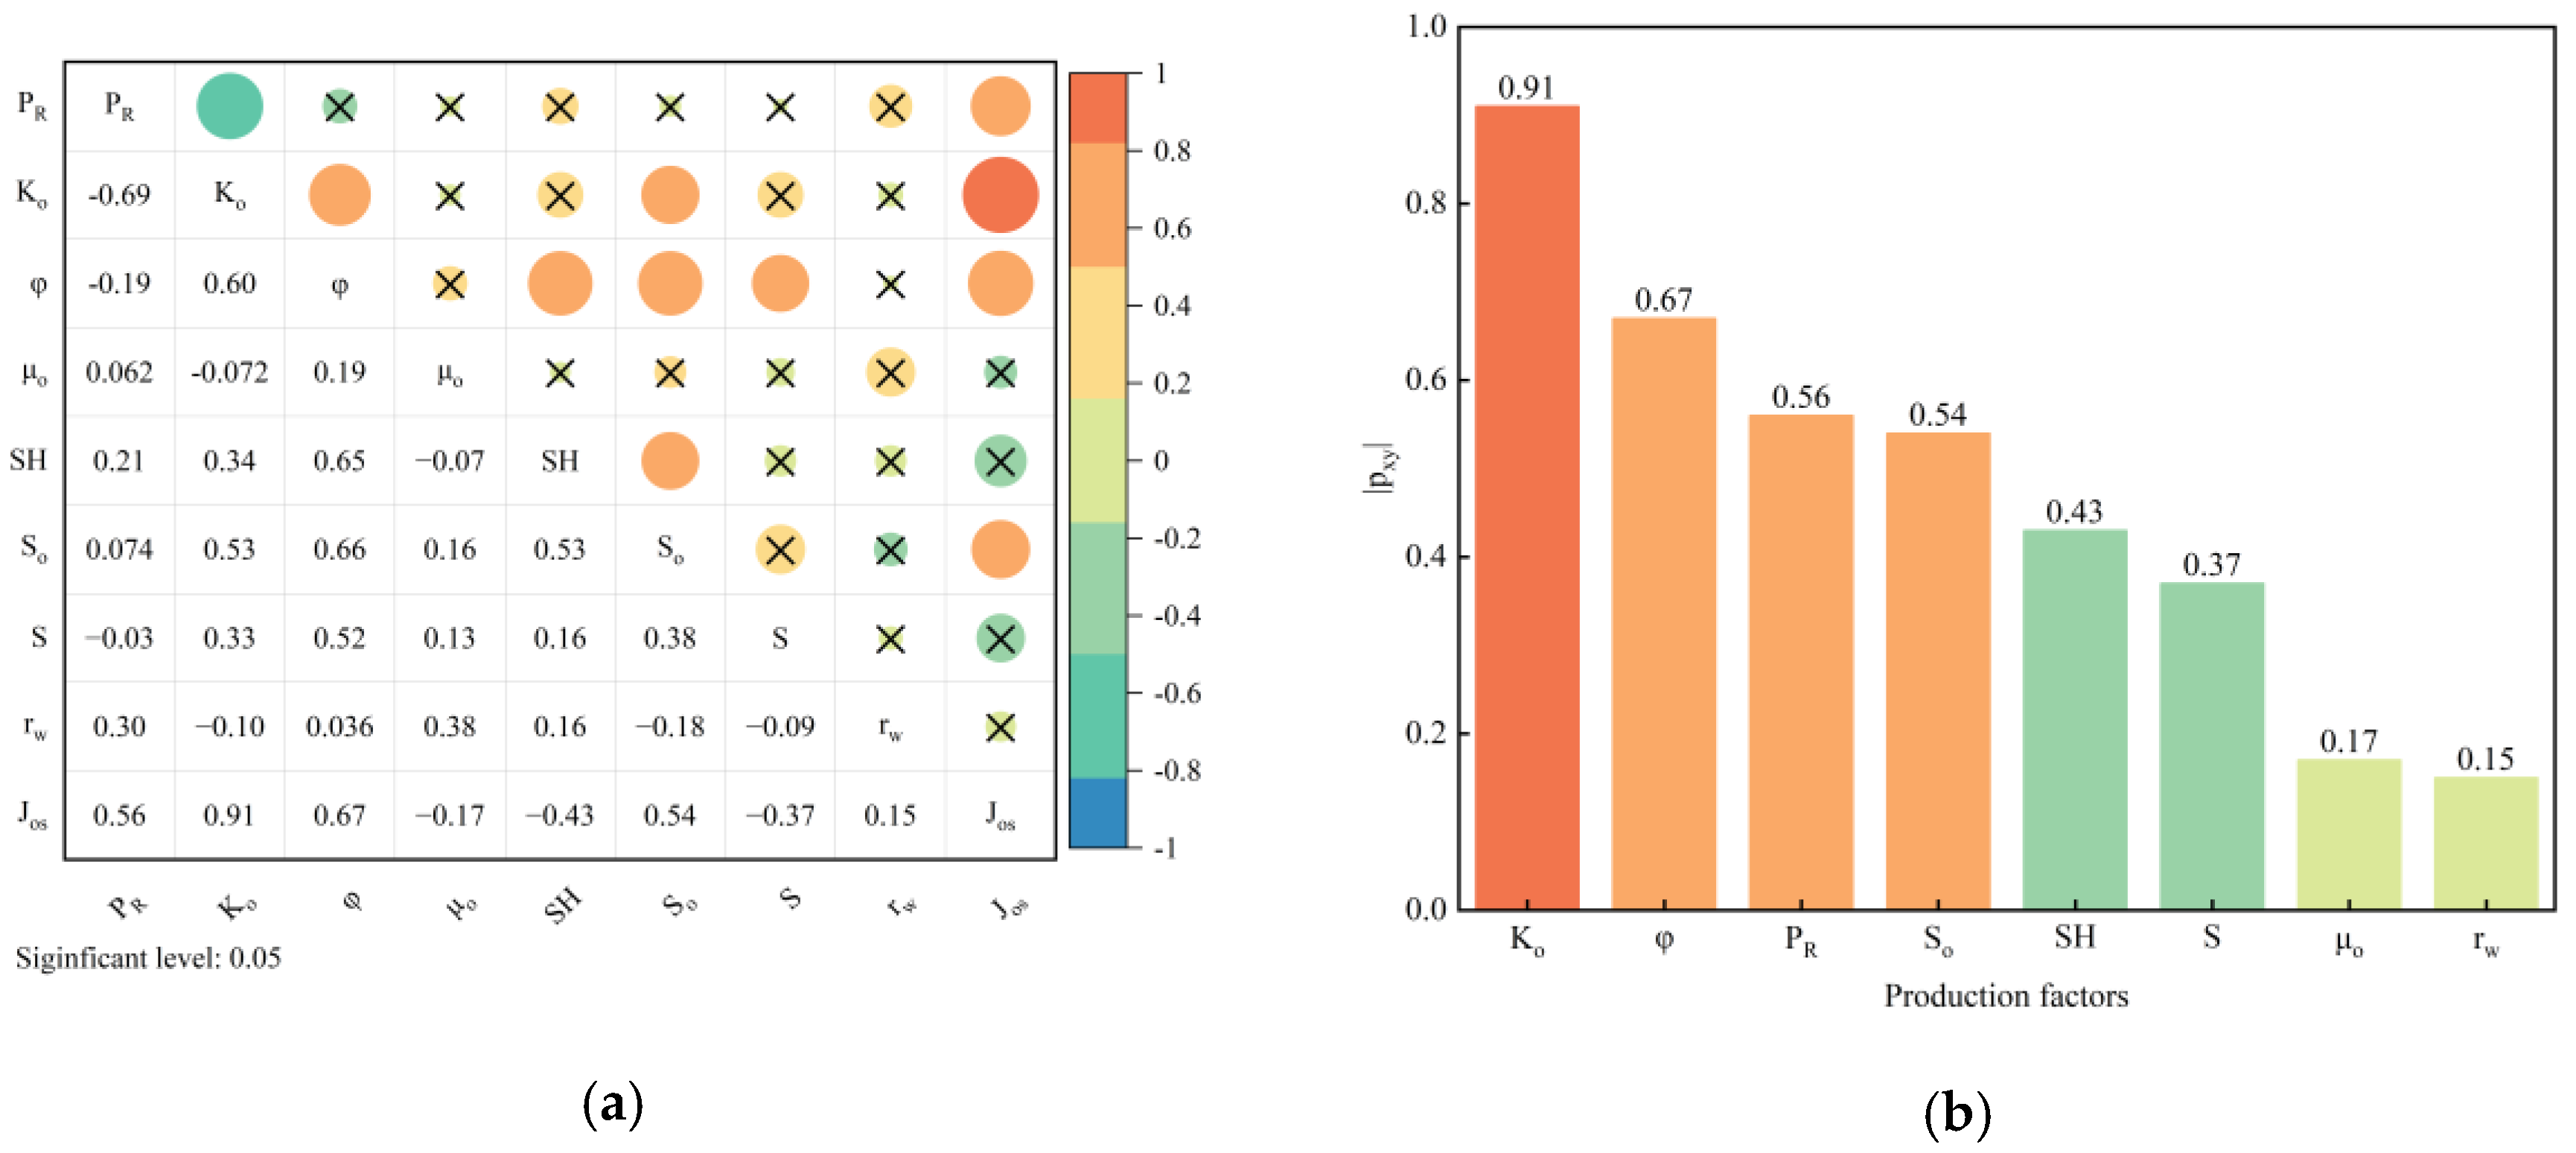
Based on the Formula (4), we calculated the Pearson correlation coefficient between the production factors and specific oil production index by using the data in Table 2, and the results of this analysis are depicted in Figure 3.
We identified four main production factors: effective permeability (0.91), porosity (0.67), original formation pressure (0.56), and oil saturation (0.54) (Figure 3a). In contrast, viscosity (−0.17), shale content (−0.43), skin coefficient (−0.37) and well radius (0.15) were found to have no significant linear relationship with production (Figure 3a).

3.1.2. Partial Correlation Analysis

The correlation coefficient measures whether there is a linear relationship between the variables x and y and quantifies the strength of this relationship. However, if a third variable z is numerically related to both x and y, it may lead to misleading results [35]. Therefore, calculating the partial correlation coefficient is essential to account for and eliminate the influence of the control variable z.
The partial correlation coefficient is based on the Pearson correlation coefficient, which is defined as follows [34,35]:
p x y z = c o r ε ^ , ζ ^ = cov ε ^ , ζ ^ var ε ^ var ζ ^
where pxy|z is the partial correlation coefficient, pxy|z ∈ [−1, 1]. If pxy|z < 0, the two variables are negatively correlated; if pxy|z = 0, the two variables are not correlated; and if pxy|z > 0, the two variables are positively correlated. Additionally, cov ε ^ , ζ ^ is the covariance of ε ^ and ζ ^ ; var ε ^ is the variance of ε ^ ; and var ζ ^ is the variance of ζ ^ .
The process for calculating the partial correlation coefficient is as follows. First, a regression model was constructed.
The regression model of x is as follows:
x = z α + ε
The regression model of y is as follows:
y = z β + ζ
Then, using ordinary least squares, we calculated the regression coefficients.
The regression coefficients of x are as follows:
α ^ = z T z 1 z x
The regression coefficients of y are as follows:
β ^ = z T z 1 z y
According to the regression coefficients, we can obtain the following residuals.
The residual of x is as follows:
ε ^ = x z α ^
The residual of y is as follows:
ζ ^ = y z β ^
By substituting Formulas (10) and (11) into Formula (5), the partial correlation coefficient can be obtained.
Based on the Formula (5), with the original formation pressure as the control variable, we calculated the partial correlation coefficient between the production factors and the specific oil production index by using the data in Table 2, and the results of this analysis are depicted in Figure 4.
As shown in Figure 4b, after accounting for the influence of the original formation pressure on the other production factors, the correlations between the porosity, oil saturation, and production improve significantly. We identified three main production factors: effective permeability (0.87), oil saturation (0.71), and porosity (0.70) (Figure 4a). In contrast, the shale content (−0.48), skin coefficient (−0.43), viscosity (−0.16), and well radius (0.025) did not exhibit a significant linear relationship with production (Figure 4a). The results from the partial correlation analysis are largely consistent with those obtained from the Pearson correlation analysis.

3.1.3. Analysis of Single-Production Factor

For the results of the Pearson correlation analysis and the partial correlation analysis, the three main production factors were effective permeability, porosity, and oil saturation (Figure 3 and Figure 4). These production factors were analyzed through a single-factor analysis, and their detailed impacts on production were discussed.
(I)
Analysis of effective permeability and production
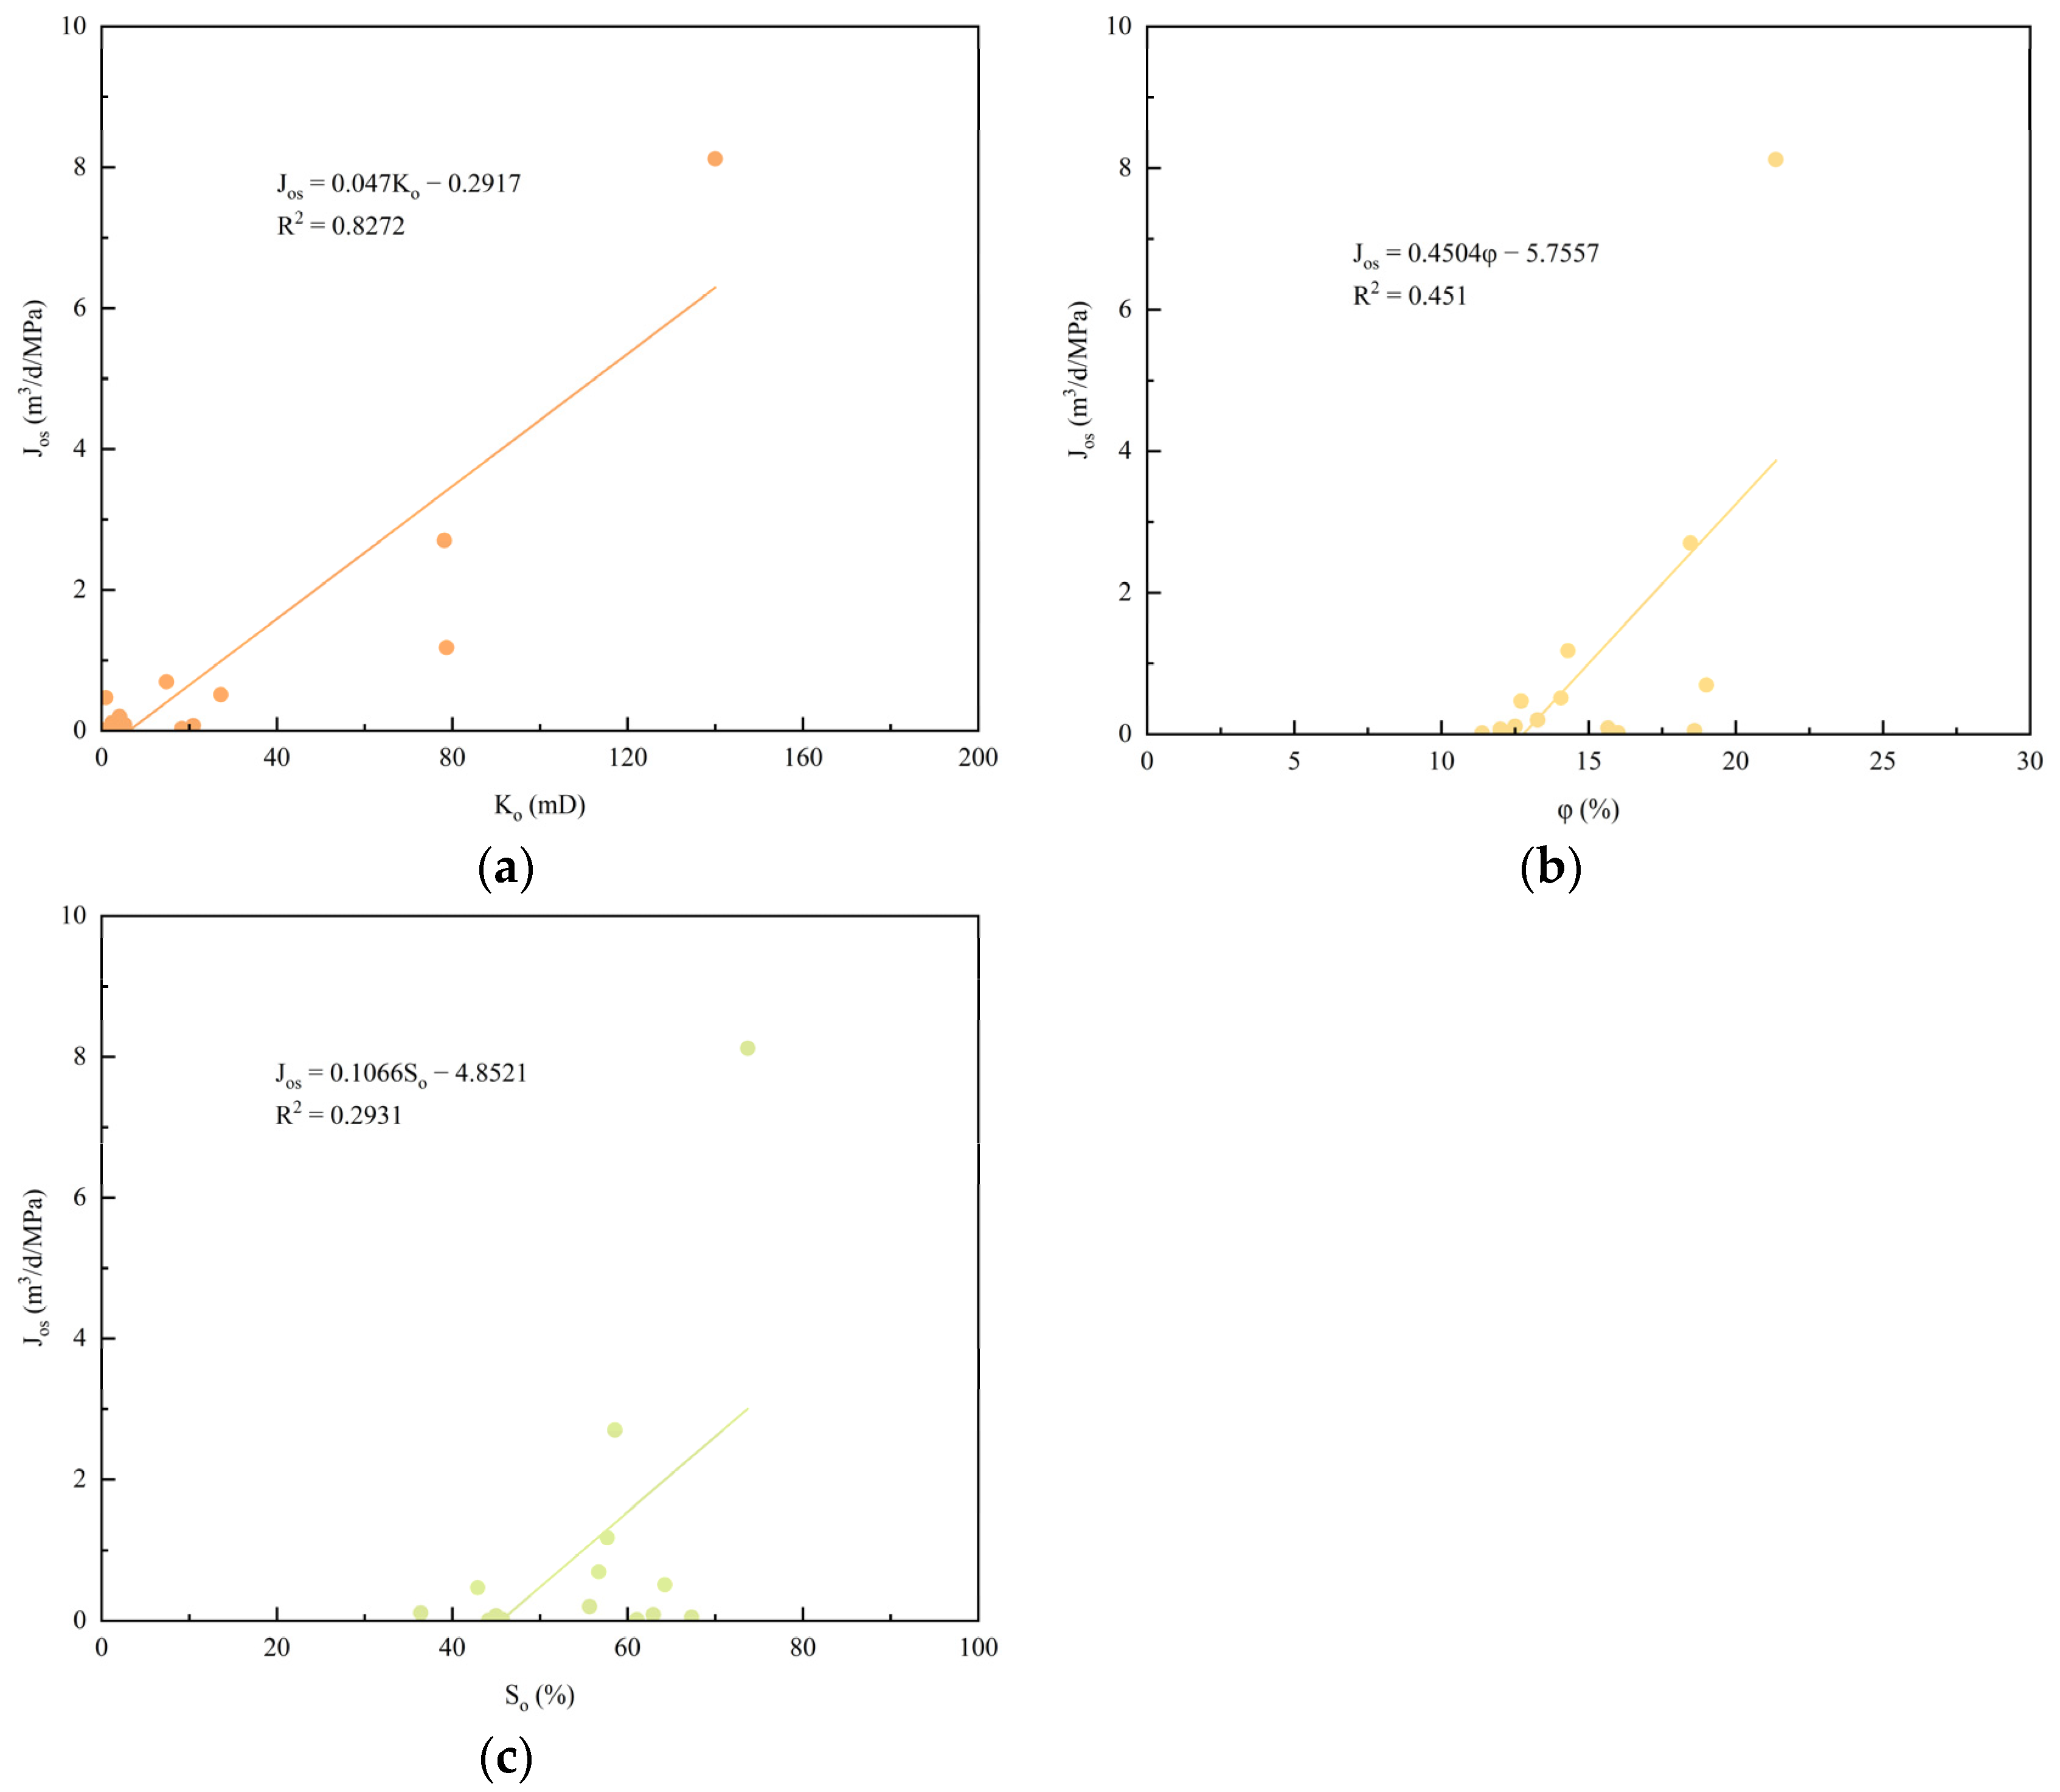
Tight reservoirs exhibit characteristics such as low-permeability, porous media, capillary effects, and significant stress sensitivity [36,37]. For Figure 5a, the reservoir in the L Formation of the Beibu Basin predominantly features low permeability, with an effective permeability range from 0.0472 mD to 140 mD and an average of 26.451 mD. The reservoir shows strong heterogeneity and poor seepage performance. The linear curve indicates a robust correlation (0.827) between the effective permeability and the specific oil production index (Table 3).
(II)
Analysis of porosity and production
Porosity is one of the key factors of the physical properties of reservoirs, as it is directly related to the quality of the storage performance of the reservoir and has a certain impact on the oil well production. For Figure 5b, the porosity in the L Formation of the Beibu Basin is low, with a porosity range from 11.4% to 21.4%, and an average of 14.9%, indicating that the reservoir performance is not good. The linear curve indicates a general correlation (0.451) between the porosity and the specific production index (Table 3).
(III)
Analysis of oil saturation and production
The permeability and porosity only reflect the quality of its physical properties or the size of the liquid production and cannot reflect the fluid properties contained in the reservoir. Oil saturation is a very important factor in the reserve calculation, production evaluation and development plan design. Under the same conditions of reservoir permeability and porosity, the higher the oil saturation, the greater the oil content and oil production. For Figure 5c, the oil saturation range is from 36.4% to 73.7%, and has an average of 54.4%, indicating that the oil reserves in the Beibu Basin are generally poor. The linear curve indicates a poor correlation (0.293) between the oil saturation and the specific oil production index (Table 3).

3.2. Data Normalization

Based on the results of our single-factor analysis, the correlation coefficients among the effective permeability (0.827), porosity (0.451), and oil saturation (0.2931) are highest between the specific oil production index (Figure 5). These variables can be used as the independent variables to construct the comprehensive production index model. Due to the different dimensions of these production factors, each one was first normalized between 0 and 1 (Formulas (12)–(15)), as seen in (Table 4). The formulas are as follows:
x = x x min x max x min
where x is the normalization of the production factors, dimensionless; x is the production factors; x min is the minimum value of x; and x max is the maximum value of x.
Normalization of effective permeability is given as follows:
K o = K o K o min K o max K o min
Normalization of porosity is given as follows:
ϕ = ϕ ϕ min ϕ max ϕ min
Normalization of oil saturation is given as follows:
S o = S o S o min S o max S o min

3.3. Calculation of Weight Coefficient

For the Formula (16), the greater the correlation coefficient, the higher the corresponding weight coefficient, ensuring that the sum of each factor’s weight coefficients equals 1. Table 5 illustrates the weight coefficients of the main production factors in the L Formation of the Beibu Basin.
a = a i / i = 1 n a i

3.4. Calculation of Comprehensive Production Index

According to the main production factors and their corresponding weights, the comprehensive production index was obtained. The formula is as follows:
F o = 0.526 × K o + 0.287 × ϕ + 0.187 × S o
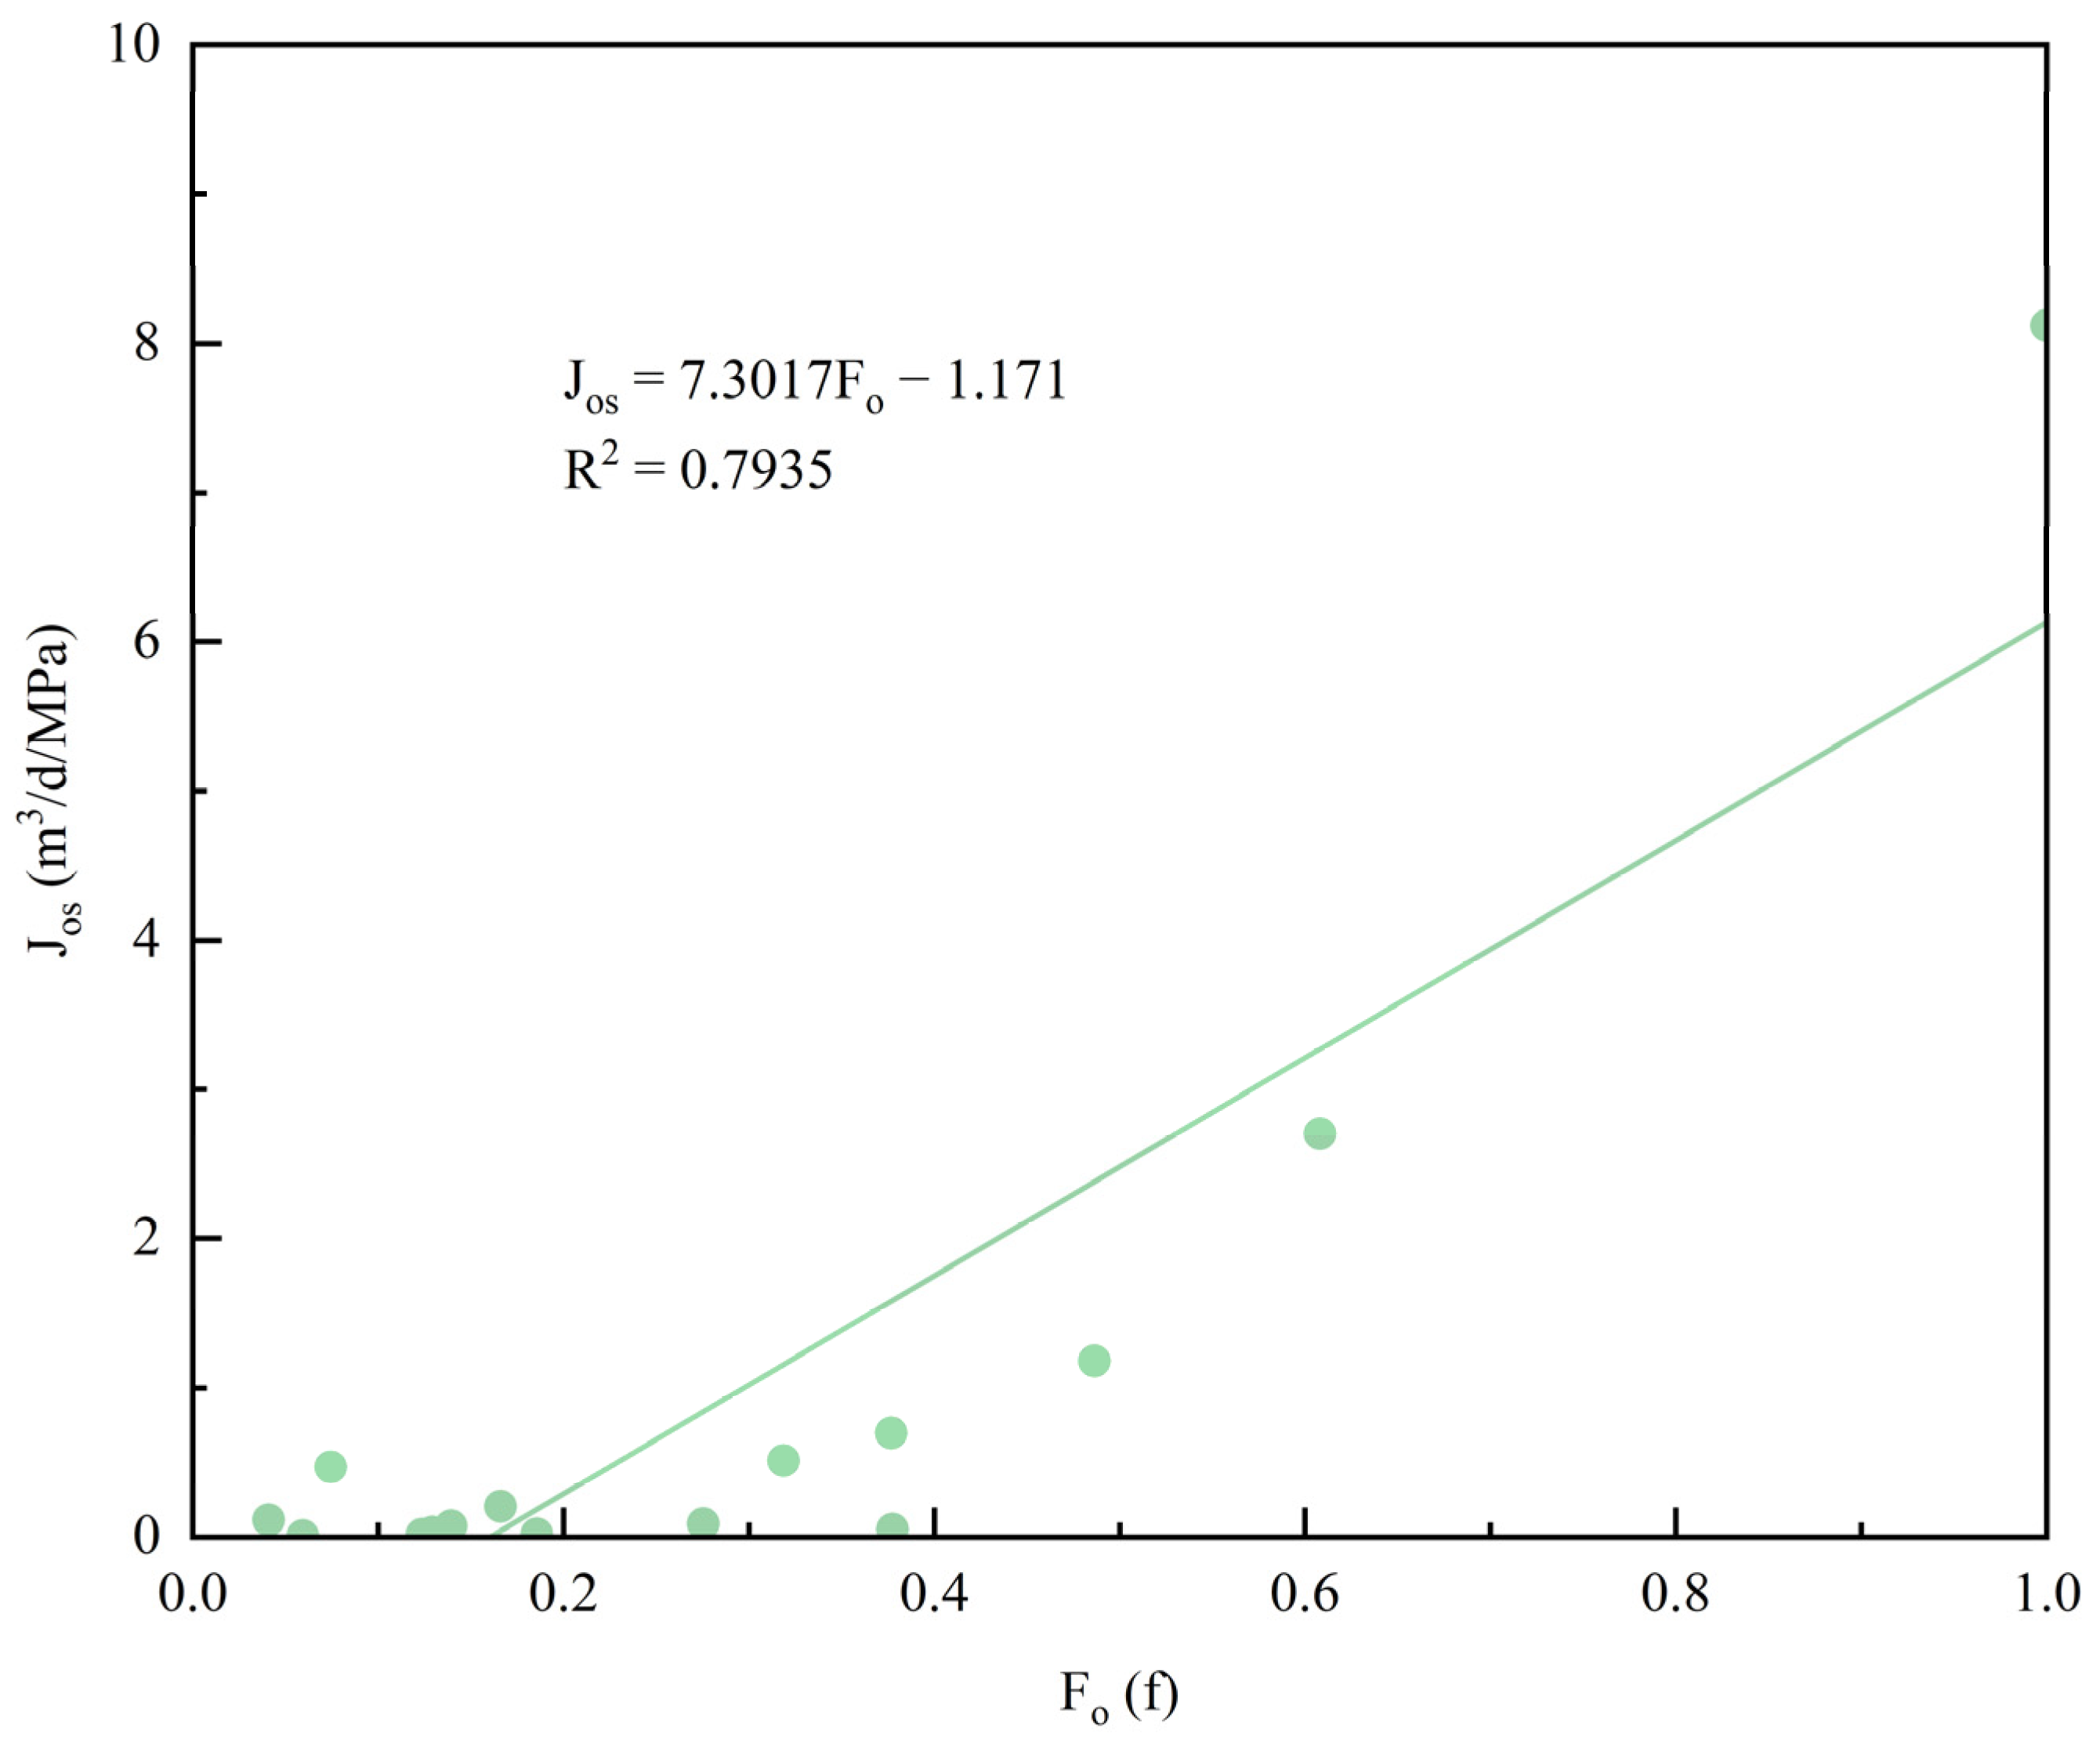
For Figure 6, a strong correlation exists between the comprehensive production index and the specific oil production index, indicated by a correlation coefficient of 0.793. Therefore, this model can accurately predict the production of the test wells in the L Formation of the Beibu Basin. The fitting formula is as follows:
J o s = 7.3017 × F o 1.171
Taking Formula (17) into Formula (18), the production prediction model of the test wells in the L Formation of the Beibu Basin can be obtained as follows:
J o s = 7.3017 × 0.526 × K o + 0.287 × ϕ + 0.187 × S o 1.171
For Figure 6, the production prediction model constructed using the comprehensive production index method shows further improvement compared to the correlations observed in the single-factor analysis. Therefore, it provides a more accurate prediction of oil production in the test wells in the L Formation of the Beibu Basin.

4. Construction Production Coefficient Model

The process for constructing the production coefficient model can be summarized in three steps: (a) Determination of the main production factors by a grey relational analysis; (b) Construction of the production coefficient model; and (c) Verification.

4.1. Grey Relational Analysis of Main Production Factors

The grey relational analysis is a statistical method used to assess the degree of correlation between factors based on the similarities and differences in their development trends [38,39].
Firstly, based on Table 2, the reference sequence is the specific oil production index [38]:
x 0 = x 0 k | k = 1 , 2 , 3 , , n
where x0 is the reference sequence; k is the number of samples; and n is the total number of samples.
The comparison sequence is the original formation pressure, effective permeability, porosity, viscosity, shale content, oil saturation, skin coefficient, and well radius [38]:
x i = x i k | k = 1 , 2 , 3 , , n
where xi is the comparison sequence; i is the production factor index, i = 1, 2, 3, ……, m; and m is the total number of the production factors index.
The production factors were averaged to eliminate the influence of dimensions between the data:
x i k = x i k a v e x i
where a v e x i is the average of xi.
The grey incidence coefficient is as follows [38]:
ζ i k = min i   min k   Δ i k + ρ   max i   max k   Δ i k Δ i k + ρ max i   max k   Δ i k
where ζ i k is the grey incidence coefficient; mini is the minimum value of i; mink is the minimum value of k; Δ i k is the difference sequences, Δ i k = x 0 k x i k ; ρ is the resolution coefficient, ρ = 0.5; maxi is the maximum value of i; and maxk is the maximum value of k.
The grey correlation degree is as follows [38]:
r i = 1 n k n ζ i k
where ri is the grey correlation degree.
Based on Formulas (20)–(24), the grey correlation coefficient was calculated, and the production factors were ranked according to the grey correlation degree. The results are as follows (Table 6).
According to Table 6, for the eight production factors, the correlation between the production and the effective permeability is the highest (0.908), followed by the shale content (0.815) and the porosity (0.814).

4.2. Calculation of Production Coefficient

Based on the results of the grey relational analysis, the effective permeability, shale content, and porosity were optimized to construct the production coefficient:
F p = K o × S H × ϕ
where Fp is the production coefficient.
Based on Formula (25), the result of the production coefficient in the L Formation of the Beibu Basin is shown as Table 7.
Using the production coefficient calculated in Table 7, we performed a regression analysis to examine the relationship between the production coefficient and the specific oil production index (0.876), as shown in Figure 7. The formula is as follows:
J o s = 0.0028 F p 0.6007
Taking Formula (25) into Formula (26), the production coefficient model of the test wells in the offshore tight oil reservoirs can be obtained as follows:
J o s = 0.0028 × K o × S H × ϕ 0.6007

5. Verification

According to the comprehensive production index model and the production coefficient model, data from two new oil test wells were introduced for verification (Table 8).
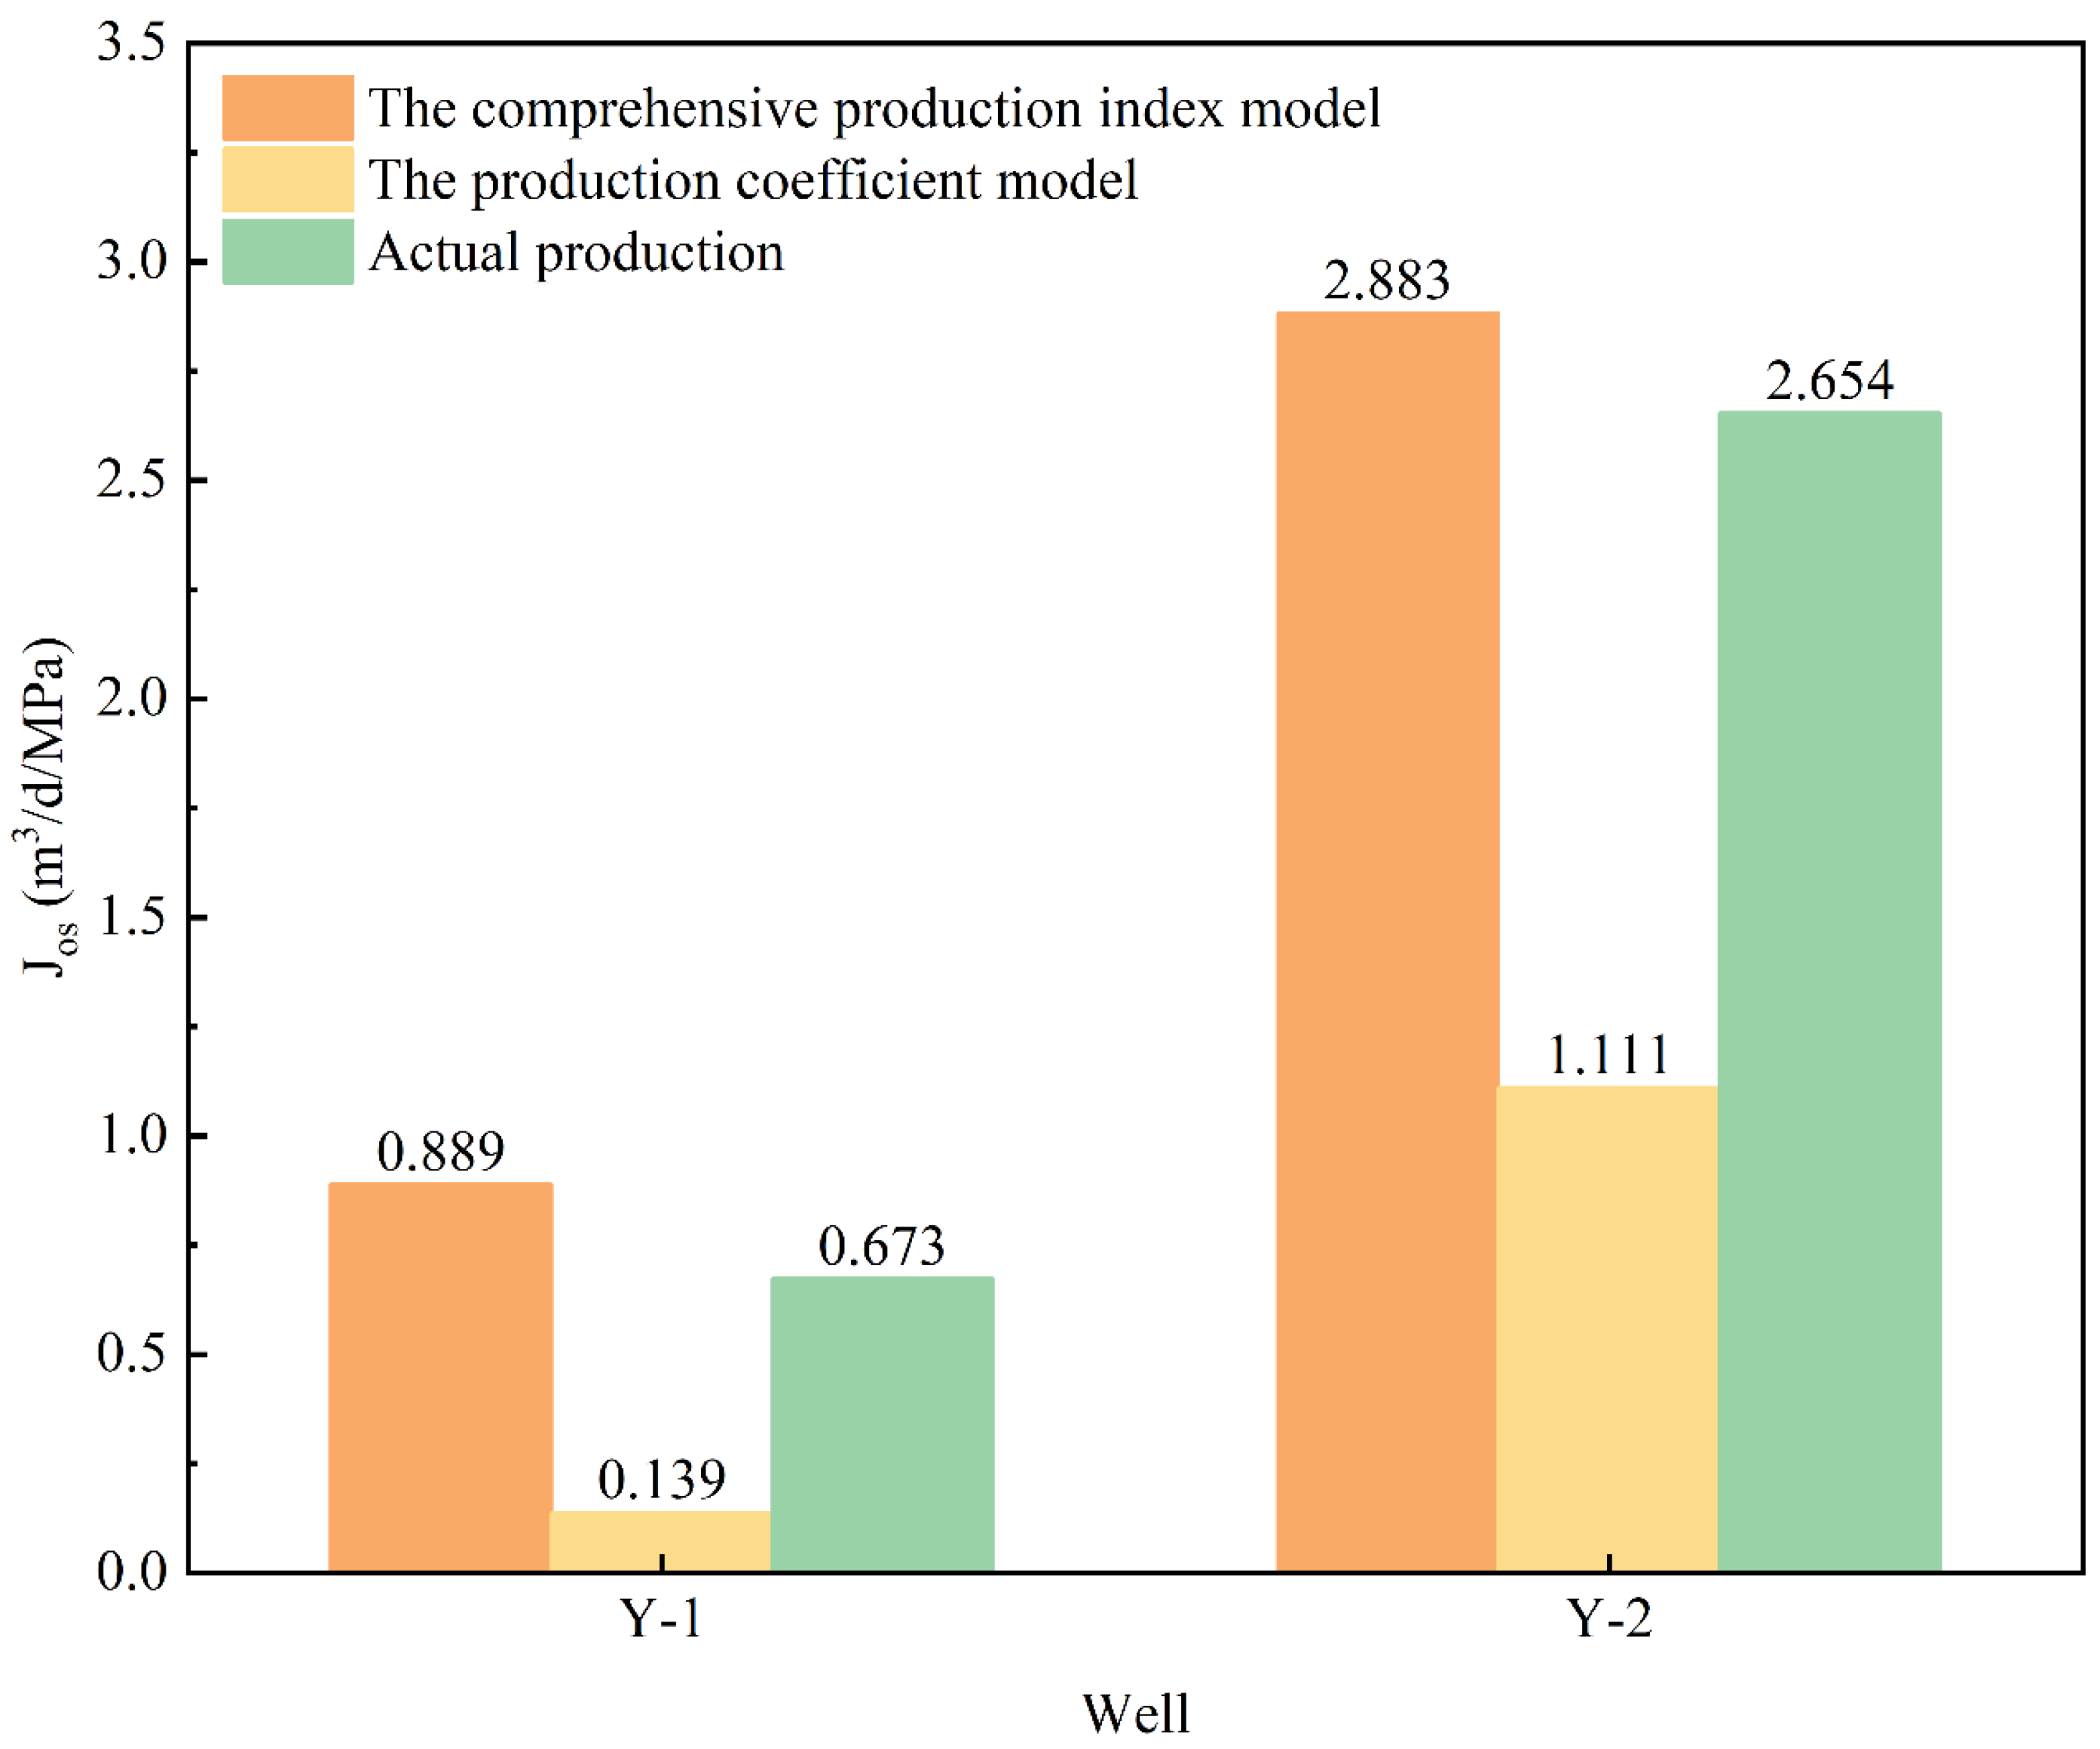
The production prediction results of the comprehensive production index model are detailed in Table 9 and illustrated in Figure 8. The relative error between the actual and predicted production values falls within 35%, with an average error of 20.40%. This model effectively predicts production for test wells in the offshore tight oil reservoirs in the L Formation of the Beibu Basin.
The production prediction results of the production coefficient model are detailed in Table 10 and illustrated in Figure 8. The relative error between the actual and predicted production values falls within 80%, with an average error of 68.78%.

6. Conclusions

To accurately evaluate and predict the production of test wells in the offshore tight oil reservoirs within the L Formation of the Beibu Basin, this paper presents two production prediction methods: the comprehensive production index method and the production coefficient method. The model verification results indicate that the comprehensive production index model performs well when applied to the L Formation of the Beibu Basin, with an average error of 20.40% between the predicted and actual production values. The main conclusions are as follows:
(1)
According to the results of the Pearson correlation analysis, partial correlation analysis, and grey relational analysis, the main production factors involved in the test well in the research area are effective permeability, porosity, oil saturation, and shale content. Effective permeability is the most critical main production factor, and effective permeability has a great influence on production in the L Formation of the Beibu Basin.
(2)
According to the verification results achieved using the comprehensive production index method, the average error between the actual and predicted production values is 20.40%. The predicted production under this model is higher than the actual production. The model has shown a strong performance in applications within the L Formation of the Beibu Basin, providing more accurate production predictions.
(3)
According to the verification results achieved using the production coefficient method, the average error between the actual and predicted production values is 68.78%. The predicted production under this model is lower than the actual production. The model has been poorly applied to the L Formation of the Beibu Basin.
(4)
This method can be employed to rapidly predict the production of test wells and offer valuable insights for their further development.

Author Contributions

Investigation, conceptualization, and writing—original draft, X.G.; supervision and review, K.G.; analysis and validation, Y.J.; data processing and writing—original draft, Q.L.; graphical processing, J.L. All authors have read and agreed to the published version of the manuscript.

Funding

This research received no external funding.

Data Availability Statement

The raw data supporting the conclusions of this article will be made available by the authors, without undue reservation.

Acknowledgments

The authors would like to express their sincere gratitude to Yangtze University for providing an excellent research environment. The authors wish to acknowledge Guo for interpreting the significance of the results of this study.

Conflicts of Interest

The authors declare that the research was conducted in the absence of any commercial or financial relationships that could be construed as potential conflicts of interest.

Nomenclature

athe weight coefficients
a v e x i the average of xi
Bothe oil volume factor, m3/m3
cov (x, y)the covariance of x and y
cov ε ^ , ζ ^ the covariance of ε ^ and ζ ^
Cthe unit conversion coefficient, constant
Fothe comprehensive production index
Fpthe production coefficient
hthe effective thickness, m
ithe production factor index, i = 1, 2, 3, ……, m
Jothe production index, m3/d/MPa
Josthe specific oil production index, m3/d/Mpa
kthe number of samples
Kothe effective permeability, mD
K o the normalization of effective permeability
mthe total number of production factors index
maxithe maximum value of i
maxkthe maximum value of k
minithe minimum value of i
minkthe minimum value of k
nthe total number of samples
pRthe original formation pressure, MPa
pwfthe well bottom pressure, Mpa
pxythe Pearson correlation coefficient, pxy ∈ [−1, 1]
pxy|zthe partial correlation coefficient, pxy|z ∈ [−1, 1]
qothe oil production rate, m3/d
rethe supply oil radius, m
rithe grey correlation degree
rwthe well radius, m
R2the correlation coefficient
Sthe skin coefficient, dimensionless
SHthe shale content, %
Sothe oil saturation, %
S o the normalization of oil saturation
var (x)the variance of x
var (y)the variance of y
var ε ^ the variance of ε ^
var ζ ^ the variance of ζ ^
xthe production factors
x the normalization of production factors, dimensionless
x0the reference sequence
xithe comparison sequence
x max the maximum value of x
x min the minimum value of x
Δ i k the difference sequences, and Δ i k = x 0 k x i k
Δpthe pressure differential, MPa
ζ i k the grey incidence coefficient
μothe viscosity, MPa/s
ρthe resolution coefficient, ρ = 0.5
φthe porosity, %
ϕ the Normalization of porosity

References

  1. Sun, L.D.; Zou, C.N.; Zhu, R.K.; Zhang, Y.H.; Zhang, S.C.; Zhang, B.M.; Zhu, G.Y.; Gao, Z.Y. Formation, distribution and potential of deep hydrocarbon resources in China. Pet. Explor. Dev. 2013, 40, 687–695. [Google Scholar] [CrossRef]
  2. Wang, M.; Guo, Z.Q.; Jiao, C.X.; Lu, S.F.; Li, J.B.; Xue, H.T.; Li, J.J.; Li, J.Q.; Chen, G.H. Exploration progress and geochemical features of lacustrine shale oils in China. Pet. Explor. Dev. 2019, 178, 975–986. [Google Scholar] [CrossRef]
  3. Dou, L.R.; Wen, Z.X.; Wang, J.J.; Wang, Z.M.; He, Z.J.; Liu, X.B.; Zhang, N.N. Analysis of the world oil and gas exploration situation in 2021. Pet. Explor. Dev. 2022, 49, 1195–1209. [Google Scholar] [CrossRef]
  4. Wen, Z.X.; Wang, J.J.; Wang, Z.M.; He, Z.J.; Song, C.P.; Liu, X.B.; Zhang, N.N.; Ji, T.Y. Analysis of the world deepwater oil and gas exploration situation. Pet. Explor. Dev. 2023, 50, 1060–1076. [Google Scholar] [CrossRef]
  5. Diwu, P.X.; Liu, T.J.; You, Z.J.; Jiang, B.Y.; Zhou, J. Effect of low velocity non-Darcy flow on pressure response in shale and tight oil reservoirs. Fuel 2018, 216, 398–406. [Google Scholar] [CrossRef]
  6. Sun, L.D.; Fang, C.L.; Li, F.; Zhu, R.K.; He, D.B. Petroleum exploration and development practices of sedimentary basins in China and research progress of sedimentology. Pet. Explor. Dev. 2010, 37, 385–396. [Google Scholar] [CrossRef]
  7. Zhu, G.Y.; Jiang, H.; Huang, S.P.; Ma, D.B.; Zhang, M.; Chen, W.Y.; Guan, S.W.; Fan, J.J.; Zeng, F.Y. New progress of marine hydrocarbon accumulation theory and prediction of super large oil and gas areas in China. Acta Petrolei Sin. 2023, 1–25. Available online: http://kns.cnki.net/kcms/detail/11.2128.TE.20230625.1736.002.html (accessed on 18 July 2024).
  8. Ding, X.; Zhang, F.; Zhang, G.Q. Modelling of time-dependent proppant embedment and its influence on tight gas production. J. Nat. Gas Sci. Eng. 2020, 82, 103519. [Google Scholar] [CrossRef]
  9. Jia, C.Z.; Zheng, M.; Zhang, Y.F. Unconventional hydrocarbon resources in China and the prospect of exploration and development. Pet. Explor. Dev. 2012, 39, 139–146. [Google Scholar] [CrossRef]
  10. Liu, Z.P.; Qin, M.; Zhang, J.G.; Li, Z.; Song, P. Mechanism and Adaptability Evaluation of Well Soaking in Tight Reservoir. Chem. Technol. Fuels Oils 2022, 58, 181–184. [Google Scholar] [CrossRef]
  11. Ma, X.; Liu, Z. Predicting the oil production using the novel multivariate nonlinear model based on Arps decline model and kernel method. Neural Comput. Appl. 2018, 29, 579–591. [Google Scholar] [CrossRef]
  12. Zhao, Z.F.; Tang, M.R.; Du, X.F.; An, J.; Cai, M.Y.; Su, Y.L.; Wang, W.D. Factors affecting rate transient of fractured horizontal well in tight oil reservoir-Erdos Basin Changqing tight oil. J. Shenzhen Univ. (Sci. Eng.) 2017, 34, 647–654. [Google Scholar] [CrossRef]
  13. Hu, X.L.; Wang, J.; Pan, L. Influencing factors and prediction methods for production of tight oil reservoir in Pingbei Oilfield. Xinjiang Pet. Geol. 2022, 43, 346–353. [Google Scholar]
  14. Wang, X.H.; Gao, Y.W.; Li, G.L.; Yang, L.; Wu, W.; Zhang, W.; Zhou, J.F. Main controlling factors and productivity prediction of dual-porosity medium reservoirs in Dongdaohaizi Sag. Sci. Technol. Eng. 2023, 23, 14174–14182. [Google Scholar]
  15. Hu, J.H.; Zhang, C.; Rui, Z.H.; Yu, Y.L.; Chen, Z.X. Fractured horizontal well productivity prediction in tight oil reservoirs. J. Pet. Sci. Eng. 2017, 151, 159–168. [Google Scholar] [CrossRef]
  16. Wu, L.H.; Guo, X.Z.; Luo, W.; Zhang, Z.M.; Zhang, W.C. Influence factors controlling the productivity of horizontal well by volume fracturing in tight oil reservoirs-a case of dense oil horizontal well in Damintun, Liaohe Oilfield. Unconv. Oil Gas 2018, 5, 56–62. [Google Scholar]
  17. Zhu, W.Y.; Liu, Y.F.; Li, Z.X.; Yue, M.; Kong, D.B. Mathematical model of multi-scale flow in tight oil reservoirs and analysis of influential factors. J. Cent. South Univ. (Sci. Technol.) 2022, 53, 2347–2360. [Google Scholar]
  18. Li, J.T.; Zhou, X.F.; Gayubov, A.; Shamil, S. Study on production performance characteristics of horizontal wells in low permeability and tight oil reservoirs. Energy 2023, 284, 129286. [Google Scholar] [CrossRef]
  19. Xu, C.Y.; Yang, X.L.; Liu, C.; Kang, Y.L.; Bai, Y.R.; You, Z.J. Dynamic fracture width prediction for lost circulation control and formation damage prevention in ultra-deep fractured tight reservoir. Fuel 2022, 307, 121770. [Google Scholar] [CrossRef]
  20. Xu, C.Y.; Liu, L.; Yang, Y.; Kang, Y.L.; You, Z.J. An innovative fracture plugging evaluation method for drill-in fluid loss control and formation damage prevention in deep fractured tight reservoirs. Fuel 2024, 358, 130123. [Google Scholar] [CrossRef]
  21. Panja, P.; Milind, D. Factors that control condensate production from shales: Surrogate reservoir models and uncertainty analysis. SPE Res. Eval. Eng. 2016, 19, 130–141. [Google Scholar] [CrossRef]
  22. Hu, B.; Pu, J.; Li, C. Experimental investigation on the influence factors of primary production performance of tight oil. Pet. Sci. Technol. 2022, 40, 2179–2192. [Google Scholar] [CrossRef]
  23. Li, Y.M.; Huang, Y.T.; Ma, H.W.; Chang, C.; Xie, W.Y. Study on the development options of tight sandstone oil reservoirs and their influencing factors. Front. Energy Res. 2022, 10, 1007224. [Google Scholar] [CrossRef]
  24. Hu, T.H.; Wang, C.J.; Chen, L.Y.; Zheng, S.Y.; Lian, Z.X.; Wang, M.Y. Research and application of fitting model of specific productivity index in heavy oil reservoir. Pet. Reserv. Eval. Dev. 2017, 7, 50–54. [Google Scholar]
  25. Li, N.; Wang, K.W.; Zhang, G.; Wu, H.L.; Zhao, L.Z.; Wu, L.H.; Feng, Q.F.; Feng, Z. Prediction of gas production in carbonates based on CT analysis and nuclear magnetic resonance (NMR) logging. Pet. Explor. Dev. 2015, 42, 167–174. [Google Scholar] [CrossRef]
  26. Gao, Q.Y.; Shang, S.G.; Wang, J.; Gao, K.C.; Ma, J.X.; Zhang, Z.; Zhang, G.B. New method for productivity prediction of paleogene middle-deep sandstone reservoir in Bohai Sea area. Prog. Geophys. 2024, 1–13. Available online: http://kns.cnki.net/kcms/detail/11.2982.P.20240611.1309.035.html (accessed on 18 July 2024).
  27. Lu, C.H.; Jiang, H.Q.; Yang, J.L.; Wang, Z.Q.; Zhang, M.; Li, J.J. Shale oil production prediction and fracturing optimization based on machine learning. J. Pet. Sci. Eng. 2022, 217, 110900. [Google Scholar] [CrossRef]
  28. Tong, S.K.; Wang, F.Y.; Gao, H.H.; Zhu, W.Y. A machine learning-based method for analyzing factors influencing production capacity and production forecasting in fractured tight oil reservoirs. Int. J. Hydrogen Energy 2024, 70, 136–145. [Google Scholar] [CrossRef]
  29. Luo, W.J.; Wang, X.D.; Tang, C.F.; Feng, Y.; Shi, E.X. Productivity of multiple fractures in a closed rectangular reservoir. J. Pet. Sci. Eng. 2017, 157, 232–247. [Google Scholar] [CrossRef]
  30. Li, K.W.; Chen, Z.W. Computation of productivity index with capillary pressure included and its application in interpreting production data from low-permeability oil reservoirs. SPE J. 2012, 17, 1041–1046. [Google Scholar] [CrossRef]
  31. Luo, W.J.; Wang, X.D.; Feng, Y.; Tang, C.F.; Zhou, Y.F. Productivity analysis for a vertically fractured well under non-Darcy flow condition. J. Pet. Sci. Eng. 2016, 146, 714–725. [Google Scholar] [CrossRef]
  32. Aulisa, E.; Ibragimov, A.; Walton, J.R. A new method for evaluating the productivity index of nonlinear flows. SPE J. 2009, 14, 693–706. [Google Scholar] [CrossRef]
  33. Wang, Y.P.; Luo, T.; Gao, Y.; Yu, S.; Wang, S.B.; Zou, Y.R. Pearson correlation analysis of factors controlling the high abundance of rearranged hopanes in crude oils from the Southwest Depression of the Tarim Basin, China. Geochem. J. 2020, 54, 105–115. [Google Scholar] [CrossRef]
  34. Tian, F.C.; Fu, Y.Q.; Liu, X.W.; Li, D.P.; Jia, Y.P.; Shao, L.F.; Yang, L.Y.; Zhao, Y.D.; Zhao, T.; Yin, Q.W. A Comprehensive Evaluation of Shale Oil Reservoir Quality. Processes 2024, 12, 472. [Google Scholar] [CrossRef]
  35. Van Aert, R.C.M.; Goose, C. A critical reflection on computing the sampling variance of the partial correlation coefficient. Res. Synth. Methods 2023, 14, 520–525. [Google Scholar] [CrossRef]
  36. Gao, X.C.; Guo, K.L.; Chen, P.; Yang, H.R.; Zhu, G.W. A productivity prediction method for multi-fractured horizontal wells in tight oil reservoirs considering fracture closure. J. Pet. Explor. Prod. Technol. 2023, 13, 865–876. [Google Scholar] [CrossRef]
  37. Li, Y.M.; You, X.Y.; Zhao, J.Z.; Pu, X. Production forecast of a multistage fractured horizontal well by an analytical method in shale gas reservoir. Environ. Earth Sci. 2019, 78, 272. [Google Scholar] [CrossRef]
  38. Wu, C.F.; Liu, X.L.; Zhou, Q.Z.; Zhang, X.Y. Analysis of key factors and prediction of gas production pressure of coalbed methane well: Combining grey relational with principal component regression analysis. Energy Explor. Exploit. 2019, 37, 1348–1363. [Google Scholar] [CrossRef]
  39. Yang, Z.D.; Li, Z.J.; Liang, H.P.; Zhang, R. Preferred Seepage Channel Identification Based on Multifactorial Gray Correlation Analysis. Chem. Technol. Fuels Oils 2018, 54, 625–631. [Google Scholar] [CrossRef]
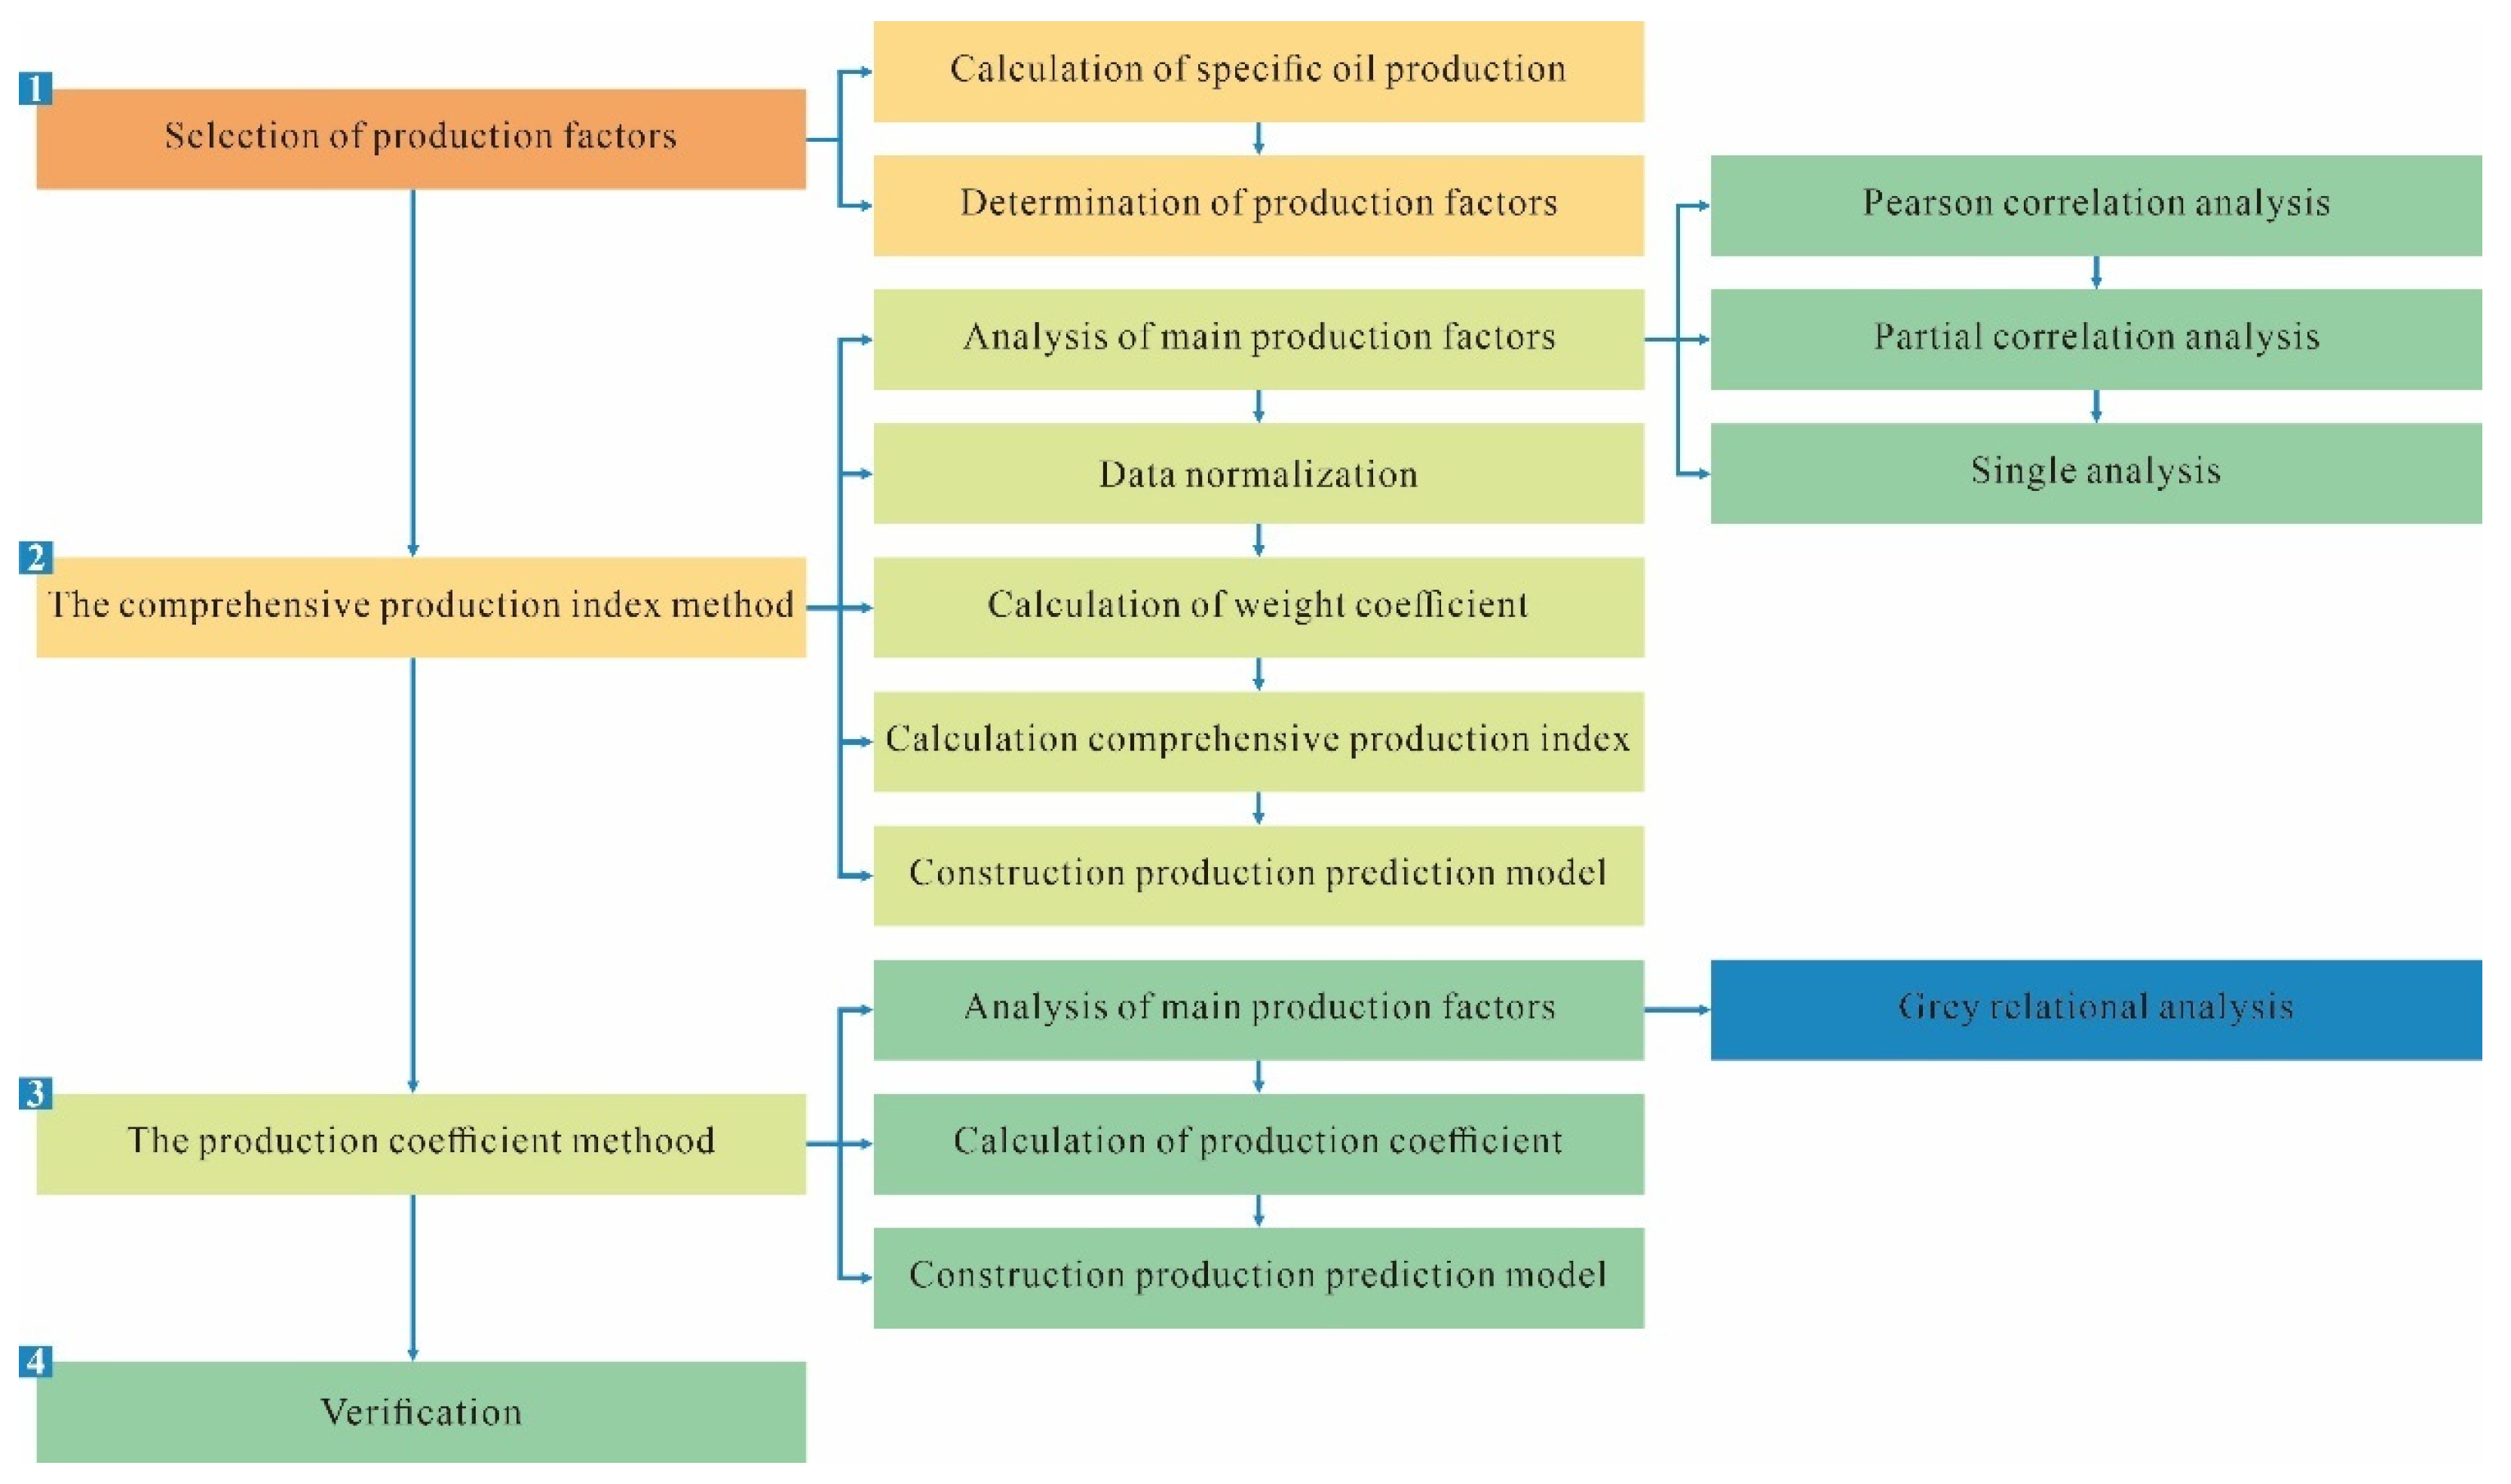
Figure 1. Framework of the research topic.
Processes 12 01922 g001
Figure 2. The process of constructing the comprehensive production index model.
Processes 12 01922 g002
Figure 3. The Pearson correlation analysis of the production factors in the L Formation of the Beibu Basin. (a) Heat map of Pearson correlations among production factors; (b) The ranking of the production factors based on the Pearson correlation analysis.
Processes 12 01922 g003
Figure 4. The partial correlation analysis of the production factors in the L Formation of the Beibu Basin. (a) Heat map of partial correlation coefficient among production factors; (b) The ranking of the production factors based on the partial correlation analysis.
Processes 12 01922 g004
Figure 5. The production factors and the specific oil production index correlation analysis in the L Formation of the Beibu Basin. (a) The effective permeability and specific oil production index correlation analysis; (b) The porosity and specific oil production index correlation analysis; (c) The oil saturation and specific oil production index correlation analysis.
Processes 12 01922 g005
Figure 6. The comprehensive production index and specific oil production index correlation analysis in the L Formation of the Beibu Basin.
Processes 12 01922 g006
Figure 7. The production coefficient and specific oil production index correlation analysis in the L Formation of the Beibu Basin.
Processes 12 01922 g007
Figure 8. The production prediction results of two methods for two verification wells in the L Formation of the Beibu Basin.
Processes 12 01922 g008
Table 1. The production index and the specific oil production index for fifteen wells in the L Formation of the Beibu Basin.
WellTestDepthFormationJoJos
No.No.mm3/d/MPam3/d/MPa
W-1DST 13127.0–3169.5L319.6010.513
W-2DST 13070.7–3094.6L31.1090.087
W-3DST 13181.8–3225.0L30.2940.020
W-4DST 13125.8–3179.7L34.8450.697
W-5DST 13031.0–3049.0L21.3700.469
W-6DST 13288.6–3354.7L31.2380.073
W-7DST 13104.0–3270.0L31.1340.030
W-8DST 12971.0–3031.0L30.2200.009
W-9DST 13161.0–3180.0L10.2350.017
W-10DST 12968.0–2980.0L11.3090.113
W-11DST 13111.0–3365.5L12.2940.203
W-12DST 12880.0–2897.0L116.7591.180
W-13DST 12211.0–2221.5L311.0882.704
W-14DST 12043.0–2064.0L265.7818.121
W-15DST 13314.0–3323.0L20.2240.051
Table 2. The production factors in the L Formation of the Beibu Basin.
WellPRKoφμoSHSoSrwJos
No.MPamD%MPa/s%%fmm3/d/MPa
W-138.83627.20014.0602.52012.70064.2500.4480.07850.513
W-238.0455.26015.6602.5208.80062.9300.2300.07850.087
W-338.0511.75016.0003.61611.00045.7000.6040.1080.020
W-445.02514.83019.0001.00019.90056.700−0.9700.1080.697
W-547.2700.96012.7101.00018.90042.900−0.9700.1080.469
W-633.90820.90012.0000.3005.10045.000−0.9900.07850.073
W-733.22418.30012.0000.30013.60045.000−0.9900.07850.030
W-832.5850.04712.1000.3016.30044.150−0.9930.07850.009
W-949.2100.06311.3800.58514.20061.060−1.9900.07850.017
W-1028.7582.36012.5000.8285.40036.4003.0800.07850.113
W-1150.9304.10013.2701.19510.70055.6701.5800.1080.203
W-1228.62078.70014.3002.16110.20057.6901.7400.110251.180
W-1321.15078.20018.4601.26718.80058.5500.1270.078562.704
W-1421.146140.00021.3600.52619.00073.7103.7500.078568.121
W-1555.6654.10018.6001.18419.50067.3005.5000.07850.051
Table 3. The relationship model and correlation coefficient between the production factors and the specific oil production index in the L Formation of the Beibu Basin.
No.Production FactorRelationship ModelR2
1Effective permeabilityJos = 0.047Ko − 0.29170.827
2PorosityJos = 0.4504φ − 5.75570.451
3Oil saturationJos = 0.1066So − 4.85210.293
Table 4. Normalization of main production factors.
No.WellTestKoφ’So
No.No.fff
1W-1DST 10.194 0.269 0.746
2W-2DST 10.037 0.429 0.711
3W-3DST 10.012 0.463 0.249
4W-4DST 10.106 0.764 0.544
5W-5DST 10.007 0.133 0.174
6W-6DST 10.149 0.062 0.231
7W-7DST 10.130 0.062 0.231
8W-8DST 10.000 0.072 0.208
9W-9DST 10.000 0.000 0.661
10W-10DST 10.017 0.112 0.000
11W-11DST 10.029 0.189 0.516
12W-12DST 10.562 0.293 0.571
13W-13DST 10.558 0.709 0.594
14W-14DST 11.000 1.000 1.000
15W-15DST 10.029 0.723 0.828
Table 5. The weight coefficients of the main production factors in the L Formation of the Beibu Basin.
No.Production FactorR2The Sum of R2aThe Sum of a
1Effective permeability0.8271.5710.5261.000
2Porosity0.4510.287
3Oil saturation0.2930.187
Table 6. Ranking of production factors based on grey relational analysis.
Production FactorGrey Correlation DegreeRank
Effective permeability0.9081
Shale content0.8152
Porosity0.8143
Viscosity0.8134
Oil saturation0.8125
Well radius0.8066
Original formation pressure0.7847
Skin coefficient0.6848
Table 7. The result of the production coefficient in the L Formation of the Beibu Basin.
WellTestFormationKoφSHFpJos
No.No.mD%%m3/d/MPa
W-1DST 1L327.200 14.060 12.700 4856.886 0.513
W-2DST 1L35.260 15.660 8.800 724.870 0.087
W-3DST 1L31.750 16.000 11.000 308.000 0.020
W-4DST 1L314.830 19.000 19.900 5607.223 0.697
W-5DST 1L20.960 12.710 18.900 230.610 0.469
W-6DST 1L320.900 12.000 5.100 1279.080 0.073
W-7DST 1L318.300 12.000 13.600 2986.560 0.030
W-8DST 1L30.047 12.100 6.300 3.598 0.009
W-9DST 1L10.063 11.380 14.200 10.229 0.017
W-10DST 1L12.360 12.500 5.400 159.300 0.113
W-11DST 1L14.100 13.270 10.700 582.155 0.203
W-12DST 1L178.700 14.300 10.200 11,479.182 1.180
W-13DST 1L378.200 18.460 18.800 27,139.154 2.704
W-14DST 1L2140.000 21.360 19.000 56,817.600 8.121
W-15DST 1L24.100 18.600 19.500 1487.070 0.051
Table 8. The main production factors for two verification wells in the L Formation of the Beibu Basin.
No.WellTestFormationKoφSoSHJos
No.No.mD%%%m3/d/MPa
1Y-1DST 1L22.16016.84059.78218.2000.673
2Y-2DST 1L350.0420.34058.27020.8002.654
Table 9. The production prediction results of the comprehensive production index model for two verification wells in the L Formation of the Beibu Basin.
WellKoφ’SoFoPrediction JosActual JosRelative Error
No.ffffm3/d/MPam3/d/MPa%
Y-10.0150.5470.6270.2820.8890.67332.200
Y-20.3570.8980.5860.5552.8832.6548.600
Table 10. The production prediction results of the production coefficient model for two verification wells in the L Formation of the Beibu Basin.
WellKoφSHFpPrediction JosActual JosRelative Error
No.mD%%fm3/d/MPam3/d/MPa%
Y-12.1616.8418.2662.0140.139 0.67379.410
Y-250.0420.3420.821,170.5231.111 2.65458.147
Disclaimer/Publisher’s Note: The statements, opinions and data contained in all publications are solely those of the individual author(s) and contributor(s) and not of MDPI and/or the editor(s). MDPI and/or the editor(s) disclaim responsibility for any injury to people or property resulting from any ideas, methods, instructions or products referred to in the content.