Article

Re-Calibrating the Mercury-Intrusion-Porosimetry-Measured Pore Size Distribution of Coals: A Novel Method for Calculating the Matrix Compression Coefficient

1
Jiangsu Key Laboratory of Coal-Based Greenhouse Gas Control and Utilization, China University of Mining and Technology, Xuzhou 221108, China
2
Carbon Neutrality Institute, China University of Mining and Technology, Xuzhou 221008, China
3
School of Resources and Geosciences, China University of Mining and Technology, Xuzhou 221116, China
4
Jiangsu Bureau of Coal Geology, Nanjing 210046, China
5
China Coal Changjiang Geology Group, Nanjing 210046, China
*
Authors to whom correspondence should be addressed.
Processes 2024, 12(9), 1928; https://doi.org/10.3390/pr12091928
Submission received: 4 August 2024 / Revised: 28 August 2024 / Accepted: 5 September 2024 / Published: 8 September 2024

Abstract

:
Accurate measurement of the pore size distribution (PSD) in coals is crucial for guiding subsequent coalbed methane (CBM) engineering practice. Currently, mercury intrusion porosimetry (MIP) measurement has been widely used as a PSD testing method due to its effectiveness and convenience. Nevertheless, it is worth noting that the elevated pressure during the MIP experiments can lead to matrix compressibility, potentially causing inaccurate estimations of PSD in coals. Therefore, correction methods are used to modify the PSD in the high-pressure segment to improve the accuracy of MIP data. This study proposed a novel method with higher accuracy and convenience for calculating the matrix compressibility coefficient compared to the traditional calculation methods. Firstly, the matrix compressibility coefficients of six coal samples were calculated by using low-temperature nitrogen adsorption (LTNA) data. Subsequently, by utilizing the mathematical correlation between Kc (the compressibility coefficient of the coal matrix) and Ro,max (the maximum vitrinite reflectance) from prior research, a novel statistical method was designed to determine the matrix compressibility coefficient of the samples. Finally, the statistical matrix compressibility coefficient determination method was used to examine the fractal characteristics of the actual PSD. The results indicate that when the pressure exceeds 24 MPa, the volume obtained from mercury intrusion exceeds the pore volume measurement. The Kc calculated using the traditional correction method is in the range of 0.876–1.184 × 10⁻¹⁰ m2/N, while the Kc values of our proposed statistical correction method range from 0.898 × 10⁻¹⁰ to 1.233 × 10⁻¹⁰ m2/N, with a comparison error rate of ~0.11–5.25%. The MIP data greater than 24 MPa were effectively corrected using the statistical correction method, thus reducing the mercury intrusion volume error by 91.75–96.40%. Additionally, the corrected pore fractal dimension (D2) values fall within the range of 2.792 to 2.975, which are closer to the actual values than the pore fractal dimension range of 3.186 to 3.339.

1. Introduction

The commercial production of coalbed methane (CBM) truly began after the 1970s. The United States was one of the first countries to commercialize CBM production, experiencing a progression from experimental stages to large-scale commercialization, with its CBM production rapidly increasing, making it a global leader in bed methane development. Other countries, such as Australia, China, and Canada, have also started large-scale development of CBM resources. Currently, the global CBM industry has reached a particular scale, becoming an essential supplement to the natural gas supply [1]. During the extraction of CBM, the pore size distribution (PSD) of coal reservoirs and their variations are vital for the permeation and retention of CBM [2,3,4,5]. Therefore, accurately characterizing the PSD is crucial for improving energy development efficiency. Understanding the PSD helps optimize extraction methods, improve gas recovery rates, and ensure the efficient utilization of coalbed methane resources.
Existing methods for characterizing coal PSD include both direct and indirect approaches [6,7,8,9,10,11]. Low-temperature gas adsorption measurements are only suitable for testing the PSD characteristics of smaller apertures [12,13,14]. Some image-testing techniques (e.g., scanning electron microscope and transmission electron microscope) can visually observe the exterior of pores through image processing, but the PSD data obtained are not representative [15,16]. MIP is a physical, analytical technique employed for the assessment of the pore structure within various materials. This technique measures parameters, such as pore size and distribution, by applying high pressure to force mercury into the material’s pores, and it is considered an important method for analyzing PSD [17,18,19,20,21].
Because of the coal matrix’s high compressibility [22,23,24,25], excessive pressure within the pores can cause the coal matrix to deform or even fracture. This deformation may lead to the mercury intrusion volume surpassing the actual pore volume. This inevitably affects the accuracy of the fractal dimension calculation for the coal PSD. Therefore, when using MIP and fractal dimensions to characterize PSD, it is imperative to comprehensively account for the compressive effects of the coal matrix and implement suitable correction measures to guarantee the precision and validity of the measurement results.
Previous studies have demonstrated that various factors influence the measured pore volumes in coals during MIP experiments. At medium- to high-pressure stages, the pore-filling mechanism and matrix-shrinkage effect directly controlled the determined PSD and other pore parameters [26]. Some researchers have determined the relationship between mercury intrusion pressure and coal deformation in a specific pressure range, using relevant methods to calculate the matrix compression coefficient in coals [27,28]. It has been recognized that the coal matrix compression effect becomes significant when the mercury intrusion pressure exceeds 10 MPa [29]. Jin et al. [30] analyzed the changing pattern of coal matrix pore characteristics with pressure based on coal matrix compressibility. After that, the complexity of pore structures was concisely described by using fractal theory. Liu et al. [31] considered the matrix-compression effect and analyzed its impact on pores of different size ranges. Han et al. [32] found that coal samples exhibit significant compressibility during MIP tests and that the pore volume decreases with increasing pressure. Zheng et al. [33] calculated the coal matrix compression coefficient and characterized its PSD by correcting it with fractal theory.
The degree of coal metamorphism is a significant factor affecting the compressibility of the coal matrix. The study by Guo et al. [34] indicates that when Ro,max (maximum vitrinite reflectance) is between 0.65 and 0.99%, the compressibility of the coal matrix shows a rapid decline. In contrast, when Ro,max is between 1.25 and 1.77%, the compressibility shows an increasing trend. Similarly, Ettinger and Zhupakhina’s [35] research also observed this trend and described it as a U-shaped relationship curve. Zheng et al. [33] found that as the degree of metamorphism evolves from medium to high, the compressibility of the coal matrix increases, and the vitrinite and inertinite groups have opposite effects on the compressibility of the coal matrix. Lu’s [36] research indicates that the coal matrix compressibility coefficient exhibits a three-stage change trend with the increase of Ro,max.
In summary, in previous studies on MIP data correction, traditional correction methods require extensive preparation, involve substantial calculations, and rely heavily on test data obtained through LTNA experiments. Without conducting LTNA experiments, MIP data correction cannot be performed. When assessing the impact of coal matrix compressibility on the permeability and porosity of coalbed methane reservoirs, such traditional correction methods result in low MIP data correction efficiency, higher experimental costs, and increased complexity. On the other hand, more studies have shown the relationship between the coal matrix compressibility coefficient (Kc) and the increase in Ro,max, but they have yet to consider utilizing this trend to calculate the coal matrix compressibility coefficient (Kc).
In response to the issues in previous MIP data correction studies, this research proposes a new MIP data correction method (the statistical correction method). The method is based on the coal matrix compressibility coefficient (Kc) and Ro,max values calculated in previous studies [9,17,33,37,38,39,40,41,42,43], fitting their mathematical relationship to calculate the matrix compressibility coefficient of coal samples and correcting the MIP data exceeding 24 MPa. This study further investigates the changes in pore fractal dimensions before and after correction, indirectly validating the accuracy of the proposed method. This method successfully depicts the three-stage variation trend of the matrix compressibility coefficient of coal samples with different degrees of metal as the maximum vitrinite reflectance increases, making it possible to determine the matrix compressibility coefficient based solely on the maximum vitrinite reflectance of coal samples. Therefore, this method simplifies the correction process during MIP data correction, eliminating the need for specialized low-temperature nitrogen adsorption (LTNA) experiments. Compared with traditional correction methods (based on LTNA data), this method significantly reduces experimental preparation and the computational workload, facilitating a deeper understanding and revealing the characteristics of coal pore size distribution, thus making it more practical. Introducing this method helps optimize the complex process of CBM reservoir evaluation, thereby enhancing its applicability.

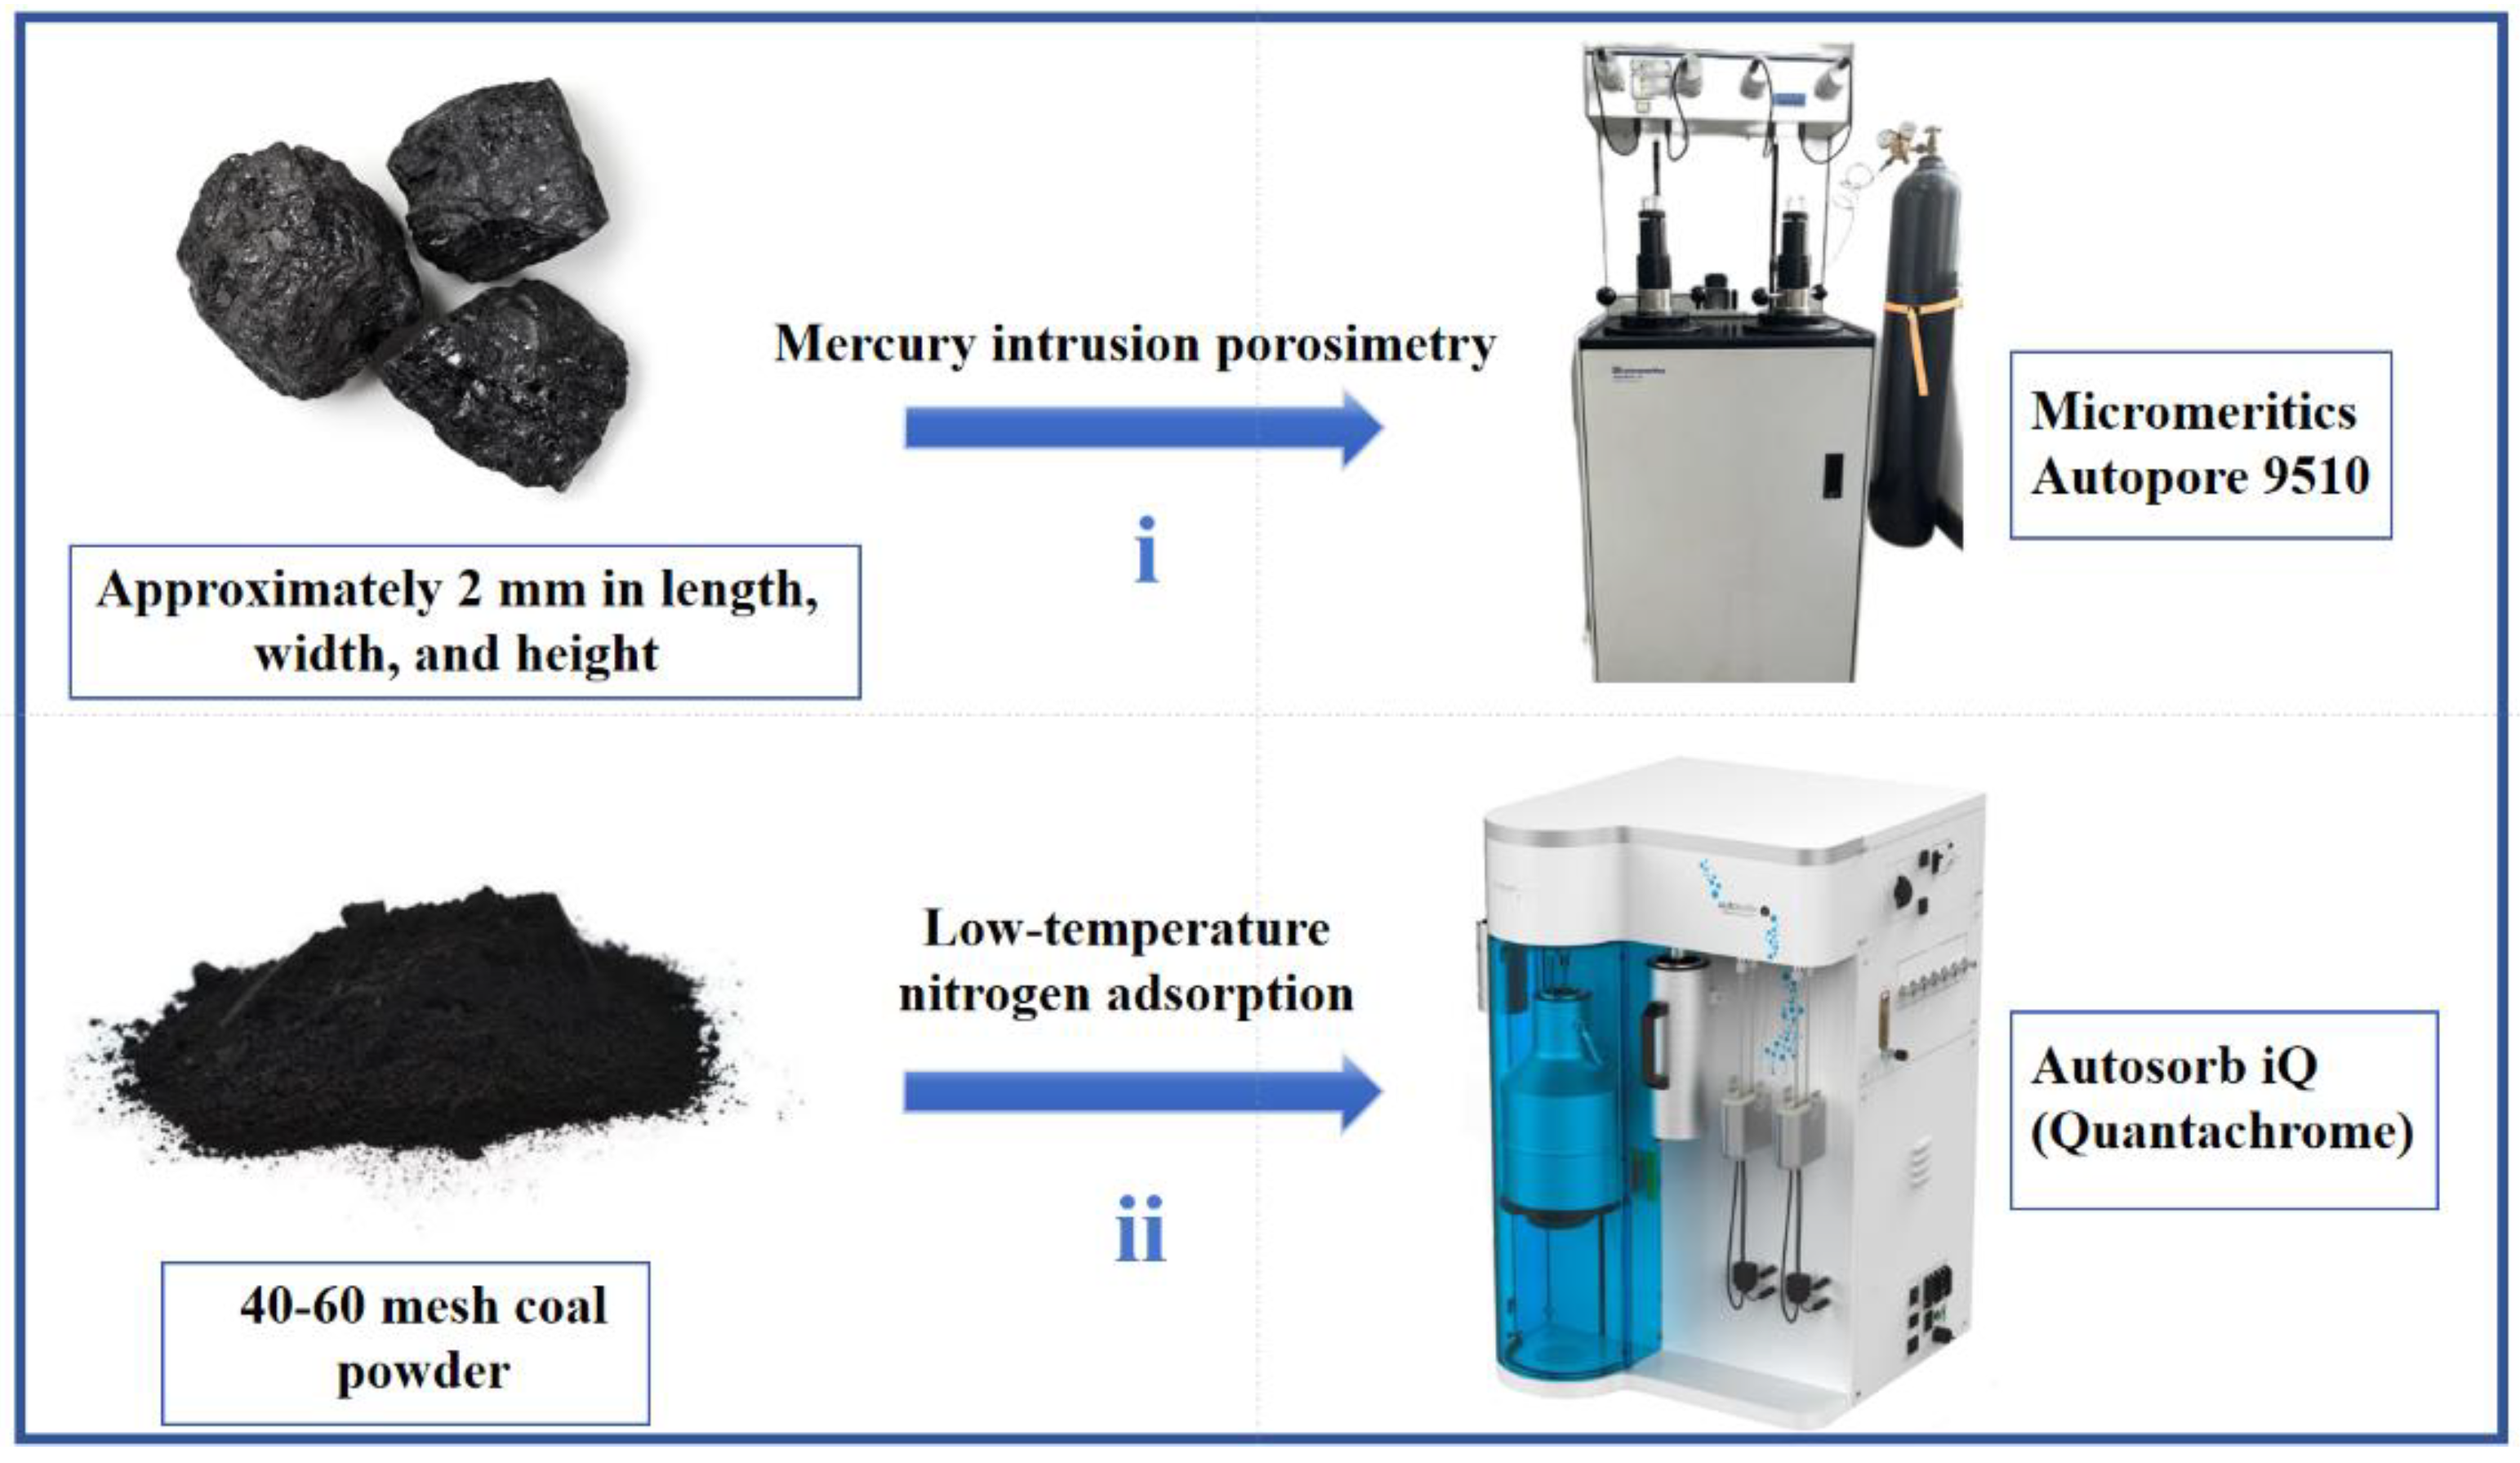
2. Samples and Experiments

The Qinshui Basin, located in northern China, is rich in coal resources and contains abundant natural gas and coalbed methane resources [44,45,46,47,48,49,50]. Significant progress has been made in developing CBM in this region in recent years. This experiment collected coal samples from six distinct mining areas (DD, QX, TL-2, TL-8, WK, and YY) within the southern Qinshui Basin. Among them, the DD and QX mines are located in the Zhengzhuang block, the TL-2 and TL-8 mines are in the Mabi block, and the WK and YY mines are in the Fanzhuang block (Figure 1). Samples were extracted from the working faces of underground mines to ensure freshness and integrity. The coal samples were wrapped in absorbent paper, sealed with adhesive tape, and placed in sealed bags before being promptly transported to the laboratory for MIP, LTNA, and maximum vitrinite reflectance testing.
The MIP measurements were performed using a Micromeritics Autopore 9510 instrument of the standard SY/T5346-2005 [51]. The sample dimensions were approximated in ~2 mm length, width, and height (Figure 2).
The LTNA test was performed using an Autosorb iQ (Quantachrome, FL, USA). After grinding, the coal powder was sieved with a 40–60 mesh sieve and dried in a vacuum oven at a constant temperature for 24 h before testing.

3. Results and Discussion

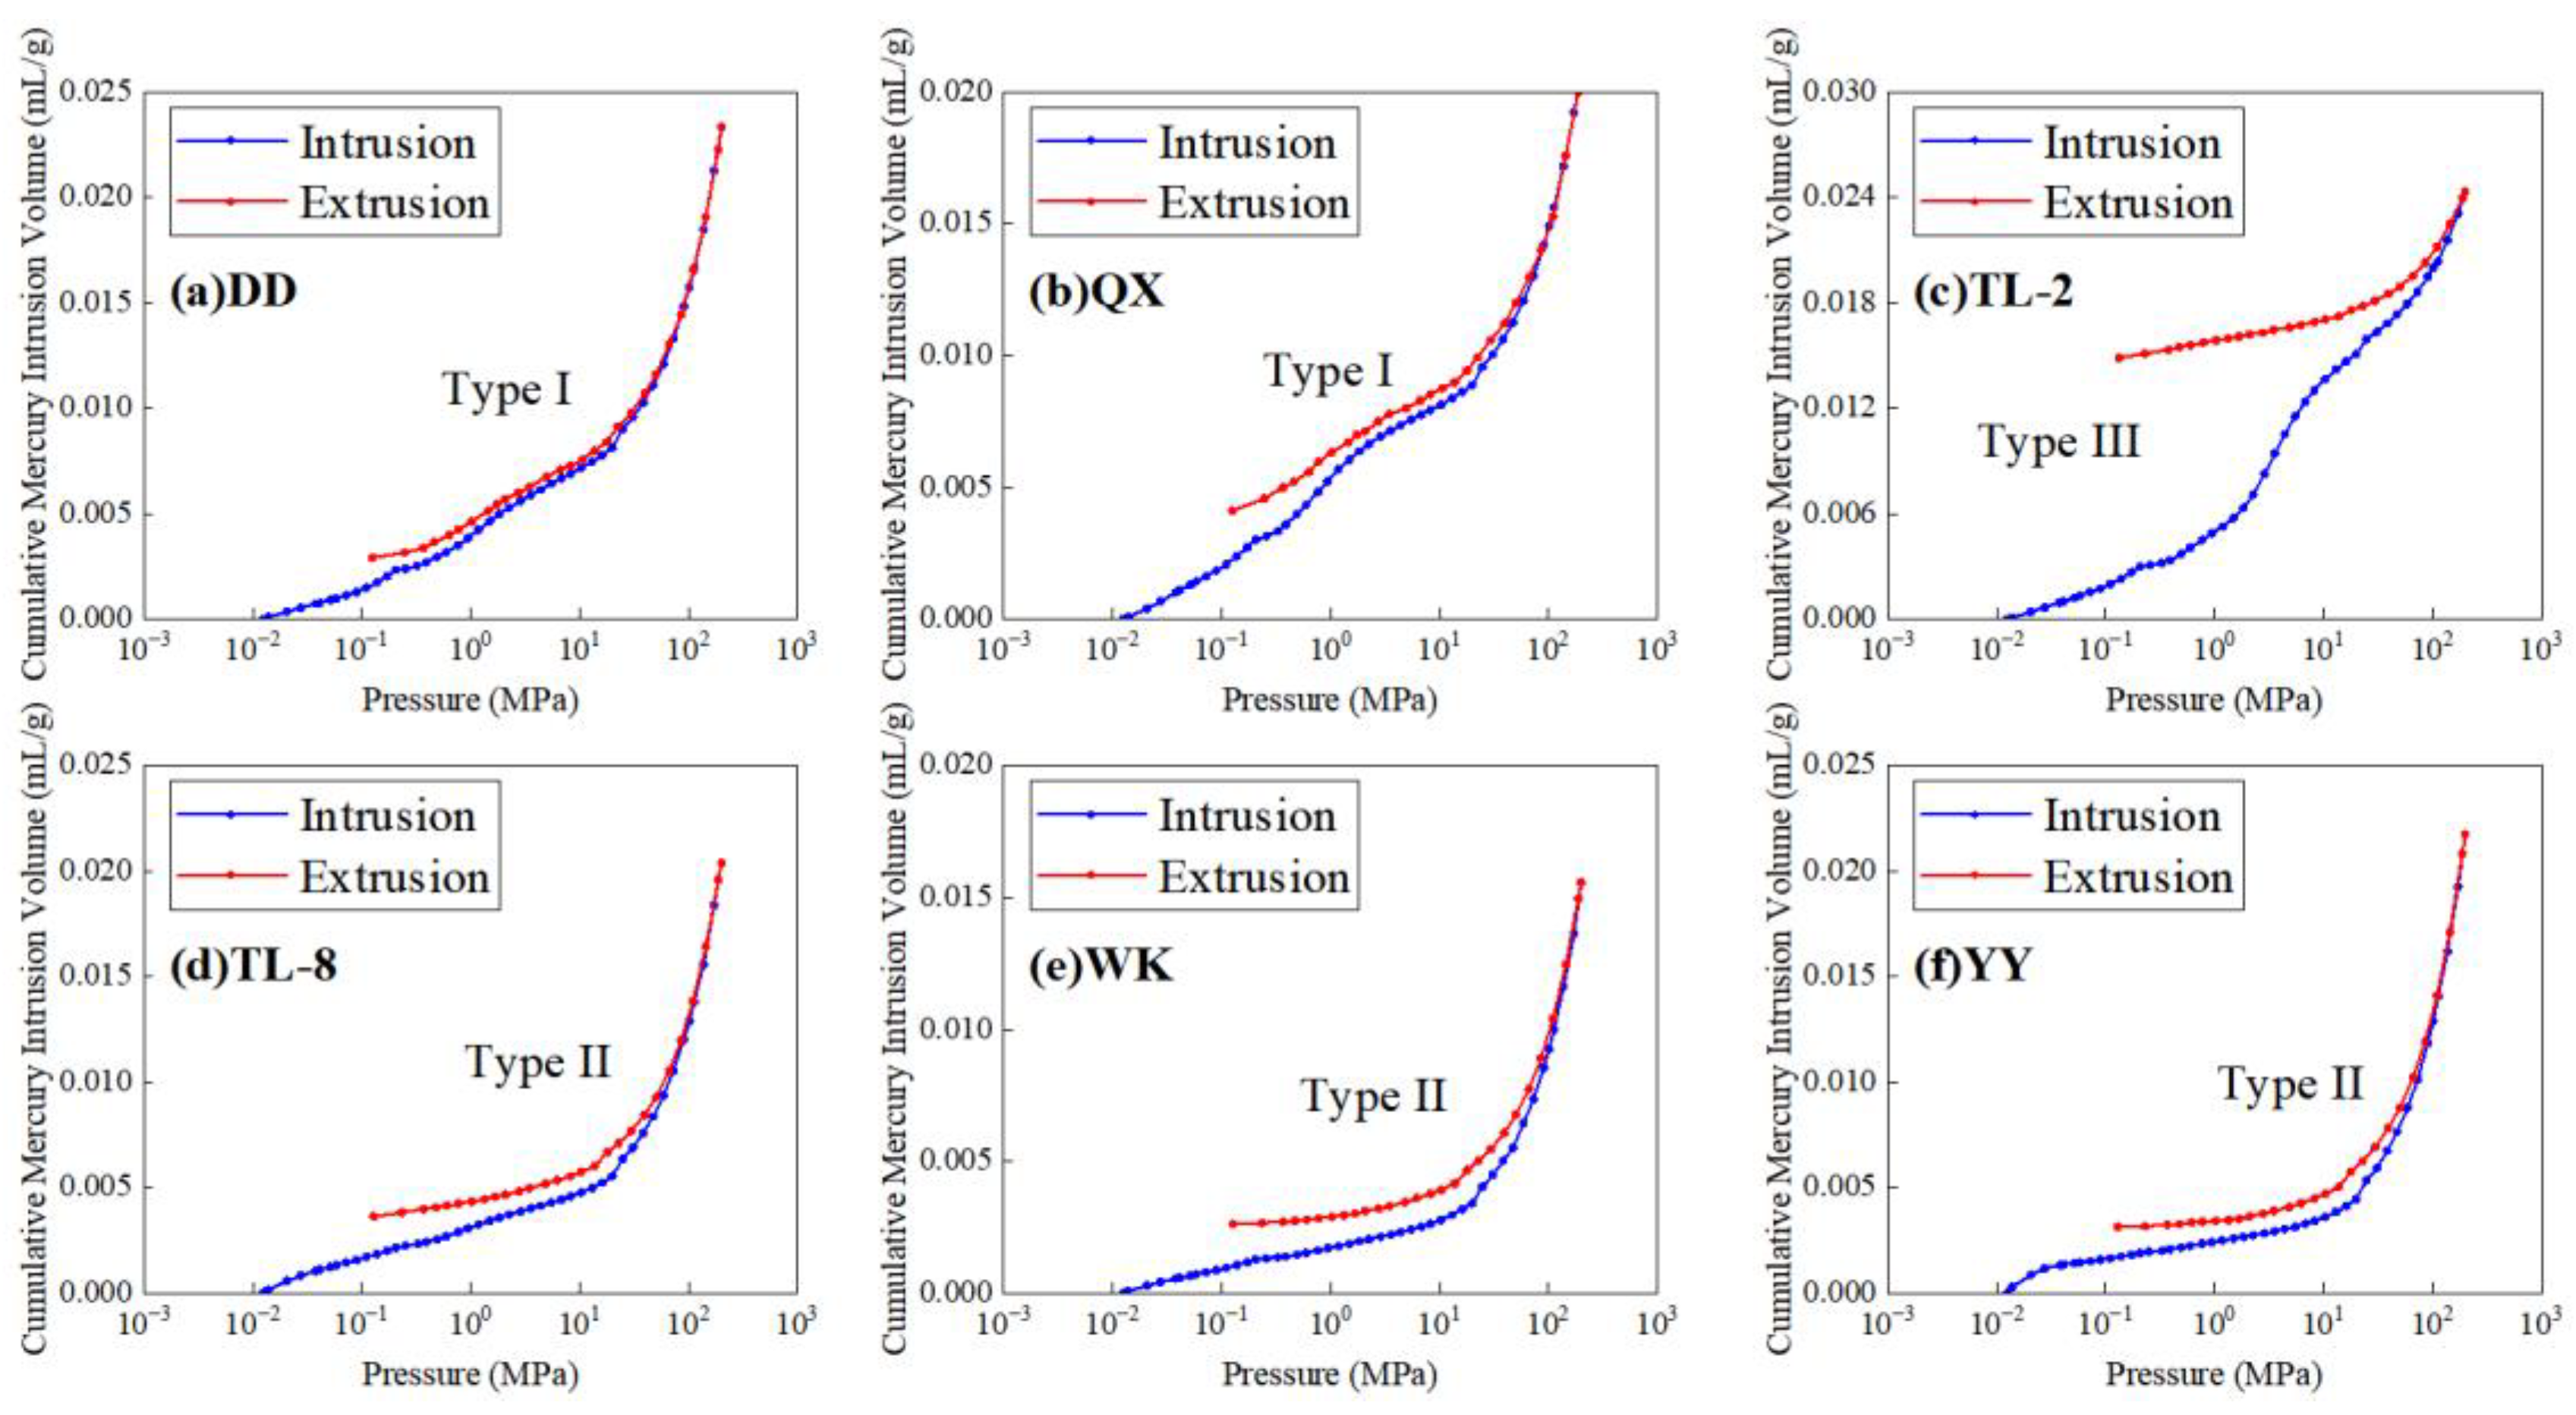
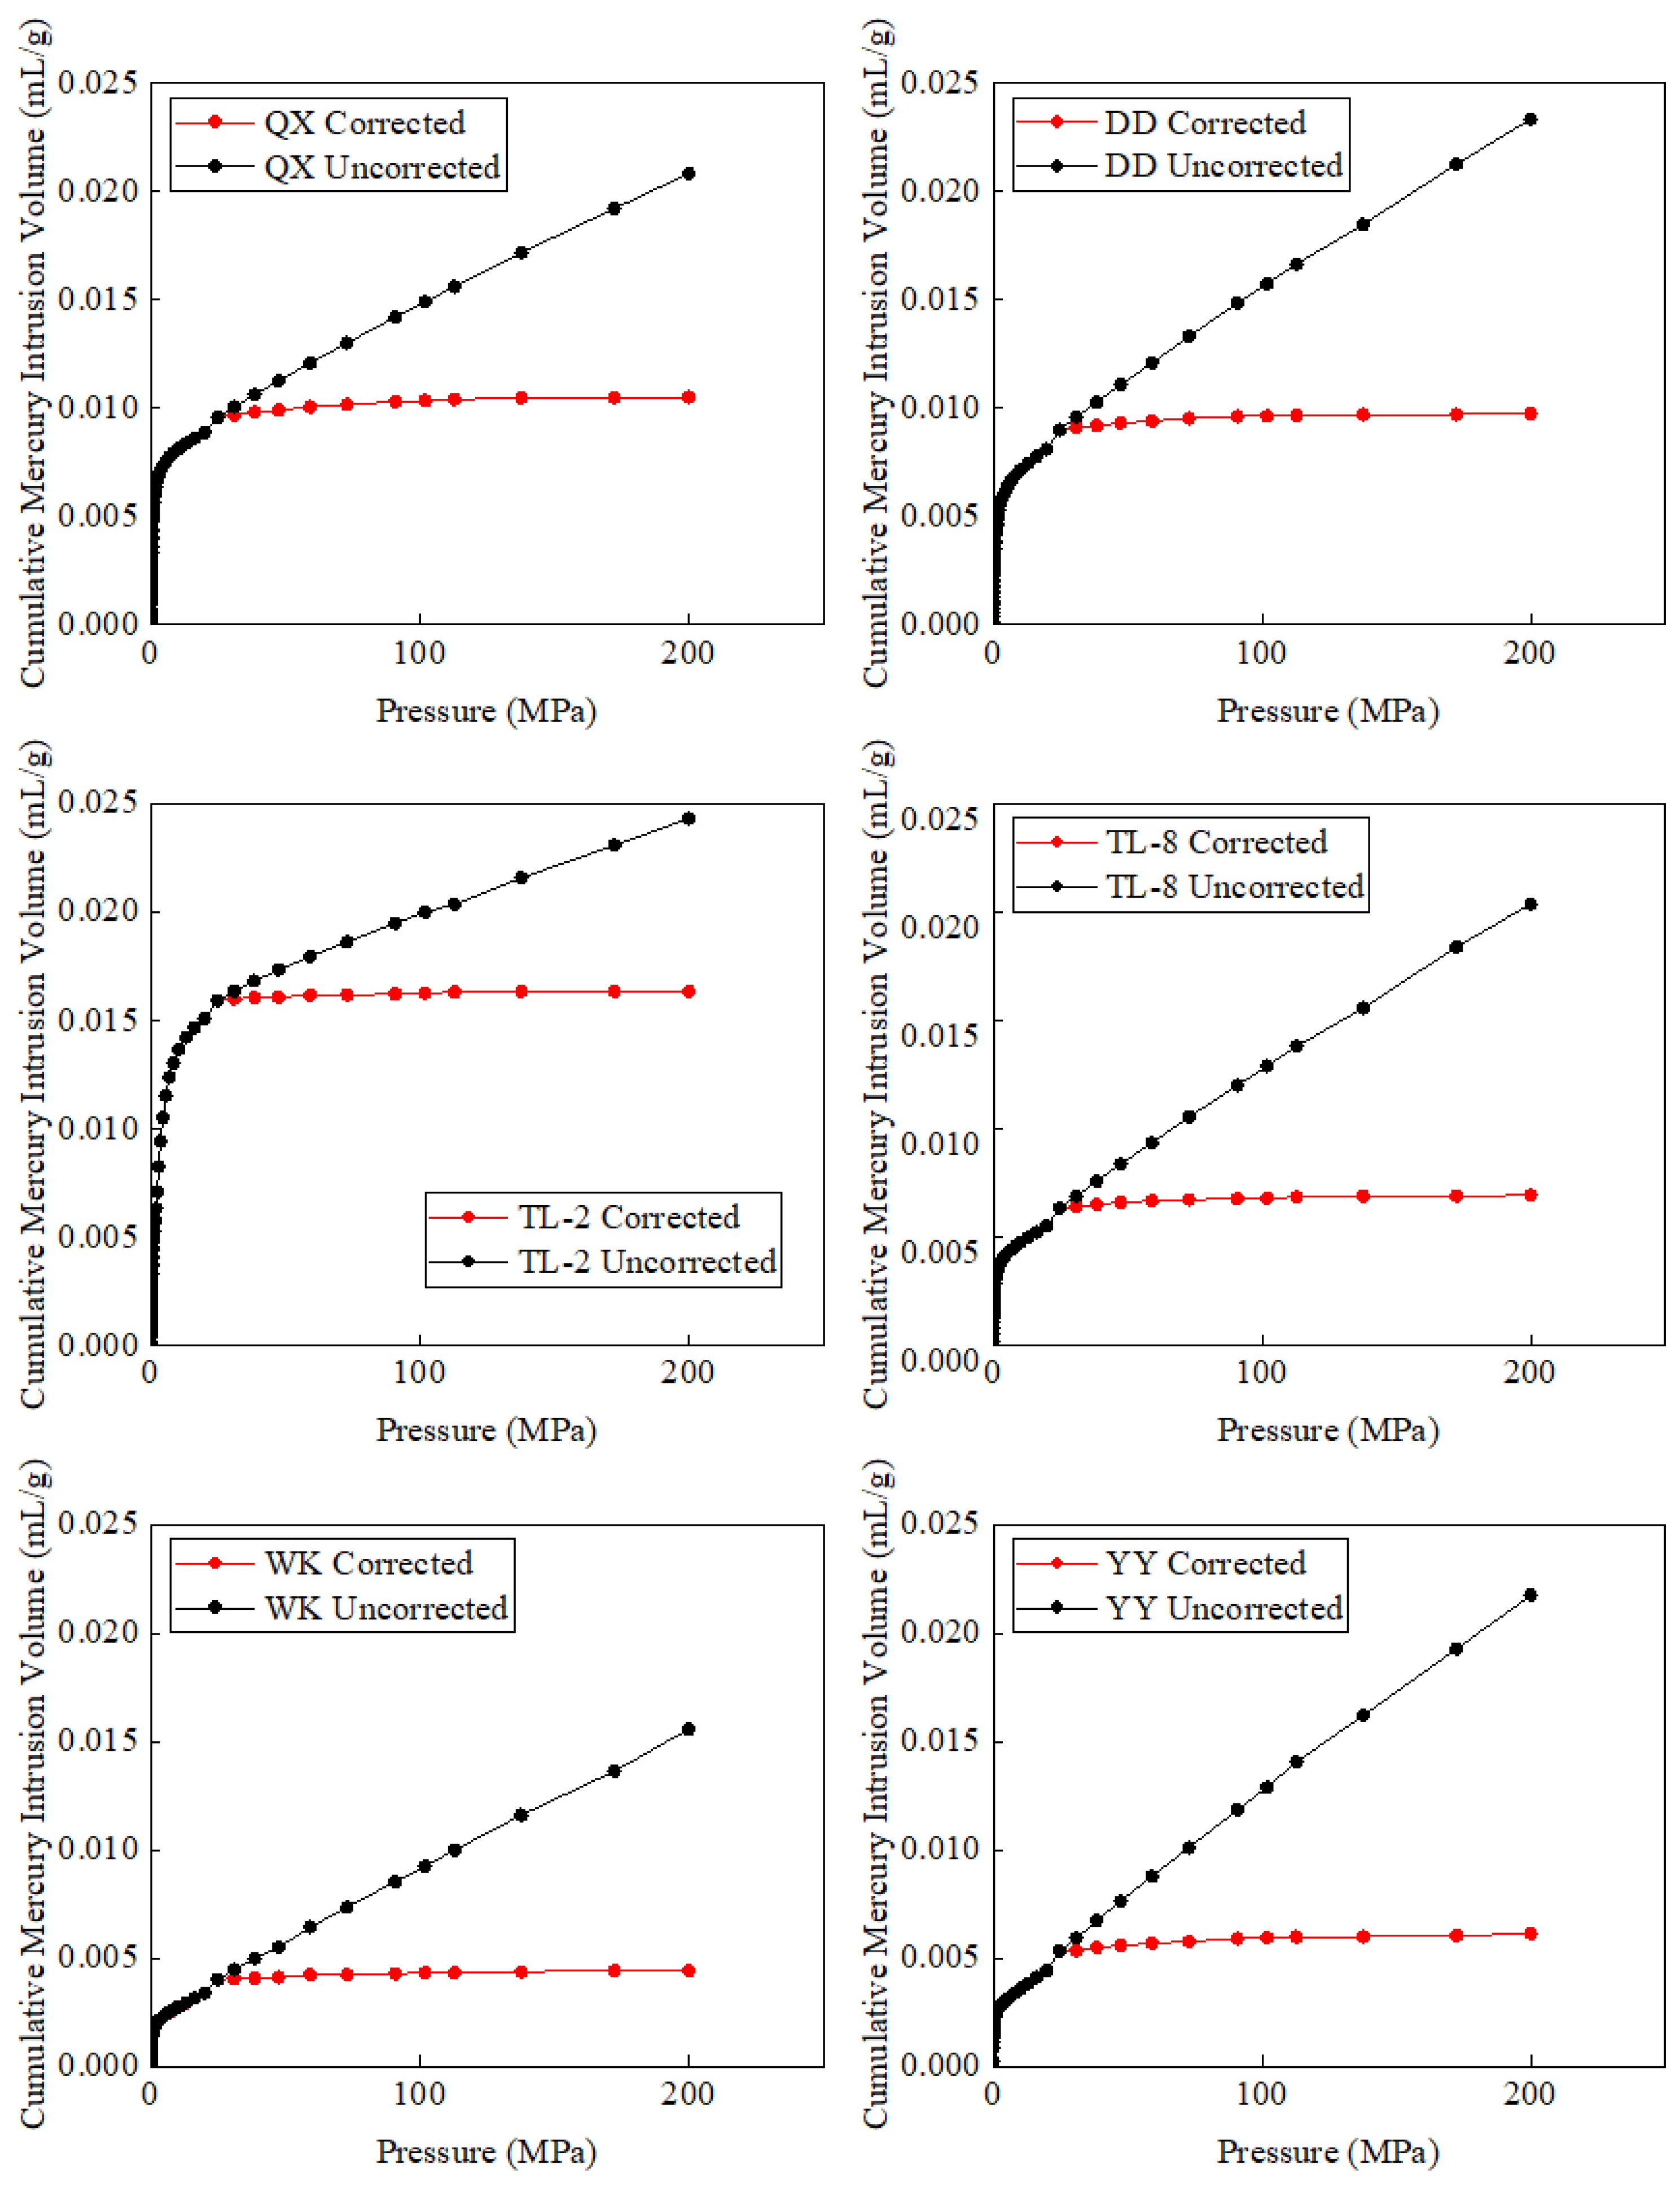
3.1. MIP Experimental Results

Various MIP experimental parameters offer insights into pore connectivity, development, and coal matrix compressibility from multiple perspectives. By analyzing MIP data from samples collected across different mining areas, mercury intrusion and extrusion curves, along with the PSDs, were obtained. The MIP curves of coal samples from six distinct mining areas could be categorized into three types (Figure 3). Type I (Samples DD and QX): the mercury intrusion and extrusion curves exhibit similar slopes with no significant hysteresis loop, indicating predominantly semi-open pores with poor connectivity, which is not conducive to gas flow. Type II (Samples TL-8, WK, and YY): the mercury intrusion and extrusion curves have similar slopes at high pressures but demonstrate hysteresis at low pressures, suggesting poor connectivity in the transitional pores segment and better connectivity in the more significant pore segment. Type III (Sample TL-2): the curve indicates that as the pressure increases, the mercury intrusion volume significantly rises at lower pressures, with a wide curve opening and evident hysteresis, indicating predominantly open pores with good connectivity, which is not favorable for gas storage. Notably, as the mercury intrusion pressure increases, all selected samples in this article show a significant increase trend in the cumulative mercury intrusion volume when the pressure exceeds ~10 MPa because of the coal matrix compressibility. Failure to account for this effect during data analysis may result in overestimating the number of micropores.

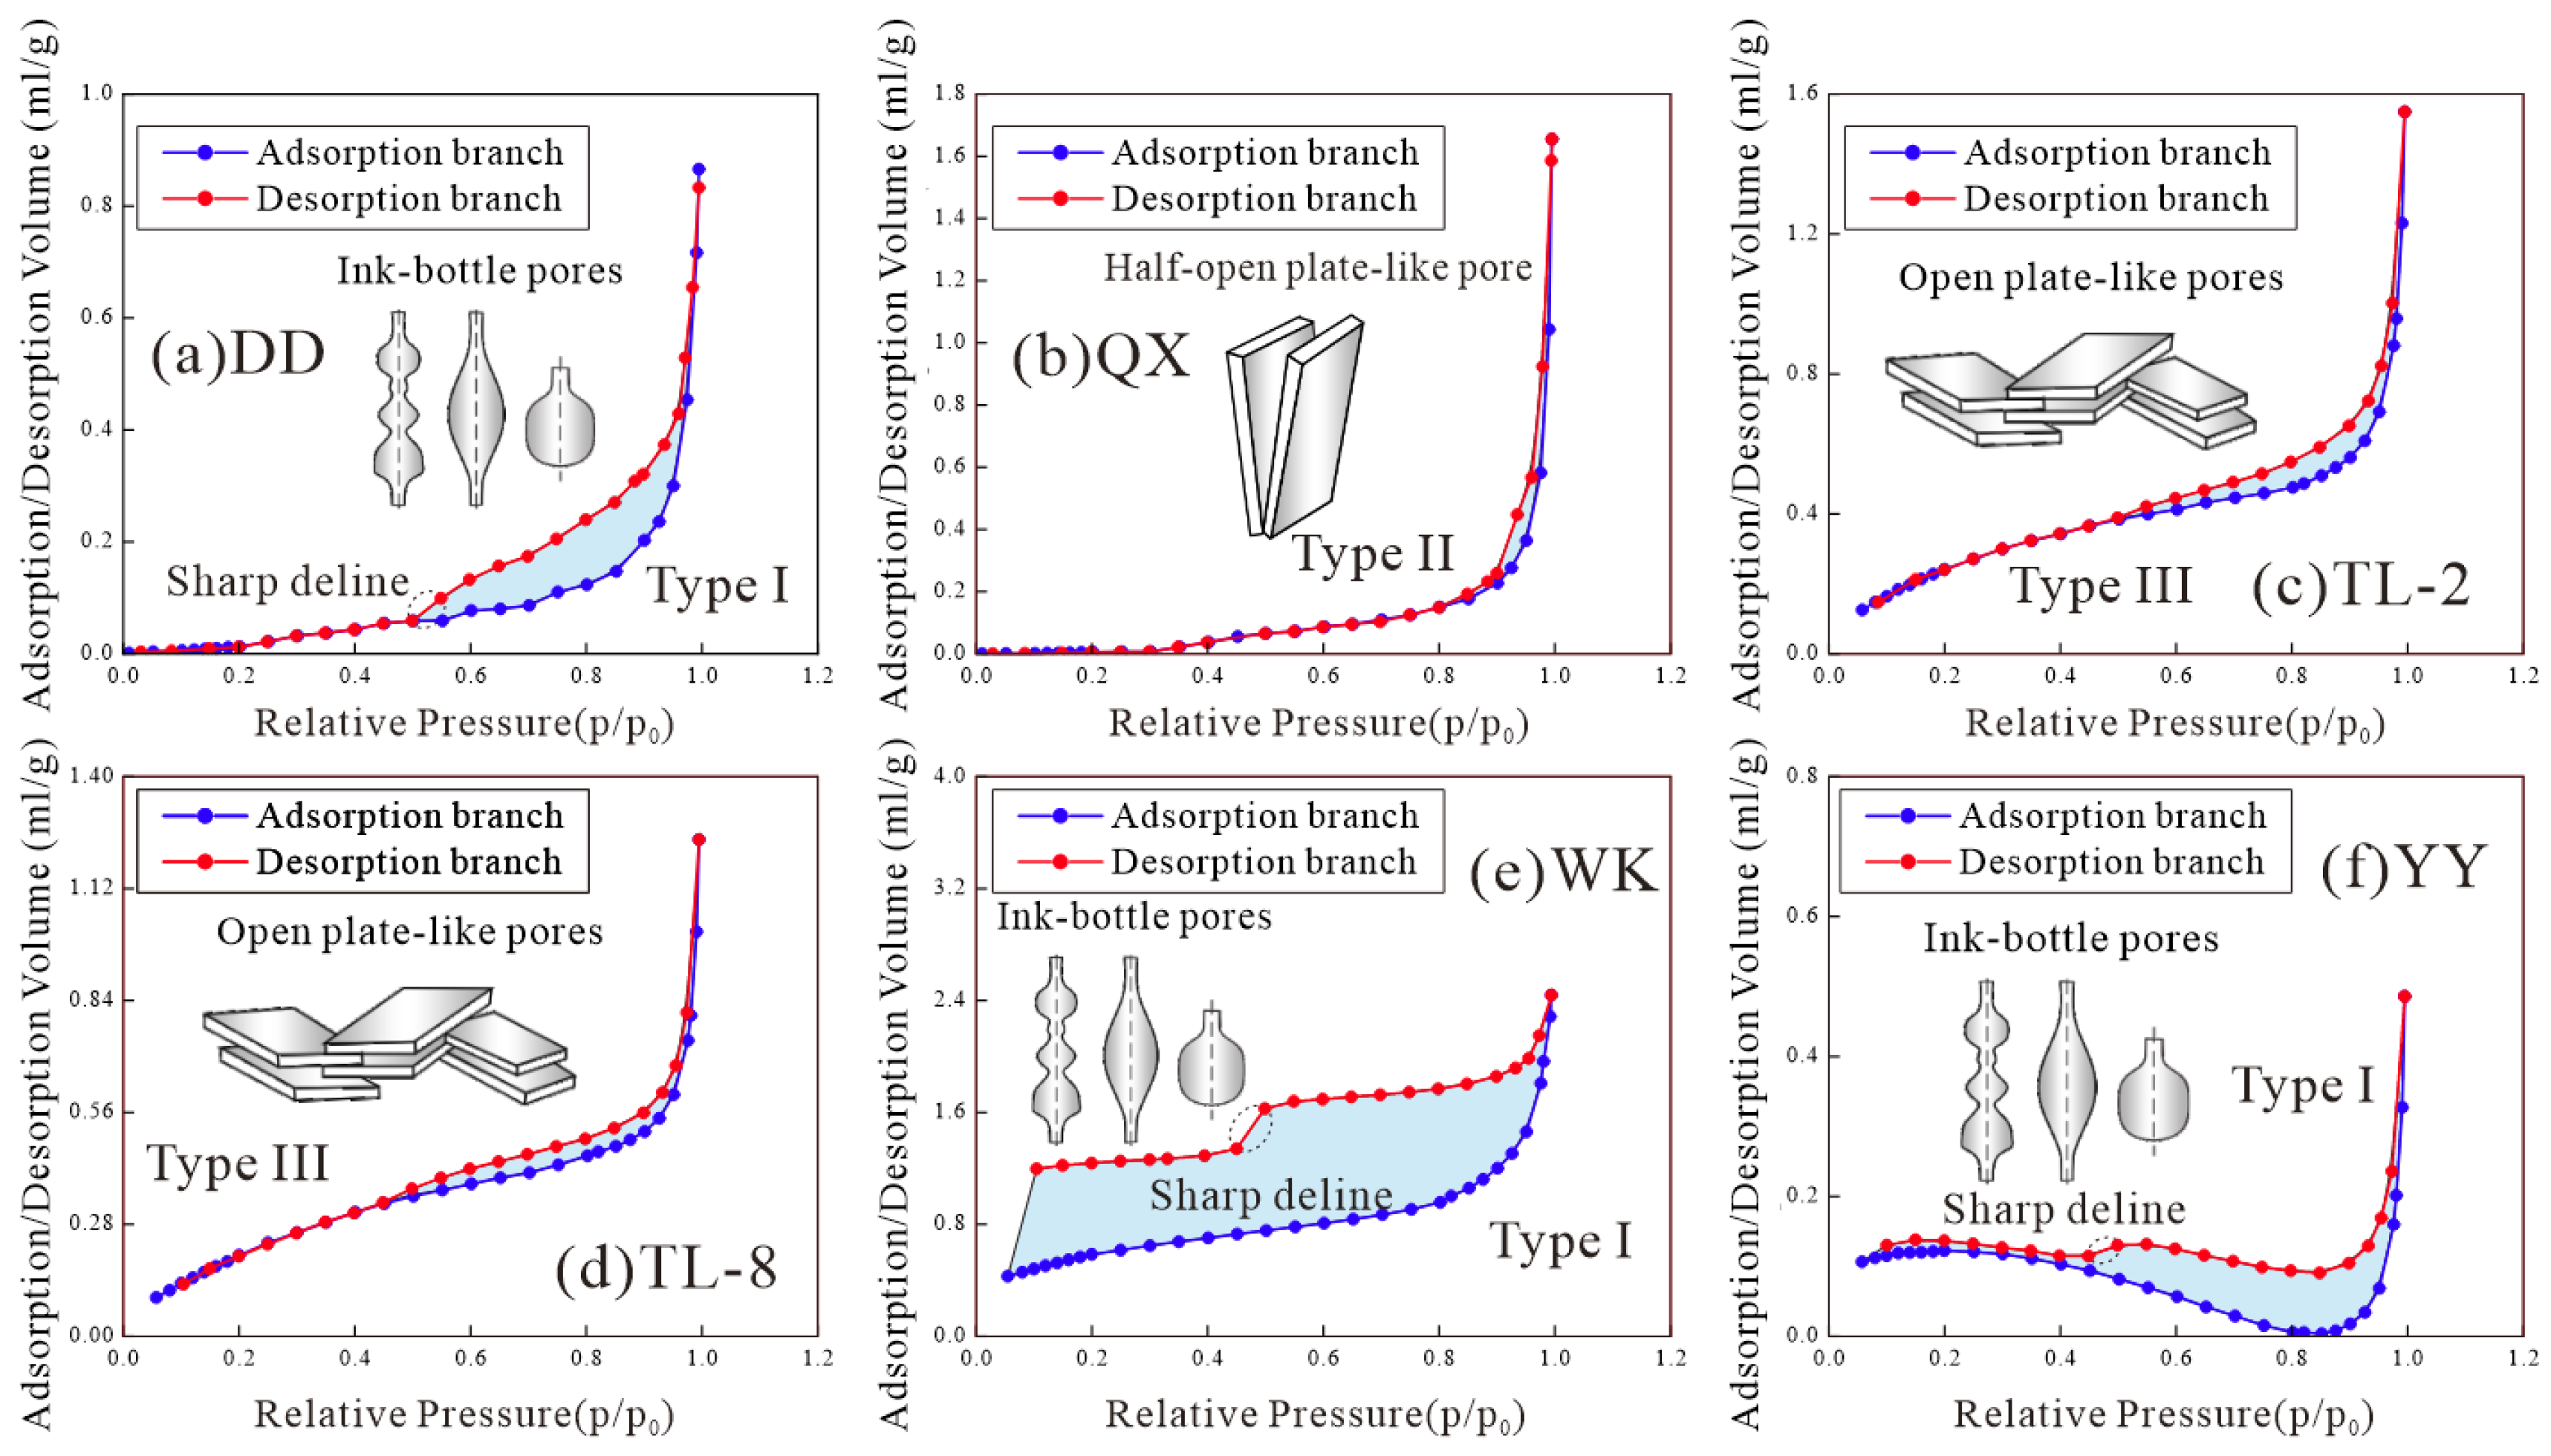
3.2. LTNA Experimental Results

LTNA curves are commonly used to characterize pore structures by analyzing the hysteresis loops generated during adsorption and desorption. Examining different types of adsorption–desorption curves allows for identifying various pore characteristics. Through horizontal comparison of different coal experimental data with the IUPAC classification of hysteresis loops, the experimental curves could be categorized into three types (Figure 4).
Type I curves (Samples No. DD, WK, and YY) exhibit significant adsorption–desorption hysteresis loops within the P/P0 range of 0.4–1, characterized by a sharp drop, indicating the existence of bottleneck breakthroughs and ink-bottle-shaped pores. Type II curves (Sample No. QX) display nearly parallel adsorption and desorption curves with indistinct hysteresis loops, signifying half-open, plate-like pores. Type III curves (Samples No. TL-2 and TL-8) resemble Type II curves but exhibit more distinct hysteresis loops in the P/P0 range of 0.7–1, which indicates the presence of open plate-like pores. Ink-well-bottle pores and half-open, plate-shaped pores are conducive to the adsorption of coalbed methane. However, they are unfavorable for its desorption, making it difficult for coalbed methane to migrate to seepage channels and coalbed methane wells quickly. In contrast, due to their simple pore structure, open plate-shaped pores are more favorable for the desorption and migration of coalbed methane.

3.3. Considering MIP Data Correction for Matrix Compression

3.3.1. Traditional Correction Method

An analysis of MIP experimental data from six coal samples from various mining regions reveals that when mercury injection pressure surpasses 24 MPa, a strong linear relationship exists between the cumulative mercury injection volume and the injection pressure, with correlation coefficients exceeding 0.99 (Figure 5). This indicates a remarkable compression effect on the coal matrix at pressures above 24 MPa. Assuming the mercury compressibility and instrument are negligible, the coal matrix compression effect can be described as follows [52]:
K c = d V c V c d P c
where Kc represents the matrix compression coefficient, 10−10 m2/N; Vc represents the coal matrix volume, and cm3/g; dVc represents the coal matrix volume increment at a pressure of dPc, cm3/g.
Research indicates that when the mercury intrusion pressure exceeds 20 MPa, the compression effect on the coal matrix becomes significant [53,54,55,56]. At this stage, the variation in the mercury injection volume of the coal sample is attributed to the combined effects of pore filling and matrix compression [52].
Δ V d   = Δ V p + Δ V c
where ΔVd represents the mercury intrusion volume; ΔVp denotes the pore-filling volume; and ΔVc is the change in the volume of matrix compression, all measured in cm3/g.
Combining MIP test data with LTNA test data, the appropriate correction range is 24 MPa–200 MPa (the corresponding pore size range is 3–25 nm). Before the correction, the volume and pressure of mercury intrusion within the correction range of the coal sample exhibit a linear relationship. Therefore, ΔVdP is considered a constant C, resulting in ΔVcP [52]:
Δ V c Δ P   C 3 nm 25 nm Δ V p Δ P
where ΔP represents the pressure increment in MPa and ΔVp represents the pore volume within the 3–25 nm range obtained from LTNA test data, in mL/g.
Because ΔVcP can be approximated as a constant, using ΔVcP instead of dVc/dPc, the KC can be obtained by combining Equations (1) and (3).

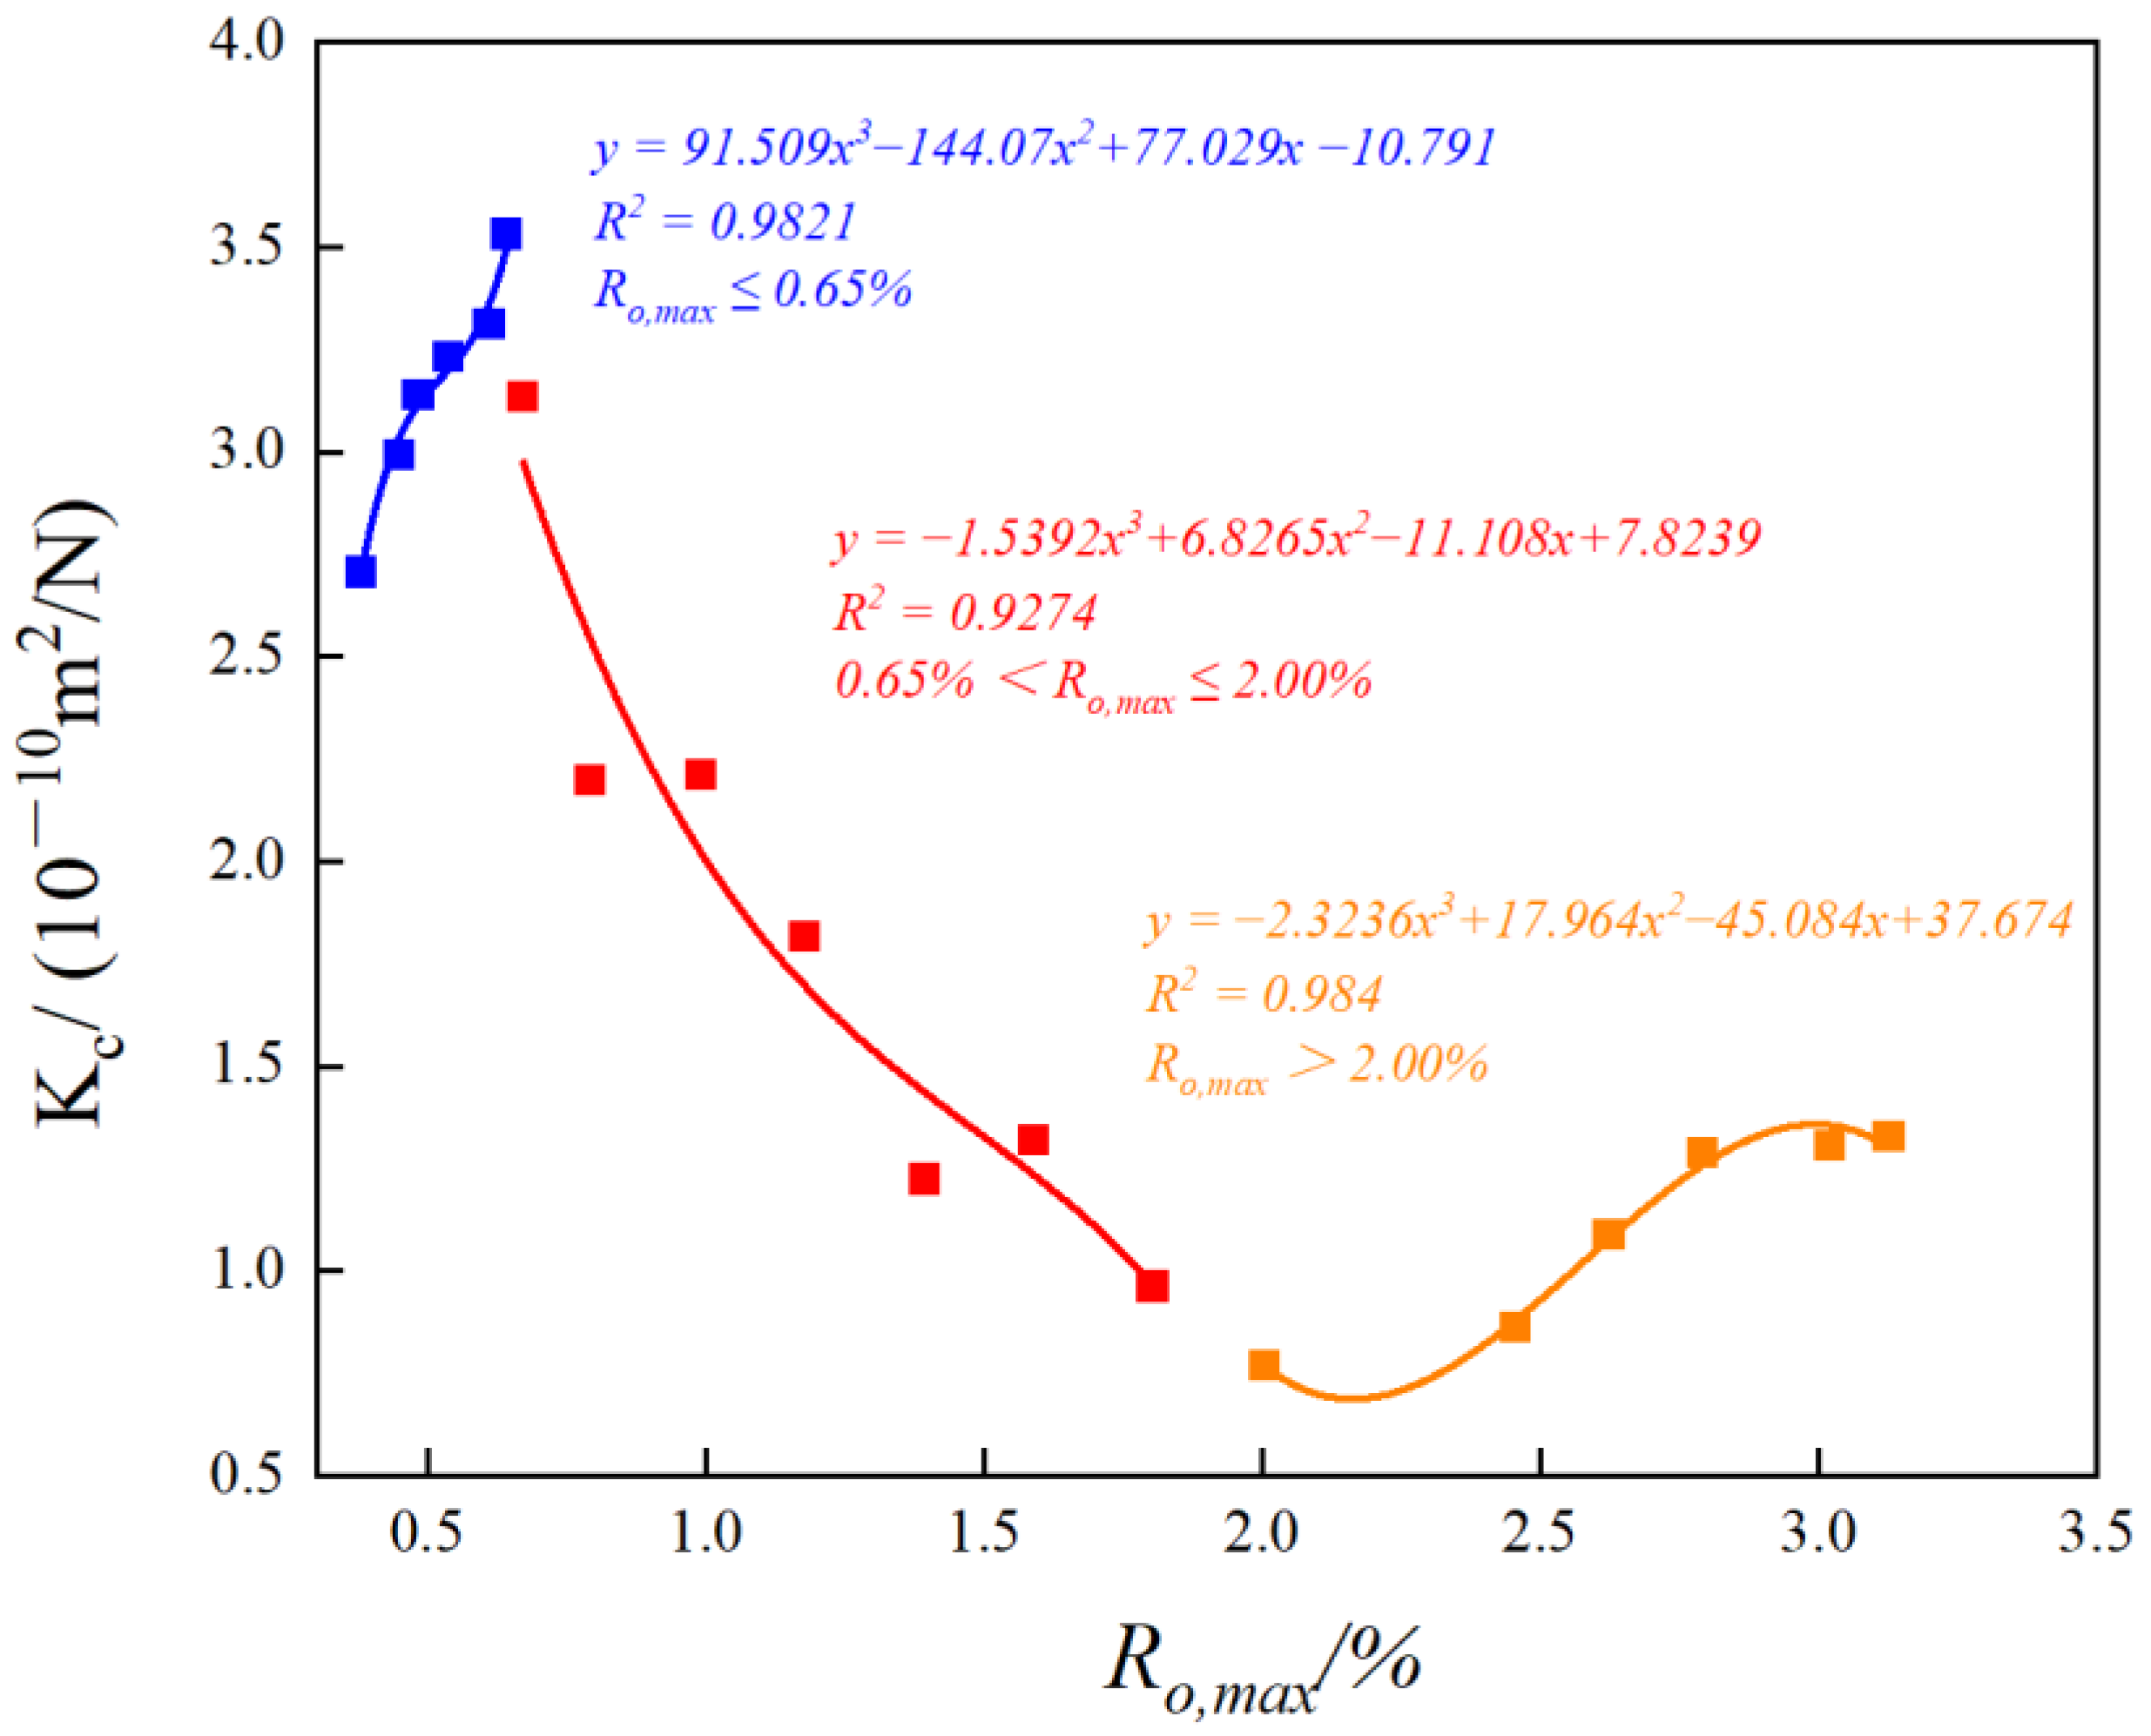
3.3.2. Statistical Correction Method

The traditional correction method corrects MIP data through LTNA data, but explicitly testing LTNA data to achieve the purpose of correcting MIP data has the disadvantages of high cost, a long time, and low efficiency, with certain limitations. In response, a statistical correction method for MIP data correction is proposed. The specific method is as follows. Based on the statistical analysis of KC data from 176 different coal samples, the samples are divided into three groups according to their degrees of metamorphism: low metamorphism (0.35% ≤ Ro,max < 0.65%), medium metamorphism (0.65% ≤ Ro,max ≤ 2.00%), and high metamorphism (Ro,max > 2.00%). For each group, the KC data are averaged based on Ro,max intervals of 0.05%, and this method is used to fit the relationship between KC and Ro,max for coal samples of different metamorphic degrees. First, different coal samples’ matrix compressibility coefficients (KC) are calculated using the fitting Equation (4). Then, based on the obtained KC values, Equation (5) is applied to calculate the matrix compressibility volume for each sample. Finally, Equation (6) is used to subtract the incremental mercury intrusion volume from the original MIP data to obtain the corrected actual pore volume increment, thus completing the correction of the MIP data. Figure 6 shows the trend of KC increasing with Ro,max with a low metamorphism degree (0.35% ≤ Ro,max < 0.65%), decreasing with a medium metamorphism degree (0.65% ≤ Ro,max ≤ 2.00%), and increasing with a high metamorphism degree (Ro,max > 2.00%). The KC calculation formula is obtained through a fitting analysis of the data with different metamorphism degrees:
K c = 91.509 R o , max 3 144.07 R o , max 2 + 77.029 R o , max 10.791   ( 0.35 % R o , max < 0.65 % ) 1.5392 R o , max 3 + 6.8265 R o , max   2 11.108 R o , max + 7.8239   ( 0.65 % R o , max 2.00 % ) 2.3236 R o , max 3 + 17.964 R o , max   2 45.084 R o , max   + 37.674   ( R o , max > 2.00 % )
The formula’s fitting degrees for different metamorphic grades are 0.9821, 0.9274, and 0.984, respectively, demonstrating the formula’s strong capability to represent the KC value accurately.
Using the traditional correction method, the KC1 value was calculated through MIP test data and LTNA test data in conjunction with Formulas (1) and (3). Simultaneously, using the proposed method, the KC2 value was calculated by combining the Ro,max values of different collected samples with Formula (4). Figure 7 visually demonstrates the comparison of KC values calculated using the two methods.
Table 1 presents the Ro,max for six selected coals from six mining regions alongside the KC1 values determined through the traditional correction method and the KC2 values calculated using the statistical correction method, which are consistent with previous research results of 0.67 × 10⁻¹⁰ m2/N–3.06 × 10−10 m2/N [57,58], proving the rationality of Formula (4). It can be seen that the error rate range between KC1 and KC2 is 0.11–5.25%, indicating that the KC values calculated using the statistical correction method have good accuracy and reliability. From this, it can be seen that the statistical correction method proposed in this study has the following advantages over traditional correction methods: when calculating the coal matrix compression coefficient KC, only the maximum vitrinite reflectance parameter is needed. This significantly reduces experimental preparation and the computational workload, simplifies the MIP data correction process, and avoids the traditional method’s over-reliance on LTNA test data for correcting MIP data. It is particularly noted that within the high metamorphism range (Ro,max > 2.00%), the KC1 value calculated using this method has minimal error compared to the value calculated using traditional methods, and it is very close to the actual value (KC2). In the preliminary evaluation stage of the compressibility of coal in coalbed methane reservoirs, using the method proposed in this study dramatically improves the evaluation efficiency (it only requires substituting the maximum vitrinite reflectance into Formula (4) for evaluation), and it can directly serve as a reference.

3.4. Analysis of Calibration Results

Research indicates that during the mercury intrusion process, when the compressibility coefficient of the coal matrix is considered a constant, the volume of the coal sample can be corrected using Formula (5) [52]:
V c P i = V c d V c d P c P i P 0
where Vc(Pi) represents the volume of the coal matrix under pressure Pi, measured in cm3/g; r denotes the serial number of the pressure collection point; and P0 is set to 24 MPa.
The pore-filling volume of the coal sample under pressure Pi can be calculated using Equation (6) [52]:
Δ V pi = Δ V d   K c V c P i P i P 0
where ΔVpi represents the volume change of the coal matrix at the mercury intrusion pressure Pi, cm3/g; ΔVd represents the mercury intrusion volumes at the pressures Pi and P0, respectively, in cm3/g; and KC is the KC2 calculated using the statistical correction method (see Table 1), 10−10 m2/N.
By integrating Equations (5) and (6), this study calculated the coal’s cumulative mercury intrusion volumes before and after correction. As shown in Figure 8, the data reveal a significant discrepancy in cumulative mercury intrusion volumes before and after correction. The theoretical analysis results suggested that the corrected MIP data show substantial improvement, thus facilitating a more accurate characterization of the coal samples’ pore structure. The PSD of the coals determines their pore structure characteristics. According to Hodot’s (1966) pore-classification methodology, pores are categorized into micropores (<10 nm), transitional pores (10–100 nm), mesopores (100–1000 nm), and macropores (>1000 nm).
Figure 9 presents the PSD and the volume proportions of various pores in the corrected coal samples. The pore structure of the coal samples predominantly comprises macropores, followed by mesopores and transitional pores, with micropores constituting the most minor proportion. Compared to the mercury intrusion volumes before correction, the 3–25 nm pore radius range decreases the mercury intrusion volume by 91.75–96.40% after correction, indicating a successful correction effect. This implies that the coal matrix’s compressibility significantly impacts the PSD measurement in MIP experiments.

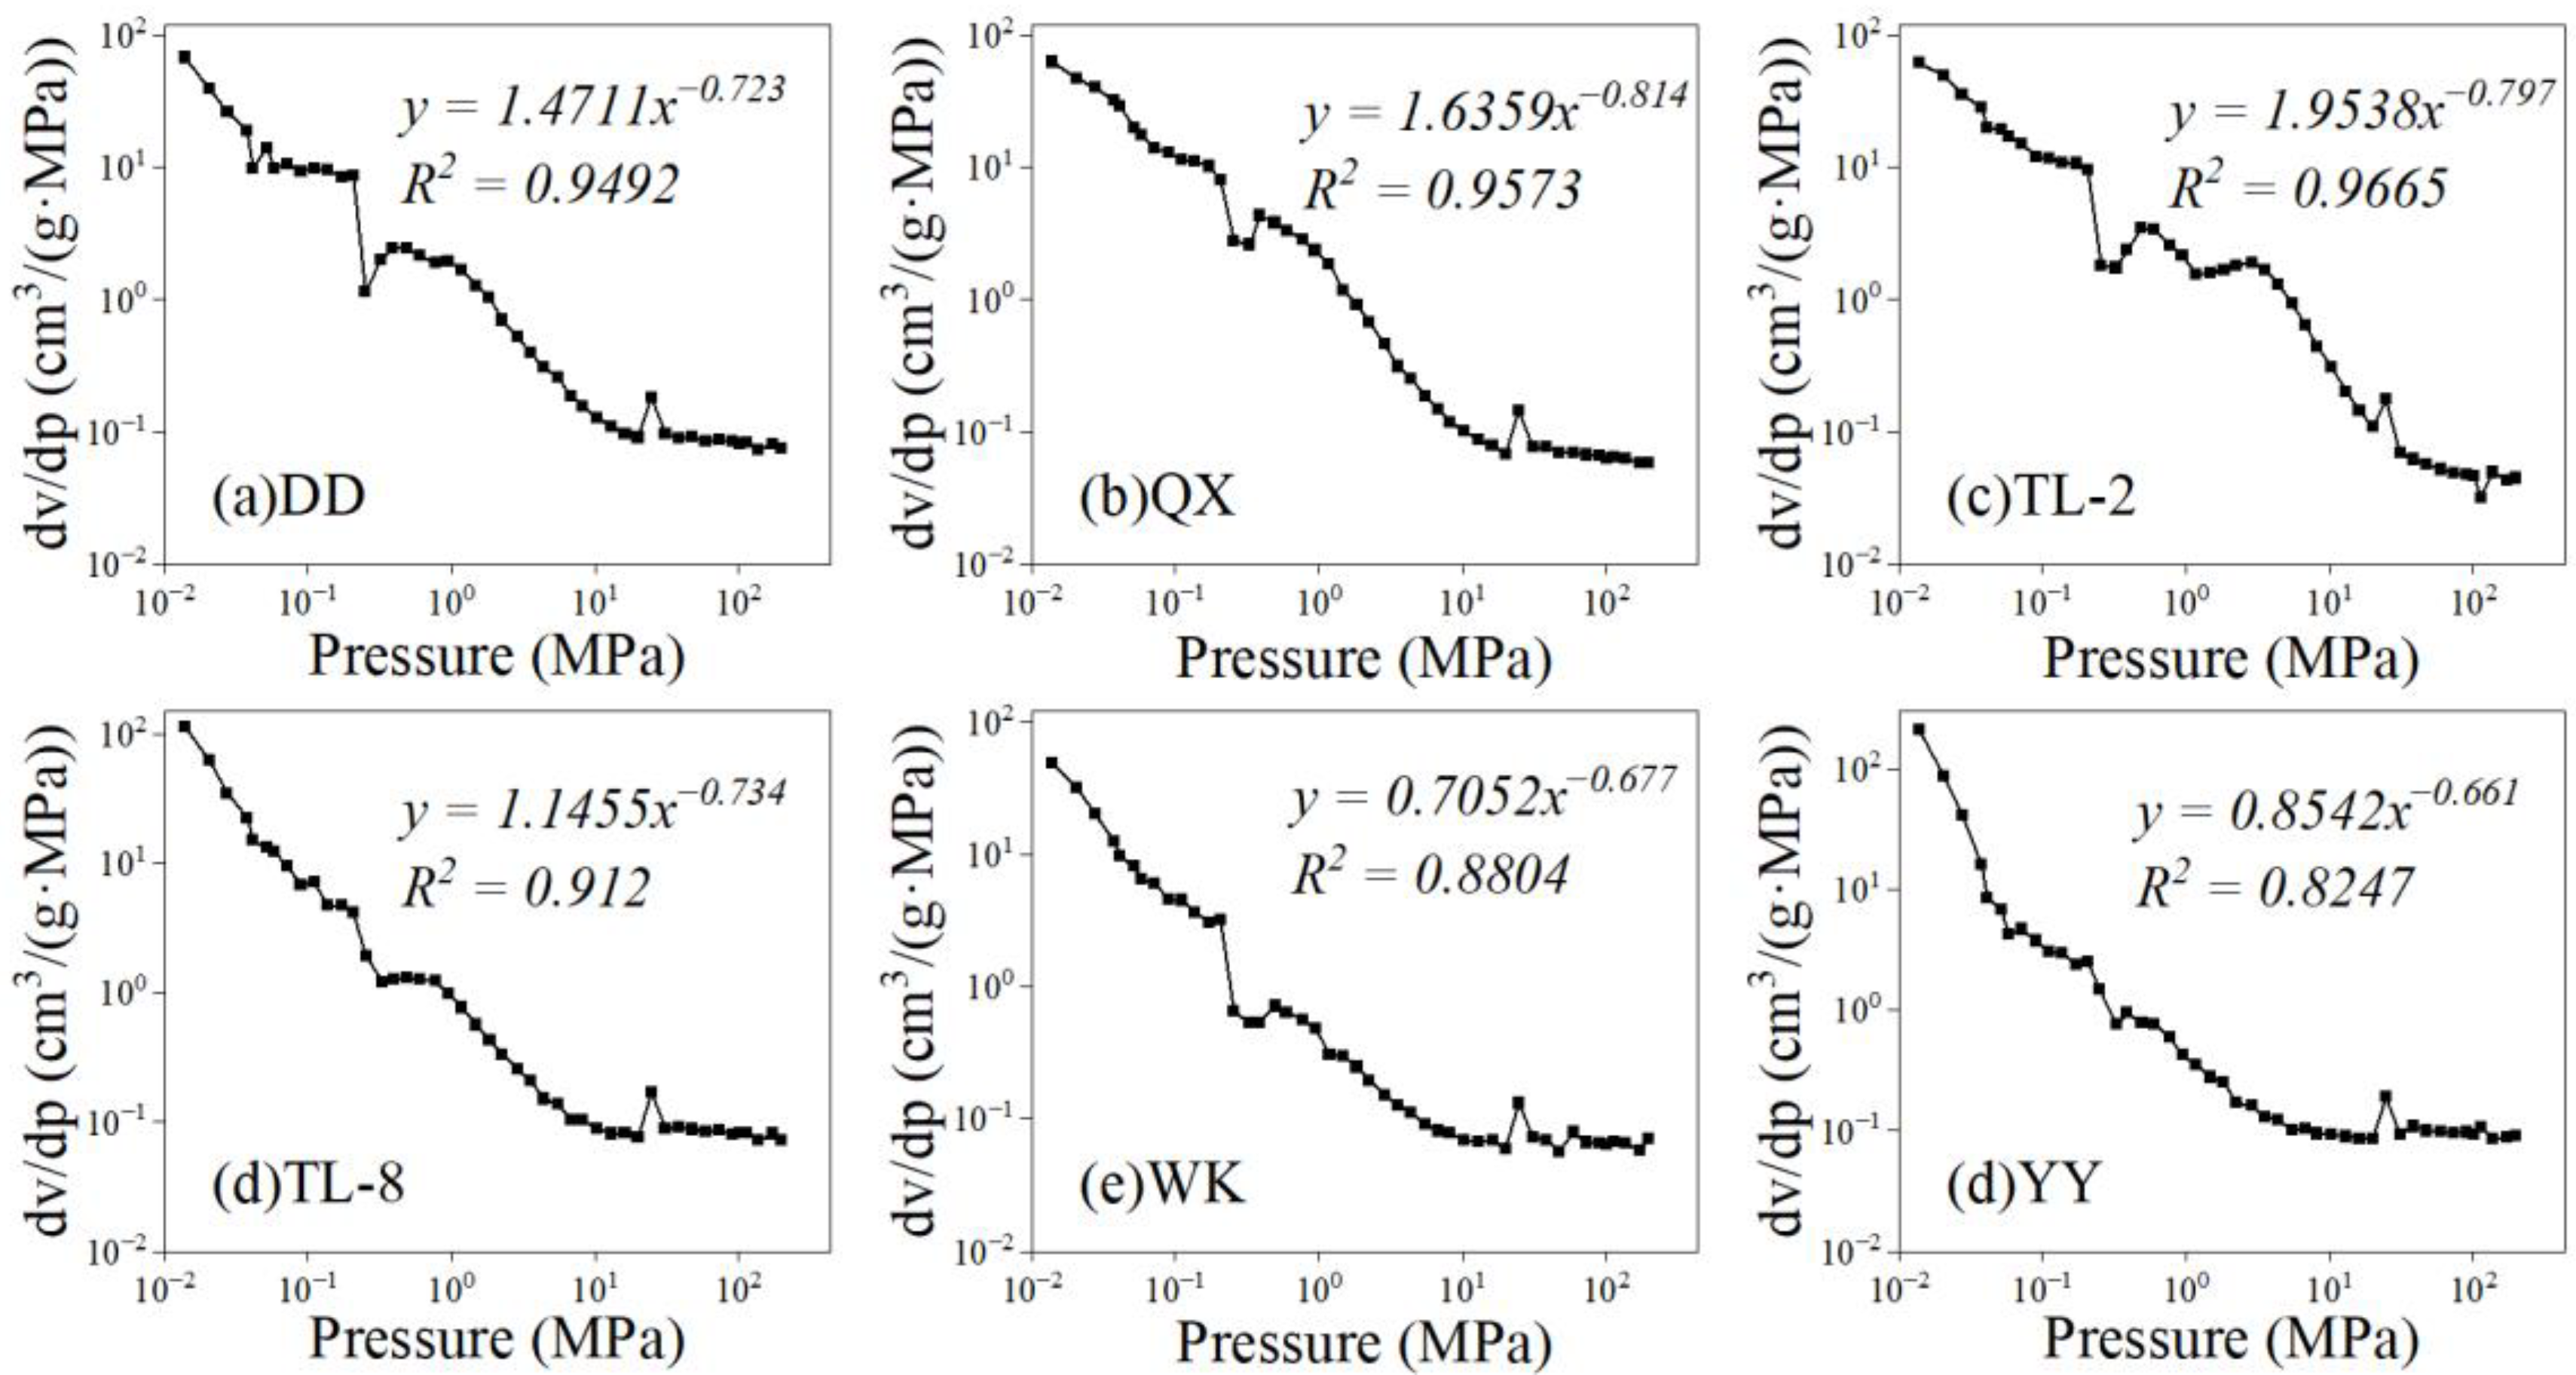
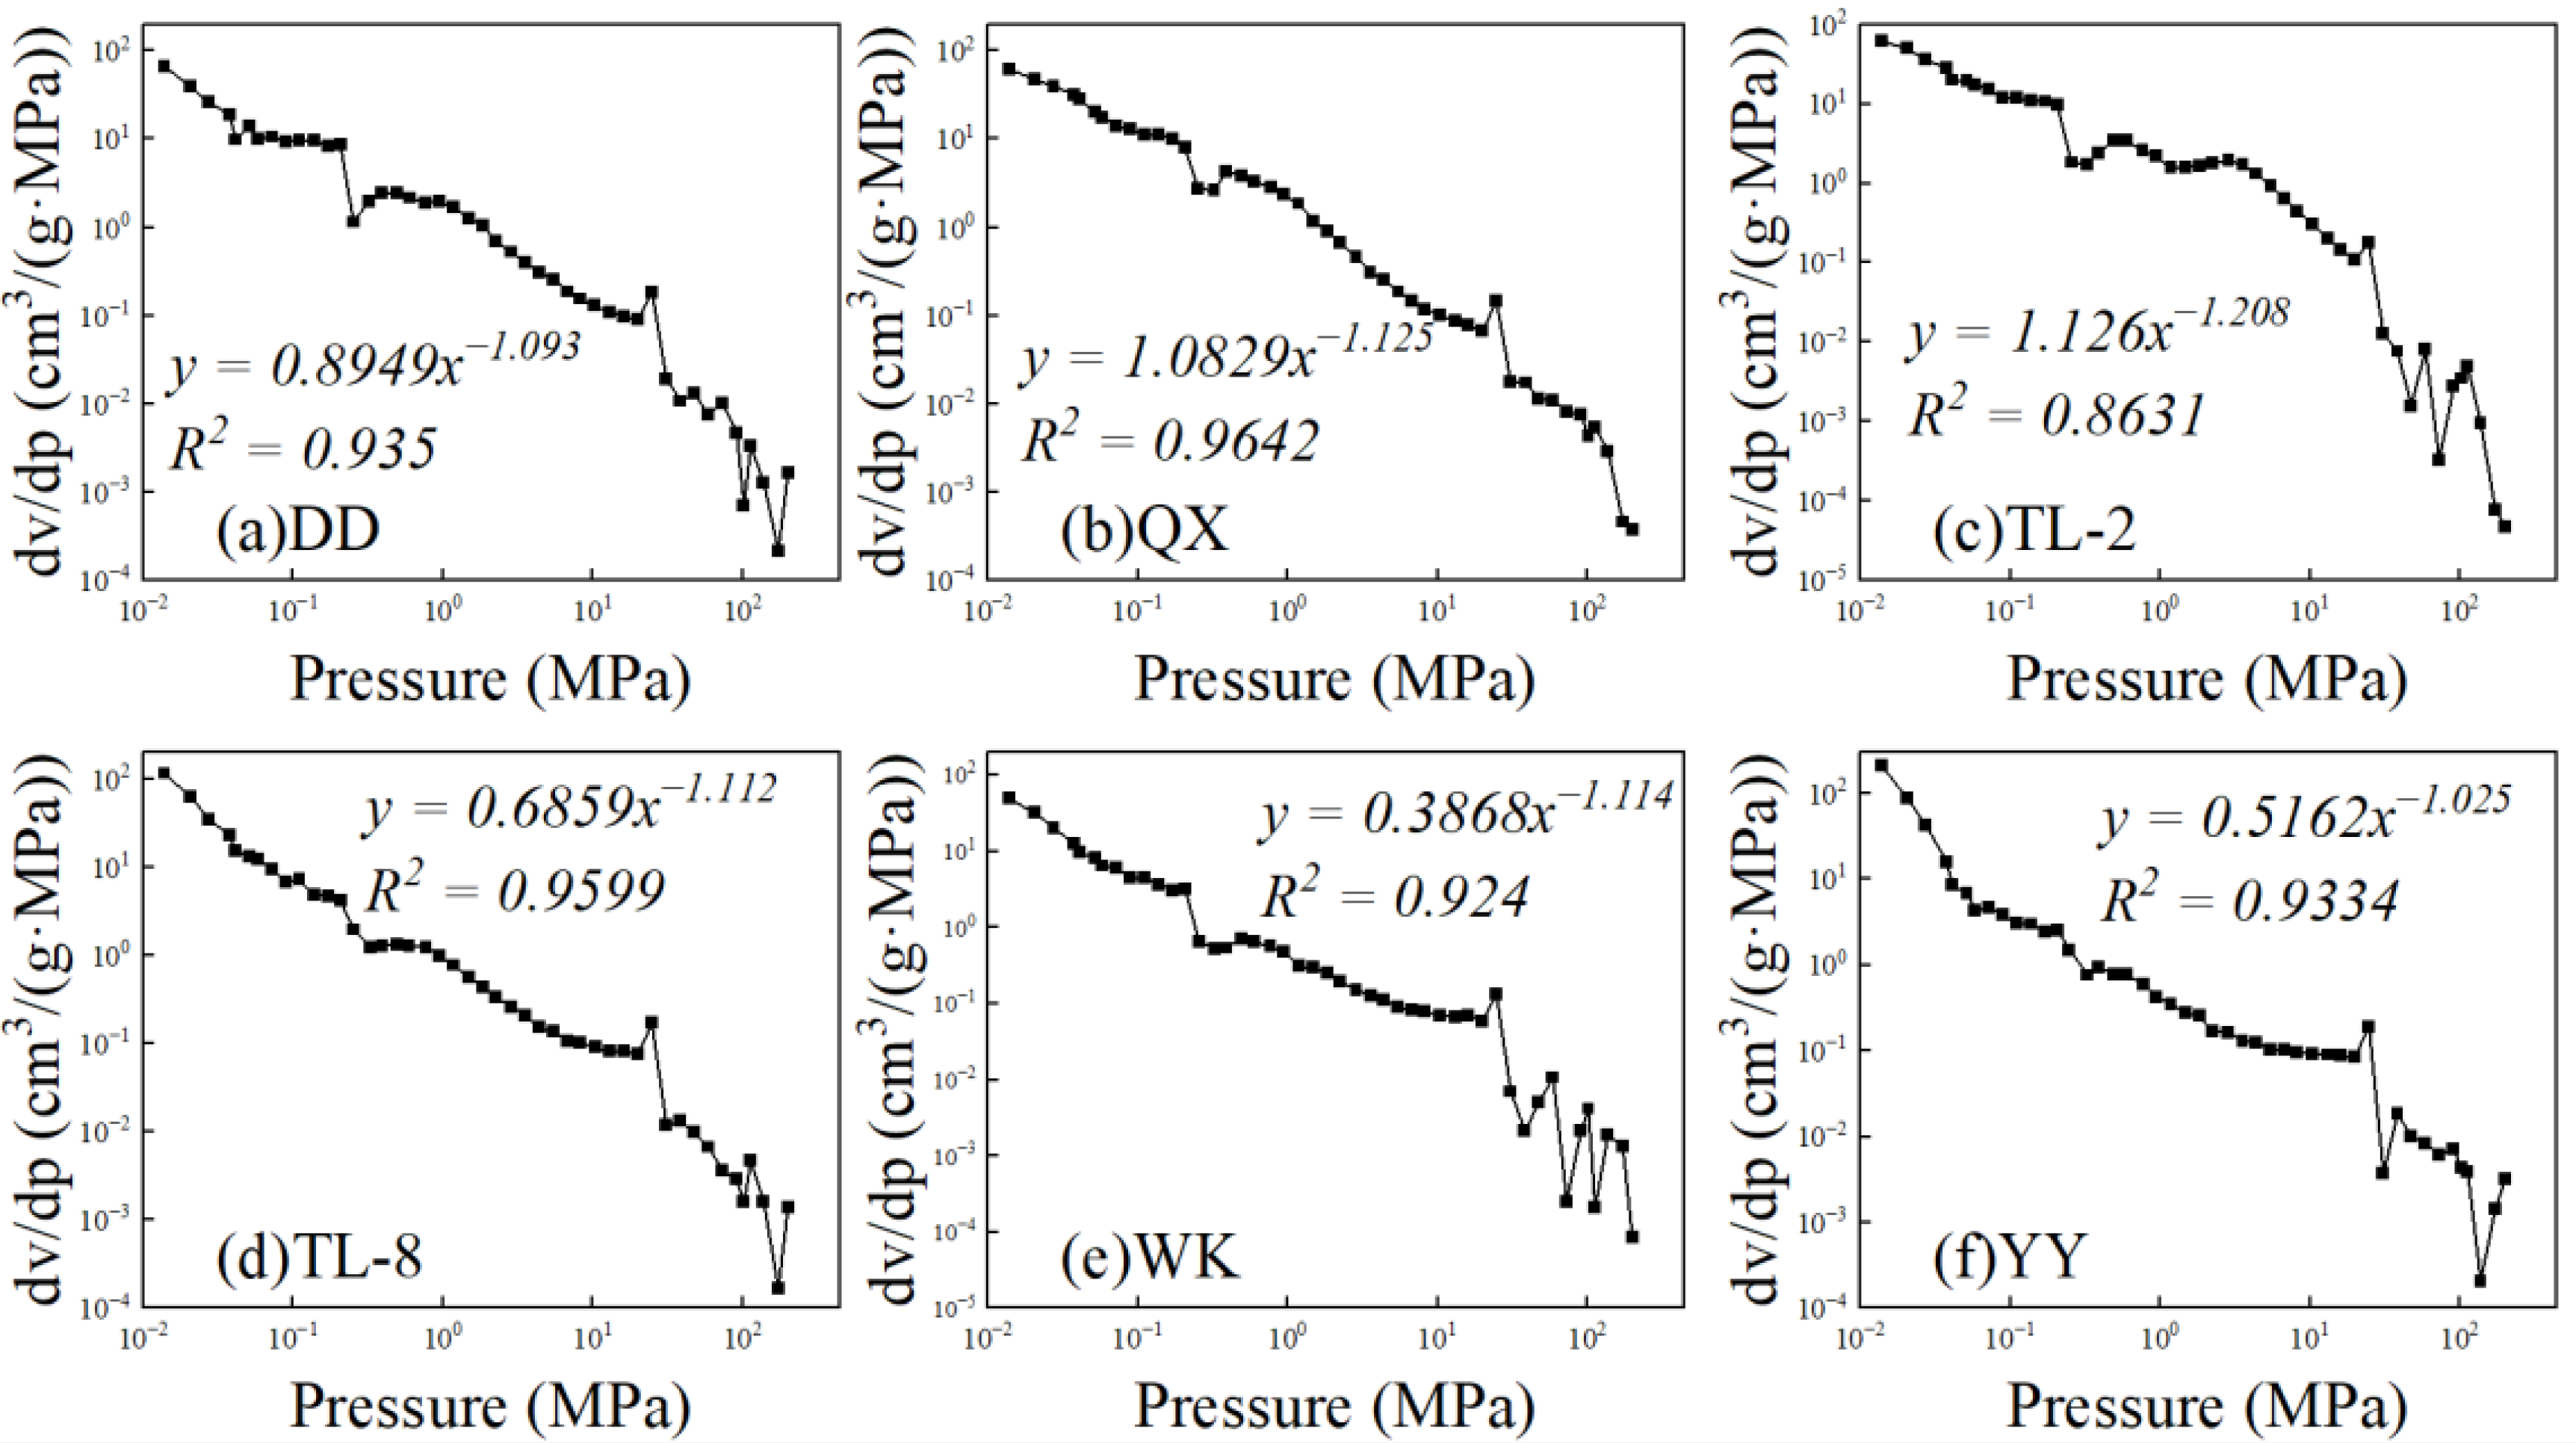
4. Fractal Dimension Characteristics before and after Calibration

The MIP pore structure exhibits fractal characteristics, which can be used to illustrate the influence of pre- and post-correction of MIP data on the fractal properties of the pores using fractal geometry concepts, thereby characterizing the pore morphology of coal. The Menger sponge model, a universal fractal calculation curve with a topological dimension of 1 [59], has been extensively applied to porous media. After repeated verification by scholars, it has ultimately been simplified into a general model:
D 2 = 4 + lg d V d P   /   lg P
where P represents the pressure during the mercury intrusion process, measured in MPa; V represents the incremental volume of mercury intrusion in the interval, measured in mL/g; and D2 denotes the pore fractal dimension, which is dimensionless.
Figure 10 compares the fractal dimension D2, calculated from MIP data within the pressure range of 24 MPa to 200 MPa, before and after correction. The corrected fractal dimension D2 shows a substantial improvement over the uncorrected values. Figure 11 shows that before correction, the D2 values range from 3.186 to 3.339, indicating fractal dimensions between 3 and 4, which suggests suboptimal fractal characteristics of the overall pore structure. At this stage, the filling effect coexists with the matrix compression effect, with the latter predominating. This predominance results in significant measurement deviations, hindering an accurate reflection of the true pore structure.
Figure 12 illustrates the relationship between pressure and dV/dP for the six groups of corrected coal samples. The figure shows that the adjusted fractal dimension D2 ranges from 2.792 to 2.975 within the expected range of 2 to 3, demonstrating robust fractal characteristics. This indicates that the correction process is highly effective, providing a more accurate and reliable depiction of the pore structure. The corrected fractal dimension values show that the pore sizes of the six coal samples collected in this study are well-developed at all stages. Compared to mesopores and macropores, the surfaces of micropores and transitional pores are rougher. The pore size distribution is complex, with irregular shapes and firm heterogeneity, making it easier to store free gas.

5. Research and Prospects

This study innovatively proposes a method for calculating the coal matrix compressibility coefficient based on maximum vitrinite reflectance. However, a specific deviation exists between the empirical formula derived from data statistics and the actual calculated values. On the other hand, as the coal samples used in this study do not belong to the low metamorphic degree (0.35% ≤ Ro,max < 0.65%), no error comparison was conducted for KC value calculation at a low metamorphic degree. Therefore, with the enrichment of research data on KC and Ro, max in the industry, future studies using this method should incorporate the calculation of the compressibility coefficient for a low-metamorphic-degree coal matrix and further refine the accuracy of the empirical formula to reduce calculation errors. In the practice of coalbed methane work, the compressibility coefficient of the coal matrix in the reservoir is calculated to evaluate certain parameters, such as permeability and porosity, thereby guiding coalbed methane development.

6. Conclusions

(1)
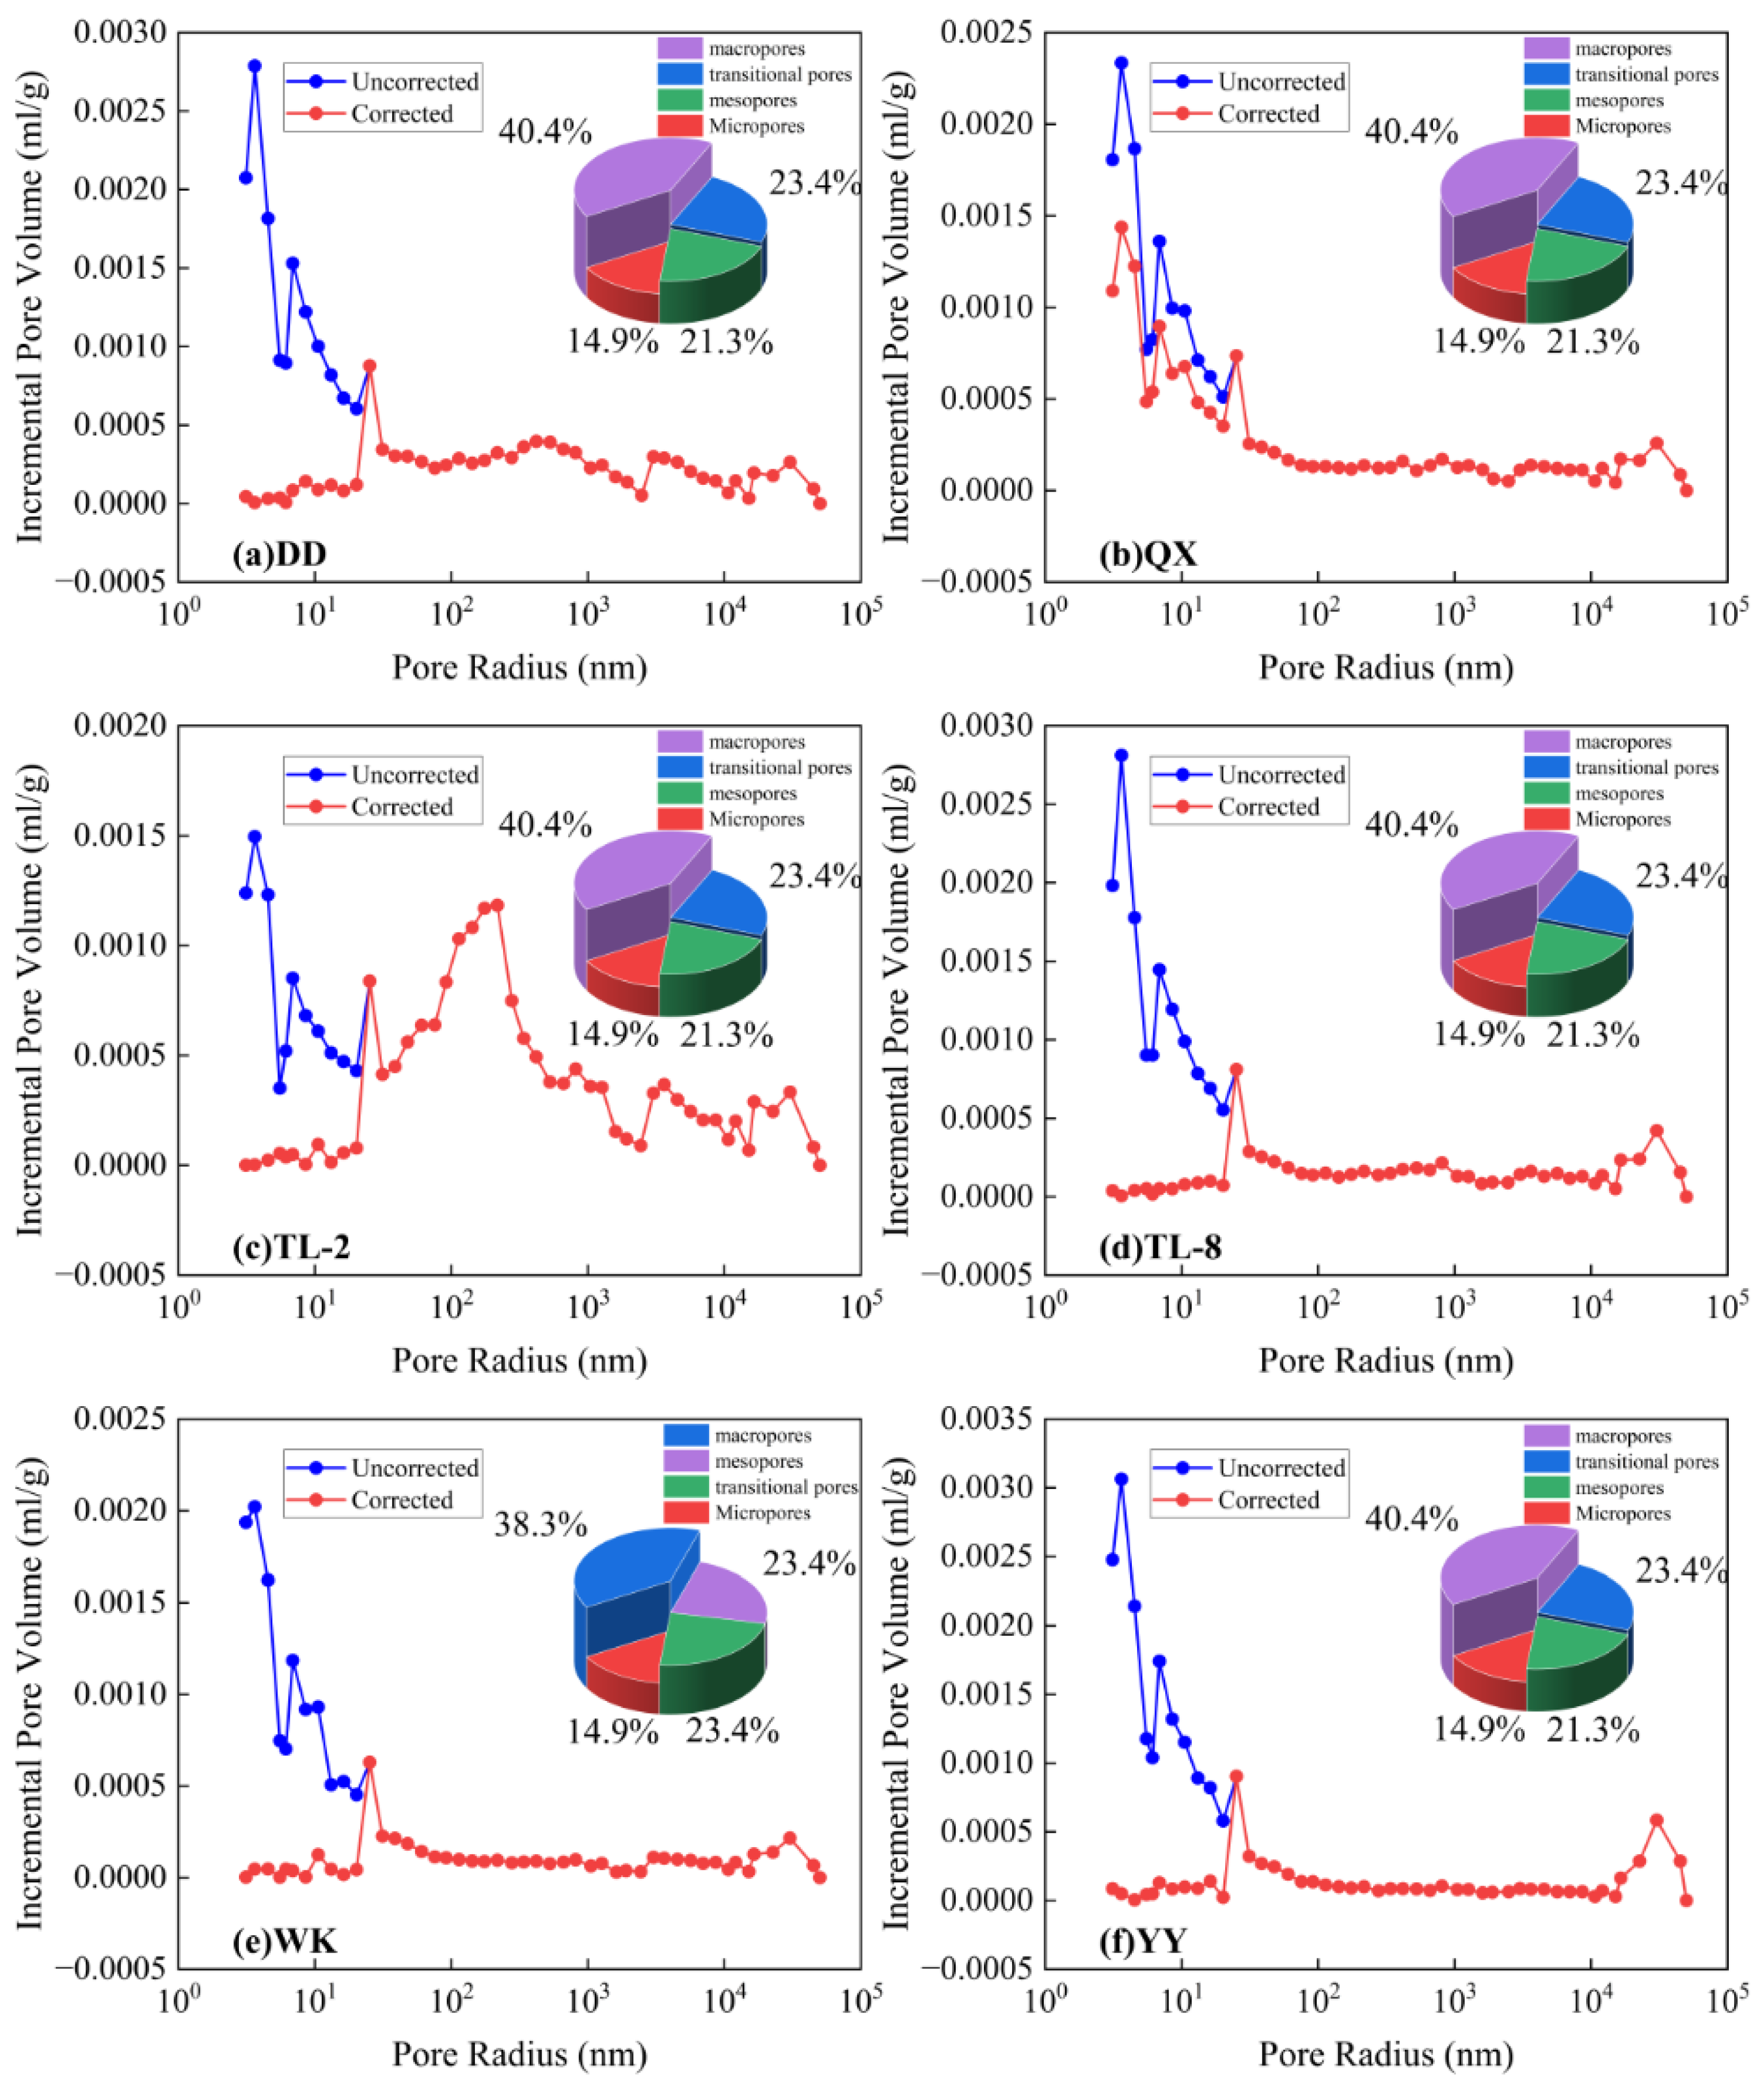
The analysis of MIP data reveals significant differences in the pore structure and the connectivity of coal samples from different mining areas. Type I coal samples predominantly exhibit semi-open pores with poor connectivity. Type II coal samples show poor connectivity in the transitional pores segment but good connectivity in the large pore segment. In contrast, Type III coal samples mainly feature open pores with good connectivity. Furthermore, data from LTNA experiments indicate notable pore morphology variations among coal samples. Ink-bottle, semi-open, and open plate-shaped pores primarily characterize these morphologies.
(2)
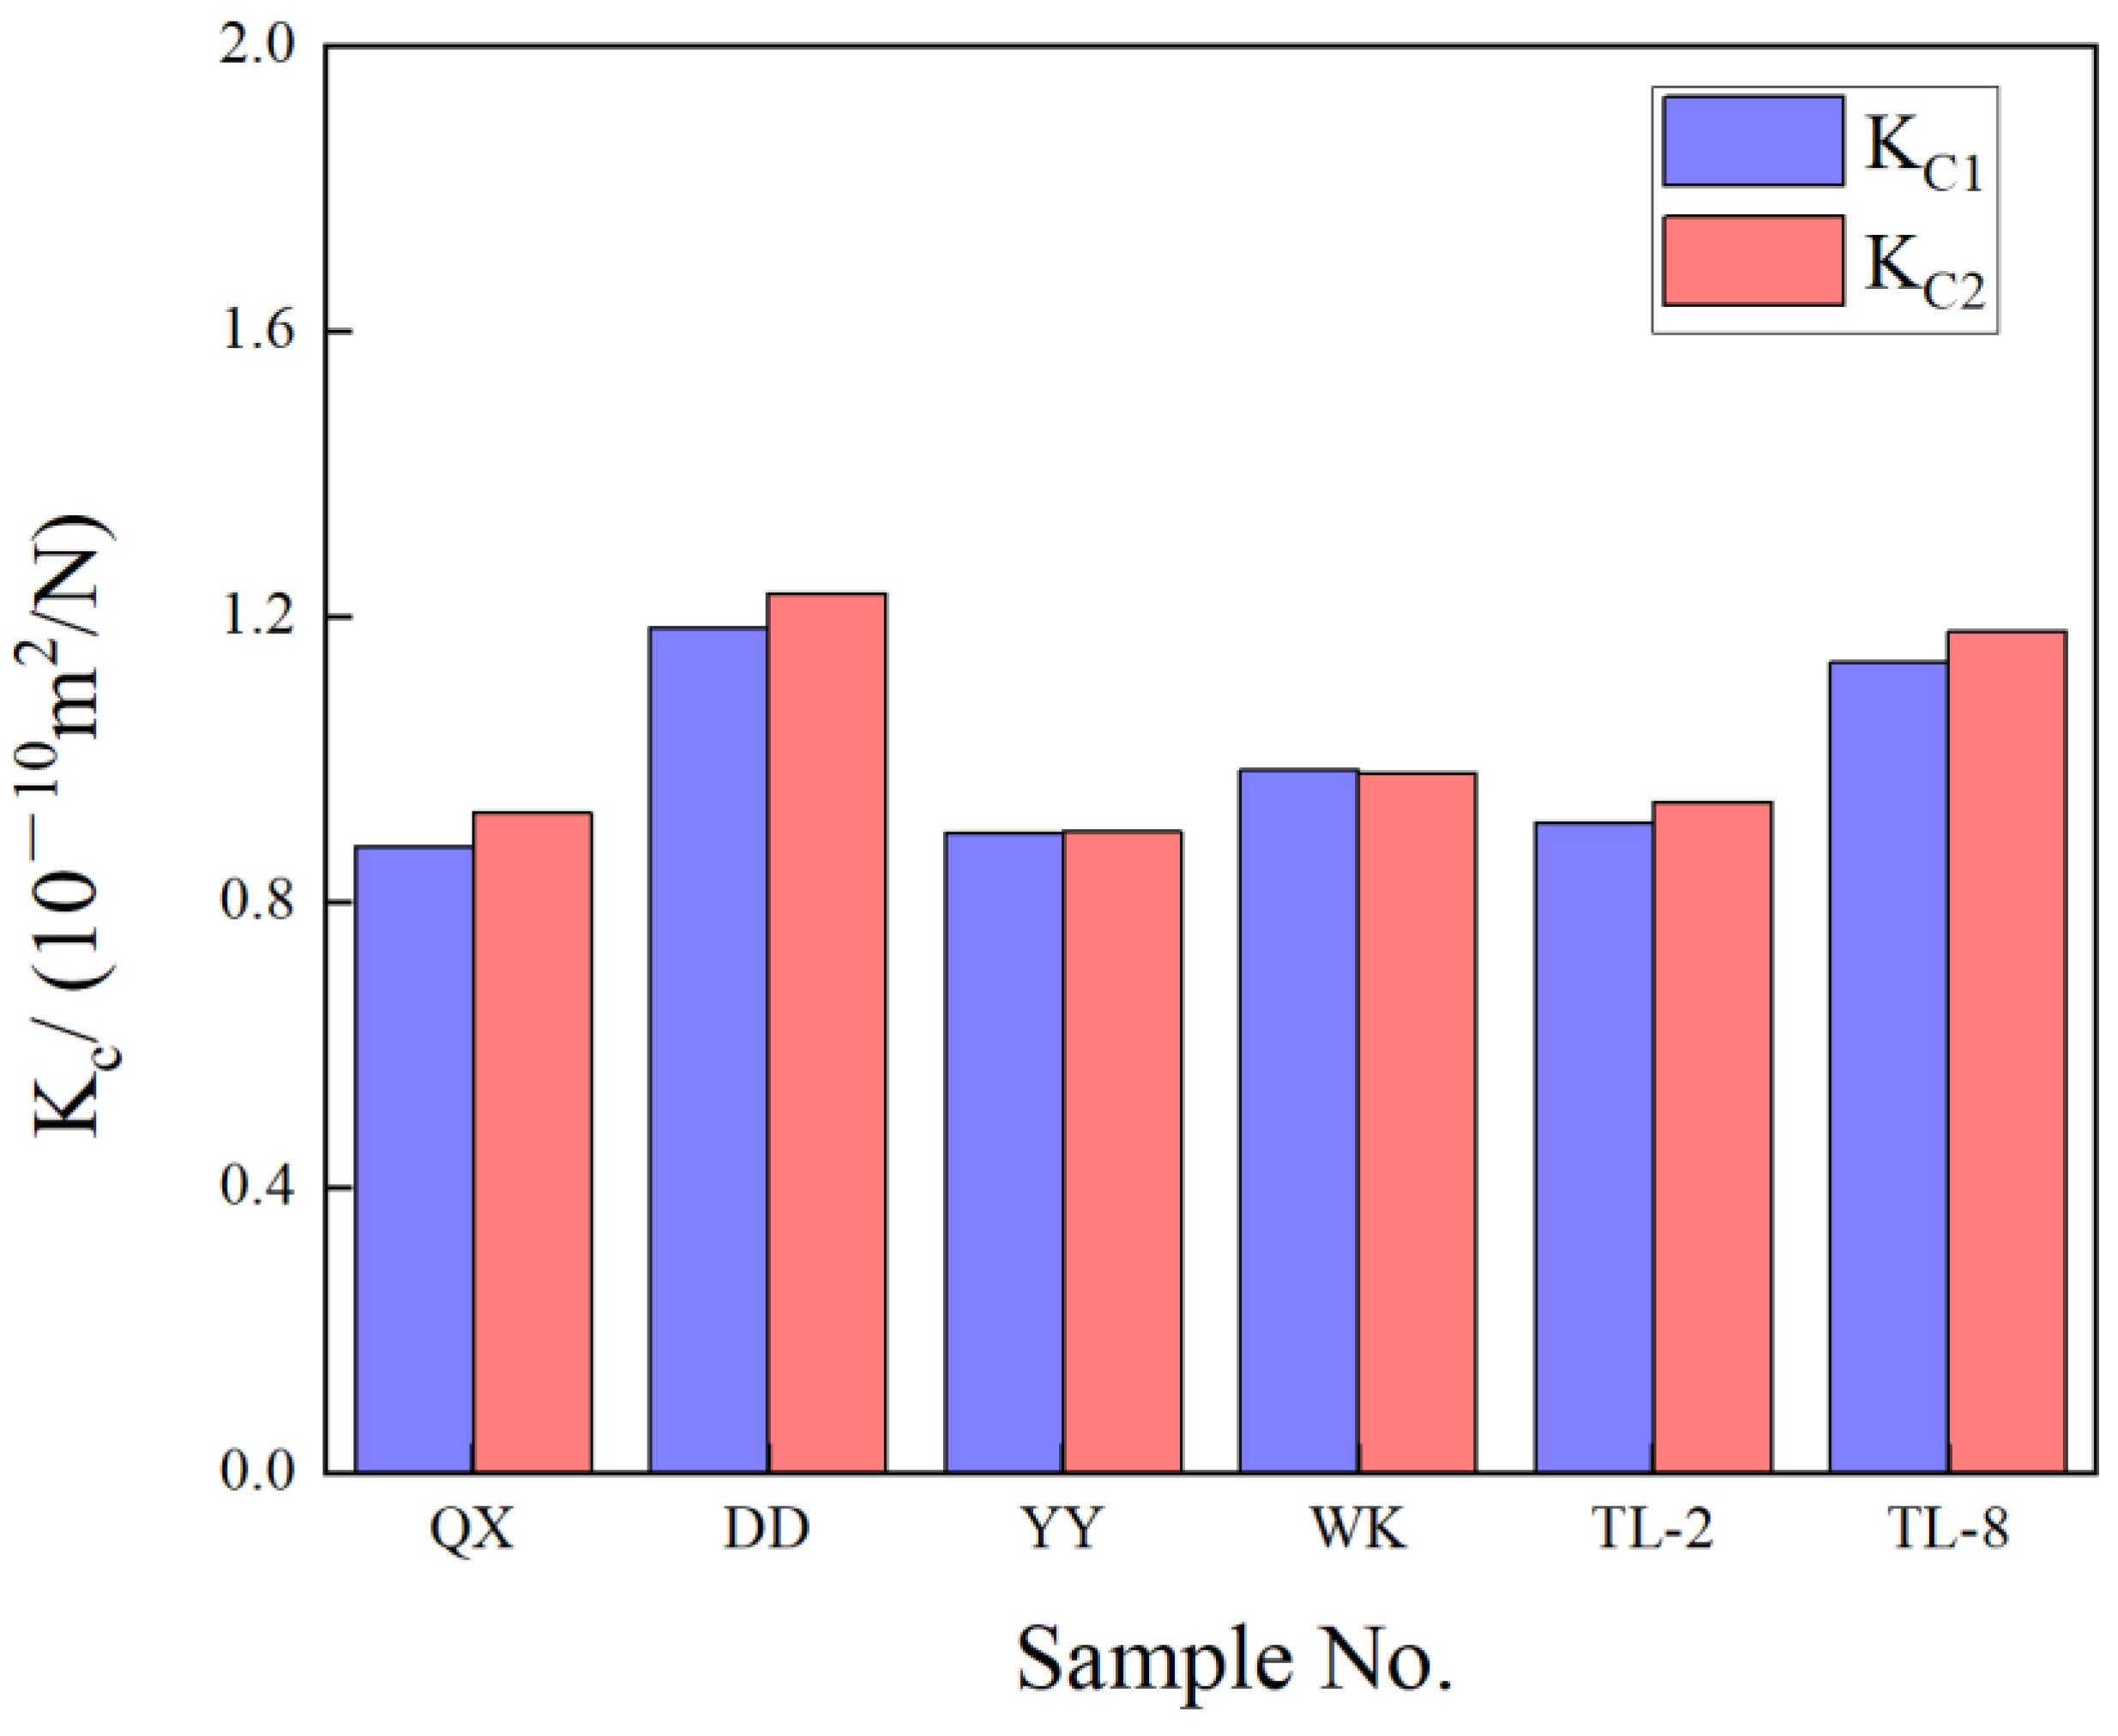
Considering the matrix compression effect of coal, a novel statistical correction method was devised based on statistical analysis. Compared to KC values calculated using the traditional correction method, the statistical correction methods have high practical applicability. This statistical correction method was applied to correct MIP data under pressures ranging from 24 to 200 MPa, resulting in a decrease in the corrected mercury intrusion volume by 91.75% to 96.40%. The correction effect was significant, enabling a more precise characterization of the PSD.
(3)
The D2 of MIP-measured initial uncorrected data values ranged from 3.186 to 3.339, with fractal dimensions between 3 and 4, indicating the suboptimal fractal characteristics of the overall pore structure. After PSD correction, D2 values ranged from 2.792 to 2.975 within the 2 to 3 range, reflecting improved fractal characteristics. Correcting the MIP data significantly enhances the fractal representation of the coal’s pore structure, aligning the fractal dimensions more closely with their true values and thus offering a more accurate depiction.

Author Contributions

Writing—original draft preparation, B.R.; methodology and investigation, S.Z.; software, X.D.; validation, M.W.; formal analysis, Y.L.; resources and data curation, L.P.; visualization, X.W.; supervision, S.X. All authors have read and agreed to the published version of the manuscript.

Funding

This research was funded by the National Natural Science Foundation of China (No. 42302194), the National Key Research and Development Program of China (No. 2023YFE0120500), the Natural Science Foundation of Jiangsu Province, China (No. BK20231084), the Applied Basic Research Programs of Xuzhou, China (No. KC23001), and the Fundamental Research Funds for the Central Universities (No. 2023KYJD1001, 2024KYJD2004).

Data Availability Statement

The raw data supporting the conclusions of this article will be made available by the authors on request.

Conflicts of Interest

Authors Lihua Ping and Xiuping Wu were employed by the company China Coal Changjiang Ge-ology Group. The remaining authors declare that the research was conducted in the absence of any commercial or financial relationships that could be construed as a potential conflict of interest.

References

  1. Wang, M.; Xie, W.D.; Huang, K. Fine characterization of lithofacies and pore network structure of continental shale: Case study of the Shuinan Formation in the north Jiaolai Basin, China. J. Pet. Sci. Eng. 2019, 175, 948–960. [Google Scholar] [CrossRef]
  2. Cai, Y.D.; Liu, D.M.; Pan, Z.J.; Yao, Y.B.; Li, J.Q.; Qiu, Y.K. Pore structure and its impact on CH4 adsorption capacity and flow capability of bituminous and subbituminous coals from Northeast China. Fuel 2013, 103, 258–268. [Google Scholar] [CrossRef]
  3. Liu, S.; Harpalani, S. Compressibility of sorptive porous media: Part 1. Background and theory. AAPG Bull. 2014, 98, 1761–1772. [Google Scholar] [CrossRef]
  4. Zheng, S.J.; Yao, Y.B.; Liu, D.M.; Cai, Y.D.; Liu, Y. Characterizations of full-scale pore size distribution, porosity and permeability of coals: A novel methodology by nuclear magnetic resonance and fractal analysis. Int. J. Coal Geol. 2018, 196, 148–158. [Google Scholar] [CrossRef]
  5. Moore, T.A. Coalbed methane: A review. Int. J. Coal Geol. 2012, 101, 36–81. [Google Scholar] [CrossRef]
  6. Liu, X.F.; Nie, B.S. Fractal characteristics of coal samples utilizing image analysis and gas adsorption. Fuel 2016, 182, 314–322. [Google Scholar] [CrossRef]
  7. Liu, S.Q.; Sang, S.X.; Wang, G.; Ma, J.S.; Wang, X.; Wang, W.F.; Du, Y.; Wang, T. FIB-SEM and X-ray CT characterization of interconnected pores in high-rank coal formed from regional metamorphism. J. Pet. Sci. Eng. 2017, 148, 21–31. [Google Scholar] [CrossRef]
  8. Wang, G.C.; Ju, Y.W.; Yan, Z.F.; Li, Q.G. Pore structure characteristics of coal-bearing shale using fluid invasion methods: A case study in the Huainan—Huaibei Coalfield in China. Mar. Pet. Geol. 2015, 62, 1–13. [Google Scholar] [CrossRef]
  9. Song, Y.; Jiang, B.; Shao, P.; Wu, J.H. Matrix compression and multifractal characterization for tectonically deformed coals by Hg porosimetry. Fuel 2018, 211, 661–675. [Google Scholar]
  10. Golab, A.; Ward, C.R.; Permana, A.; Lennox, P.; Botha, P. High-resolution three-dimensional imaging of coal using microfocus X-ray computed tomography, with special reference to modes of mineral occurrence. Int. J. Coal Geol. 2013, 113, 97–108. [Google Scholar] [CrossRef]
  11. Pan, J.N.; Zhu, H.T.; Hou, Q.L.; Wang, H.C.; Wang, S. Macromolecular and pore structures of Chinese tectonically deformed coals studied by atomic force microscopy. Fuel 2015, 139, 94–101. [Google Scholar] [CrossRef]
  12. Guan, C.; Liu, S.; Li, C.; Wang, Y.; Zhao, Y. The temperature effect on the methane and CO2 adsorption capacities of Illinois coal. Fuel 2018, 211, 241–250. [Google Scholar] [CrossRef]
  13. Meng, Z.; Liu, S.; Li, G. Adsorption capacity, adsorption potential and surface free energy of different structure high rank coals. J Pet. Sci. Eng. 2016, 146, 856–865. [Google Scholar] [CrossRef]
  14. Jian, K.; Fu, X.; Ding, Y.; Wang, H.; Li, T. Characteristics of pores and methane adsorption of low-rank coal in China. J. Nat. Gas Sci. Eng. 2015, 27, 207–218. [Google Scholar] [CrossRef]
  15. Yi, L.C.; Yong, Q.; Tang, H. Particle size effect of pore structure of anthracite by mercury porosimetry. Nat. GasGe-Oscience 2015, 26, 1629–1639. [Google Scholar]
  16. Zhang, P.; Lu, S.; Li, J. Characterization of pore size distributions of shale oil reservoirs: A case study from Dongying sag, Bohai Bay basin China. Mar. Pet. Geol. 2019, 100, 297–308. [Google Scholar] [CrossRef]
  17. Cai, Y.; Li, Q.; Liu, D.; Zhou, Y.; Lv, D. Insights into matrix compressibility of coals by mercury intrusion porosimetry and N2 adsorption. Int. J. Coal Geol. 2018, 200, 199–212. [Google Scholar] [CrossRef]
  18. Gan, H.; Nandi, S.; Walker, P., Jr. Nature of the porosity in American coals. Fuel 1972, 51, 272–277. [Google Scholar] [CrossRef]
  19. Clarkson, C.R.; Solano, N.; Bustin, R.M.; Bustin, A.M.M.; Chalmers, G.R.L.; He, L. Pore structure characterization of North American shale gas reservoirs using USANS/SANS, gas adsorption, and mercury intrusion. Fuel 2013, 103, 606–616. [Google Scholar] [CrossRef]
  20. Friesen, W.; Ogunsola, O. Mercury porosimetry of upgraded western Canadian coals. Fuel 1995, 74, 604–609. [Google Scholar] [CrossRef]
  21. Day, S.; Fry, R.; Sakurovs, R. Swelling of Australian coals in supercritical CO2. Int. J. Coal Geol. 2008, 74, 41–52. [Google Scholar] [CrossRef]
  22. Friesen, W.I.; Mikula, R.J. Mercury porosimetry of coals: Pore volume distribution and compressibility. Fuel 1988, 67, 1516–1520. [Google Scholar] [CrossRef]
  23. Friesen, W.I.; Mikula, R.J. Fractal dimensions of coal particles. J. Colloid Interface Sci. 1987, 120, 263–271. [Google Scholar] [CrossRef]
  24. Harpalani, S.; Schraufnagel, R.A. Shrinkage of coal matrix with release of gas and its impact on permeability of coal. Fuel 1990, 69, 551–556. [Google Scholar] [CrossRef]
  25. Spitzer, Z. Mercury porosimetry and its application to the analysis of coal pore structure. Powder Technol. 1981, 29, 177–186. [Google Scholar] [CrossRef]
  26. Ritter, H.L.; Dake, L.C. Pressure porosimeter and determination of complete Macropore-Size distributions. Ind. Eng. Chem. Anal. Ed. 1945, 17, 782–786. [Google Scholar] [CrossRef]
  27. Toda, Y.; Toyoda, S. Application of mercury porosimetry to coal. Fuel 1972, 51, 199–201. [Google Scholar] [CrossRef]
  28. Dickinson, J.M.; Shore, J.W. Observations concerning the determination of porosities in graphites. Carbon 1968, 6, 937–941. [Google Scholar] [CrossRef]
  29. Debelak, K.A.; Schrodt, J.T. Comparison of pore structure in Kentucky coals by mercury penetration and carbon dioxide adsorption. Fuel 1979, 58, 732–736. [Google Scholar] [CrossRef]
  30. Jin, Y.; Zhao, M.; Liu, S.; Liu, X. Study on the effect of coal matrix compression on fractal characteristics of pore structure by mercury intrusion method. China Coal 2018, 43, 103–109. [Google Scholar]
  31. Liu, J.; Ren, B.; Wang, C. Study on coal full pore aperture distribution chaeacteristics considering coal matrix compression effect. Ind. Mine Autom. 2022, 48, 125–130. [Google Scholar]
  32. Han, B.B.; Qin, Y.; Zhang, Z.; Wang, G.; Yu, P. Study on coal compressibility and correction of compression amount based on compressibility of mercury injection test. Coal Sci. Technol. 2015, 43, 68–72. [Google Scholar]
  33. Zheng, S.; Yao, Y.; Zhang, S.; Liu, Y.; Yang, J. Insights into Multifractal Characterization of Coals by Mercury Intrusion Porosimetry. Energies 2019, 12, 4743. [Google Scholar] [CrossRef]
  34. Guo, X.Q.; Yao, Y.B.; Liu, D.M. Characteristics of coal matrix compressibility: An investigation by mercury intrusion porosimetry. Energy Fuels 2014, 28, 3673–3678. [Google Scholar] [CrossRef]
  35. Ettinger, I.L.; Zhupakhina, E.S. Method of determining porosity of mineral coals. Fuel 1960, 39, 387–392. [Google Scholar]
  36. Lu, J.L. Characterization of Pore Structure and Full Aperture Splicing of Coal with Different Coal Ranks. Ph.D. Thesis, China University of Mining and Technology, Xuzhou, China, 2021. [Google Scholar]
  37. Cheng, L.; Li, W. Tectonic coal matrix compression characteristics based on mercury intrusion method and its impact on pore structure. Saf. Coal Mines 2016, 47, 175–179. [Google Scholar]
  38. Shao, P.; Wang, X.; Song, Y.; Li, Y. Study on the characteristics of matrix compressibility and its influence factors for different rank coals. J. Nat. Gas Sci. Eng. 2018, 56, 93–106. [Google Scholar] [CrossRef]
  39. Yang, Q.L.; Xue, J.H.; Li, W.; Du, X.; Ma, Q.; Zhan, K.; Chen, Z. Comprehensive evaluation and interpretation of mercury intrusion porosimetry data of coals based on fractal theory, Tait equation and matrix compressibility. Fuel 2021, 298, 120823. [Google Scholar] [CrossRef]
  40. Yang, Q.L.; Li, W.; Jin, K. Supercritical CO2 interaction induced pore morphology alterations of various ranked coals: A comparative analysis using corrected mercury intrusion porosimetry and low-pressure N2 gas adsorption. ACS Omega 2020, 5, 9276–9290. [Google Scholar] [CrossRef]
  41. Zhang, J.J.; Wei, C.T.; Zhao, J.L.; Ju, W.; Chen, Y.; Tamehe, L.S. Comparative evaluation of the compressibility of middle and high rank coals by different experimental methods. Fuel 2019, 245, 39–51. [Google Scholar] [CrossRef]
  42. Zhang, B.; Zhu, J.; He, F.; Jiang, Y. Compressibility and fractal dimension analysis in the bituminous coal specimens. AIP Adv. 2018, 8, 075118. [Google Scholar] [CrossRef]
  43. Li, W.; Liu, H.F.; Song, X.X. Multifractal analysis of Hg pore size distributions of tectonically deformed coals. Int. J. Coal Geol. 2015, 144, 138–152. [Google Scholar] [CrossRef]
  44. Yang, Y.; Li, M.; Zhang, H.; Mi, Z.; Peng, C.; Wang, N.; Chan, Y. Evaluation of control factors and favourable zones for coalbed methane enrichment and high production in the mid-deep southern Qinshui Basin. Nat. Gas Geosci. 2024, 8, 1–12. [Google Scholar]
  45. Ren, J.; Zhang, Z.; Xing, L.; Wang, P.; Yu, W.; Long, P. The Influence of Coal Body Structure on Coal Fines’ Output Characteristics in the Southern Qinshui Basin. Processes 2024, 12, 656. [Google Scholar] [CrossRef]
  46. Jiang, L.; Song, Y.; Zhao, W.; Bo, D.; Liu, S.; Hao, J. Main controlling factor of coalbed methane enrichment area in southern Qinshui Basin, China. J. Pet. Explor. Prod. Technol. 2024, 14, 165–173. [Google Scholar] [CrossRef]
  47. Liu, J.; Chang, S.; Zhang, S.; Li, Y.; Hao, Y.; He, G.; He, Y.; Liu, B. Prediction of coalbed methane content based on seismic identification of key geological parameters: A case in a study area, Southern Qinshui Basin. Acta Geophys. 2023, 71, 2645–2662. [Google Scholar] [CrossRef]
  48. Yang, C.; Qiu, F.; Xiao, F.; Chen, S.; Fang, Y. CBM Gas Content Prediction Model Based on the Ensemble Tree Algorithm with Bayesian Hyper-Parameter Optimization Method: A Case Study of Zhengzhuang Block, Southern Qinshui Basin, North China. Processes 2023, 11, 527. [Google Scholar] [CrossRef]
  49. Wang, H.; Yao, Y.; Li, Z.; Yang, Y.; Yi, J.; Qiu, Y.; Zhou, S. Multi-stage gas diffusion and its implications for the productivity of coalbed methane in the southern Qinshui Basin, north China. Front. Earth Sci. 2023, 17, 109–120. [Google Scholar] [CrossRef]
  50. Han, W.; Li, Y.; Wang, Y.; Ni, X.; Wang, L.; Zhou, Y. Characterization of Coal Fines and their Production Controlling Factors: A Case Study from Southern Qinshui Basin, China. Nat. Resour. Res. 2023, 32, 1777–1794. [Google Scholar] [CrossRef]
  51. SY/T 5346-2005; Rock Capillary Pressure Measurement. Petroleum Industry Press: Beijing, China, 2005.
  52. Gao, Y.; Cao, J.; Zhang, S.; Li, Z. Analysis of the Pore Structure and Fractal Characteristics of Coal and Gas Outburst Coal Seams Based on Matrix Compression Correction. Sustainability 2023, 15, 12670. [Google Scholar] [CrossRef]
  53. Liu, D.; Jia, Q.; Cai, Y.; Gao, C.; Qiu, F.; Zhao, Z.; Chen, S. A new insight into coalbed methane occurrence and accumulation in the Qinshui Basin, China. Gondwana Res. 2022, 111, 280–297. [Google Scholar] [CrossRef]
  54. Pape, H.; Tillich, J.E.; Holz, M. Pore geometry of sandstone derived from pulsed field gradient NMR. J. Appl. Geophys. 2006, 58, 232–252. [Google Scholar] [CrossRef]
  55. Jin, Y.; Zhu, Y.B.; Li, X.; Zheng, J.L.; Dong, J.B. Scaling Invariant Effects on the Permeability of Fractal Porous Media. Transp. Porous Media 2015, 109, 433–453. [Google Scholar] [CrossRef]
  56. Li, Y.; Song, D.; Liu, S.; Ji, X.; Hao, H. Evaluation of pore properties in coal through compressibility correction based on mercury intrusion porosimetry: A practical approach. Fuel 2021, 291, 0016–2361. [Google Scholar] [CrossRef]
  57. Zhang, B.; Liu, W.; Liu, X. Scale-dependent nature of the surface fractal dimension for bi- and multi-disperse porous solids by mercury porosimetry. Appl. Surf. Sci. 2006, 253, 1349–1355. [Google Scholar] [CrossRef]
  58. Yao, Y.B.; Liu, D.M.; Tang, D.Z.; Tang, S.H.; Huang, W.H.; Liu, Z.H.; Che, Y. Fractal characterization of seepage-pores of coals from China: An investigation on permeability of coals. Comput. Geosci. 2009, 35, 1159–1166. [Google Scholar] [CrossRef]
  59. Menger, K. Dimensionstheorie; Vieweg+ Teubner Verlag Publishers: Wiesbaden, Germany, 1928; 324p. [Google Scholar]
Figure 1. Structural outline map of the southern Qinshui Basin.
Processes 12 01928 g001
Figure 2. Experimental samples and equipment.
Processes 12 01928 g002
Figure 3. Mercury intrusion and extrusion curves of six selected coals. (Type I (Samples DD and QX): the mercury intrusion and extrusion curves exhibit similar slopes with no significant hysteresis loop, indicating predominantly semi-open pores with poor connectivity, which is not conducive to gas flow. Type II (Samples TL-8, WK, and YY): the mercury intrusion and extrusion curves have similar slopes at high pressures but demonstrate hysteresis at low pressures, suggesting poor connectivity in the transitional pores segment and better connectivity in the more significant pore segment. Type III (Sample TL-2): the curve indicates that as the pressure increases, the mercury intrusion volume significantly rises at lower pressures, with a wide curve opening and evident hysteresis, indicating predominantly open pores with good connectivity, which is not favorable for gas storage).
Processes 12 01928 g003
Figure 4. Adsorption–desorption curves of six selected coals. (Type I curves (Samples No. DD, WK, and YY) exhibit significant adsorption–desorption hysteresis loops within the P/P0 range of 0.4–1, characterized by a sharp drop, indicating the existence of bottleneck breakthroughs and ink-bottle-shaped pores. Type II curves (Sample No. QX) display nearly parallel adsorption and desorption curves with indistinct hysteresis loops, signifying half-open, plate-like pores. Type III curves (Samples No. TL-2 and TL-8) resemble Type II curves but exhibit more distinct hysteresis loops in the P/P0 range of 0.7–1, which indicates the presence of open plate-like pores).
Processes 12 01928 g004
Figure 5. Linear variation of mercury intrusion volume with pressure for coal samples.
Processes 12 01928 g005
Figure 6. The fitted curve of KC with varying Ro,max.
Processes 12 01928 g006
Figure 7. Comparison of traditional correction method KC1 and statistical correction method KC2.
Processes 12 01928 g007
Figure 8. Cumulative volume of mercury ingress before and after calibration.
Processes 12 01928 g008
Figure 9. The correction results of PSD and the aperture ratio. (The pore structure of the coal samples predominantly comprises macropores, followed by mesopores and transitional pores, with micropores constituting the most minor proportion. Compared to the mercury intrusion volumes before correction, the 3–25 nm pore radius range decreases the mercury intrusion volume by 91.75–96.40% after correction).
Processes 12 01928 g009
Figure 10. The changes in fractal dimension D2 before and after MIP data correction.
Processes 12 01928 g010
Figure 11. The correlation between pressure and dV/dP before MIP data adjustment. (The D2 values range from 3.186 to 3.339, indicating fractal dimensions between 3 and 4).
Processes 12 01928 g011
Figure 12. The correlation between pressure and dV/dP after MIP data correction. (The adjusted fractal dimension D2 ranges from 2.792 to 2.975 within the expected range of 2 to 3).
Processes 12 01928 g012
Table 1. Ro,max values and coal matrix compression coefficients for different coal samples.
Sample No.Ro,max/%Kc/(10−10 m2/N)Error Rate
Kc1Kc2
QX1.830.876 0.925 5.25%
DD1.591.184 1.233 3.97%
YY2.470.897 0.898 0.11%
WK2.540.984 0.980 0.35%
TL-21.820.911 0.940 3.12%
TL-81.641.137 1.178 3.50%
Disclaimer/Publisher’s Note: The statements, opinions and data contained in all publications are solely those of the individual author(s) and contributor(s) and not of MDPI and/or the editor(s). MDPI and/or the editor(s) disclaim responsibility for any injury to people or property resulting from any ideas, methods, instructions or products referred to in the content.

