Article

The Physical Properties and Crystal Structure Changes of Stabilized Ice Cream Affected by Ultrasound-Assisted Freezing

by
Anna Kamińska-Dwórznicka
1,* and
Anna Kot
2,*
1
Department of Food Engineering and Process Management, Faculty of Food Sciences, Warsaw University of Life Sciences (WULS-SGGW), Nowoursynowska 159C, 02-776 Warsaw, Poland
2
Department of Functional and Organic Food, Institute of Human Nutrition Sciences, Warsaw University of Life Sciences (WULS-SGGW), Nowoursynowska 159C, 02-776 Warsaw, Poland
*
Authors to whom correspondence should be addressed.
Processes 2024, 12(9), 1957; https://doi.org/10.3390/pr12091957
Submission received: 31 July 2024 / Revised: 10 September 2024 / Accepted: 10 September 2024 / Published: 12 September 2024

Abstract

:
In this study, the effect of ultrasound-assisted freezing with frequencies of 21.5 and 40 kHz, and a power of 2.4 kW in the chopped mode of milk ice cream in comparison to a standard freezer on the freezing course and formed crystal structure was examined. The first part of the research included the preparation of an ice cream mixture on the basis of skimmed milk with the addition of an emulsifier, locust bean gum, xanthan gum, ι-carrageenan and a reference mixture without stabilizer addition. Ultrasound-assisted freezing shortened the processing time of both stabilized and non-stabilized ice cream. Stabilized samples of milk ice cream exposed to ultrasound (US) at a frequency of 21.5 kHz were characterized by the most homogeneous structure, consisting of crystals with the smallest diameters among all of the tested samples, the size of which, after 3 months of storage at −18 °C, was 7.8 µm (for the reference sample, it was 14.9 µm). The ice recrystallization inhibition (IRI effect) in the samples after US treatment with a frequency of 40 kHz was also observed, regardless of the addition of stabilizers, which may suggest that sonication with these parameters could replace or limit the addition of these substances.

1. Introduction

The most popular types of ice cream include milk ice cream, obtained by freezing a liquid pasteurized ice cream mixture, consisting of whole or skimmed milk (in liquid, concentrated or powdered form), cream, sugar and various flavor additives. The consistency and melting of ice cream are strongly related to the coalescence of destabilized fat globules that occurs during freezing, and the ratio of free and bound water content [1]. When freezing an ice cream mixture, a three-dimensional network of partially aggregated fat globules is formed, which surrounds air bubbles, stabilizing the air phase and, as a result, improving the ice cream’s resistance to melting [2]. Emulsifiers and stabilizers are usually added to improve consistency and limit the unfavorable phenomenon of ice recrystallization. It occurs due to temperature fluctuations during storage and transportation, causing unfavorable ice crystals to grow. This is the main problem in the production of frozen food, especially ice cream, but with the appropriate use and combination of stabilizers, which are water-binding polysaccharides, as well as the relevant selection of other ingredients, it is possible to obtain a product that is more resistant to temperature changes [3].
By improving the conditions of the heat transfer process during ultrasound-assisted freezing in the production of milk ice cream, the rate of ice crystal nucleation is increased and freezing is faster, while controlling the size of ice crystals. Acoustic cavitation initiated by ultrasonic waves causes micro-streaming, which promotes the formation of ice nuclei, accelerates heat and mass transfer, and regulates the shape and size distribution of ice crystals during freezing. Moreover, the formation of high pressure by the breakdown of cavitation bubbles contributes to an increase in the equilibrium freezing temperature of the liquid and, as a result, to the nucleation of crystals, which are smaller in size in the finished product. This may also shorten the freezing process time. As a result of these micro turbulences, secondary nucleation occurs, which involves cracking and breaking the structure of crystals that have stopped forming [4].
Sonication is a promising method in ice cream production that can shorten processing time, improve quality and efficiency, and ensure safety while extending the shelf life. It was discovered that the use of ultrasound activates phase changes in biological cells thanks to cavitation. As a result of the emission of acoustic waves, gas bubbles are formed, which increase in volume and disappear rapidly. The second effect is the alternating dynamic compression and expansion of the material sample by an acoustic wave acting in the material, with additional solid–liquid cavitation [5,6]. During the crystallization process, it controls the growth of ice crystals and limits sensory and nutrient changes as a result of the non-thermal process. When used during the homogenization of the mixture, a more effectively dispersed emulsion is created, and the resulting ice cream has a smoother and softer texture due to limited crystal growth [7]. It was already observed that ultrasound homogenization contributed to smaller ice crystals and had a positive influence on the ice crystal structure in milk ice cream. Ice crystal diameters lower than even 10 µm were observed for the sample after US homogenization and without any stabilizer addition [8].
Currently, the majority of research on ultrasonic-assisted freezing focuses on plant and meat materials, while few publications concern food ice cream. Their example mainly examined the influence of ultrasound in the pasteurization or homogenization process, not the freezing process itself.
The ultrasonic pasteurization and homogenization of an ice cream mixture with the addition of tomato seed oleo-gel were tested [9]. These treatments allowed for reducing the size of the ice crystals formed during freezing and accelerated the formation of a three-dimensional structure. Moreover, during pasteurization, ultrasonic waves reduced the fat and carbohydrate content, lowering the overall energy value of the ice cream. In turn, using the example of mango sorbet showed the effect of ultrasonic-assisted freezing on the crystal structure, obtaining a product with smaller crystals, and a more even distribution and regular shape. This way, the quality of the sorbet was improved, while the freezing time was reduced, which is important from an economic point of view [10]; however, it is also pivotal to check this effect on the classic milk ice cream as a product with a higher fat and protein content. It is important to answer the question about the role of US not during the homogenization part, but during the freezing of the emulsion.

2. Materials and Methods

2.1. Materials

For milk ice cream production, the following ingredients were used: 45.5% addition of 0.5% fat UHT milk (Mlekpol, Grajewo, Poland), 7% milk powder, low-fat content, 40% or 30% fat cream (Piątnica, Poland), 7% sucrose (Diamant, Miejska Górka, Poland), 0.4% emulsifier (Fooding, Shanghai, China) and 0.1% stabilizers (for the control sample, 0.1% more of powdered milk instead). The mixture recipe was modified by the addition of stabilizers: 0.01% ι-carrageenan (Sigma for Merck, St. Louis, MO, USA), 0.02% xanthan gum (Fooding, Shanghai, China) and 0.07% LBG (Locust Bean Gum) (Fooding, Shanghai, China).

2.2. Preparation of Ice Cream Mixes

First, the dry and liquid ingredients were weighed and mixed separately, then combined and homogenized using a BOSH MaxoMixx blender (Gerlingen, Germany) with a power of 750 W for about 2 min to obtain a uniform mixture.
Then, the ice cream mixes were pasteurized at a temperature of 75 °C for 1.5 min in Thermomix TM31-1 and poured into a glass beaker, which was placed in ice water and left to lower the temperature to 25 °C. After that, 100 mL was isolated from the cooled mixture and prepared for the other analysis. The remaining volume was stored at 4 °C for 24 h for the maturation step of the ice cream mixture.

2.3. Physicochemical Property Evaluation

2.3.1. Density

The density of the prepared ice mixture was determined using the pycnometric method using a 25 cm3 vacuum pycnometer; the method has already been shown [1,11]. The density value of the mixture was obtained as the ratio of mass to the known volume of the sample. The measurement was performed in triplicate.

2.3.2. Overrun

To determine the overrun (O) of the finished ice cream, a glass cylinder with a volume of 25 cm3 was weighed, then filled with the sample and weighed again. This way, the ice mixture was treated before and after freezing, obtaining the masses of samples w1 and w2, respectively, to the formula [11,12]:
O   [ % ] = w 1 w 2 w 2 × 100 %

2.3.3. pH

The pH value was measured with the Electrode Elmetron EPP3t (Zabrze, Poland) with the temperature sensor Pt-1000B. The measurement was always taken under the same conditions of the temperature and humidity in the same laboratory. The electrode was immersed in the sample of the tested ice cream, and the result was displayed on a small screen of the device. The test was performed in triplicate, according to the device producer’s recommendation.

2.3.4. Freezing Point Analysis

The freezing point of the stabilized and non-stabilized ice cream mixtures was determined using a Marcel OS 3000 osmometer (Marcel, Zielonka, Poland), as also shown in the previous study [10]. The device measures the freezing temperature for 10 µL of the sample with an accuracy of 0.002 °C. Measurements were performed in triplicate.

2.4. Freezer Ice Cream Production

The milk ice cream mixture preparation samples were then frozen in two small freezers, G3 Ferrari G20035 Cremosa (Modena, Italy). The freezing conditions for stabilized and non-stabilized samples were exactly 40 min of the process. The change of temperature was recorded in 60 s intervals by the thermocouples connected to the MPI-LAB temperature recorder (Metronic Instruments, North Shields, UK) connected to the PC. After freezing time, the temperature of both samples was at the level of −6 °C. Frozen samples of milk ice cream were packed into 2 boxes for 300 mL (for each variant) and stored for further microscopy analysis after 24 h, 1 week, 1 and 3 months.

2.5. Ultrasound-Assisted Freezing

The cubic plastic boxes containing 300 mL of ice creams were placed in a bath of a two-chamber cryostat-type freezer made of stainless steel, with an aggregate for freezing closed and open samples, filled with the cooling liquid (standard coolant—propylene glycol, Borygo, Boryszew ERG, Poland). The cryostat allows for the study of ultrasound-assisted freezing processes on the principle of immersion, i.e., by immersion in a non-boiling liquid. The ultrasound frequency of the right chamber was at the level of 21.5 kHz ± 10% and the left chamber at 40 kHz ± 10%, power 2.4 kW (chopped operation), and it has already been shown in the previous study [10]. The process was carried out in two chambers at the temperature of the bath −12 °C for the proper time to adjust −6 °C in the center of each sample. The following variants were carried out:
  • Cryostat without the US for samples with (CS) and without stabilizers (CNS);
  • Cryostat 21.5 kHz for samples with (CS21) and without stabilizers (CNS21), 10 min of US treatment, chopped operation;
  • Cryostat 40 kHz for samples with (CS40) and without stabilizers (CNS40), 10 min of US treatment, chopped operation.
The temperature changes were monitored using two thermocouples placed in the thermal centers of the samples in both chambers (records were taken every 120 s by the MPI-LAB temperature recorder connected to the PC). The freezing process was carried out to achieve −6 °C in the thermal center of the tested samples (the temperature was chosen according to the temperature of the samples frozen in a conventional freezer).
In order to analyze the course of freezing for both methods (US cryostat and conventional freezer), the recorded data were used to prepare freezing curves for each method and each sample (Figure 1). The method has already been described by the authors [13]. Freezing processes and measurements were performed in triplicate.

2.6. Microscopy Structure Analysis

To prepare the sample for image analysis (after the production cycle), a small piece of ice cream was taken from the center of the plastic box from at least 2 different locations, a minimum of 3 cm away from the ice cream surface, and placed on an object slide by using a spatula and then covered by the cover slip placed on the top of the sample (which gives at least two slides for each sample). The samples were prepared in a freezing chamber and transferred into a microscope occupied with the cooling system (Linkam LTS420). This system eliminated the influence of the ambient temperature.
The recrystallization process was then analyzed based on the images of ice crystals taken after 24 h, 1 week, 1 and 3 months at a temperature of −18 °C. A microscope (Olympus BX53) with the cooling system Linkam LTS420, with 10× and 50× lenses and a camera (Olympus SC50), was used. The microscope was occupied with an LED light source with a power equivalent to 30 W for a halogen lamp. Camera settings: exposure time 31 µs–2.74 s, pixel size 2.2 × 2.2 µm, refresh 15 frames per second.
The obtained images were then analyzed using NIS Elements D software. From 300 to 500 crystals were manually marked for a particular sample, and then the area, equivalent diameter and standard deviation were calculated using the NIS Elements D Imaging software (version 5.30.00, Nikon), based on the method used before [10].

2.7. Statistical Analysis

For the statistical analysis of the obtained results (in order to determine the effect of the addition of stabilizers), a one-way analysis of variance was used in a completely random design, and homogeneous groups were determined using the Tukey test at the significance level of α = 0.05. The R programming language was used in the R Commander environment (version 4.3.0).
The freezing curves were prepared based on the temperature changes, using Microsoft Excel 365 Office (version 2208, 2022). Then, regression curves were plotted on their basis, obtaining the corresponding equations, and regression coefficients were compared using a one-way analysis of variance and the Tukey test.
The frequency distribution of the crystal size was computed using Microsoft Excel (version 2208, 2022) macro data analysis. The relative frequency of any class interval was calculated as the number of crystals in that class divided by the total number of crystals and expressed as a percentage. The parameter X50 was analyzed as an average diameter (DA) for 50% of crystals in the sample. The average diameter (DA) and standard deviations (SD) of each class were also calculated. The method has already been shown [10,13].

3. Results and Discussion

3.1. Physicochemical Properties of Ice Cream

The density of the ice cream mixture affects the overrun value of the finished ice cream and depends mainly on the composition of the mixture, i.e., the content of fat-free dry matter, sugars and stabilizers. Generally, its value is estimated in the range of 1.0544–1.1232 g/cm3 and the addition of stabilizers could significantly increase the density of ice cream mixtures [14]. Statistical analysis for the obtained ice cream mixes did not show a significant difference (Table 1); therefore, it was concluded that the stabilizing additives did not affect the density of the examined samples.
It was proved that a stabilizing mix of LBG and ι-carrageenan with the combination of guar gum significantly increased the density of ice cream based on whey [1]; however, this effect could be related to the whey protein properties. Therefore, the negative effect of the high density of the ice cream mix on the overrun might have been observed [8].
During mixing and freezing, reactions of proteins and surfactants occur, resulting in the formation and stabilization of the ice cream mixture as a foam [15]. In this particular research, ice cream with added stabilizers contained in its structure 25.2% air, thus having a higher overrun value compared to ice cream without the addition of stabilizers (overrun at the level of 16.4%) (Table 1). Hydrocolloids affect the degree of aeration of the ice cream with varying effectiveness, and depend on the type, presence and concentration of other ingredients, including another hydrocolloid and its synergistic effect [3,16]. It was also proved [17] that the overrun of milk ice cream ranged from 65.04% to 72.54%; nonetheless, it is strictly dependent on the ice cream recipes [3]. According to research by Kot et al. (2023) and Romulo et al. (2021) [8,15], the use of locust bean gum increases the aeration level of ice cream more effectively than the addition of guar gum or a combination of these hydrocolloids. In turn, other studies observed that the addition of xanthan gum to rice ice cream resulted in better aeration than the addition of guar gum [18]. Moreover, it has already been observed that ι-carrageenan addition improves milky ice cream aeration (overrun higher than 30%) and elongated the melting time of the tested samples [8].
The pH of the tested samples did not show a significant difference (Table 1), which has already been presented for stabilized and non-stabilized whey and milky ice cream [1,8].
An important ingredient of any type of ice cream is carbohydrates, which lower the freezing point of the ice cream mixture [8,19,20]. Ice cream without stabilizers had a lower freezing point than the reference sample without any addition (Table 1). Góral et al. (2018) examined the freezing point of ice cream based on a coconut drink with different levels of LBG addition, and they discovered that the higher concentration of LBG lowered the freezing point of the examined samples [12]. On the other hand, it was also proved that the addition of ι-carrageenan did not significantly influence the freezing point of milky ice cream in comparison to the addition of its hydrolysates with a lower molecular mass [8].

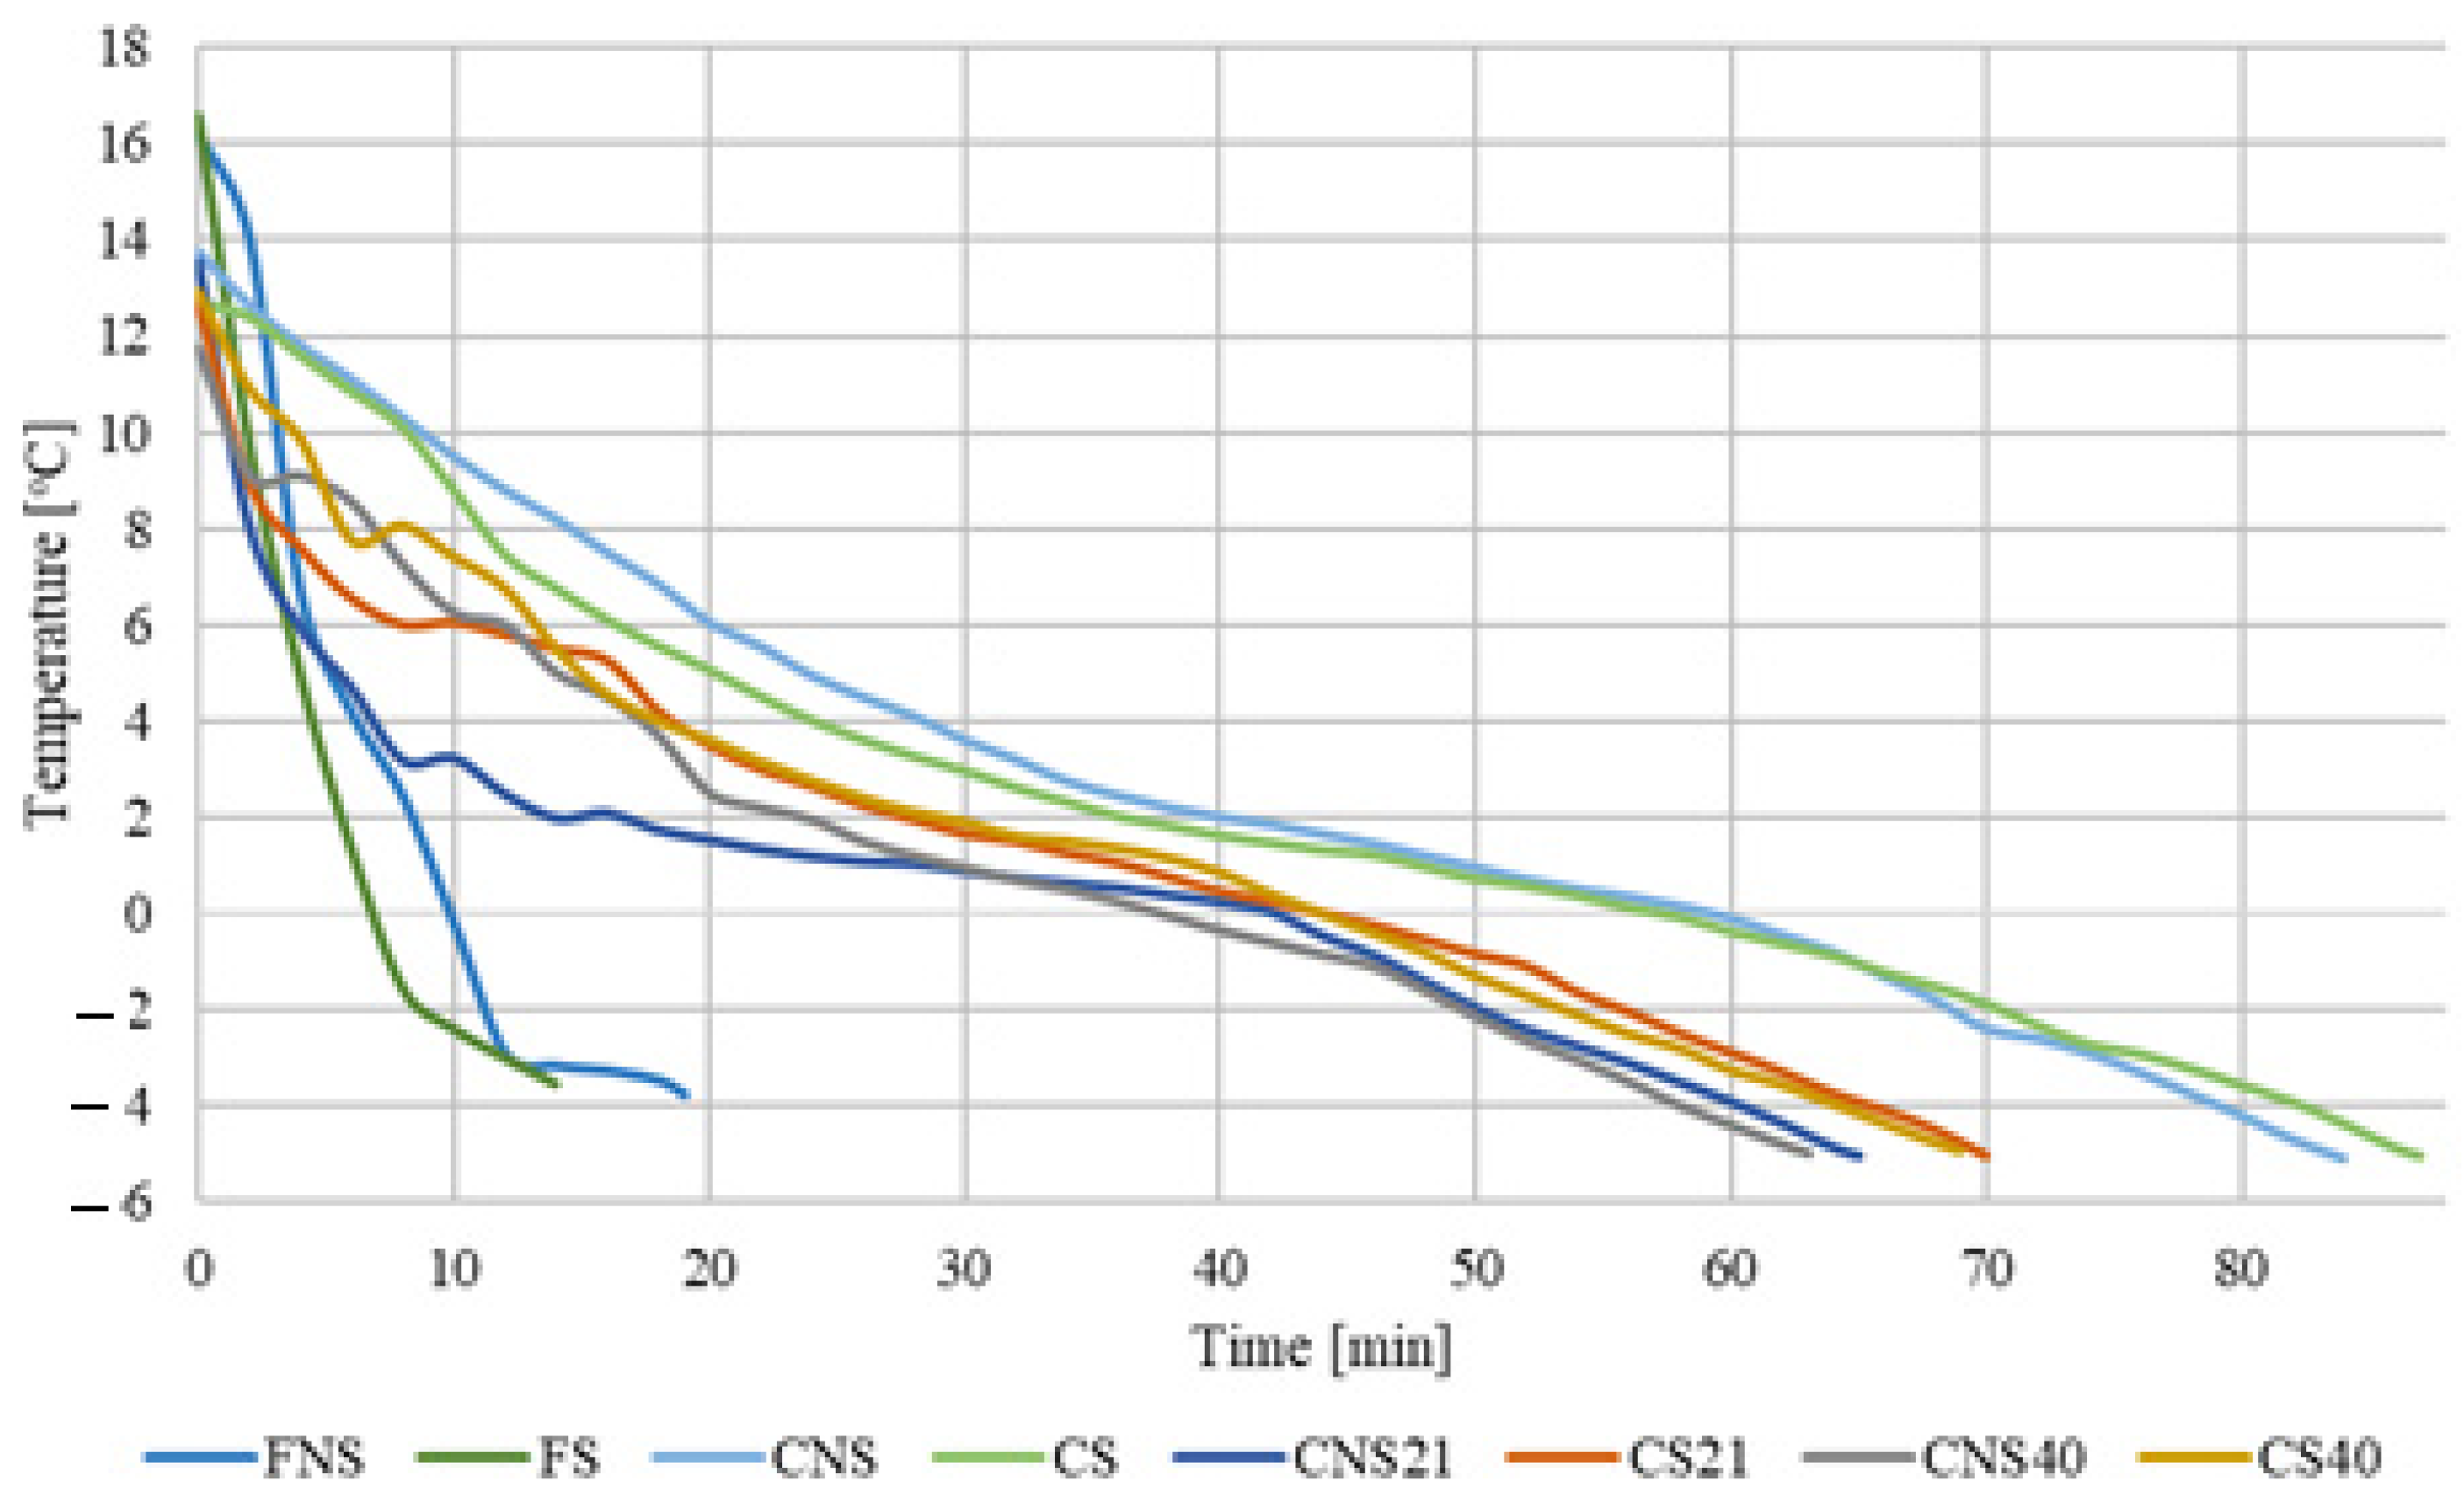
3.2. Freezing Course Analysis

The time and course of freezing are related to the arrangement and size of ice crystals. By shortening the process time, it is possible to create smaller and more evenly distributed crystals in the sample, while improving the quality of frozen food [3,13].
Based on the graph of freezing curves (Figure 1) and the values of regression coefficients (statistical analysis—Supplementary Materials, Figure S1), it can be concluded that the course of freezing in the freezer of both examined samples was similar. The lack of significant statistical differences indicates the lack of influence of stabilizers on the course of freezing and the linearity of temperature changes during it. Therefore, the use of a combination of locust bean gum, xanthan gum and ι-carrageenan did not affect the nature of freezing. In research on the freezing process of strawberry sorbet, it was found that the addition of a combination of κ- and ι-carrageenan slowed down the freezing rate.
In the immersion method under the influence of sonication, the freezing time was effectively shortened, regardless of the set frequency compared with the freezing time of the reference sample (Figure 1, Table 2).
The regression coefficient curves obtained from the equations (statistical analysis—Supplementary Materials, Figure S2 and Figure S3) show that the freezing curves are parallel to each other, and the course of freezing for each of the cryostat samples did not differ significantly. Therefore, ultrasound did not relevantly affect temperature changes during the process, which is surprising because it shortened its time. It is possible that during the emission of waves with a frequency of 40 kHz, simultaneous cavitation and heat generation were more intense, and therefore, more temperature fluctuations were observed than during freezing at a frequency of 21.5 kHz (Figure 1). This would also explain the lack of influence of the frequency of the given waves on the freezing time (Table 2), because during sonication at a higher frequency, more heat was released, which required a longer cooling time for the product. In theory, freezing should be accelerated as a result of intensified cavitation [6].
The reason for this result could be the even distribution of heat throughout the product, caused by microturbulence in the coolant that create a mixing effect. Moreover, cavitation effects contribute to the disintegration of air bubbles, which hinder heat conduction and effective freezing [21]. Their removal by ultrasonic waves allows for this process to be accelerated. The factors explaining this effect may be the same as in the case of ice cream without stabilizers, i.e., more uniform cooling of the product and reduced air insulation. As in the case of ice cream without stabilizers, the statistical analysis excluded the influence of stabilizers on the effect of ultrasound; therefore, in the production of dairy ice cream with the recipe given in this study, sonication can be considered as a treatment beneficial in terms of freezing time, regardless of the presence of added stabilizers. The same effect was also noticed for sorbet frozen in similar conditions [10]. In this sorbet study, despite similar conditions, the total time for sample freezing was much shorter (not longer than 16 min in cryostat) than for milky ice cream in this particular study (Table 2). This effect can be explained by the different water content of the ice cream mixes and totally different basal ingredients with a higher fat content. The presence of fat globules in milky ice cream and air bubbles pressed into the mixture during preparation could influence the heat transfer of the freezing process that is US-assisted, which was also already confirmed in the previous study [21,22,23].
In previous research [24], the ultrasound effect was used in the process of freezing chicken breast samples in a cooling tunnel with forced air flow, which shortened the total freezing time by approximately 11%. A similar conclusion was reached by [6], who found that thanks to the use of ultrasonic waves, the process of freezing potato samples was significantly shortened. In turn, in carp and pork samples, a reduction in the size and more uniform distribution of ice crystals was observed after ultrasonic-assisted immersion freezing during 180 days of storage compared to the samples air-frozen and immersion-frozen without sonication.

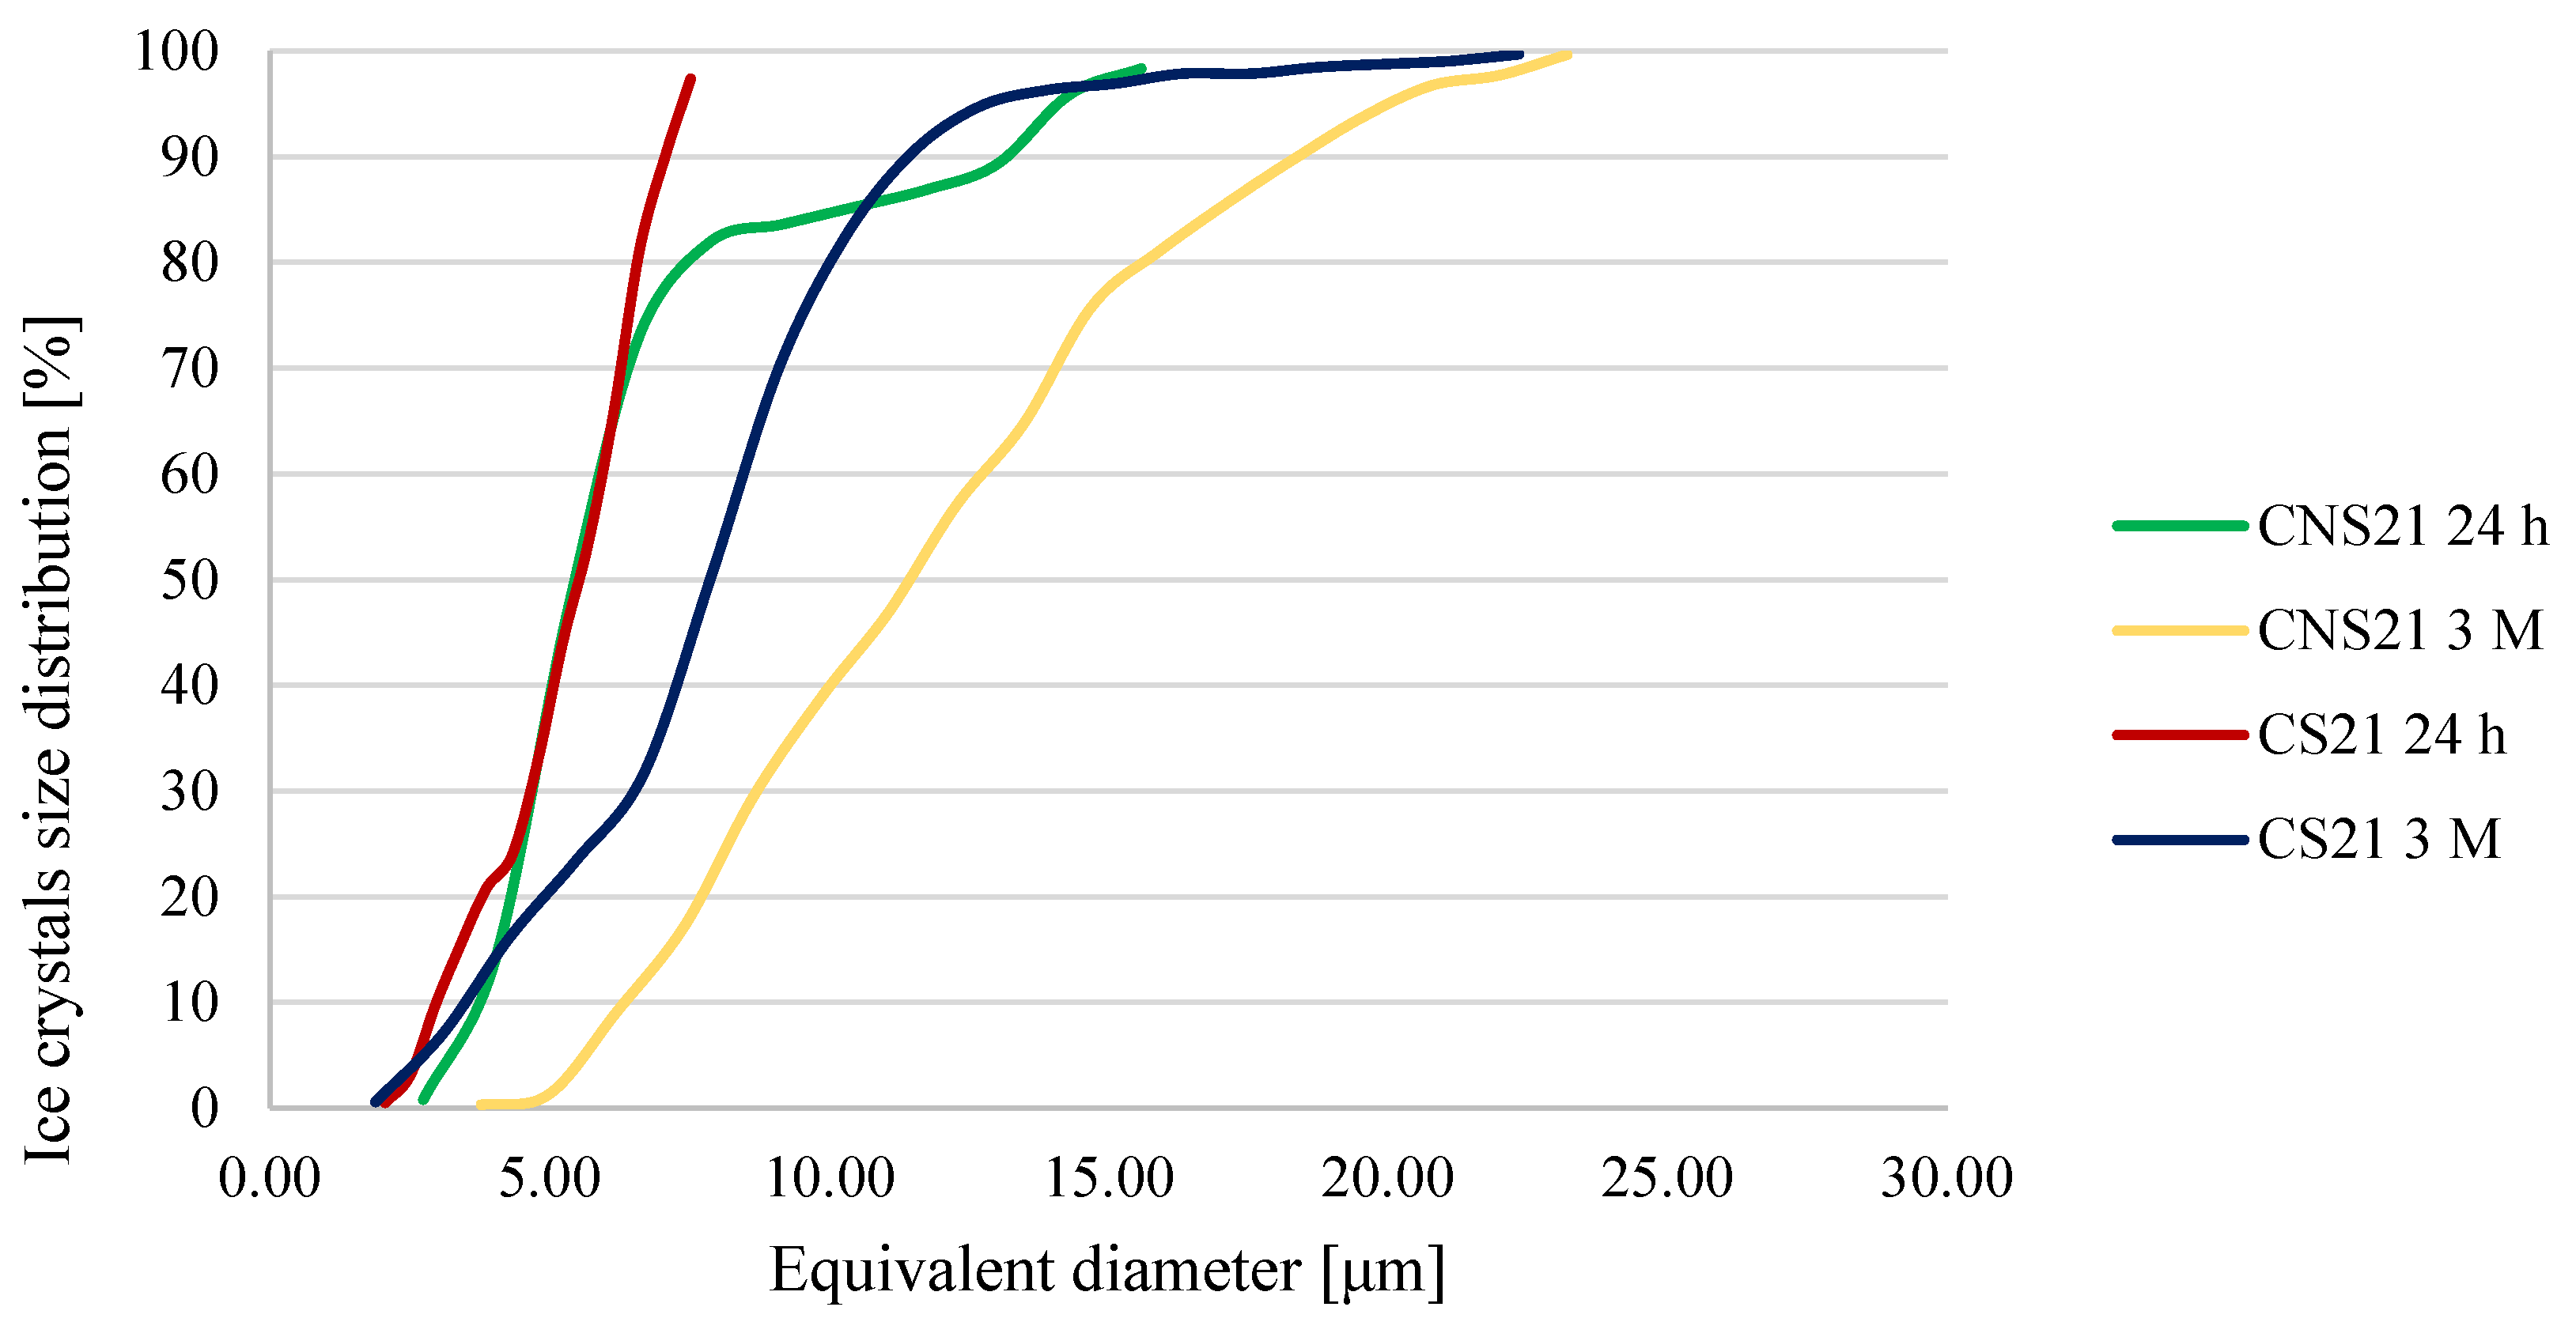
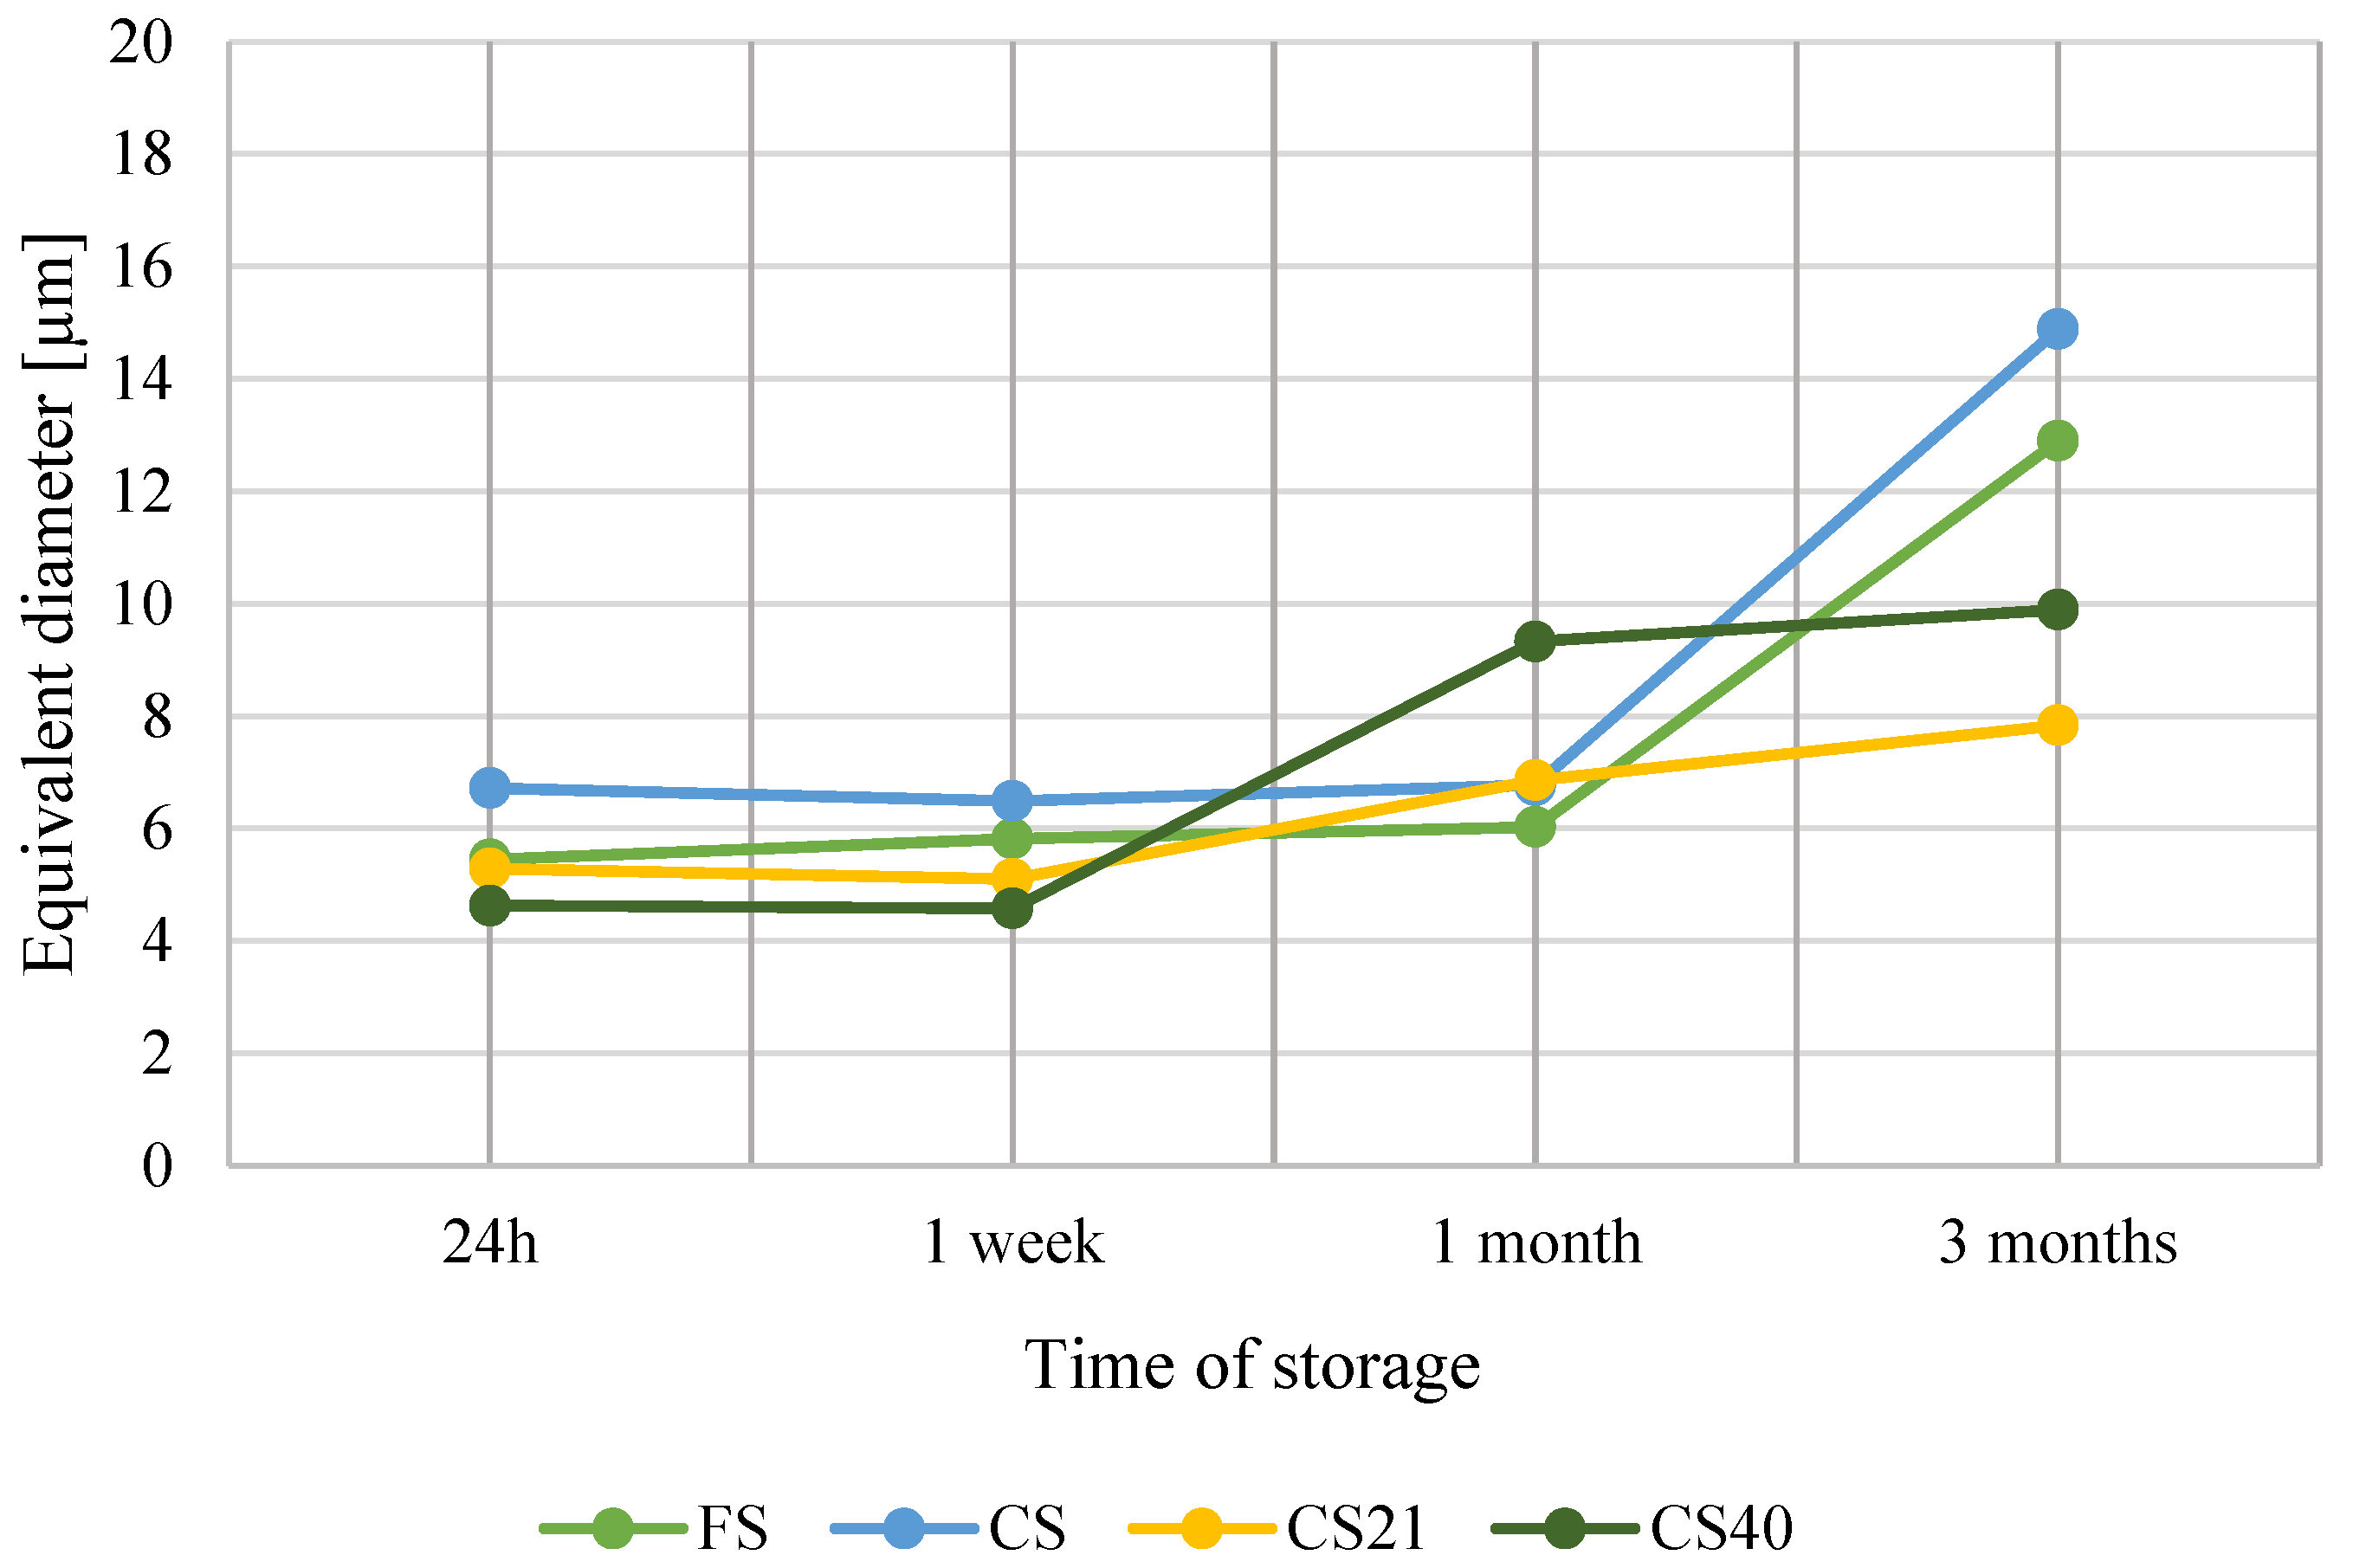
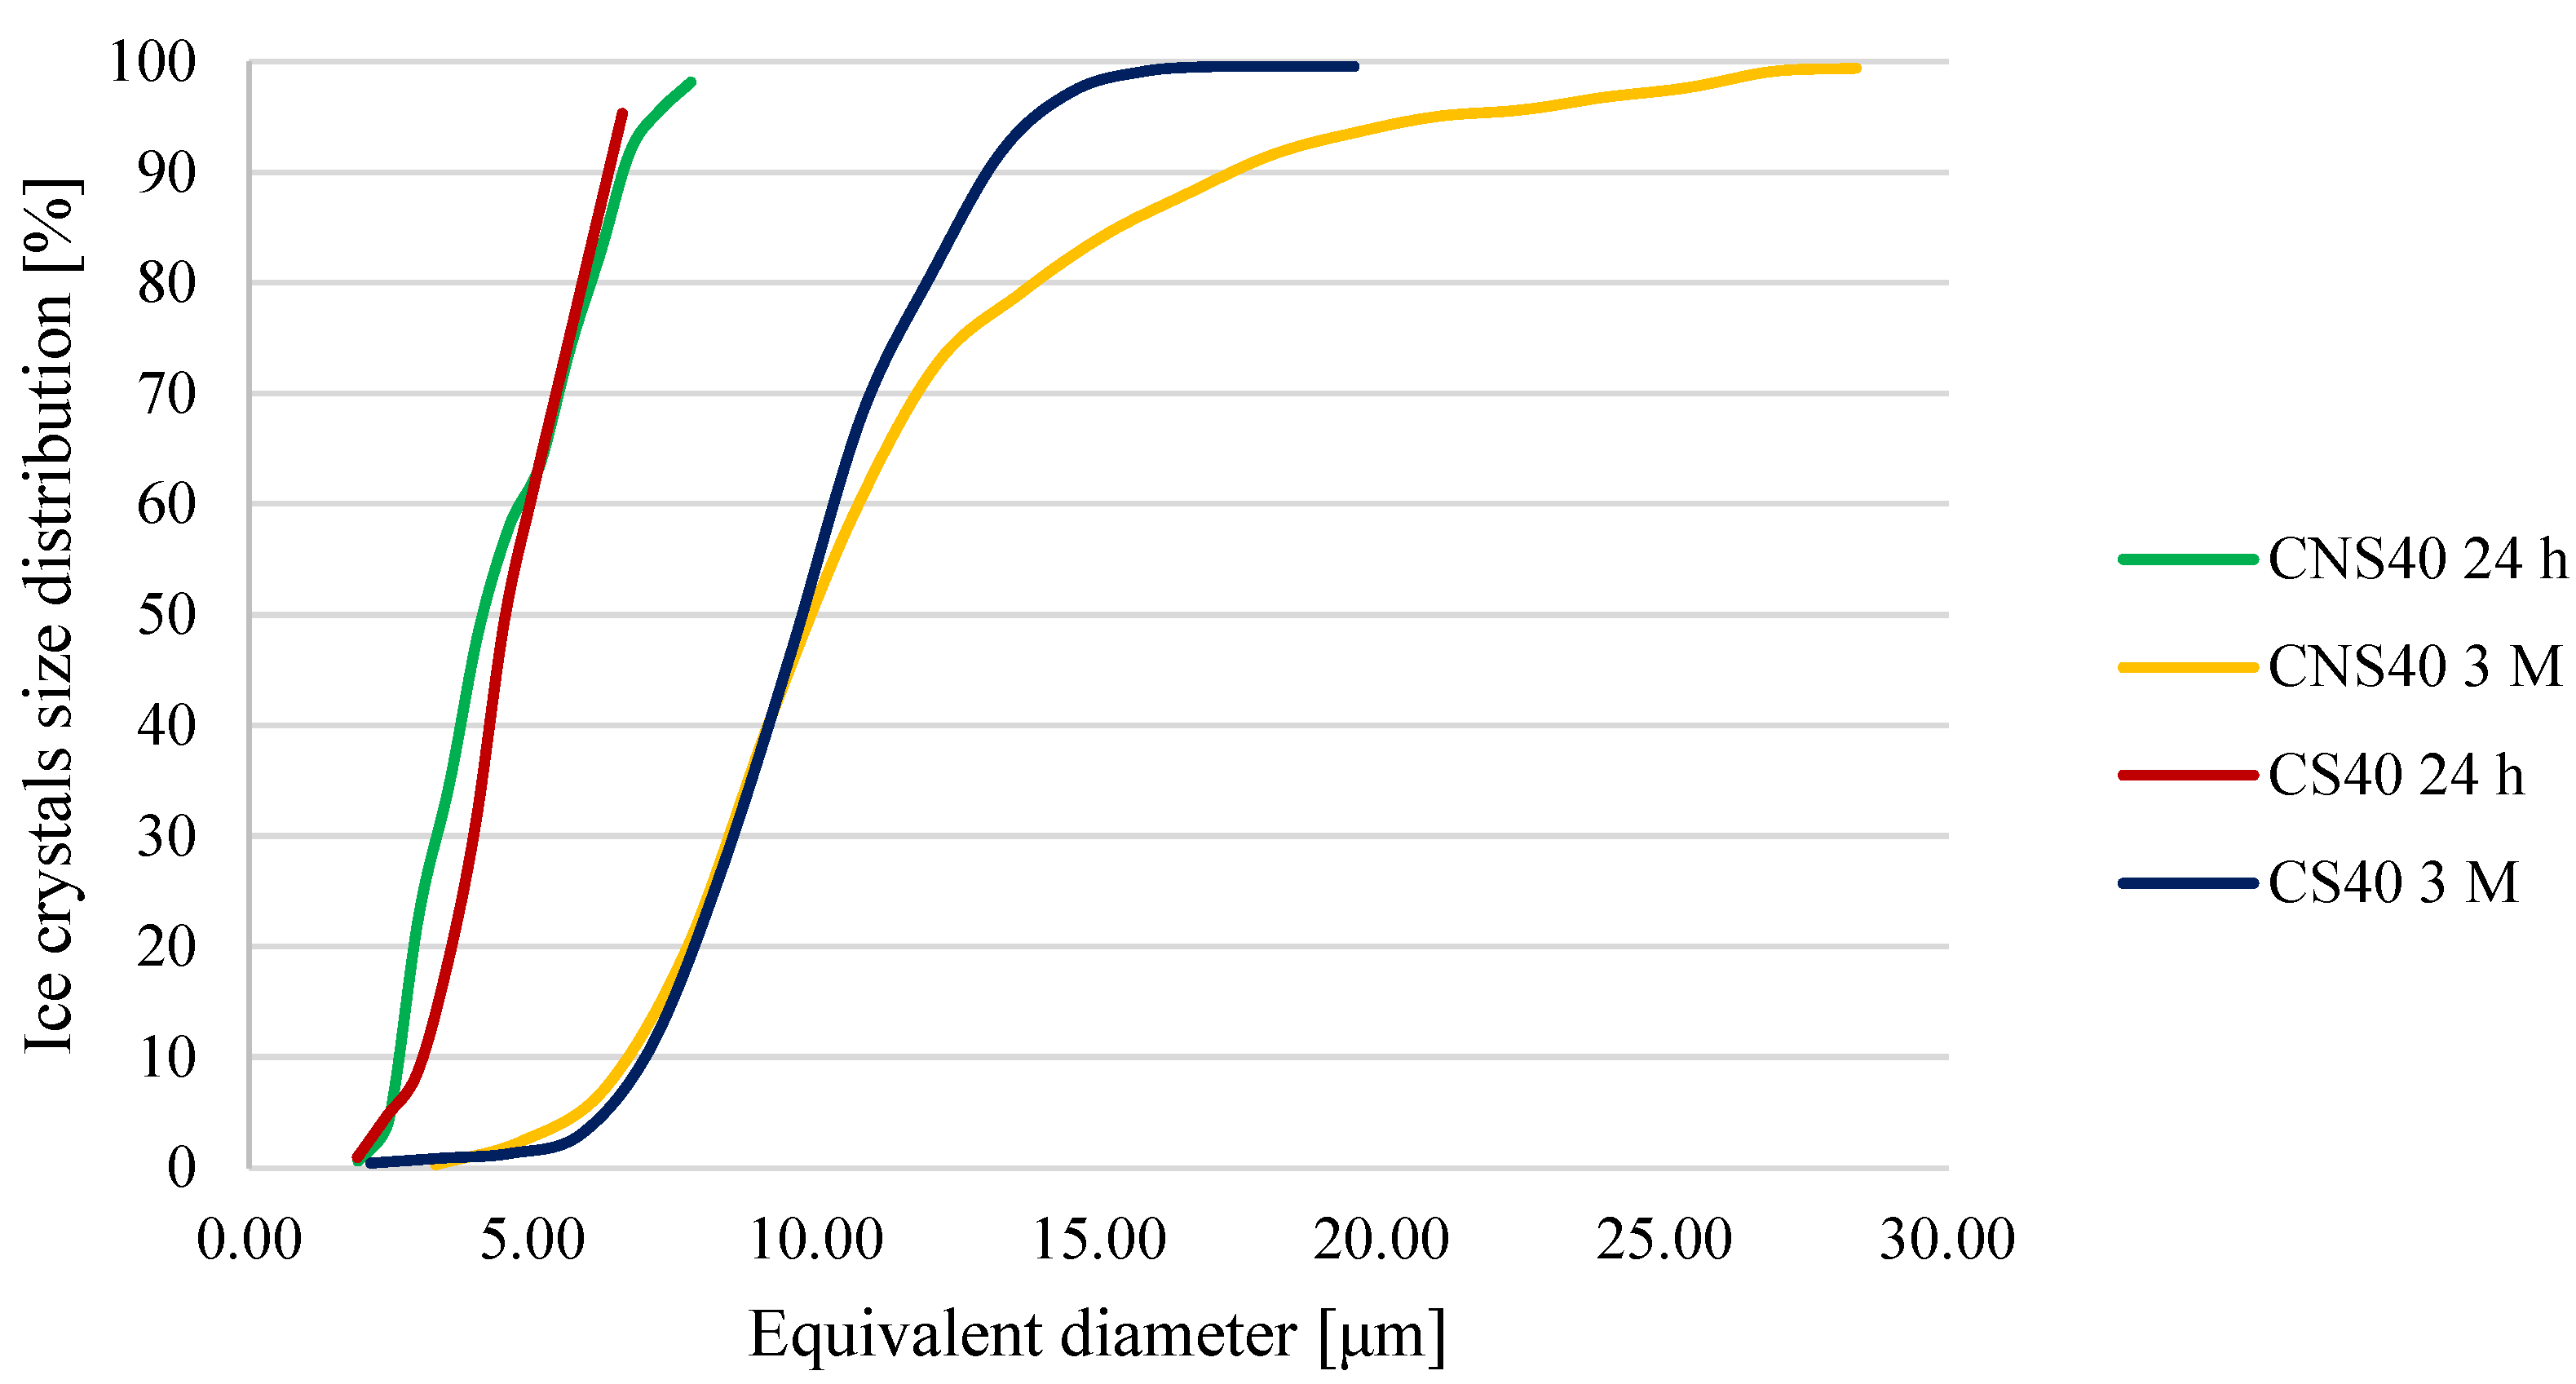
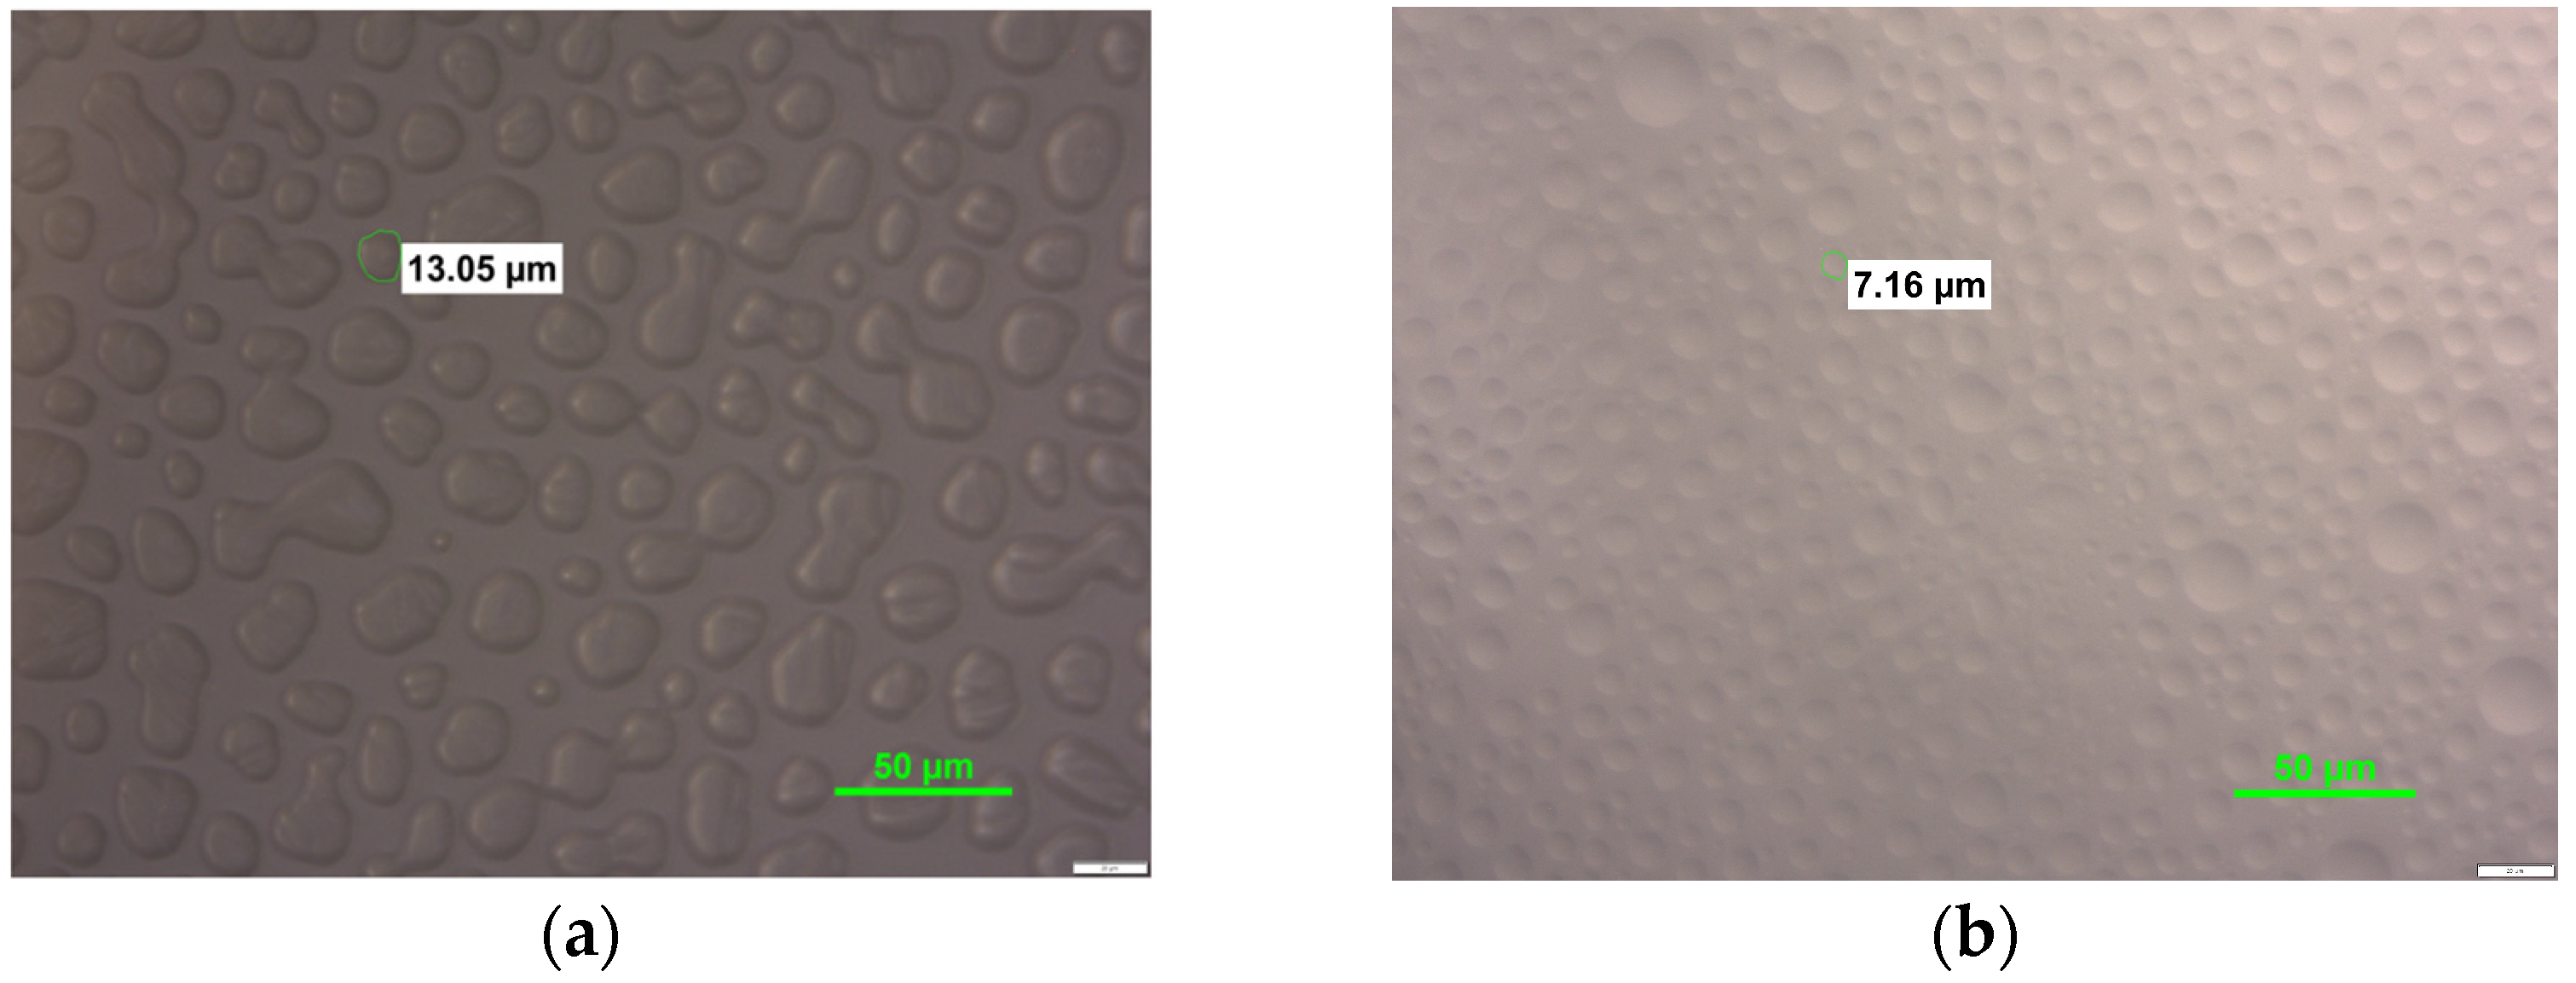
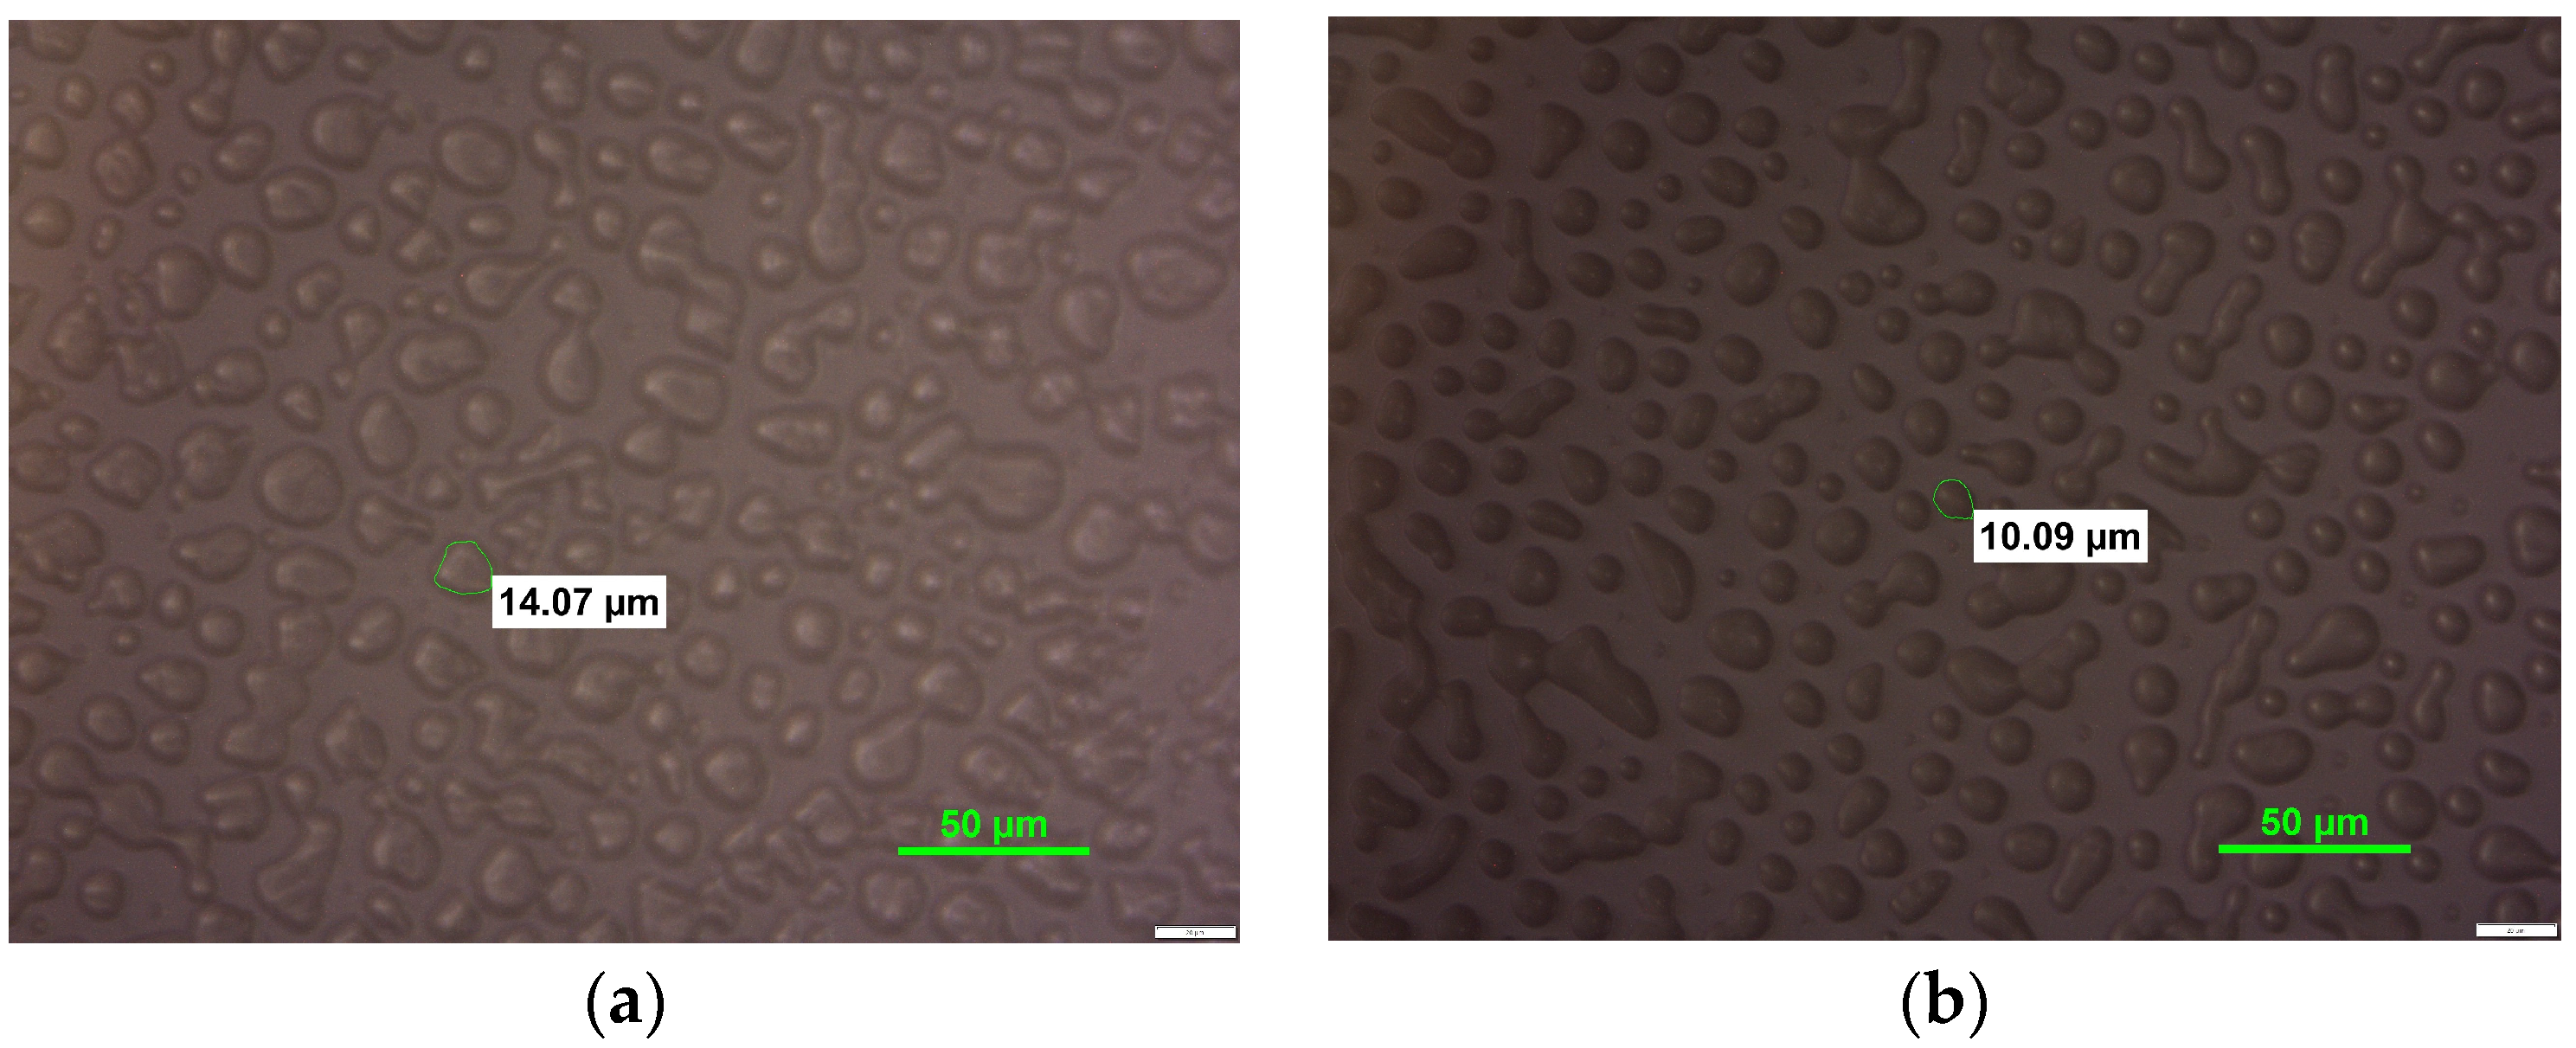
3.3. Ice Crystal Structure Analysis

The sizes and shapes of ice crystals in the ice cream structure are the main factors determining the fine texture of this product. Ice cream is considered a good-quality product only when the ice crystals’ diameters are smaller than the detection threshold, which means, for some of the researchers, lower than 25 µm, and the rest, even more than 50 µm [3,25].
Comparing the ice crystal diameters from the classic freezer and cryostat without the US (Table 3 and Table 4), we can conclude that stabilizers effectively stopped the growth of ice crystals after all analyzed periods of storage.
After 3 months of storage, the biggest ice crystals were noticed for a stabilized sample of ice cream prepared with cryostat use, at the level of 15 µm. The crystals in the stabilized sample from a cryostat were larger, which may be the result of the fact that the freezer, thanks to the stirrer, injects air, limiting the growth of the crystals and breaking them into smaller ones. Kamińska-Dwórznicka et al. (2020) found that in a conventional freezer, due to aeration and mixing during freezing, the heat transfer conditions are different than in a cryostat, and therefore smaller ice crystals are formed [13].
The formation of smaller crystals was observed in the ice cream frozen with ultrasound assistance, and the smallest and more evenly distributed crystals were achieved at a wave frequency of 21.5 kHz and for the stabilized samples (Figure 2 and Figure 3). The average crystal diameter after 3 months of storage was at the level of 8 μm, and at a frequency of 40 kHz, it was nearly 10 μm (Table 4). A similar result was obtained for mango sorbet, where it was noticed that the crystals reached the lowest size of 12.11 μm after the application of ultrasound at a frequency of 21.5 kHz [10]. Sonication with a wave frequency of 20 kHz resulted in a reduction in the X50 parameter (average diameter for 50% of crystals in the sample) and also in gelatin gel samples from 28 to 47 μm [26].
It is possible that waves with the lower of the two given frequencies (21.5 kHz) may be more effective in inhibiting recrystallization in milk ice cream and sorbets (Figure 3); this was already proved for liquid water or a solution containing more air [27]. Ice mixtures are a multiphase system which, due to the content of air bubbles, is also indeed a solution containing more air and in a sense a foam system.
It can be assumed that the ultrasonic waves caused more uniform cooling throughout the entire volume of the product and, as a result, the nucleation of crystals occurred in different parts of the product at a similar time, thanks to which more crystal nuclei were formed and they mutually limited their growth.
Consequently, the application of ultrasonic-assisted freezing at a frequency of 40 kHz, a change in the size of ice crystals occurred in the non-stabilized ice cream sample after 1 month. Then, their growth was inhibited, because the values of the X50 parameters after one month and three months were similar (Figure 4). The same tendency was observed in the data regarding the stabilized samples. This might be the result of ultrasonic treatment, which slowed down the recrystallization rate, regardless of the influence of stabilizers. In ice mixtures with the addition of stabilizers, during ripening, a coalescence process may occur for fat globules that increase in size. This destabilization process may be beneficial in the traditional freezing method, but when using ultrasound, it may adversely affect the formation of larger ice crystals [28].
Using waves of this frequency, it was possible to reduce the size of the crystals of frozen grass carp fish (Ctenopharyngodon idella) and preserve the original structure of muscle fibers to a greater extent [29]. It was also examined [26] that the differences in structure depend on the intensity of emitting ultrasonic waves. That is why it is so important to select the best parameters, because too little or too much ultrasound action may result in the formation of crystals with larger diameters.
Microscopic analysis gives information not only about ice crystals’ sizes, but also about their shapes [3]. After 3 months of storage, for the stabilized and non-stabilized samples from the freezer, the differences in the crystal structure were clearly visible. For the non-stabilized samples, more round crystals with free space between were observed. For the stabilized sample, a more angular and spatial arrangement was noticed. We can assumed that a lack of free spaces was observed as a result of the recrystallization mechanisms (Figure 5b).
Kiran-Yildirim et al. (2020) examined the influence of various carrageenan fractions (κ-, ι-, λ-) on the recrystallization in model sucrose solutions. They concluded that in the sample with the addition of ι-carrageenan, crystals were more angular and more closely packed just after 50 h of storage [30].
Looking at the crystal morphology of an ice cream sample with and without stabilization, frozen using the immersion method without ultrasound (Figure 6), one can notice a large number of oval crystals, situated close to each other. It is difficult to observe any differences between stabilized and non-stabilized samples. As it was already written [10,13] with a lack of mixing and aerating during freezing in a cryostat gave a more dense structure with larger ice crystals.
After 3 months of storage, in samples without stabilizers and after US treatment (21.5 kHz), the spaces in the crystal lattice increased (Figure 7a). Presumably, as a result of coalescence, the crystals grew together, leaving behind free spaces filled with ice masses.
They were characterized by an irregular shape. Some were fused together, while the single ones were oval, but also elongated. In the samples with stabilizers, the crystals were small and significantly separated from each other (Figure 7b). This may be due to the influence of stabilizers and also cavitation activities, scattering the crystal nuclei, because compared to the photo of the sample using the method without ultrasound (Figure 6), these distances are larger and the crystals are significantly smaller, more evenly distributed and oval. What was surprising is that after the longest storage time, the ice crystals, apart from their size, did not change significantly in shape and retained their distinct form for the most part.
Kamińska-Dwórznicka et al. (2023) also determined the crystal structure of mango sorbet after treatment with ultrasound at a frequency of 21.5 kHz as more uniform, made of smaller and similar crystals in terms of shape and size [10]. Taking into account the amount of fat in milk ice cream, which is much higher than in ice cream based on fruits or a plant-based drink, it can be said that in this case, milk ice cream will have a much better crystalline structure and a smooth texture [31]. Moreover, it was already proved that a lower frequency (around 21 kHz) was better in application to the solutions containing more air and the cavitation effect could strengthen the formation of ice nuclei, thus reducing the rate of ice crystals growth [27].
Additionally, this was confirmed by the research of Zhang et al. (2019). After 180 days of storage after immersion-freezing using ultrasonic waves, ice crystals in pork samples retained their regular shape and uniform distribution in the material. The authors found that sonication with a power of 180 W can effectively keep ice crystals smaller in meat fibers and cause their smaller deformations during freezing and storage (frequency of sonication was not provided) [32]. Hu et al. (2013) observed a similar nature of crystals in samples of wheat dough frozen with the assistance of ultrasonic waves at a frequency of 25 kHz. This method has been found to promote the formation of fine ice crystals in large numbers inside the frozen cake and improve heat transfer [33].
It could be assumed that ultrasonic waves with a frequency of 40 kHz can enable the production of non-stabilized ice cream with evenly distributed crystals and a similar shape, just after production, as already concluded. Unfortunately, it was not possible to limit the merging of the crystals after about 90 days as it was after treatment with 21.5 kHz waves, and connected oval and larger crystals are visible in the photo (Figure 8).
However, it should be taken into account that compared to the reference samples, these are small particles and barely perceptible during consumption, because the average diameter of the crystals did not reach 25 µm, and this ultimately positive effect on the recrystallization inhibition was found regardless of the presence of the selected hydrocolloids.

4. Conclusions

The present study showed how to use US-assisted freezing in milky ice cream production in order to obtain fine-quality products with more beneficial crystal structures.
The addition of the chosen stabilizers (LBG, xanthan gum and ι-carrageenan) did not significantly influence the density and pH of ice cream; however, the freezing point for the stabilized samples was lower and the overrun was higher.
The US-assisted freezing method with a frequency of 21.5 and 40 kHz allowed for reducing the freezing time by 21 and 23%, respectively, in the case of non-stabilized ice cream compared to the reference sample, while the freezing of stabilized ice cream was shortened by 20 and 21%.
The use of sonication resulted in the limited growth of ice crystals, and the smallest size was achieved at a wave frequency of 21.5 kHz and the addition of stabilizers, which was 7.8 µm. Therefore, the proper selection of stabilizers combined with sonication leads to the formation of a more desirable crystal structure. Recrystallization was inhibited more effectively by ultrasonic waves with a frequency of 21.5 kHz than waves with a frequency of 40 kHz. Under the influence of the application of waves with a frequency of 21.5 kHz, the crystal structure consisted of a large number of smaller and more uniform ice crystals.
In conclusion, it has been shown that sonication allows for shortening the freezing time and obtaining a product of better quality, and thanks to its use, the addition of stabilizers can be reduced. This effect could show the manufacturers a new path for ice cream production based only on natural ingredients and with a decreased number of additives. However, it could also create some problems with process organization and be a big challenge for new freezer constructors.

Supplementary Materials

The following supporting information can be downloaded at: https://www.mdpi.com/article/10.3390/pr12091957/s1: Figure S1. Plot of the freezing curves and corresponding linear regression curves with their equations. This applies to the conventional method and stabilized and non-stabilized samples. The designation “a” or “b” corresponds to two different repetitions. Figure S2. Plot of the linear regression curves with corresponding equations based on the temperature and freezing time dependence. This applies to the immersion method and non-stabilized samples. The designation “a” or “b” corresponds to two different repetitions. Figure S3. Plot of the linear regression curves with corresponding equations based on the temperature and freezing time dependence. This applies to the immersion method and stabilized samples. The designation “a” or “b” corresponds to two different repetitions.

Author Contributions

Conceptualization, A.K.-D. and A.K.; methodology, A.K.-D.; software, A.K.; validation, A.K.-D. and A.K.; formal analysis, A.K.; investigation, A.K.-D.; resources, A.K.; data curation, A.K.-D.; writing—original draft preparation, A.K.-D.; writing—review and editing, A.K.; visualization, A.K.-D.; supervision, A.K.D. and A.K. All authors have read and agreed to the published version of the manuscript.

Funding

This research received no external funding.

Data Availability Statement

The data generated or analyzed during this study are available from the corresponding author on reasonable request.

Acknowledgments

Research equipment was purchased as part of the “Food and Nutrition Centre—modernisation of the WULS campus to create a Food and Nutrition Research and Development Centre (CŻiŻ)”, co-financed by the European Union from the European Regional Development Fund under the Regional Operational Programme of the Mazowieckie Voivodeship for 2014–2020 (project no. RPMA.01.01.00-14-8276/17. Special thanks to Emilia Bogucka for her help with experiment implementation.

Conflicts of Interest

The authors declare no conflicts of interest.

References

  1. Kamińska-Dwórznicka, A.; Łaba, S.; Jakubczyk, E. The effects of selected stabilizers addition on physical properties and changes in crystal structure of whey ice cream. LWT 2022, 154, 112841. [Google Scholar] [CrossRef]
  2. Innocente, N.; Comparin, D.; Corradini, C. Proteose-peptone whey fraction as emulsifier in ice-cream preparation. Int. Dairy J. 2002, 12, 69–74. [Google Scholar] [CrossRef]
  3. Kamińska-Dwórznicka, A.; Gondek, E.; Laba, S.; Jakubczyk, E.; Samborska, K. Characteristics of Instrumental Methods to Describe and Assess the Recrystallization Process in Ice Cream Systems. Foods 2019, 8, 117. [Google Scholar] [CrossRef]
  4. Akdeniz, V.; Akalın, A.S. New approach for yoghurt and ice cream production: High-intensity ultrasound. Trends Food Sci. Technol. 2019, 86, 392–398. [Google Scholar] [CrossRef]
  5. Dadan, M.; Matys, A.; Kaminska-Dworznicka, A.; Lammerskitten, A.; Toepfl, S.; Parniakov, O. Improvement of freezing processes assisted by ultrasound. In Design and Optimization of Innovative Food Processing Techniques Assisted by Ultrasound; Elsevier: Amsterdam, The Netherlands, 2021; pp. 217–273. [Google Scholar]
  6. Zhu, Z.; Zhang, P.; Sun, D.-W. Effects of multi-frequency ultrasound on freezing rates and quality attributes of potatoes. Ultrason. Sonochem. 2020, 60, 104733. [Google Scholar] [CrossRef]
  7. Kot, A.; Kamińska-Dwórznicka, A.; Jakubczyk, E. Study on the Influence of Ultrasound Homogenisation on the Physical Properties of Vegan Ice Cream Mixes. Appl. Sci. 2022, 12, 8492. [Google Scholar] [CrossRef]
  8. Kot, A.; Jakubczyk, E.; Kamińska-Dwórznicka, A. The Effectiveness of Combination Stabilizers and Ultrasound Homogenization in Milk Ice Cream Production. Appl. Sci. 2023, 13, 7561. [Google Scholar] [CrossRef]
  9. Nazarewicz, S.; Kozłowicz, K.; Kobus, Z.; Gładyszewska, B.; Matwijczuk, A.; Ślusarczyk, L.; Skrzypek, T.; Sujka, M.; Kozłowicz, N. The Use of Ultrasound in Shaping the Properties of Ice Cream with Oleogel Based on Oil Extracted from Tomato Seeds. Appl. Sci. 2022, 12, 9165. [Google Scholar] [CrossRef]
  10. Kamińska-Dwórznicka, A.; Kot, A.; Jakubczyk, E.; Buniowska-Olejnik, M.; Nowacka, M. Effect of ultrasound-assisted freezing on the crystal structure of mango sorbet. Crystals 2023, 13, 396. [Google Scholar] [CrossRef]
  11. Dłużewska, E.; Gazda, B.; Leszczyński, K. Wpływ wybranych hydrokoloidów polisacharydowych na jakość koncentratów lodów owocowych. Acta Sci. Pol. Technol. Aliment. 2003, 2, 97–107. [Google Scholar]
  12. Góral, M.; Kozłowicz, K.; Pankiewicz, U.; Góral, D.; Kluza, F.; Wójtowicz, A. Impact of stabilizers on the freezing process, and physicochemical and organoleptic properties of coconut milk-based ice cream. LWT 2018, 92, 516–522. [Google Scholar] [CrossRef]
  13. Kamińska-Dwórznicka, A.; Janczewska-Dupczyk, A.; Kot, A.; Laba, S.; Samborska, K. The impact of iota- and kappa-carrageenan addition on freezing process and ice crystals structure of strawberry sorbet frozen by various methods. J. Food Sci. 2020, 85, 50–56. [Google Scholar] [CrossRef] [PubMed]
  14. Goff, H.D.; Hartel, R.W. Ice cream structure. In Ice Cream; Springer: Boston, MA, USA, 2013; pp. 313–352. [Google Scholar]
  15. Romulo, A.; Meindrawan, B. Marpietylie Effect of Dairy and Non-Dairy Ingredients on the Physical Characteristic of Ice Cream: Review. IOP Conf. Ser. Earth Environ. Sci. 2021, 794, 012145. [Google Scholar] [CrossRef]
  16. Kamińska-Dwórznicka, A. Wpływ stabilizatorów na ograniczenie rekrystalizacji w lodach typu sorbet. PrzemysŁ SpoŻywczy 2016, 1, 34–37. [Google Scholar] [CrossRef]
  17. Ndoye, F.T.; Alvarez, G. Characterization of ice recrystallization in ice cream during storage using the focused beam reflectance measurement. J. Food Eng. 2015, 148, 24–34. [Google Scholar] [CrossRef]
  18. Syed, Q.A.; Anwar, S.; Shukat, R.; Zahoor, T. Effects of different ingredients on texture of ice cream. J. Nutr. Health Food Eng. 2018, 8, 422–435. [Google Scholar] [CrossRef]
  19. Brown, J.R.; Seymour, J.D.; Brox, T.I.; Skidmore, M.L.; Wang, C.; Christner, B.C.; Luo, B.H.; Codd, S.L. Recrystallization inhibition in ice due to ice binding protein activity detected by nuclear magnetic resonance. Biotechnol. Rep. 2014, 3, 60–64. [Google Scholar] [CrossRef]
  20. Raymond, J.A.; Knight, C.A. Ice binding, recrystallization inhibition, and cryoprotective properties of ice-active substances associated with Antarctic sea ice diatoms. Cryobiology 2003, 46, 174–181. [Google Scholar] [CrossRef]
  21. Mortazavi, A.; Tabatabaie, F. Study of ice cream freezing process after treatment with ultrasound. World Appl. Sci. J. 2008, 4, 188–190. [Google Scholar]
  22. Jambrak, A.; Lerda, D.; Mirčeta, R.; Šimunek, M.; Lelas, V.; Chemat, F.; Herceg, Z.; Batur, V. Experimental design and optimization of ultrasound treatment: Functional and physical properties of sonicated ice cream model mixtures. J. Food Process. Technol. 2012, 3, 145. [Google Scholar] [CrossRef]
  23. Adhikari, B.M.; Truong, T.; Prakash, S.; Bansal, N.; Bhandari, B. Impact of incorporation of CO2 on the melting, texture and sensory attributes of soft-serve ice cream. Int. Dairy J. 2020, 109, 104789. [Google Scholar] [CrossRef]
  24. Astráin-Redín, L.; Abad, J.; Rieder, A.; Kirkhus, B.; Raso, J.; Cebrián, G.; Álvarez, I. Direct contact ultrasound assisted freezing of chicken breast samples. Ultrason. Sonochem. 2021, 70, 105319. [Google Scholar] [CrossRef] [PubMed]
  25. Lomolino, G.; Zannoni, S.; Zabara, A.; Da Lio, M.; De Iseppi, A. Ice recrystallisation and melting in ice cream with different proteins levels and subjected to thermal fluctuation. Int. Dairy J. 2020, 100, 104557. [Google Scholar] [CrossRef]
  26. Xu, B.-g.; Zhang, M.; Bhandari, B.; Sun, J.; Gao, Z. Infusion of CO2 in a solid food: A novel method to enhance the low-frequency ultrasound effect on immersion freezing process. Innov. Food Sci. Emerg. Technol. 2016, 35, 194–203. [Google Scholar] [CrossRef]
  27. Ohsaka, K.; Trinh, E. Apparatus for measuring the growth velocity of dendritic ice in undercooled water. J. Cryst. Growth 1998, 194, 138–142. [Google Scholar] [CrossRef]
  28. Cheng, J.; Ma, Y.; Li, X.; Yan, T.; Cui, J. Effects of milk protein-polysaccharide interactions on the stability of ice cream mix model systems. Food Hydrocoll. 2015, 45, 327–336. [Google Scholar] [CrossRef]
  29. Shi, Z.; Zhong, S.; Yan, W.; Liu, M.; Yang, Z.; Qiao, X. The effects of ultrasonic treatment on the freezing rate, physicochemical quality, and microstructure of the back muscle of grass carp (Ctenopharyngodon idella). LWT 2019, 111, 301–308. [Google Scholar] [CrossRef]
  30. Kiran-Yildirim, B.; Gaukel, V. Ice Crystal Growth in Sucrose Solutions Containing Kappa- and Iota-Carrageenans. Chem. Eng. Technol. 2020, 43, 1040–1047. [Google Scholar] [CrossRef]
  31. Aslan Türker, D.; Dogan, M. Effects of ultrasound homogenization on the structural and sensorial attributes of ice cream: Optimization with Taguchi and data envelopment analysis. J. Food Meas. Charact. 2021, 15, 4888–4898. [Google Scholar] [CrossRef]
  32. Zhang, M.; Xia, X.; Liu, Q.; Chen, Q.; Kong, B. Changes in microstructure, quality and water distribution of porcine longissimus muscles subjected to ultrasound-assisted immersion freezing during frozen storage. Meat Sci. 2019, 151, 24–32. [Google Scholar] [CrossRef]
  33. Hu, S.-Q.; Liu, G.; Li, L.; Li, Z.-X.; Hou, Y. An improvement in the immersion freezing process for frozen dough via ultrasound irradiation. J. Food Eng. 2013, 114, 22–28. [Google Scholar] [CrossRef]
Figure 1. Characteristics of averaged freezing curves for stabilized and non-stabilized ice cream frozen used conventional and immersion methods without and with ultrasound support at frequencies of 21.5 and 40 kHz.
Processes 12 01957 g001
Figure 2. Ice crystal size distribution in stabilized and non-stabilized ice cream frozen used immersion methods, without and with ultrasound support at frequencies of 21.5 kHz.
Processes 12 01957 g002
Figure 3. Recrystallization curves for each variant of freezing for stabilized ice cream samples.
Processes 12 01957 g003
Figure 4. Ice crystal size distribution in stabilized and non-stabilized ice cream frozen using immersion methods, without and with ultrasound support at frequencies of 40 kHz.
Processes 12 01957 g004
Figure 5. Comparison of the images of ice cream frozen in the freezer, not stabilized (a) and stabilized (b), after 3 months of storage at the temperature of −18 °C (magnification 50×).
Processes 12 01957 g005
Figure 6. Comparison of the images of ice cream frozen with a cryostat (without the US), not stabilized (a) and stabilized (b), after 3 months of storage at the temperature of −18 °C (magnification 50×).
Processes 12 01957 g006
Figure 7. Comparison of the images of ice cream frozen with a cryostat with US at frequencies of 21.5 kHz, not stabilized (a) and stabilized (b), after 3 months of storage at the temperature of −18 °C (magnification 50×).
Processes 12 01957 g007
Figure 8. Comparison of the images of ice cream frozen with a cryostat with US at frequencies of 40 kHz, not stabilized (a) and stabilized (b), after 3 months of storage at the temperature of −18 °C (magnification 50×).
Processes 12 01957 g008
Table 1. Density, pH, overrun and freezing point.
SampleDensitypHOverrun Freezing Point
NS1.161 ± 0.030 a6.35 ± 0.01 a16.4 ± 1.6 b−1.8 ± 0.1 a
S1.157 ± 0.221 a6.31 ± 0.00 a25.2 ± 0.7 a−2.4 ± 0.2 b
Explanatory notes: NS—reference sample (without any stabilizers), S—LBG, xanthan with the addition of ι-carrageenan, ( x ¯ ± s d ); a,b mean values denoted by different superscripts differ statistically at α = 0.05.
Table 2. Freezing time.
SampleTime [min]SampleTime [min]
FNS19 ± 4 cFS14 ± 0 c
CNS84 ± 0 aCS87 ± 4 c
CNS2165 ± 1 bCS2170 ± 3 b
CNS4063 ± 4 bCS4069 ± 4 b
Explanatory notes: NS—reference sample (without any stabilizers), S—LBG, xanthan with the addition of ι-carrageenan, F—samples from the freezer, C—samples from cryostat, C21—samples from cryostat US 21.5 kHz, C40—samples from cryostat US 40 kHz. ( x ¯ ± s d ); a–c mean values denoted by different superscripts differ statistically at α = 0.05.
Table 3. Comparison of ice crystal size distribution in ice cream samples frozen in a conventional freezer and cryostat with and without US.
Variant Minimal Diameter [µm]Maximal Diameter [µm]DA in Class with the Highest Frequency [µm]
FNS24 h2.3814.727.39 ± 2.23 d,e,f
1 week3.0316.107.53 ± 2.84 d
1 month4.5724.497.45 ± 2.21 d,e
3 months8.0229.7517.99 ± 4.05 a
CNS24 h1.9818.386.60 ± 2.59 e,f
1 week3.5121.586.41 ± 2.20 f
1 month3.0020.558.91 ± 3.39 c
3 months4.0527.0816.90 ± 4.27 a
CNS2124 h2.7416.876.54 ± 3.28 e,f
1 week2.0315.256.78 ± 4.45 d,e,f
1 month4.1222.326.86 ± 1.95 d,e,f
3 months3.7724.4211.84 ± 4.44 b
CNS4024 h1.938.344.44 ± 1.54 g
1 week1.9610.964.32 ± 1.68 g
1 month1.8019.359.31 ± 4.40 b
3 months3.2929.8511.07 ± 4.64 b
Explanatory notes: NS—reference sample (without any stabilizers), F—samples from the freezer, C—samples from cryostat, C21—samples from cryostat US 21.5 kHz, C40—samples from cryostat US 40 kHz. a–g means in the same row indicated by different letters were significantly different (α = 0.05).
Table 4. Comparison of ice crystal size distribution in ice cream samples frozen in a conventional freezer and cryostat, with and without US.
Variant Minimal Diameter [µm]Maximal Diameter [µm]DA in Class with the Highest Frequency [µm]
FS24 h1.4317.085.45 ± 3.08 h,i
1 week2.2117.275.82 ± 2.43 g,h
1 month3.1712.656.03 ± 1.83 f,g,h
3 months2.7028.5812.90 ± 4.51 b
CS24 h3.718.566.72 ± 1.07 e,f,g
1 week2.3514.546.49 ± 2.85 e,f,g
1 month3.9810.706.77 ± 1.38 e,f
3 months3.7327.3214.89 ± 4.55 a
CS2124 h2.067.985.29 ± 1.45 h,i,j
1 week2.8110.265.11 ± 1.96 h,i,j
1 month4.1215.256.86 ± 3.08 e
3 months3.7724.427.84 ± 3.35 d
CS4024 h1.917.124.36 ± 1.26 i,j
1 week1.8112.514.58 ± 1.80 j
1 month1.9620.639.33 ± 2.92 c
3 months2.1520.759.90 ± 2.47 c
Explanatory notes: S—LBG, xanthan with the addition of ι-carrageenan, F—samples from the freezer, C—samples from cryostat, C21—samples from cryostat US 21.5 kHz, C40—samples from cryostat US 40 kHz. a–j means in the same row indicated by different letters were significantly different (α = 0.05).
Disclaimer/Publisher’s Note: The statements, opinions and data contained in all publications are solely those of the individual author(s) and contributor(s) and not of MDPI and/or the editor(s). MDPI and/or the editor(s) disclaim responsibility for any injury to people or property resulting from any ideas, methods, instructions or products referred to in the content.

