

Multiphysics to Investigate the Thermal and Mechanical Responses in Hard Disk Drive Components Due to the Reflow Soldering Process


Abstract
1. Introduction
2. Theoretical Background
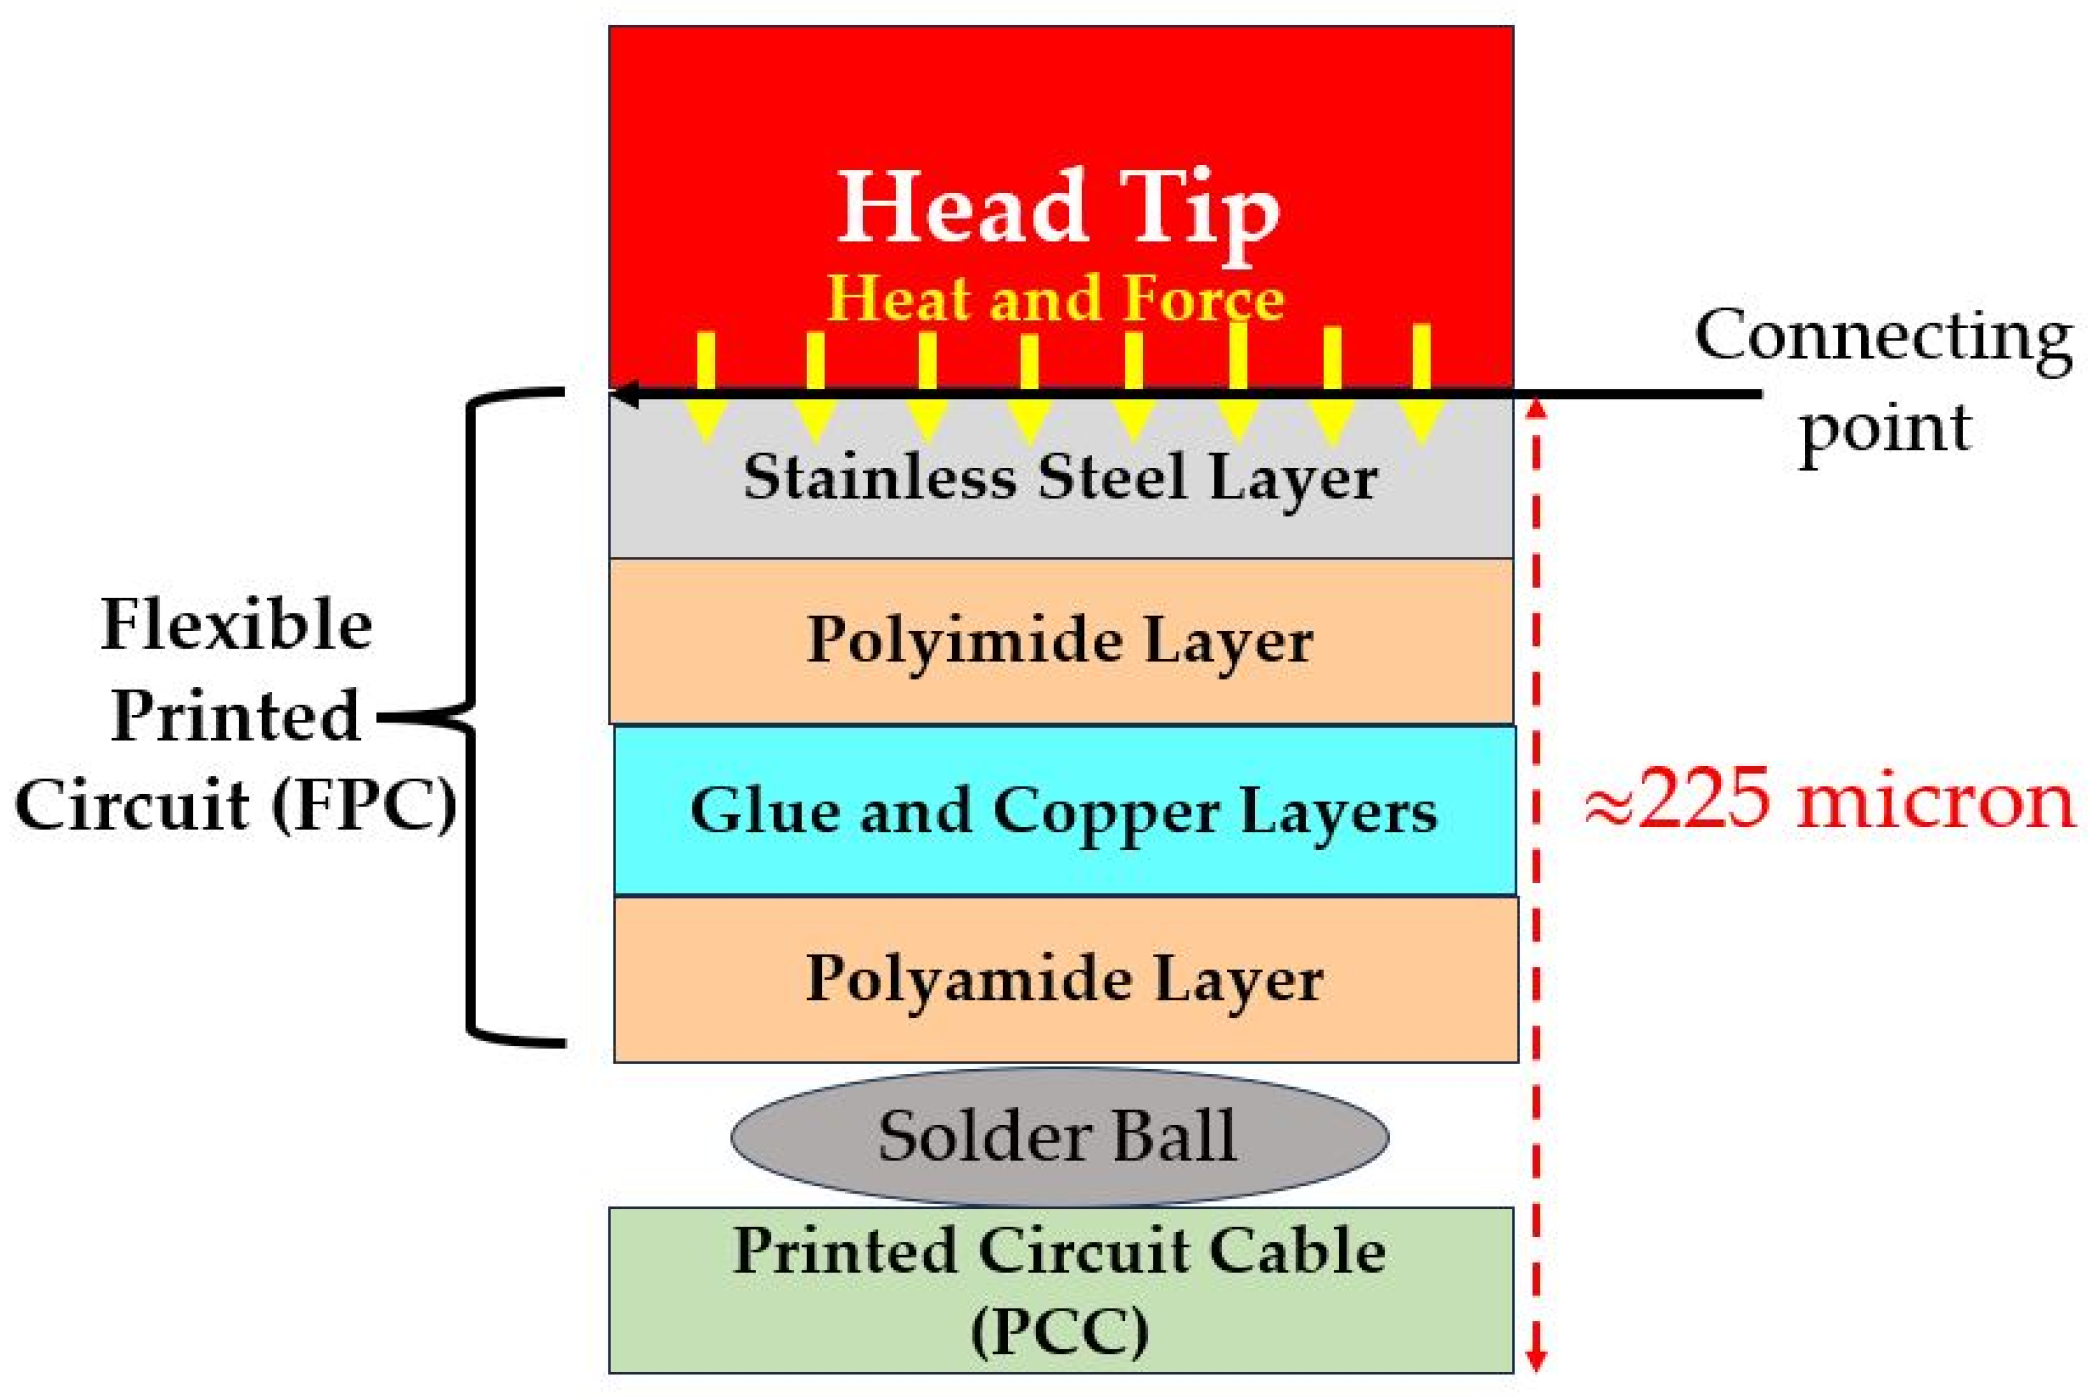
2.1. Materials and RSP Principle
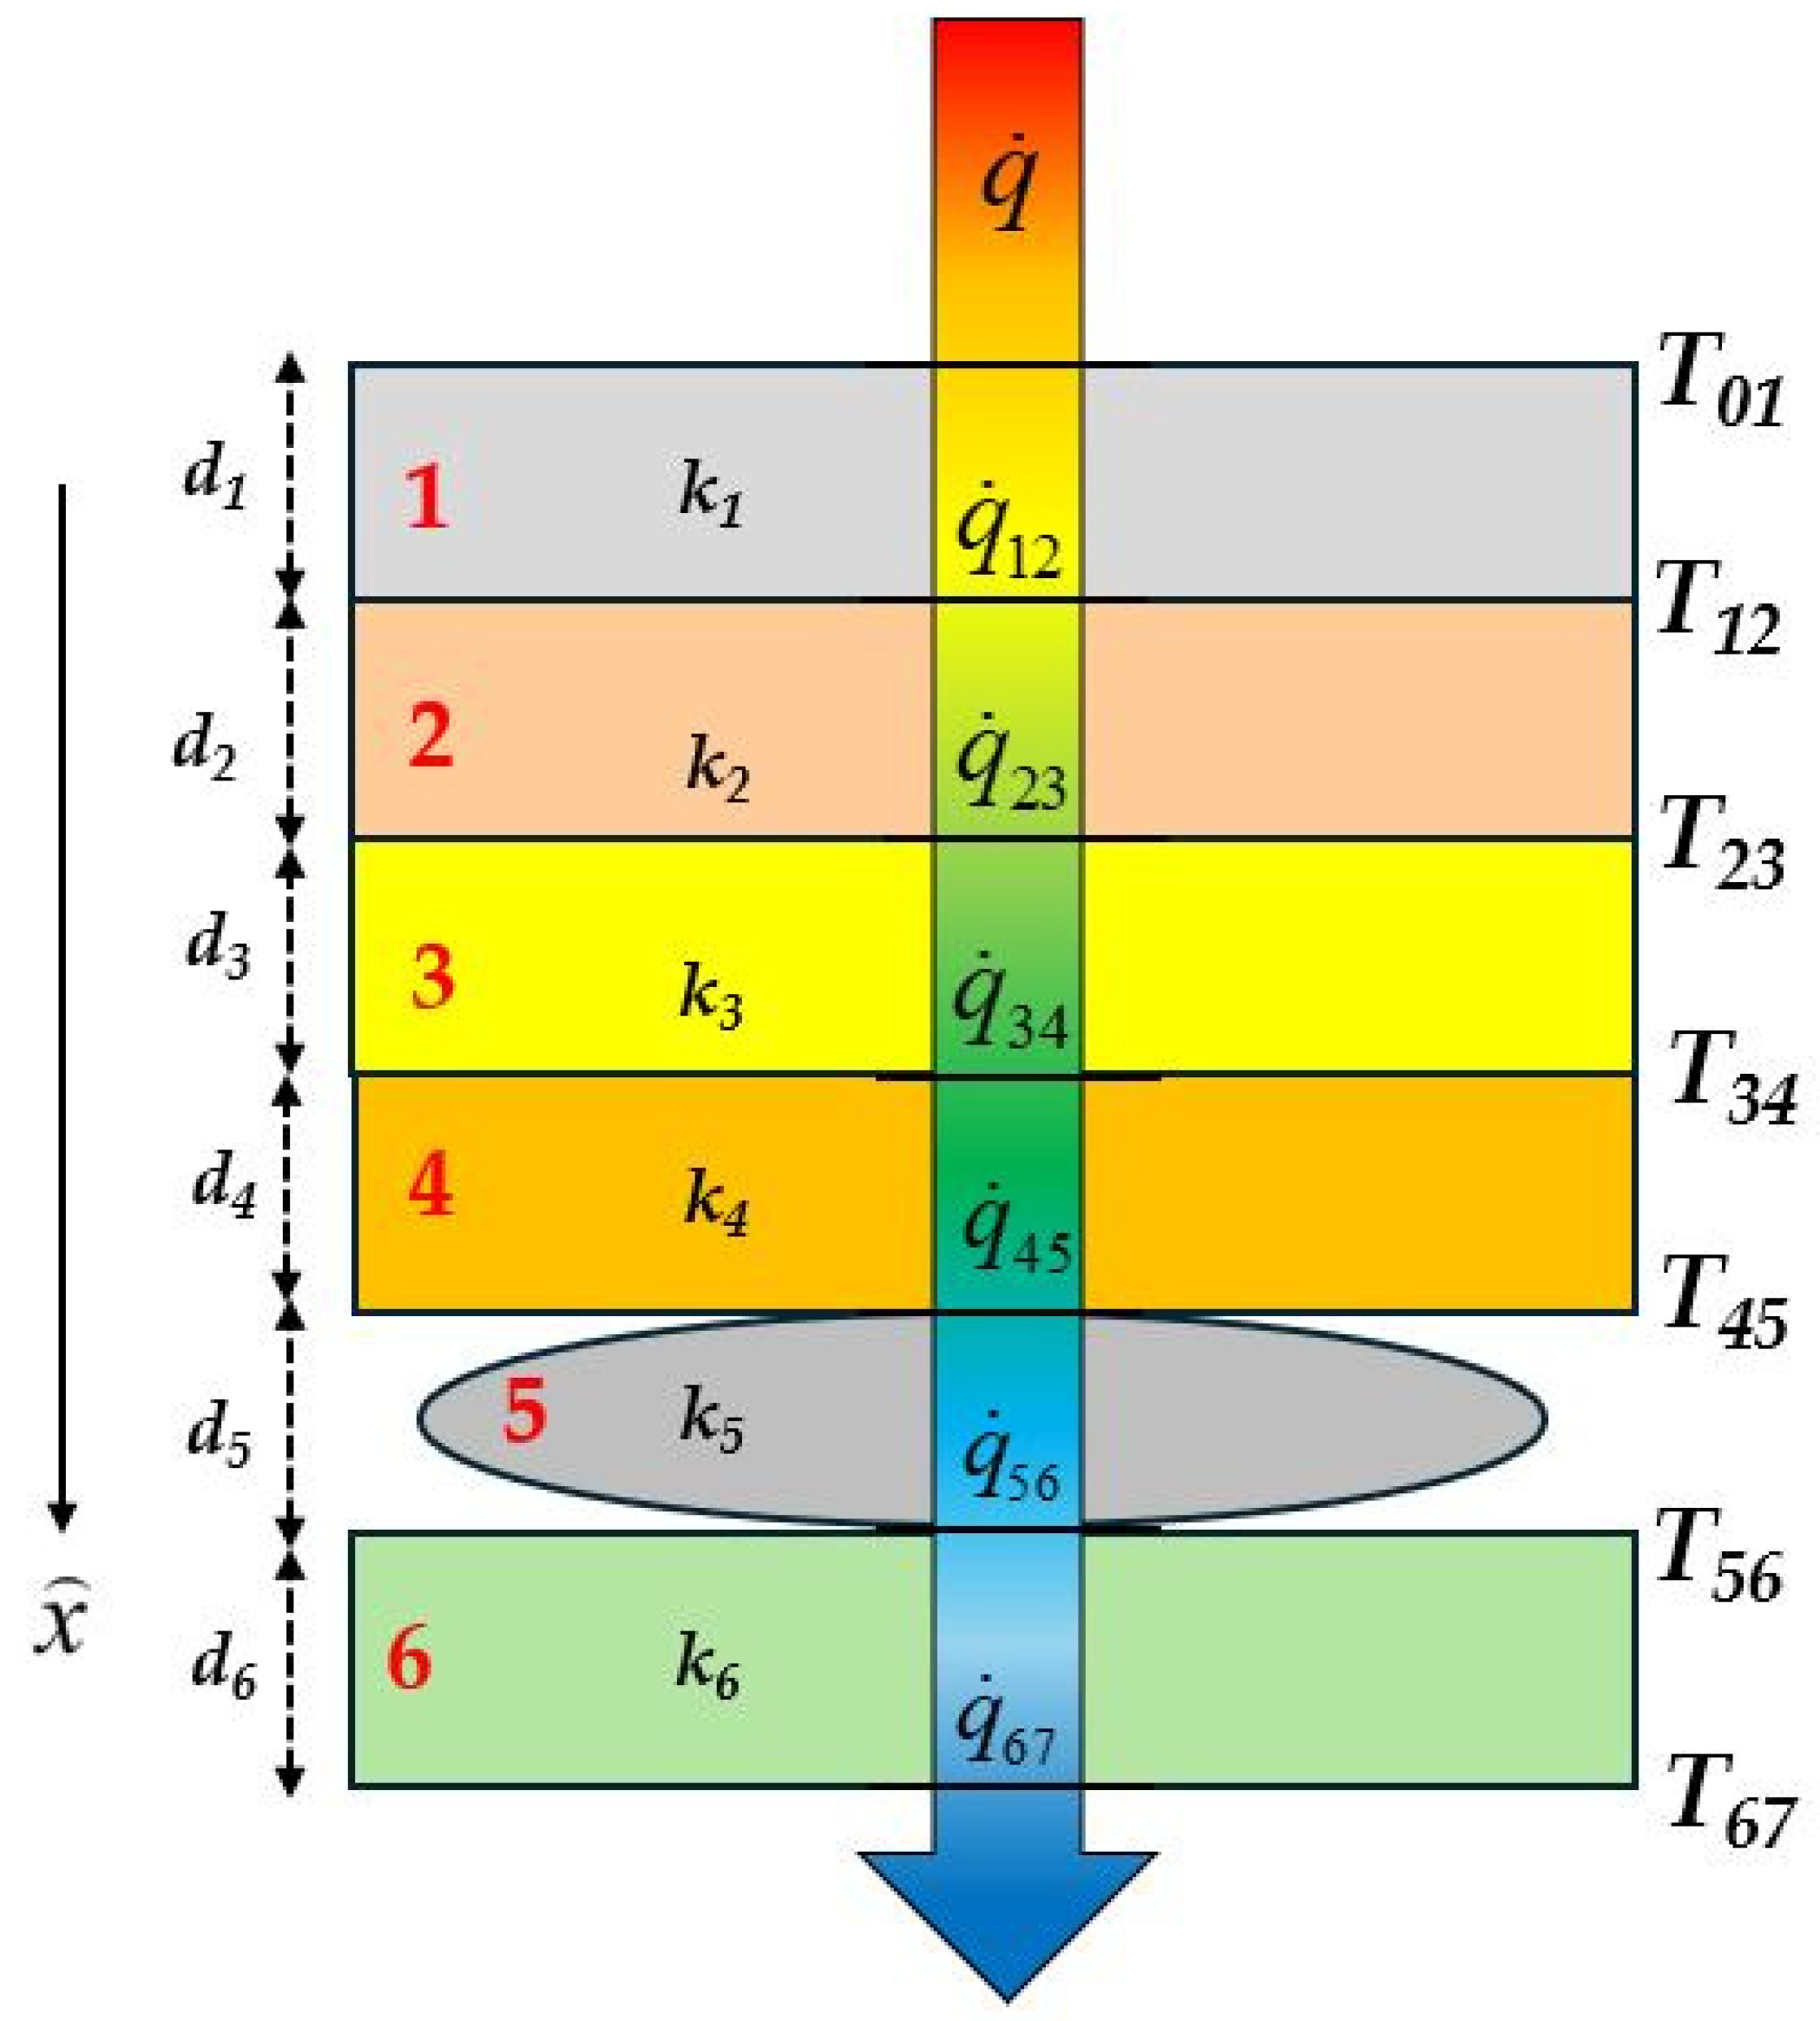
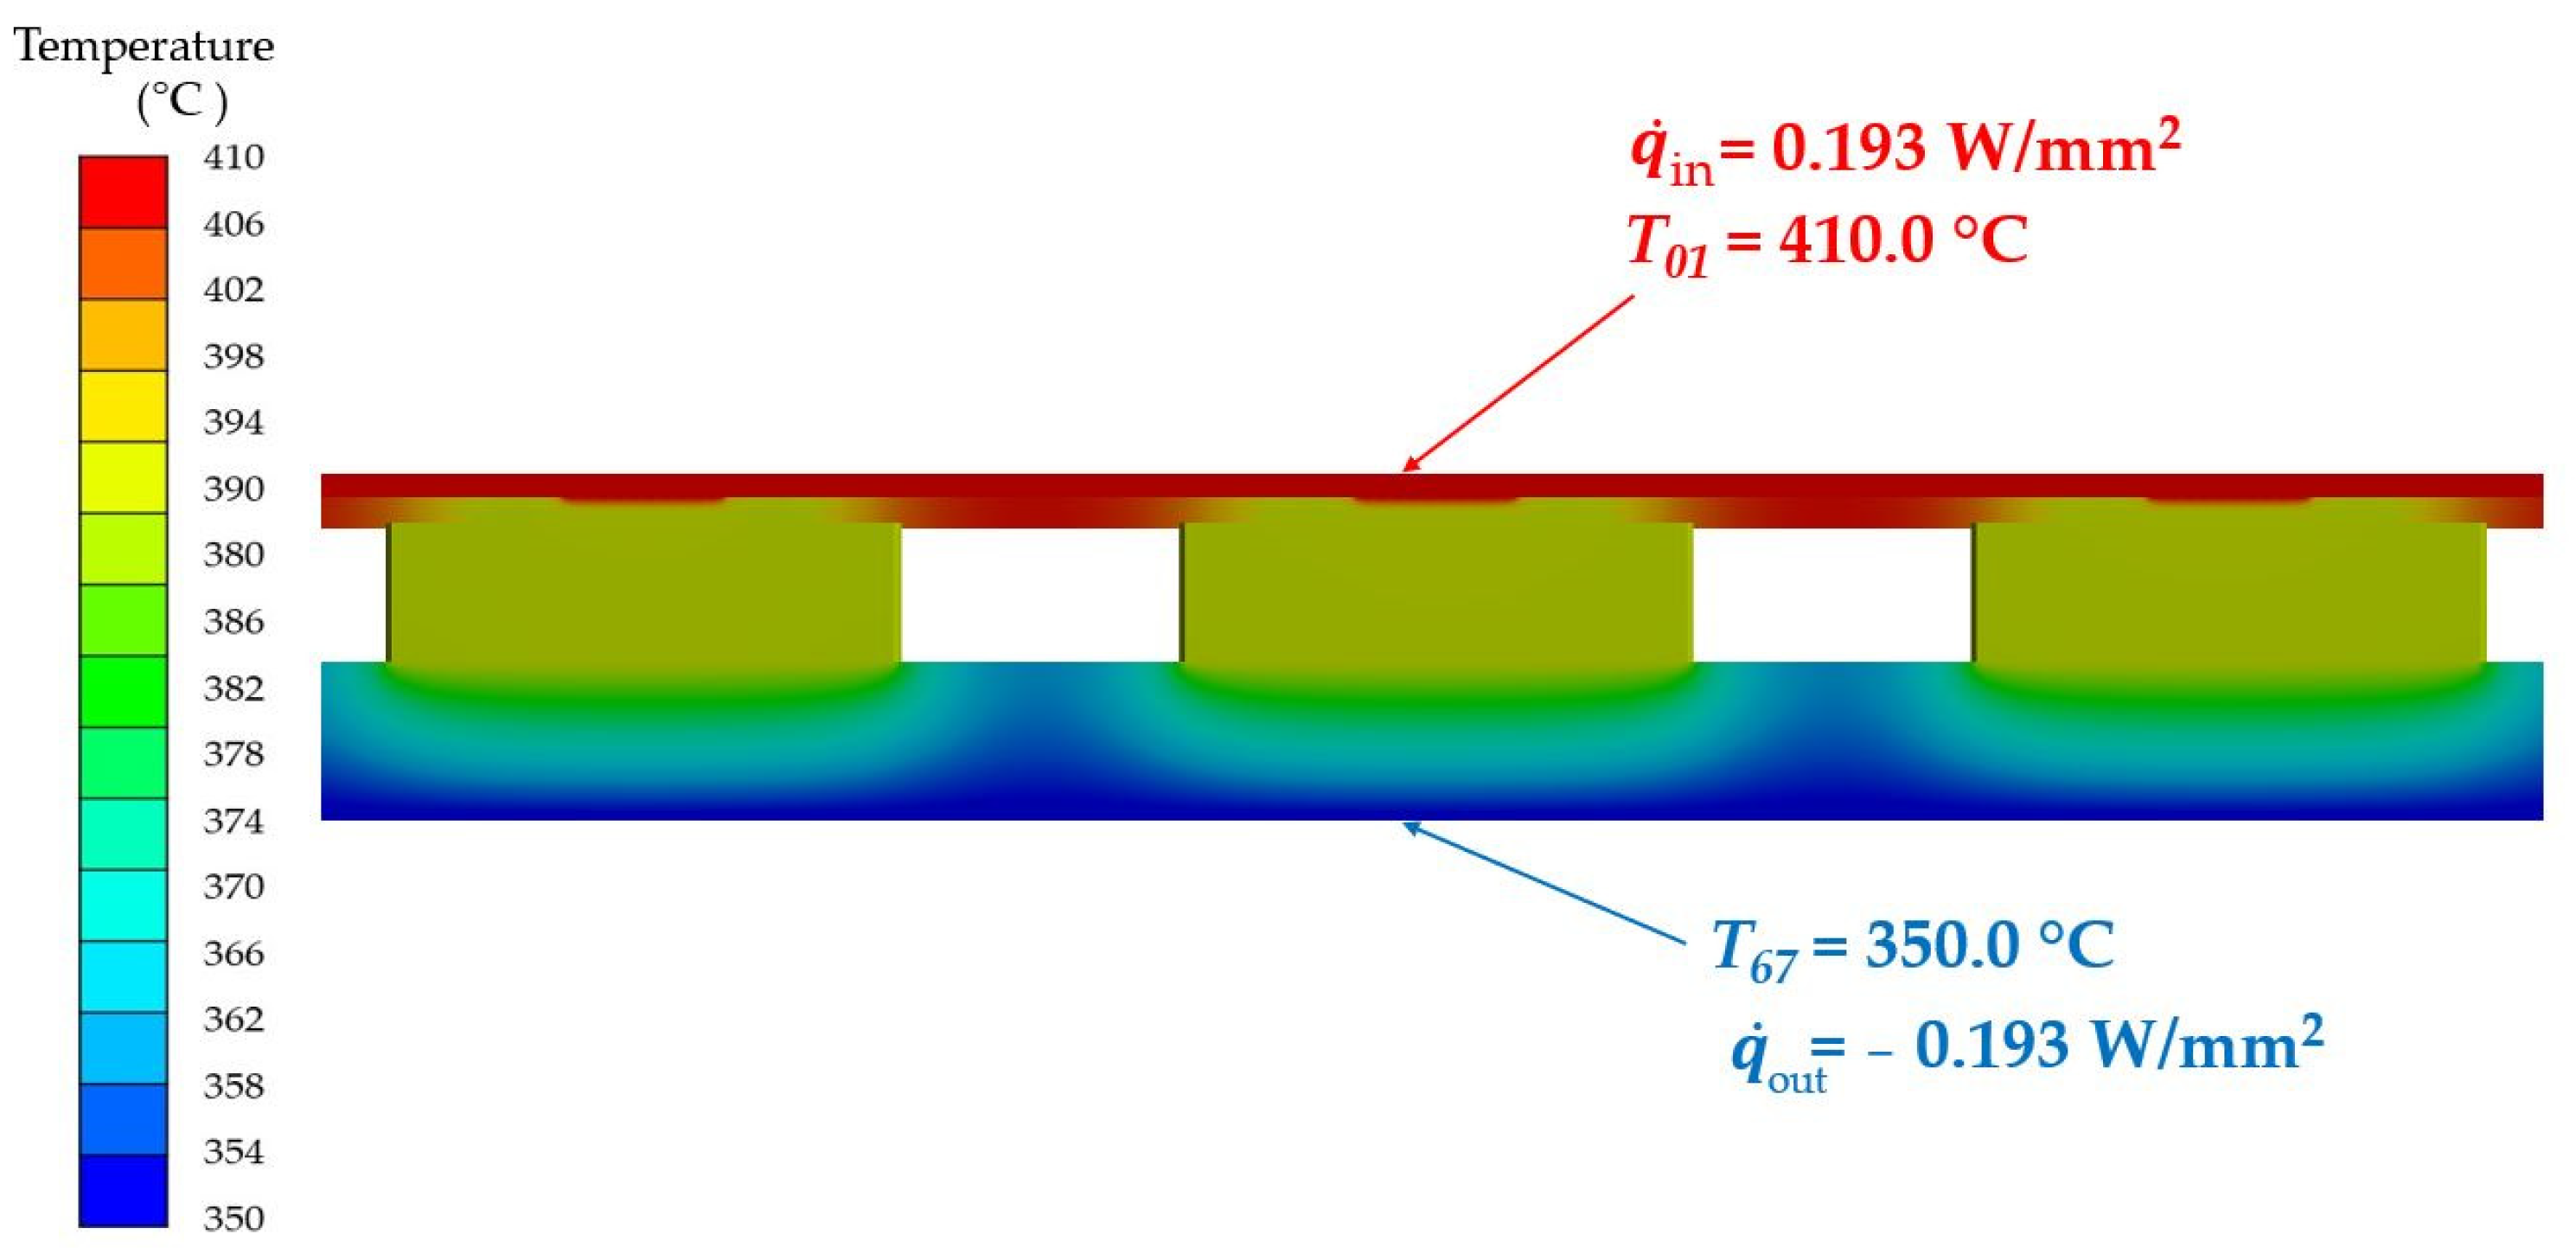
2.2. One-Dimensional Heat Transfer Equations
2.3. Principle of Multiphysics
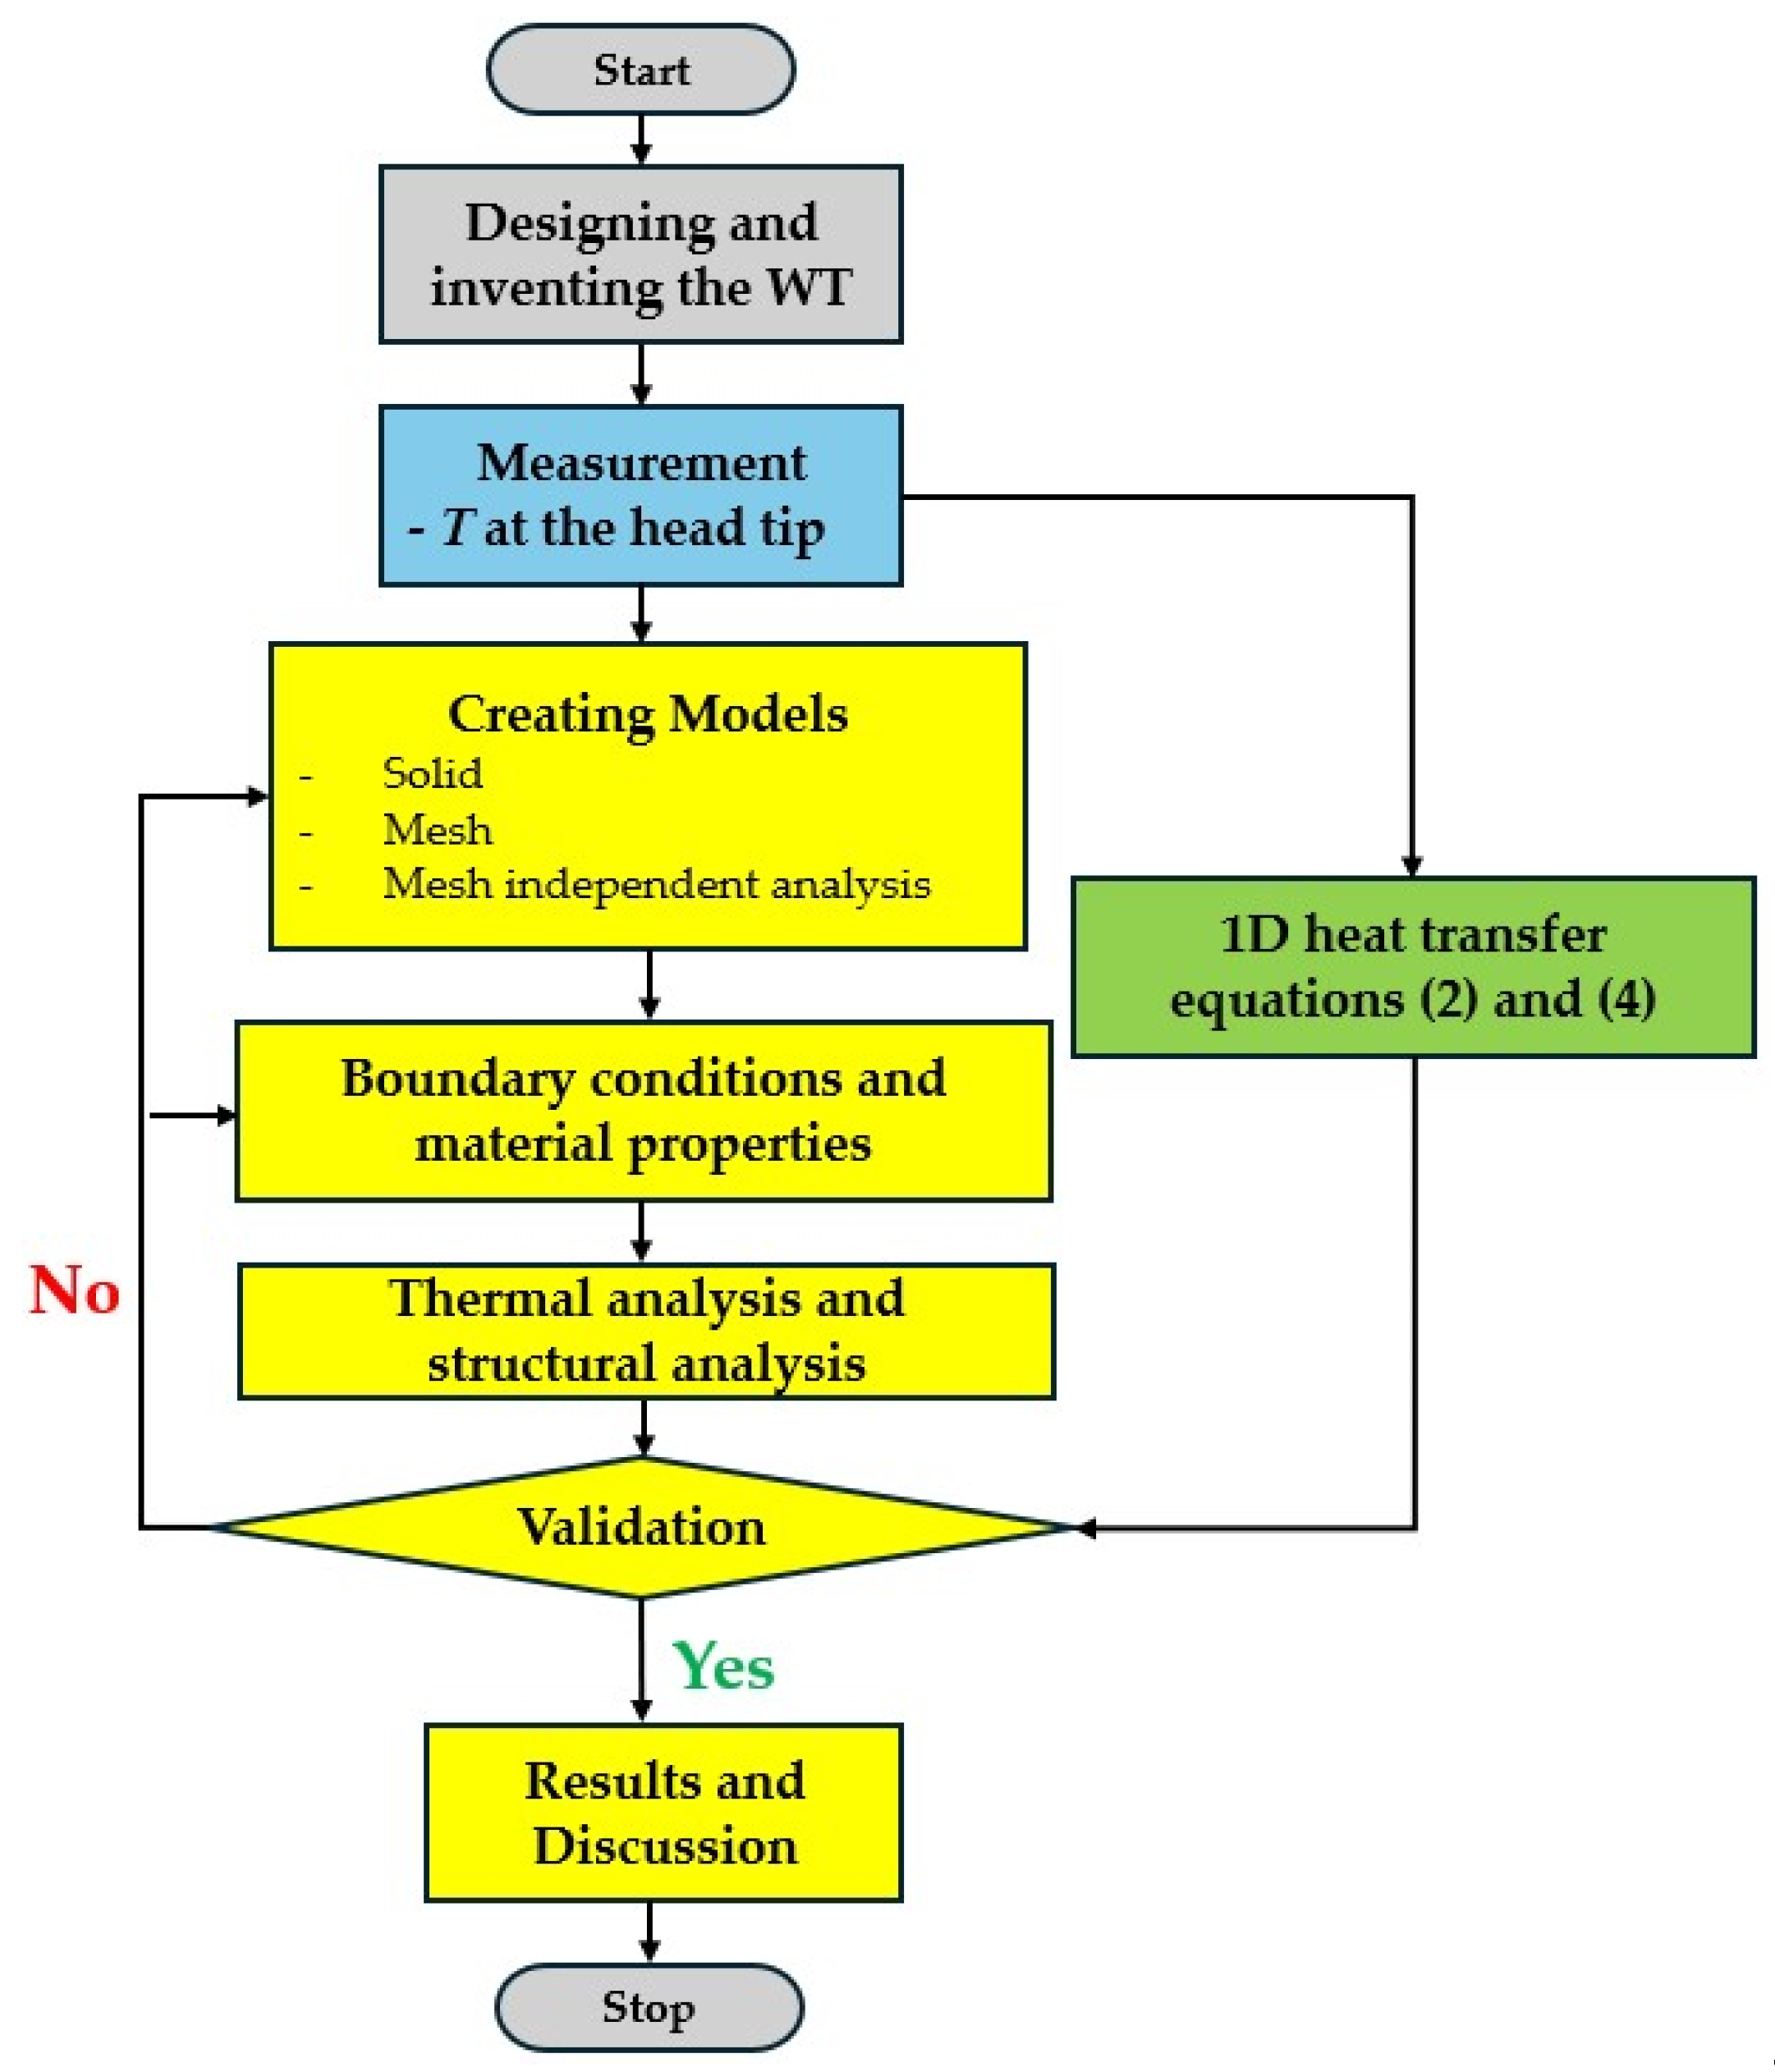
3. Methodology
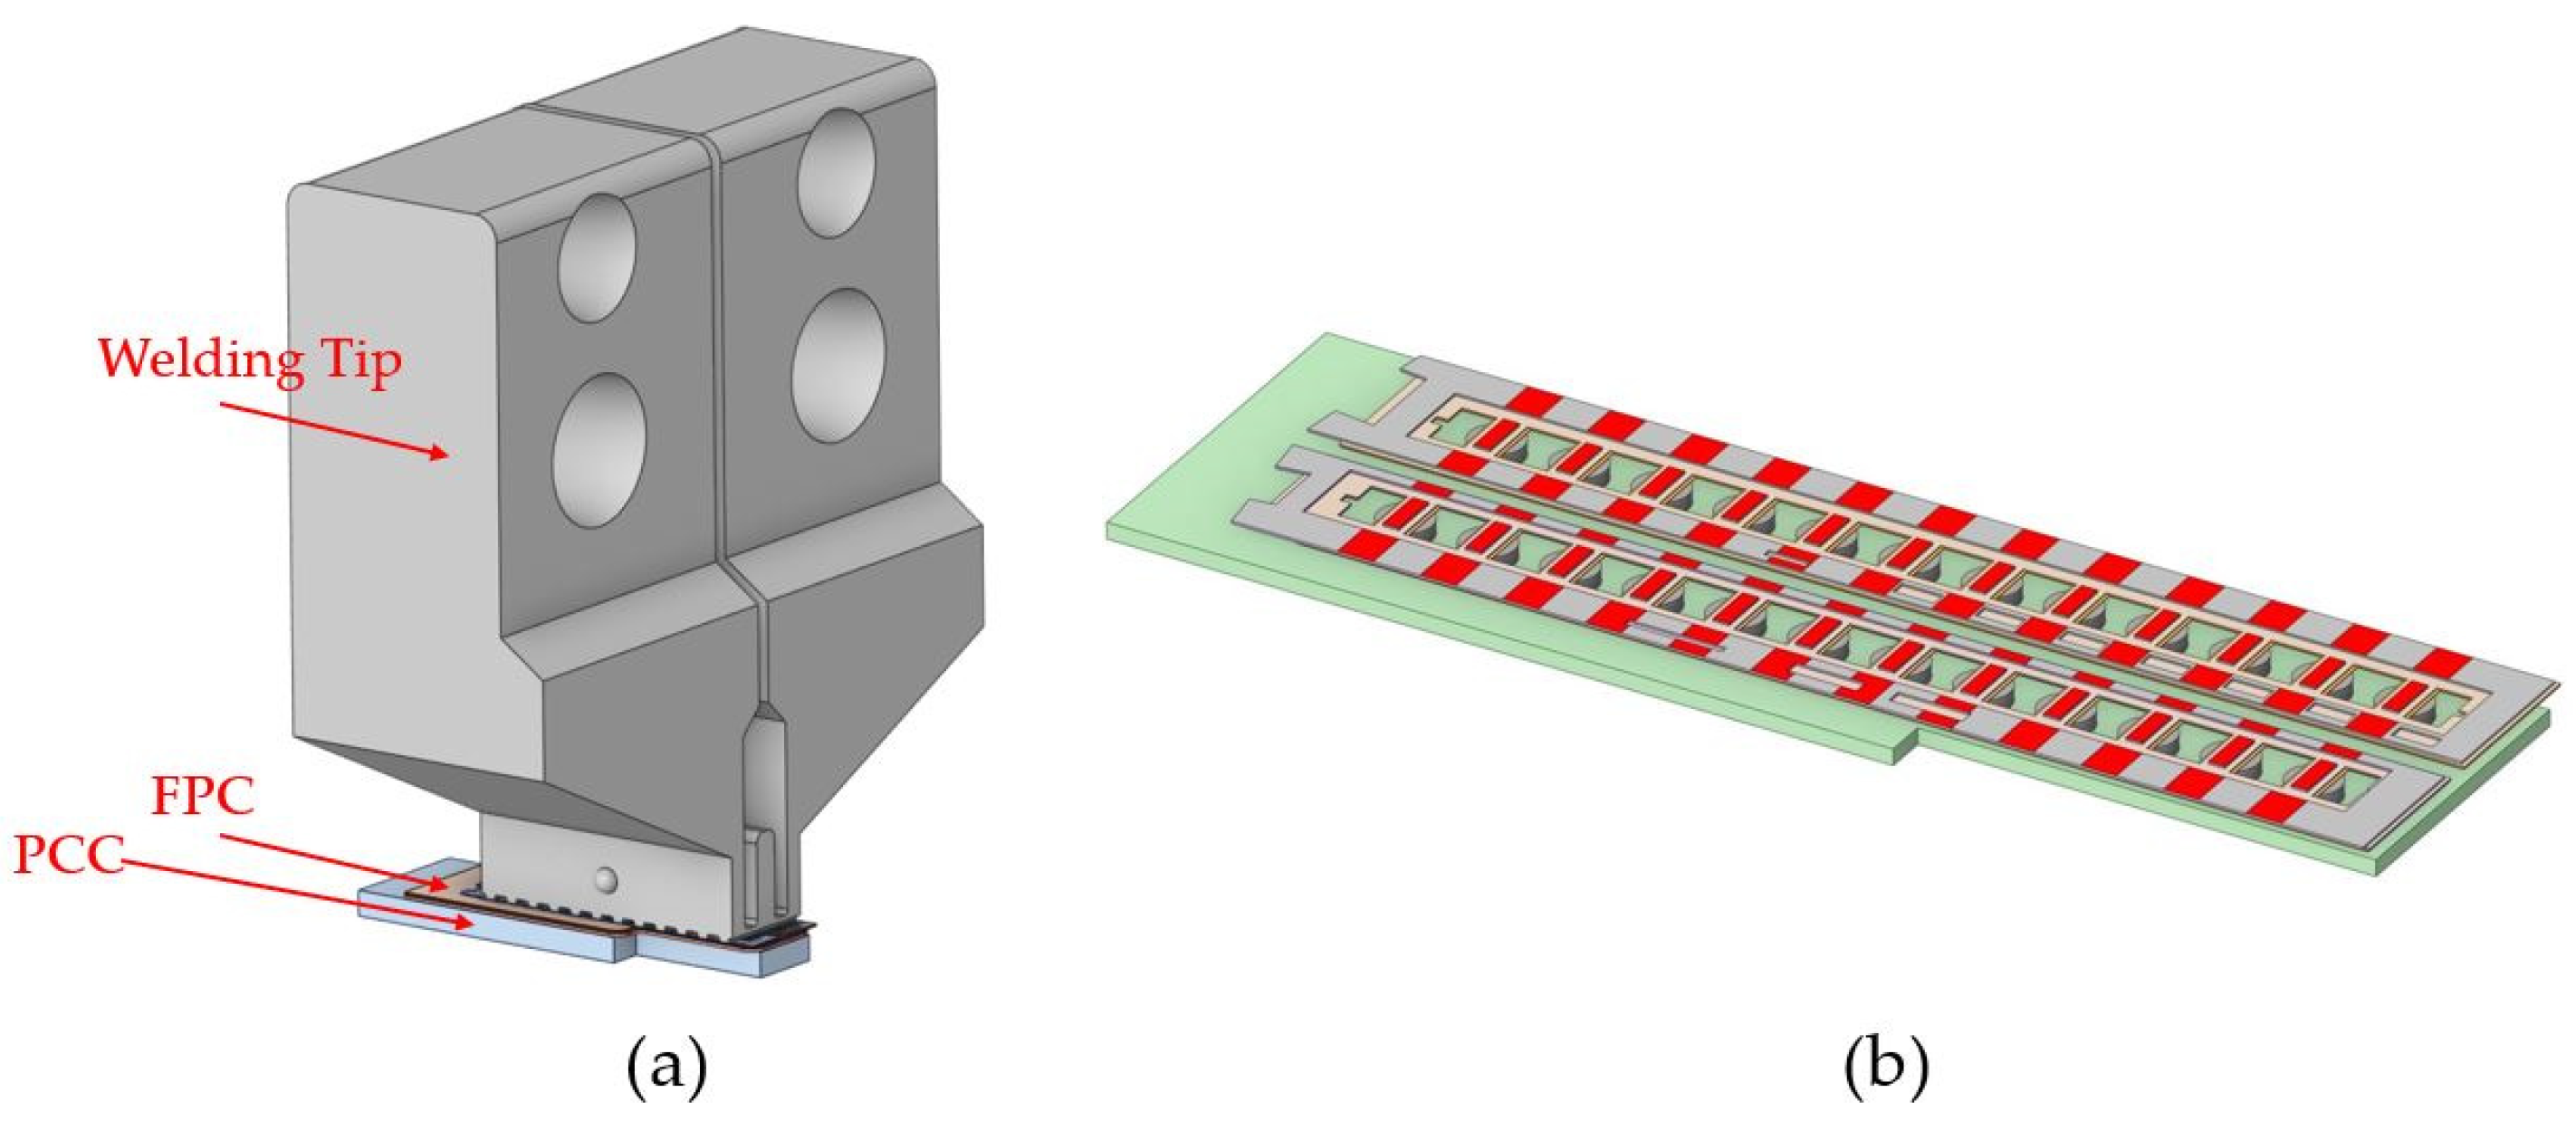
3.1. Designing and Inventing the WT
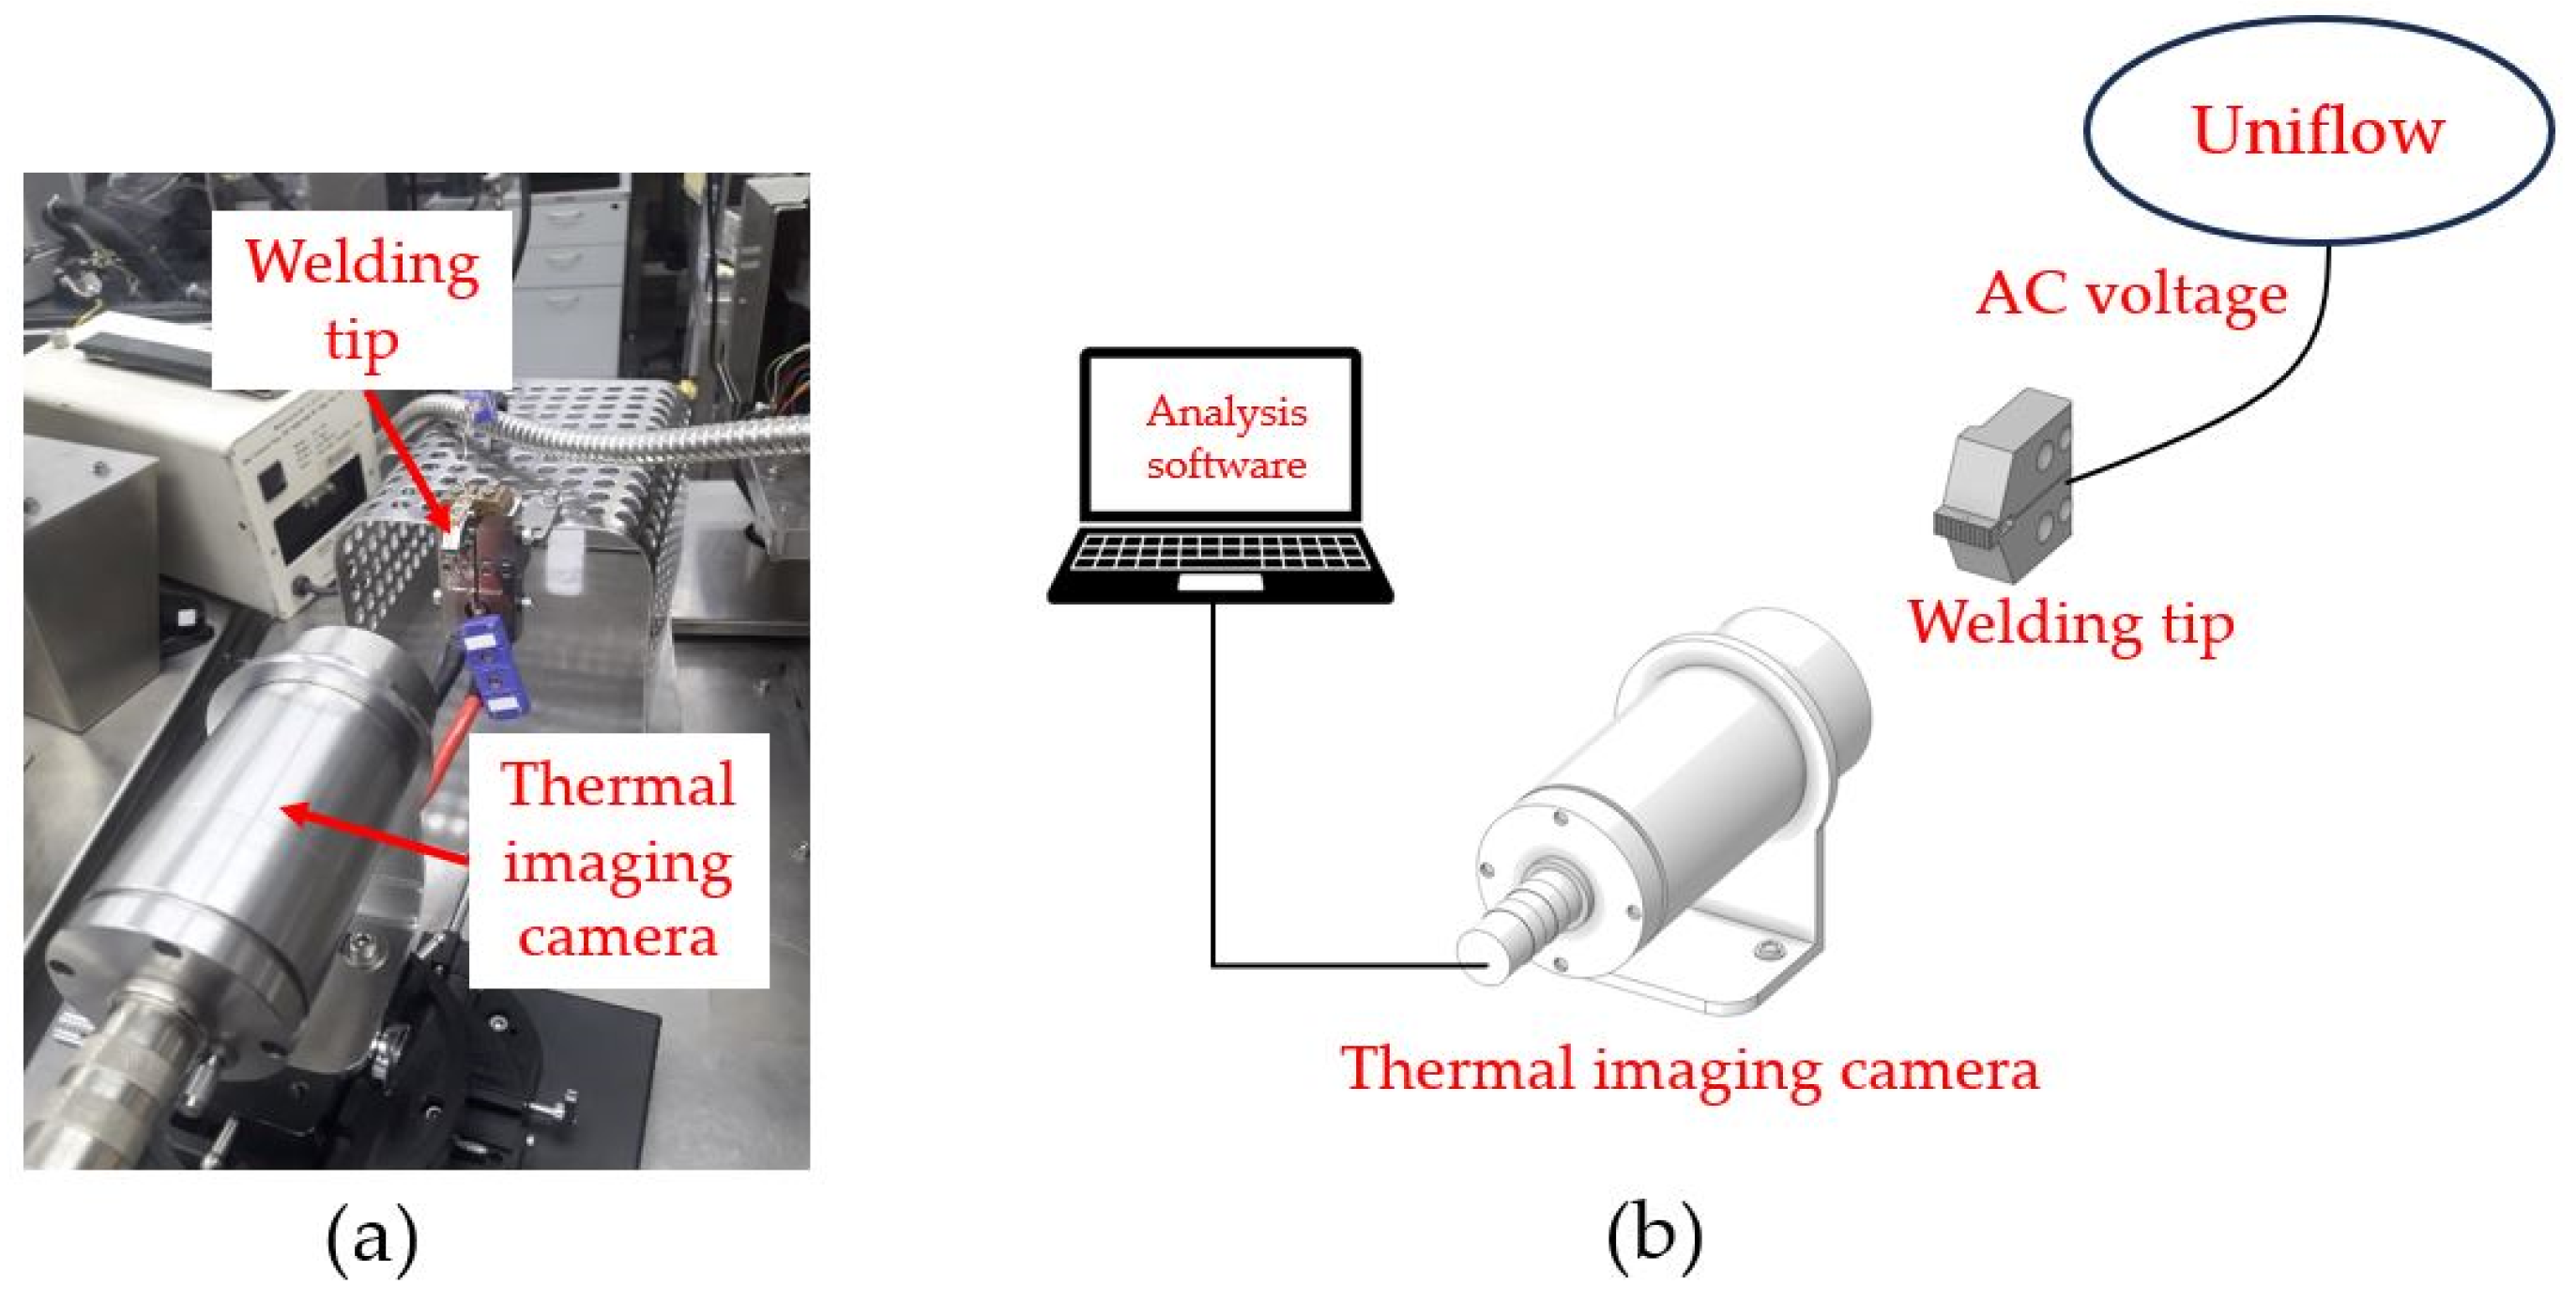
3.2. Measurement
3.3. Theoretical Calculation
3.4. Multiphysics
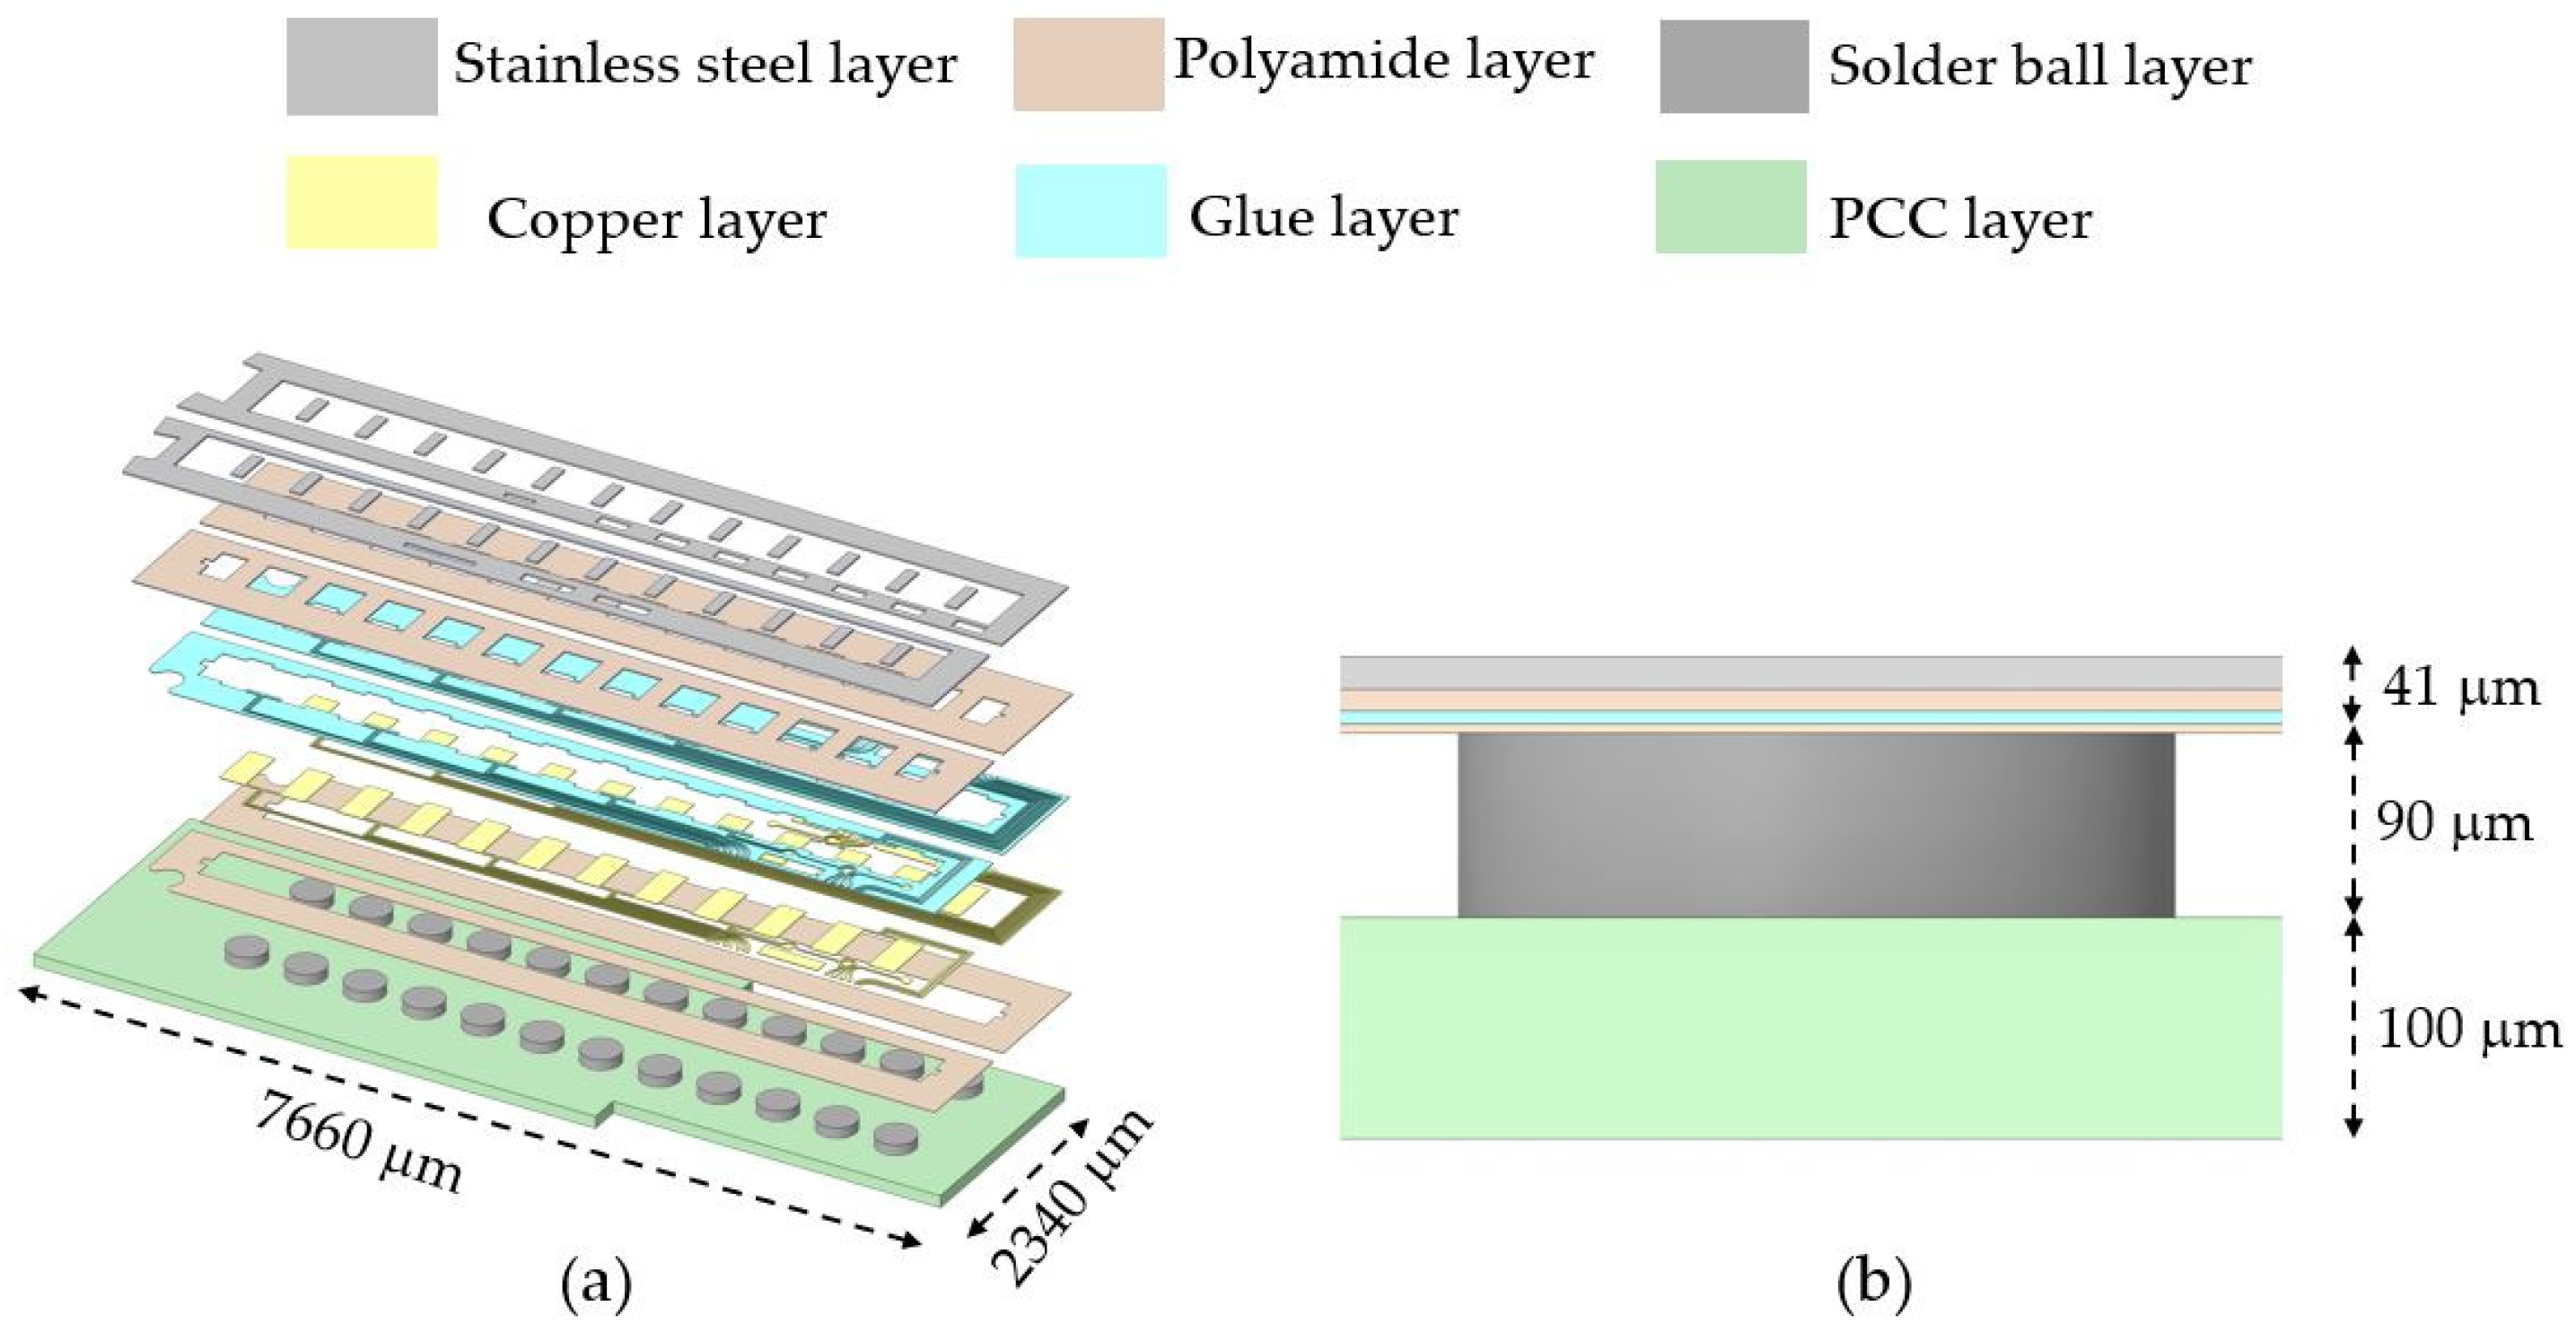
3.4.1. Models
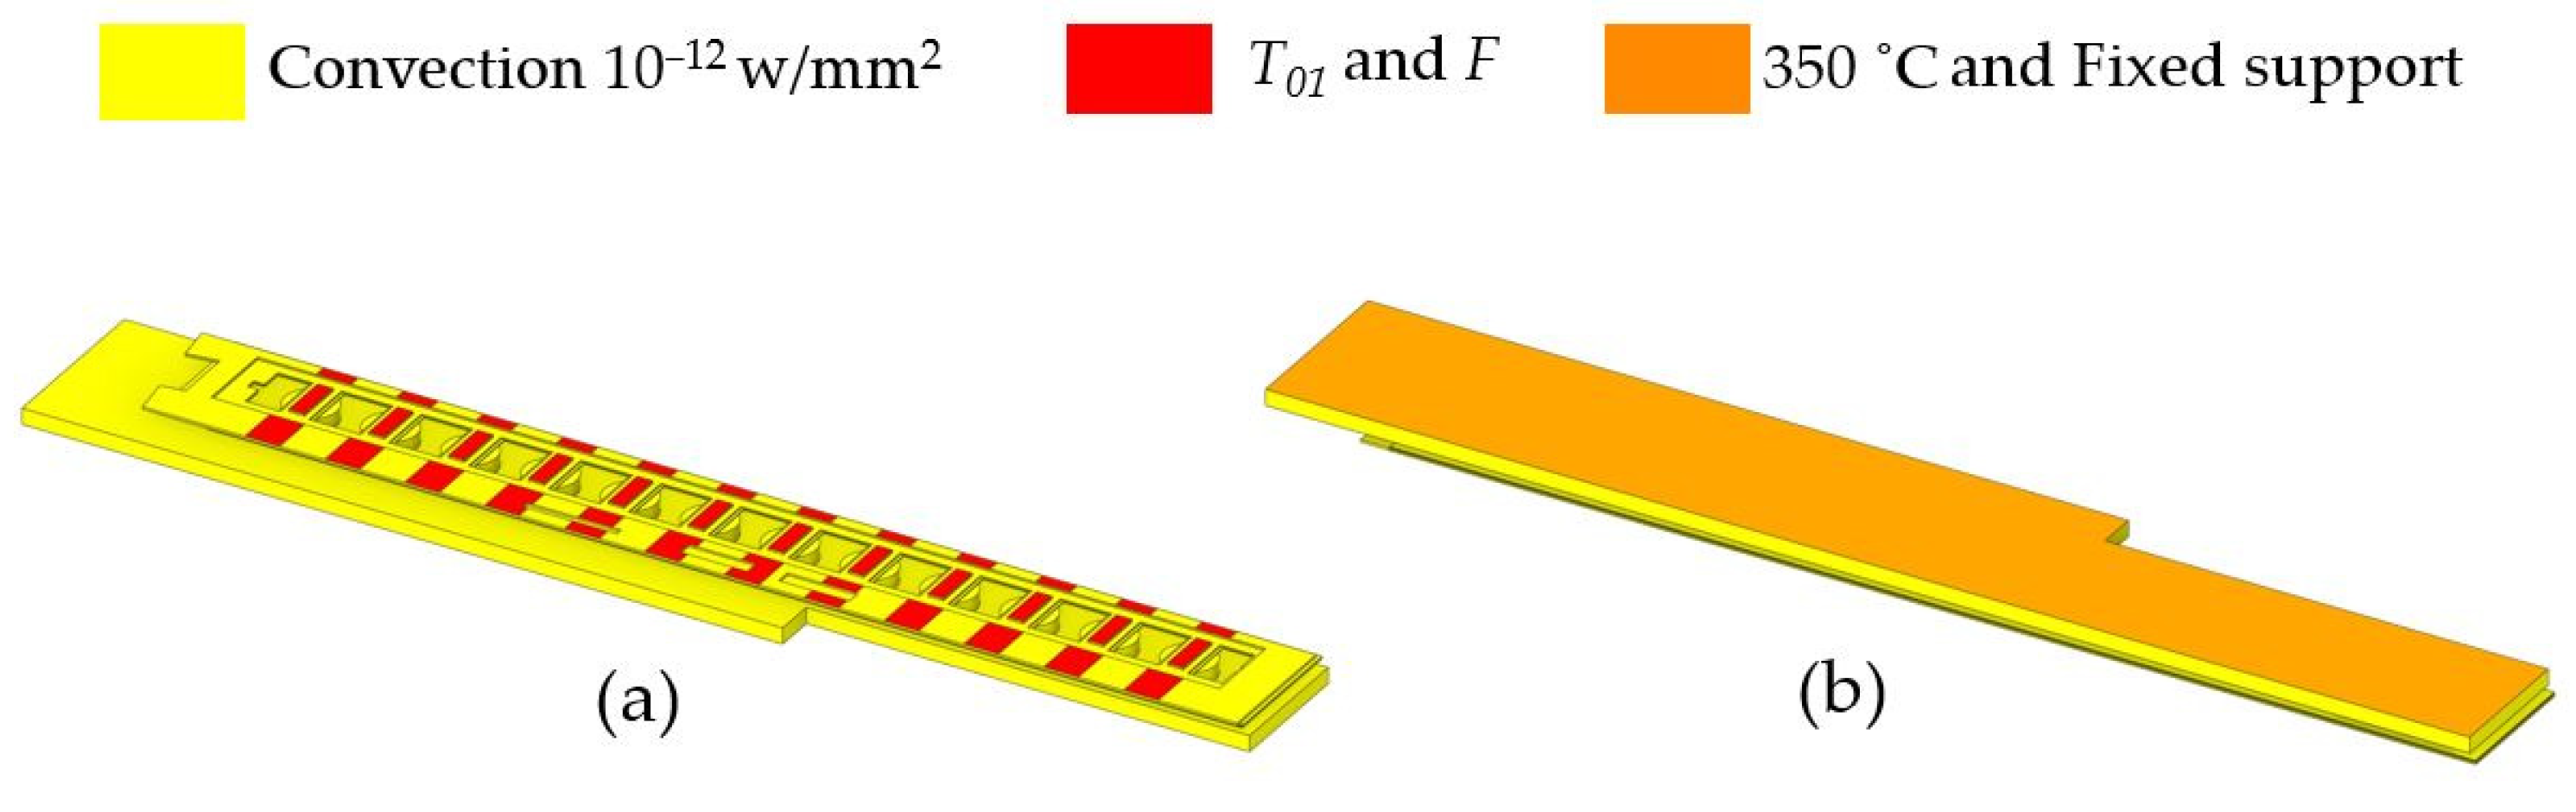
3.4.2. Boundary Conditions and Material Property Settings
4. Results and Discussion
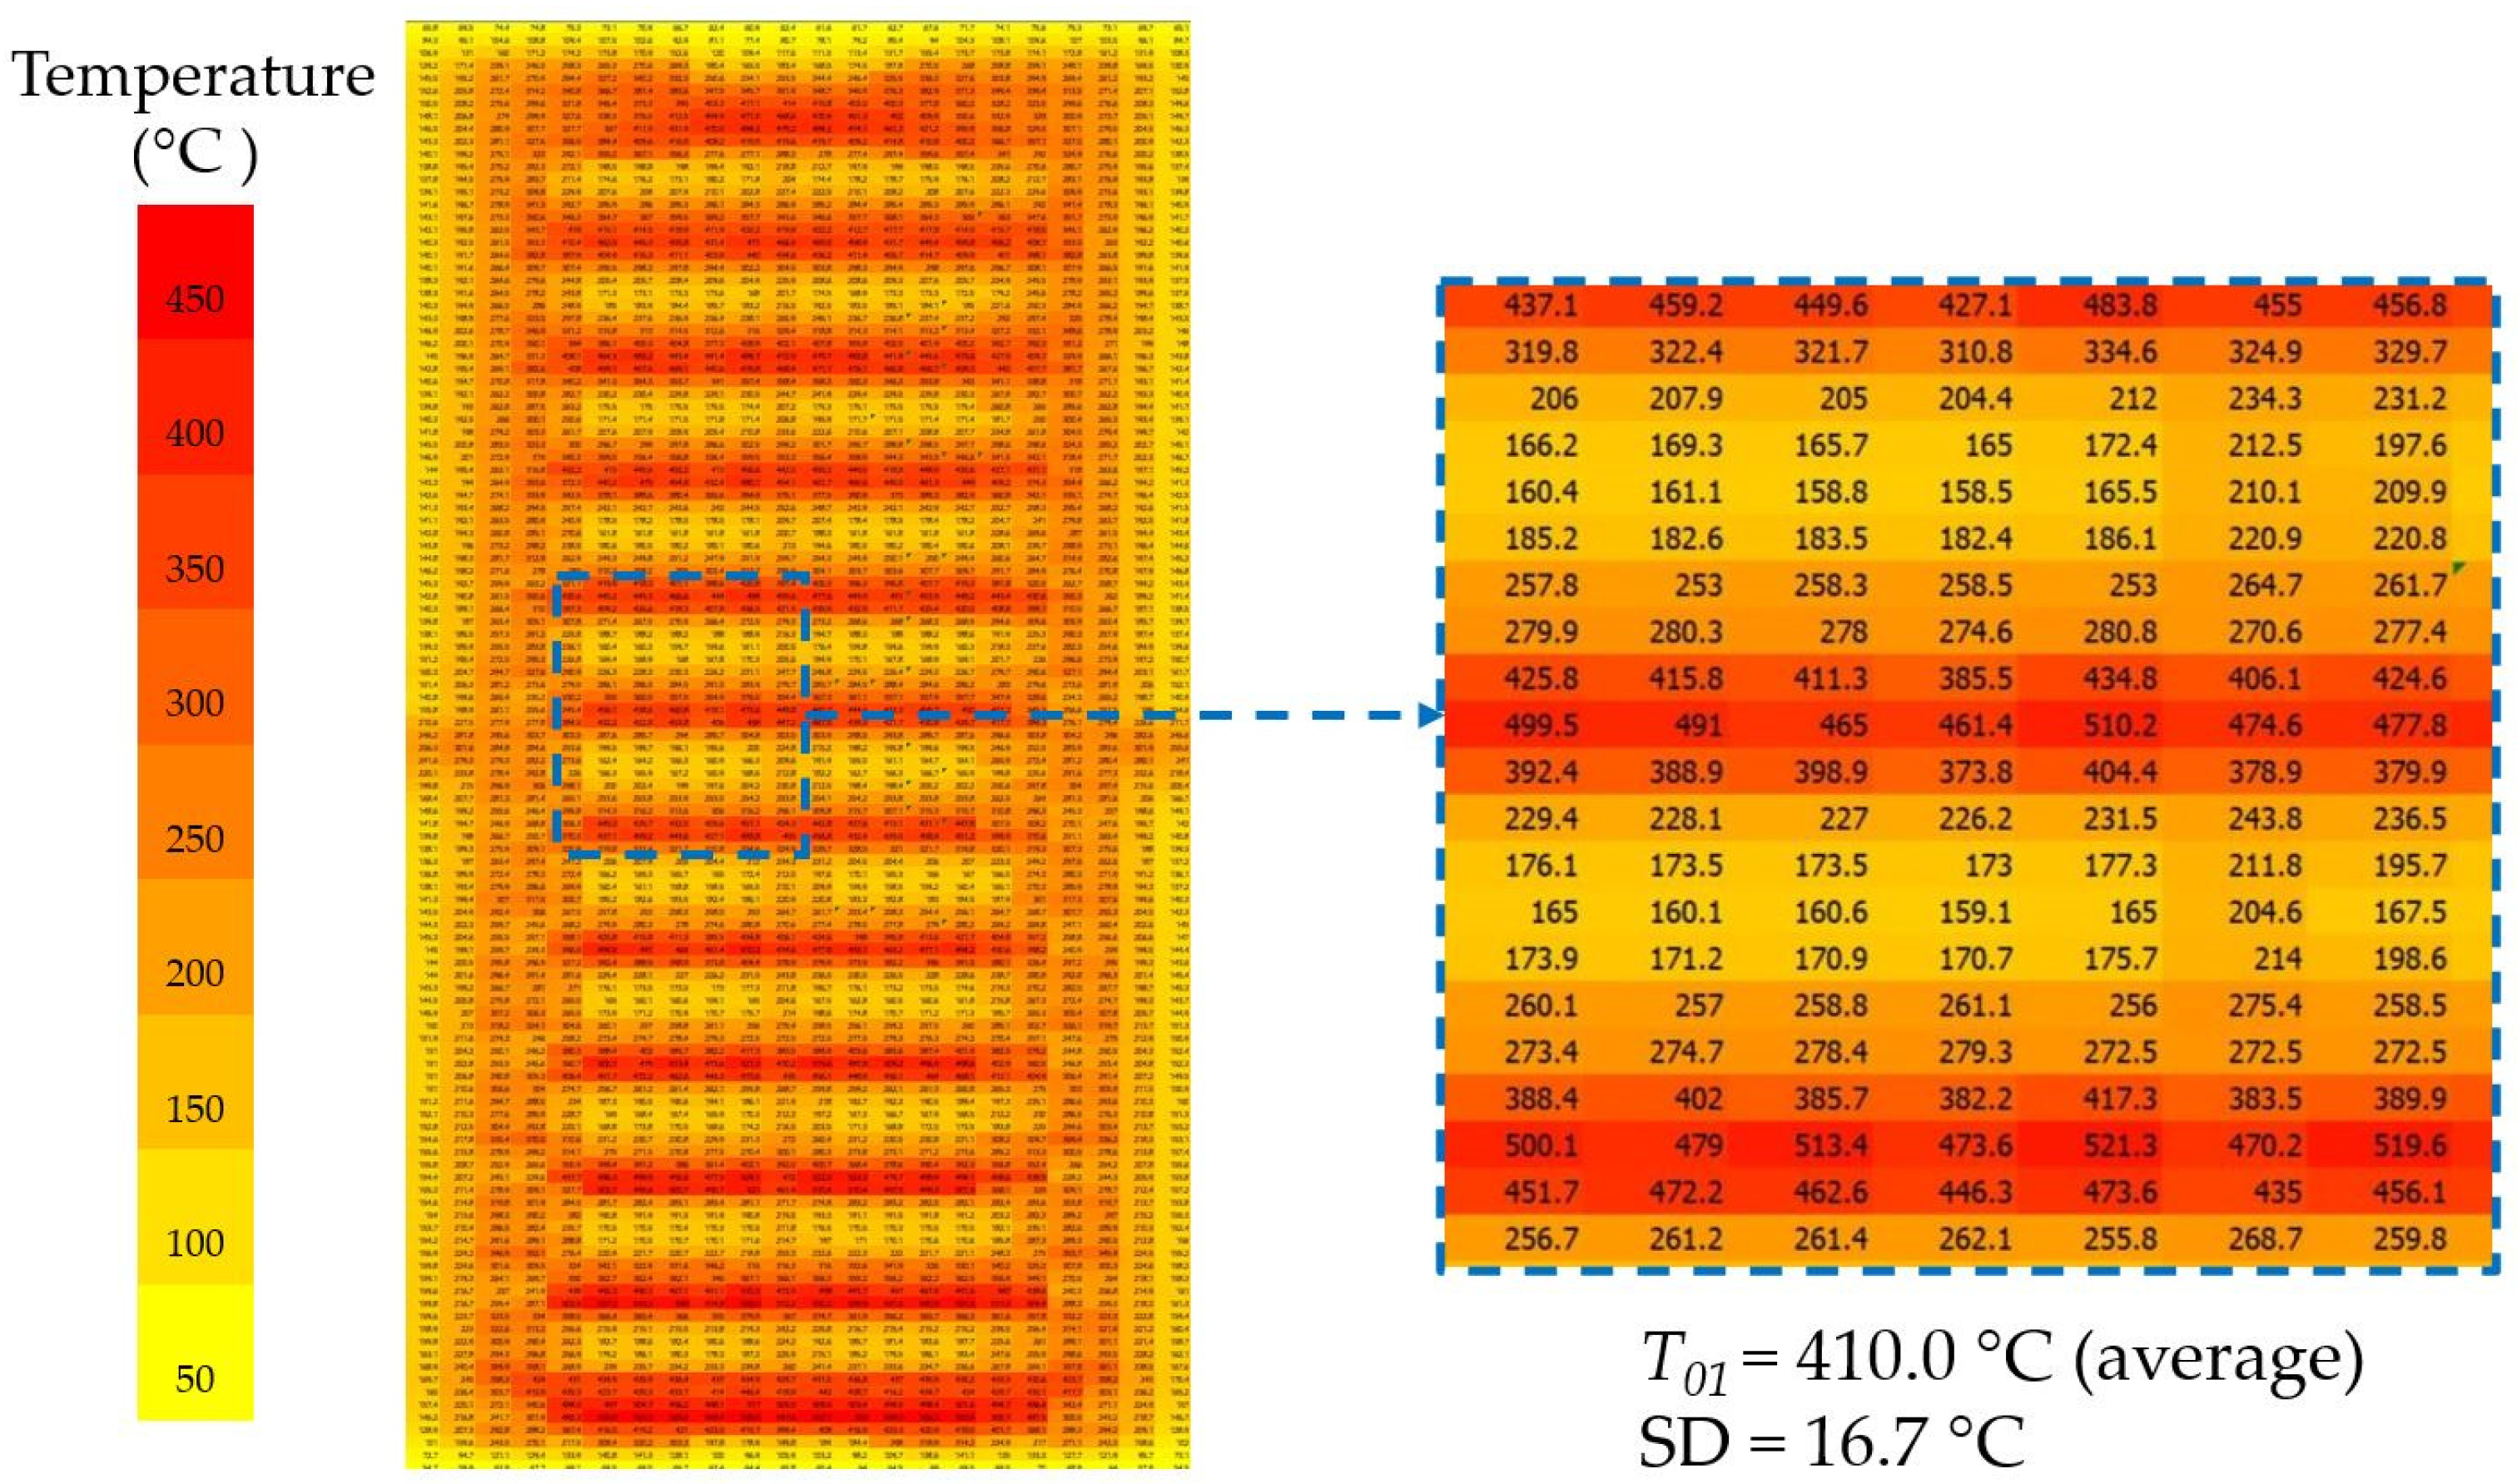
4.1. Measured Temperature Results at the Head Tip
4.2. Validation of Multiphysics Results
4.3. Thermal and Mechanical Responses in HDD Components
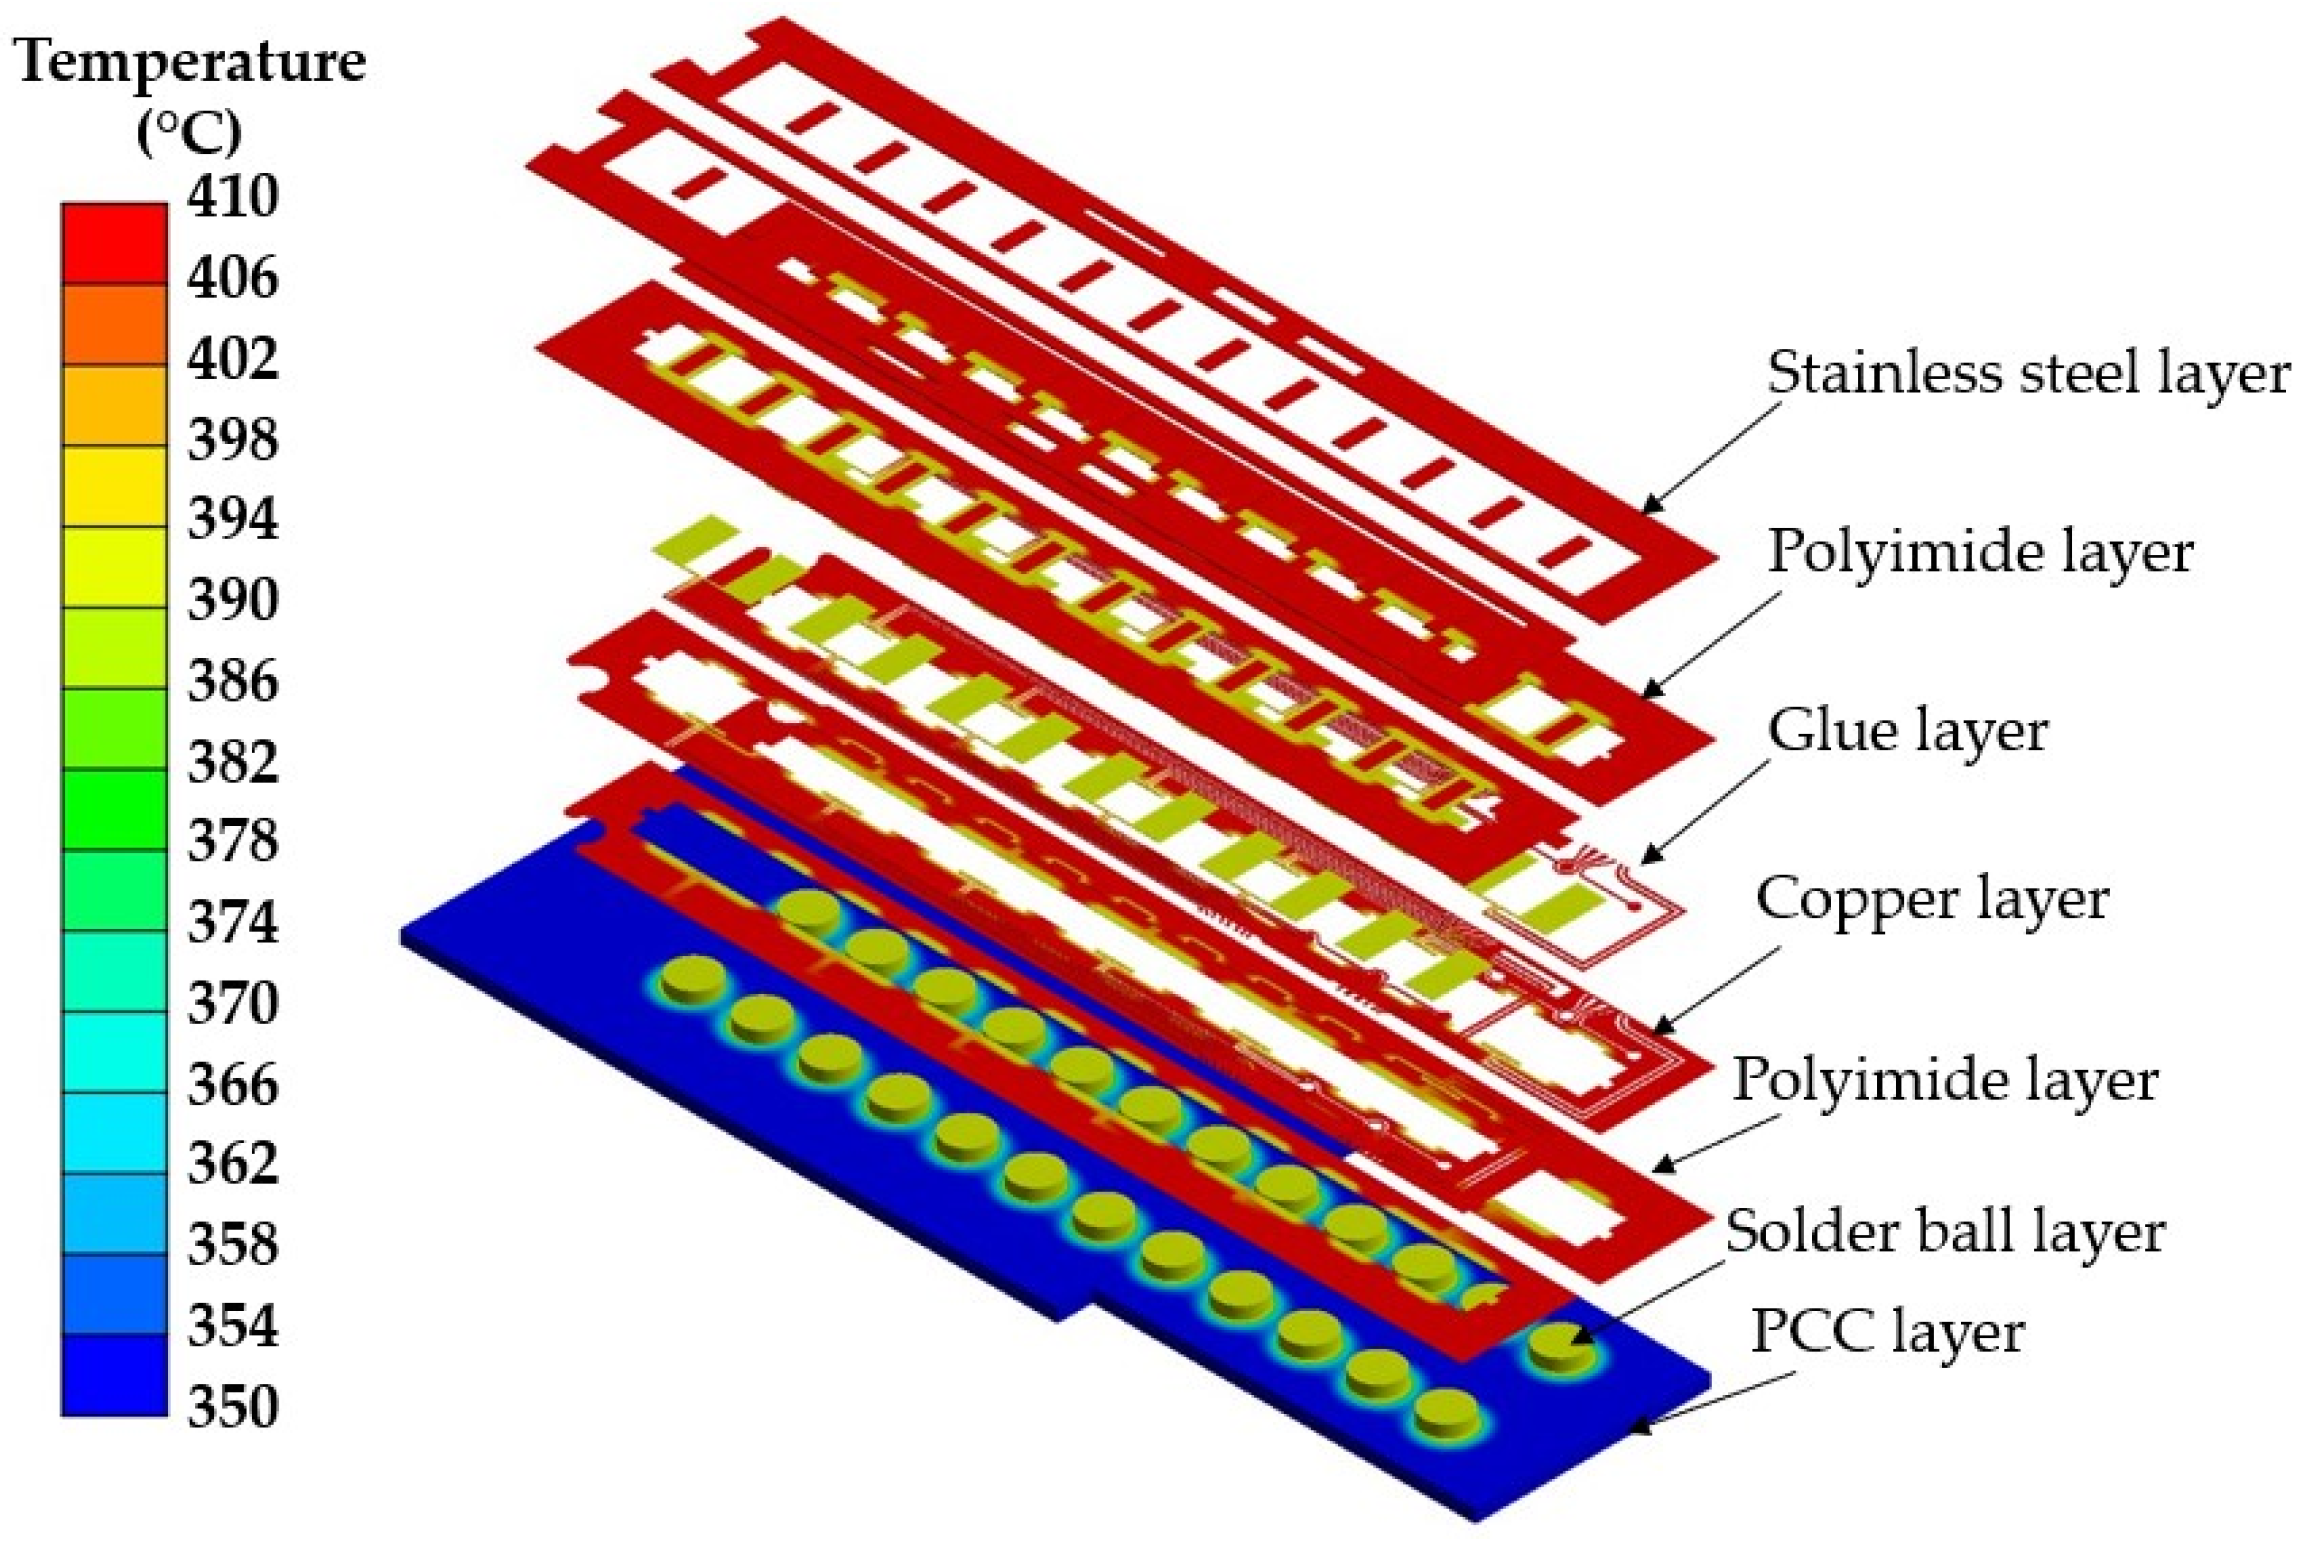
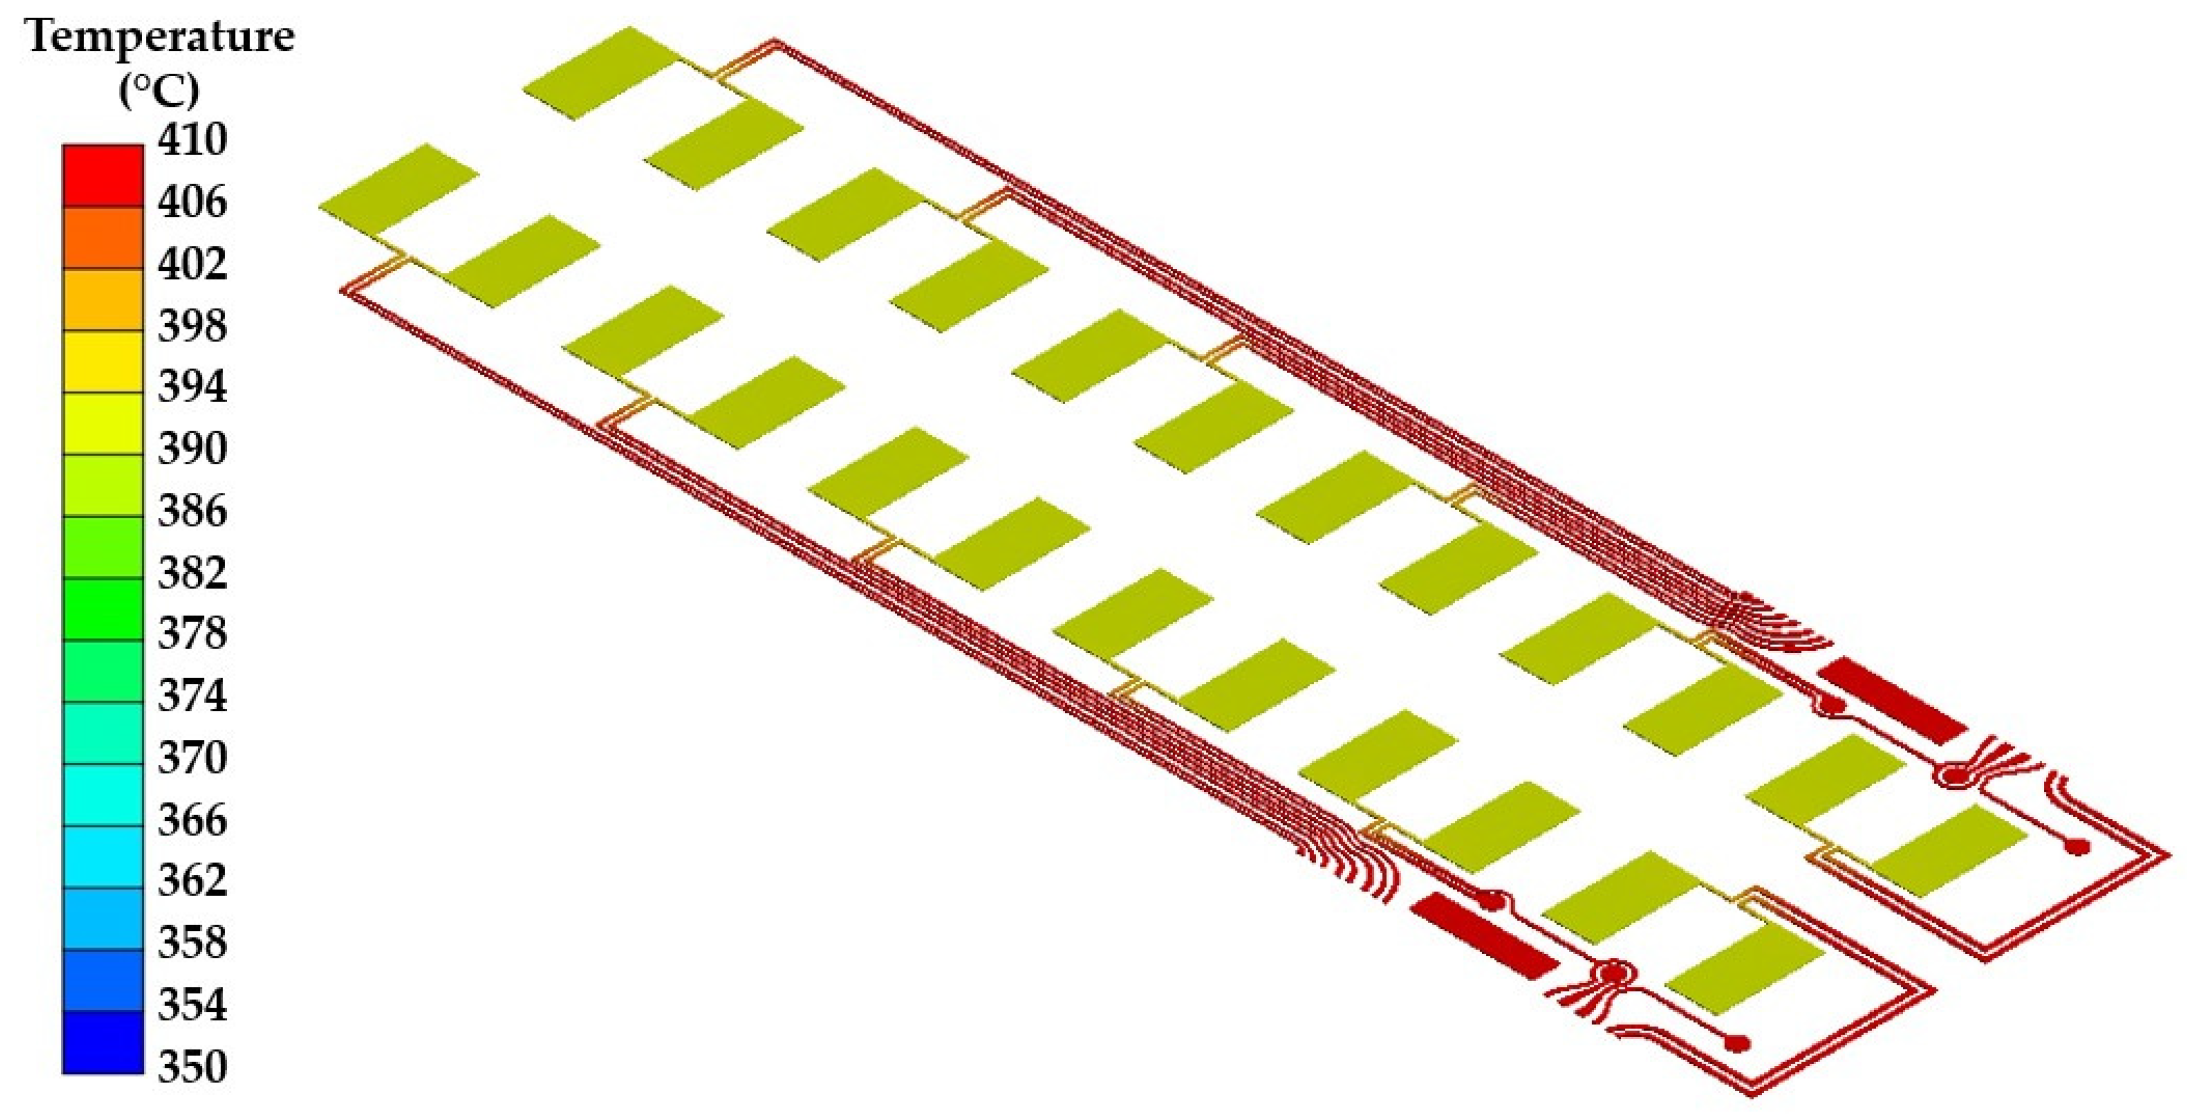
4.3.1. Thermal Response
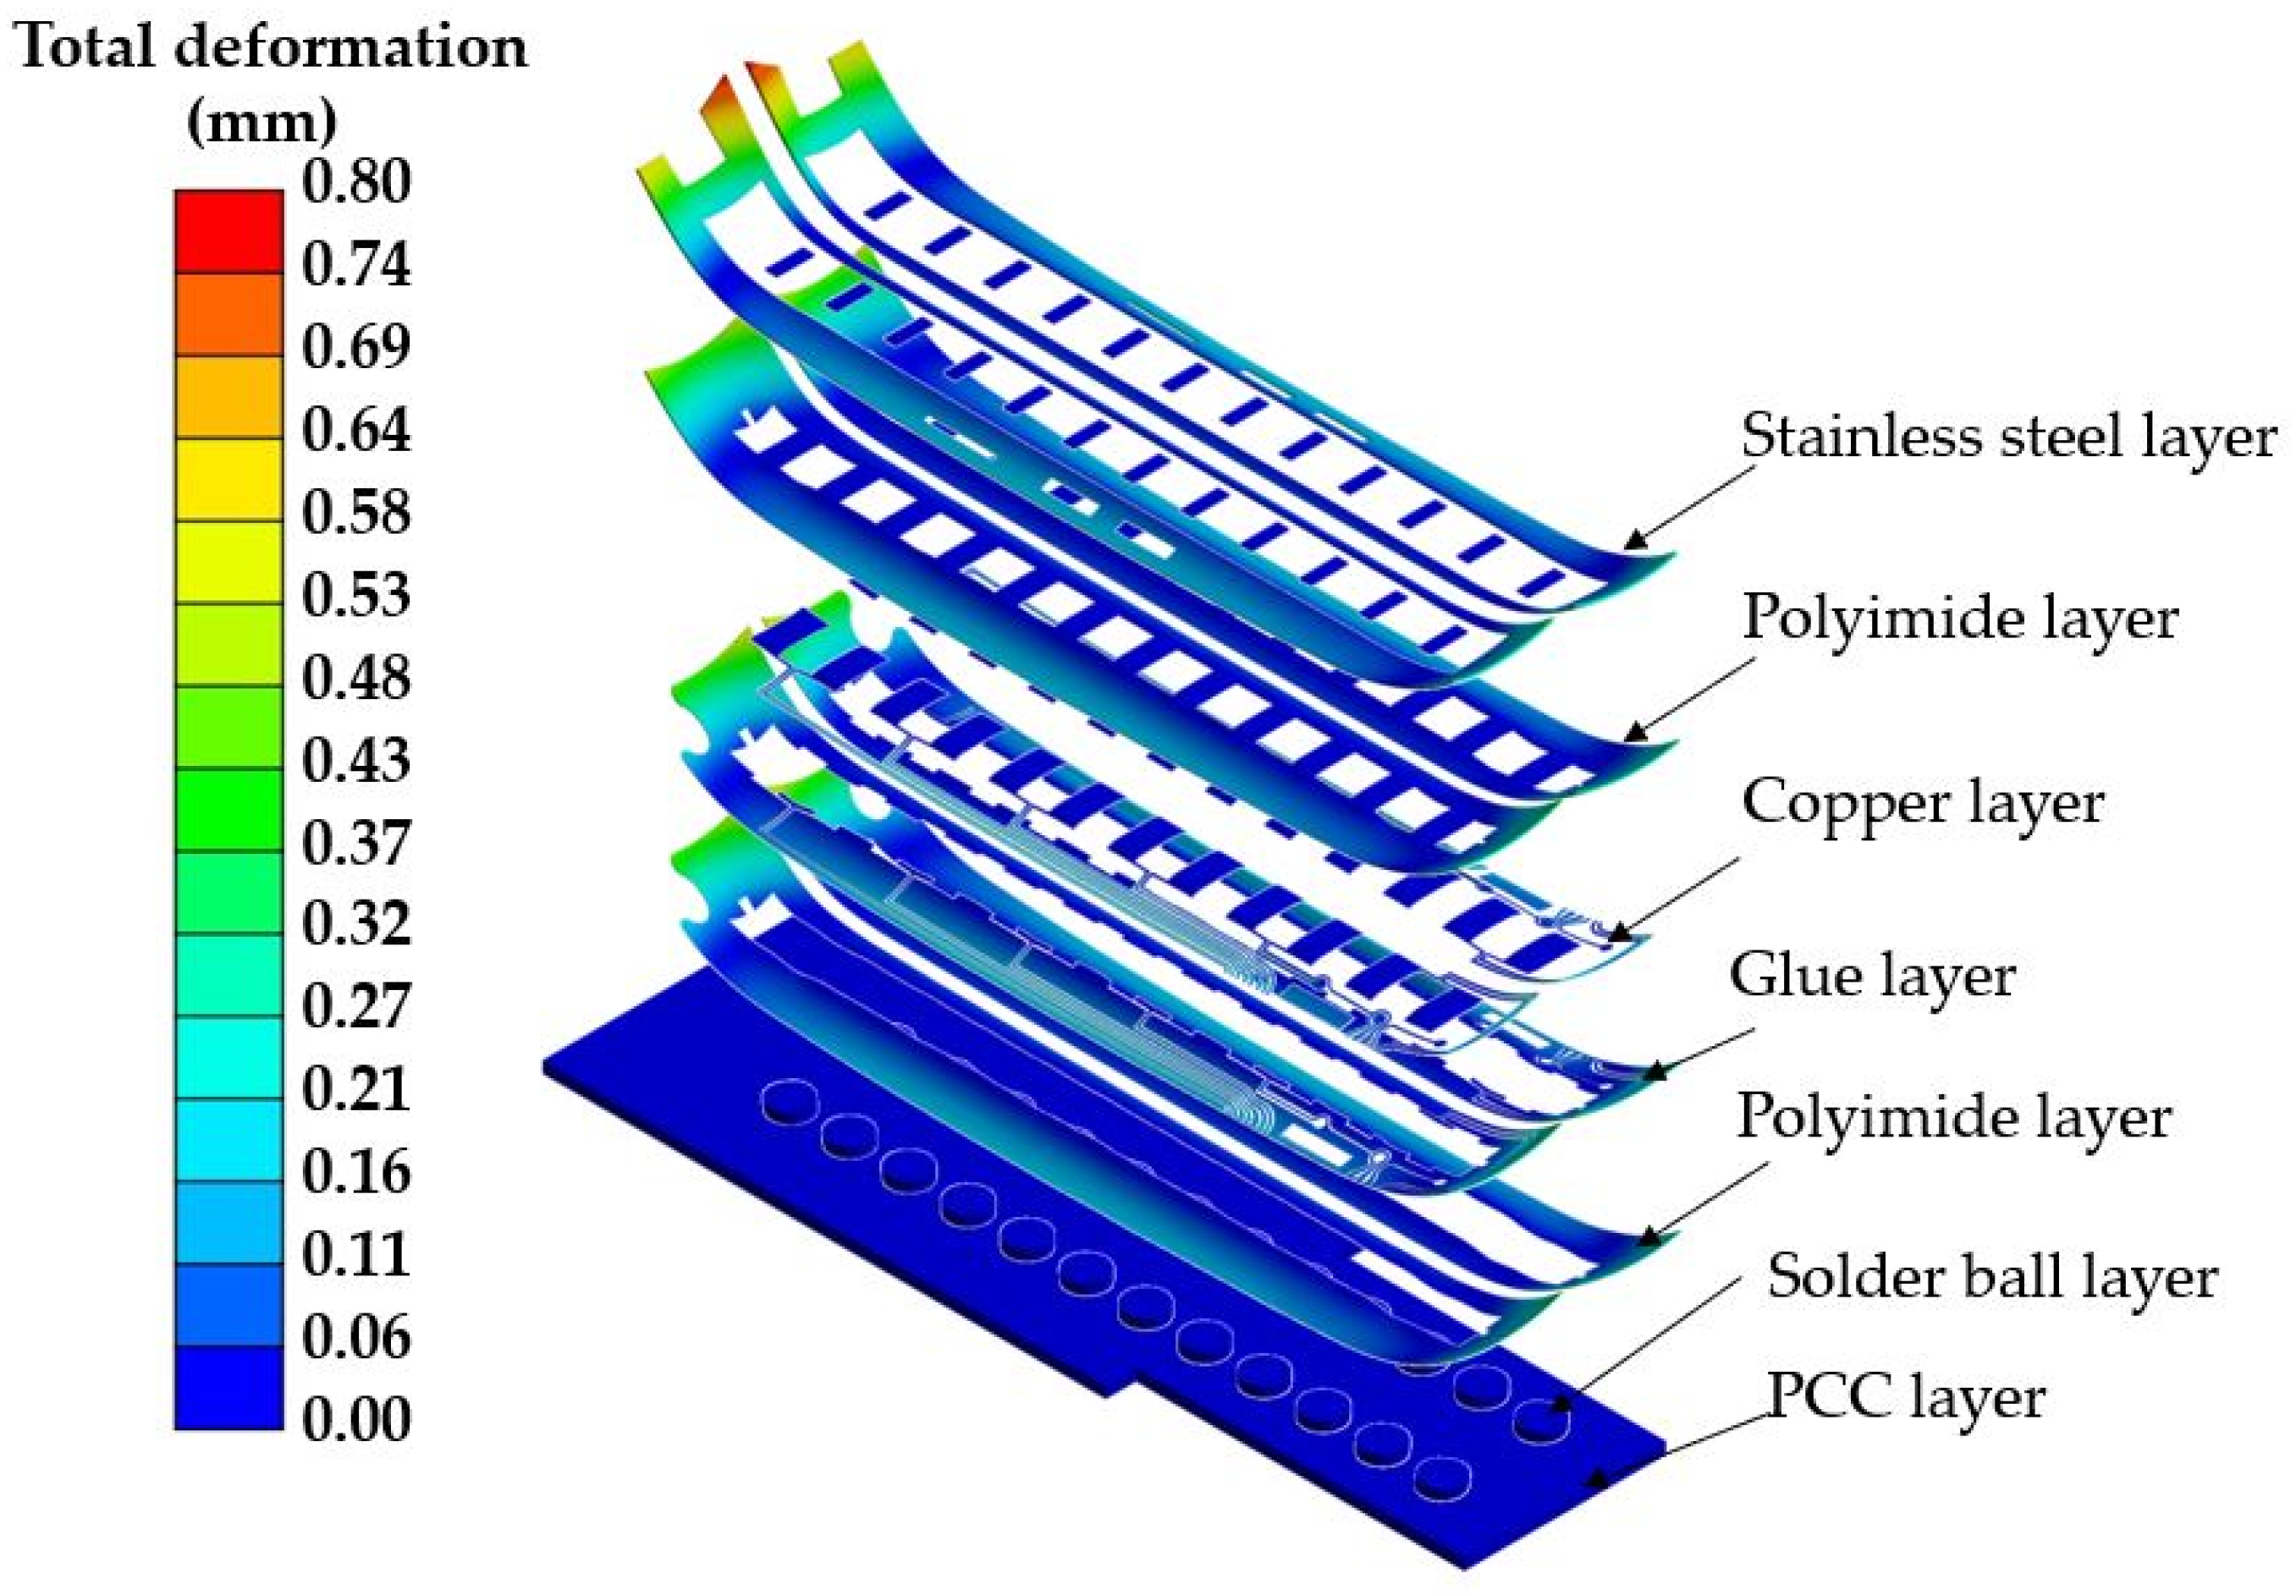
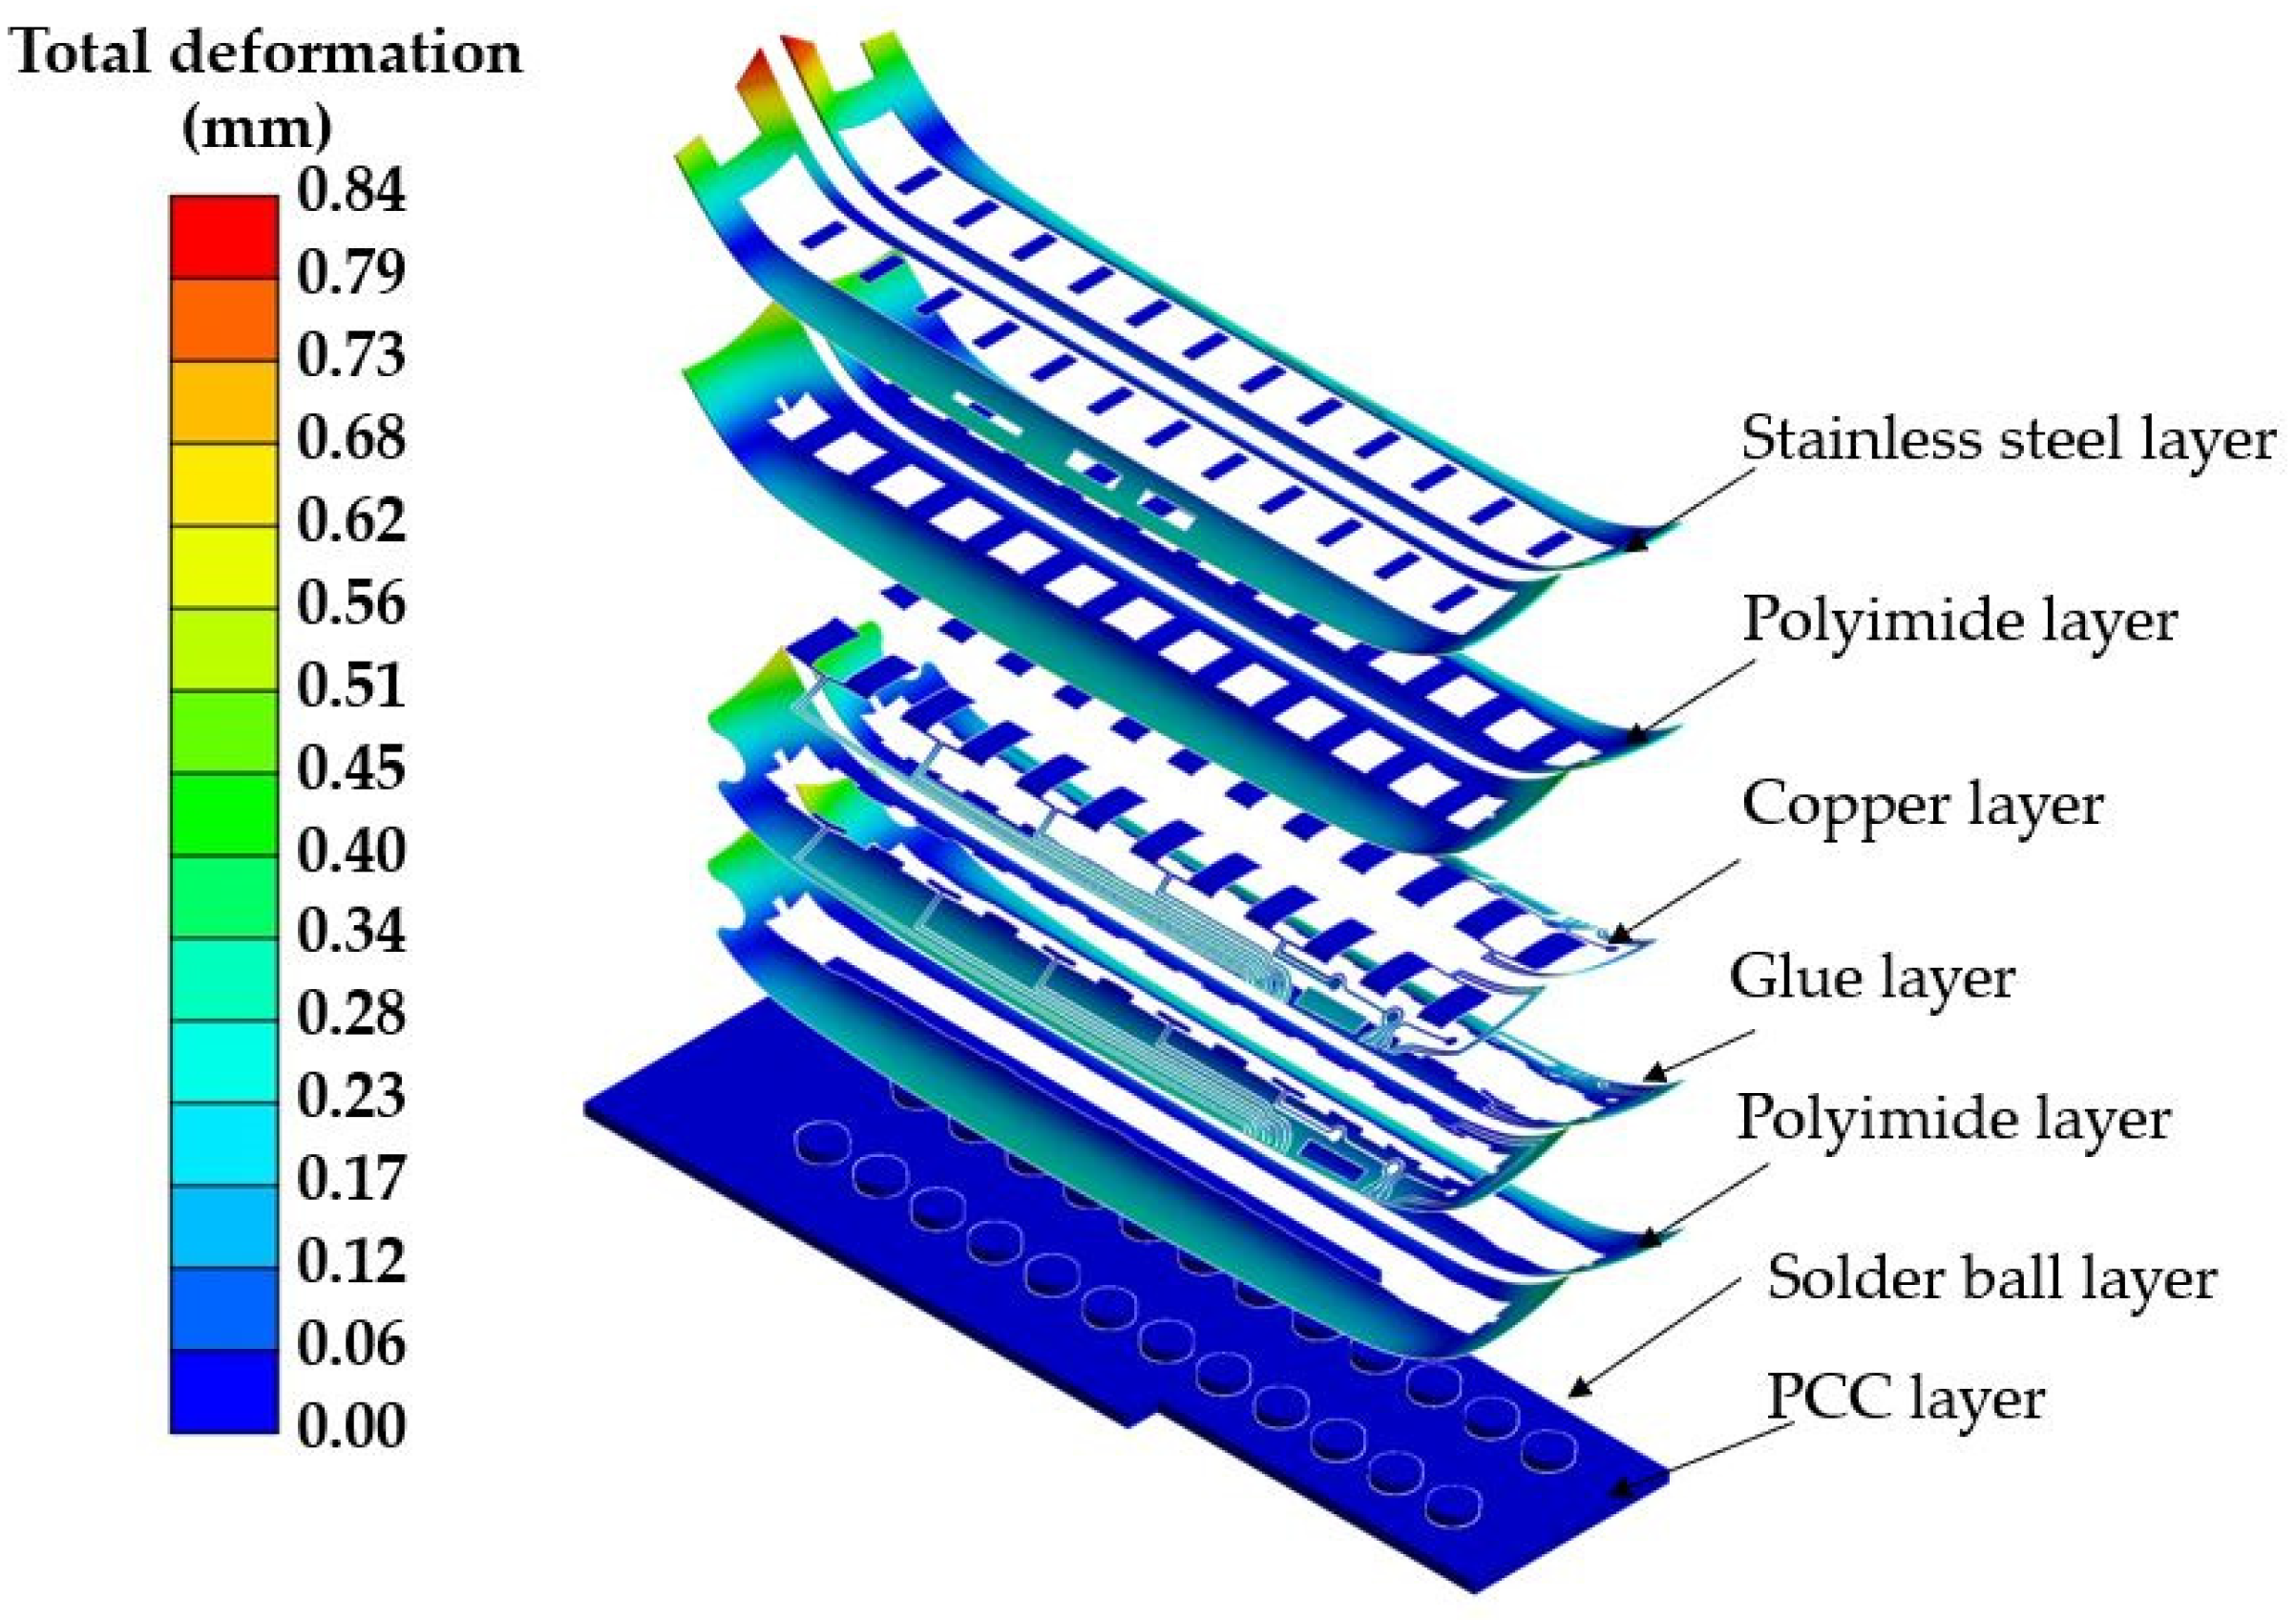
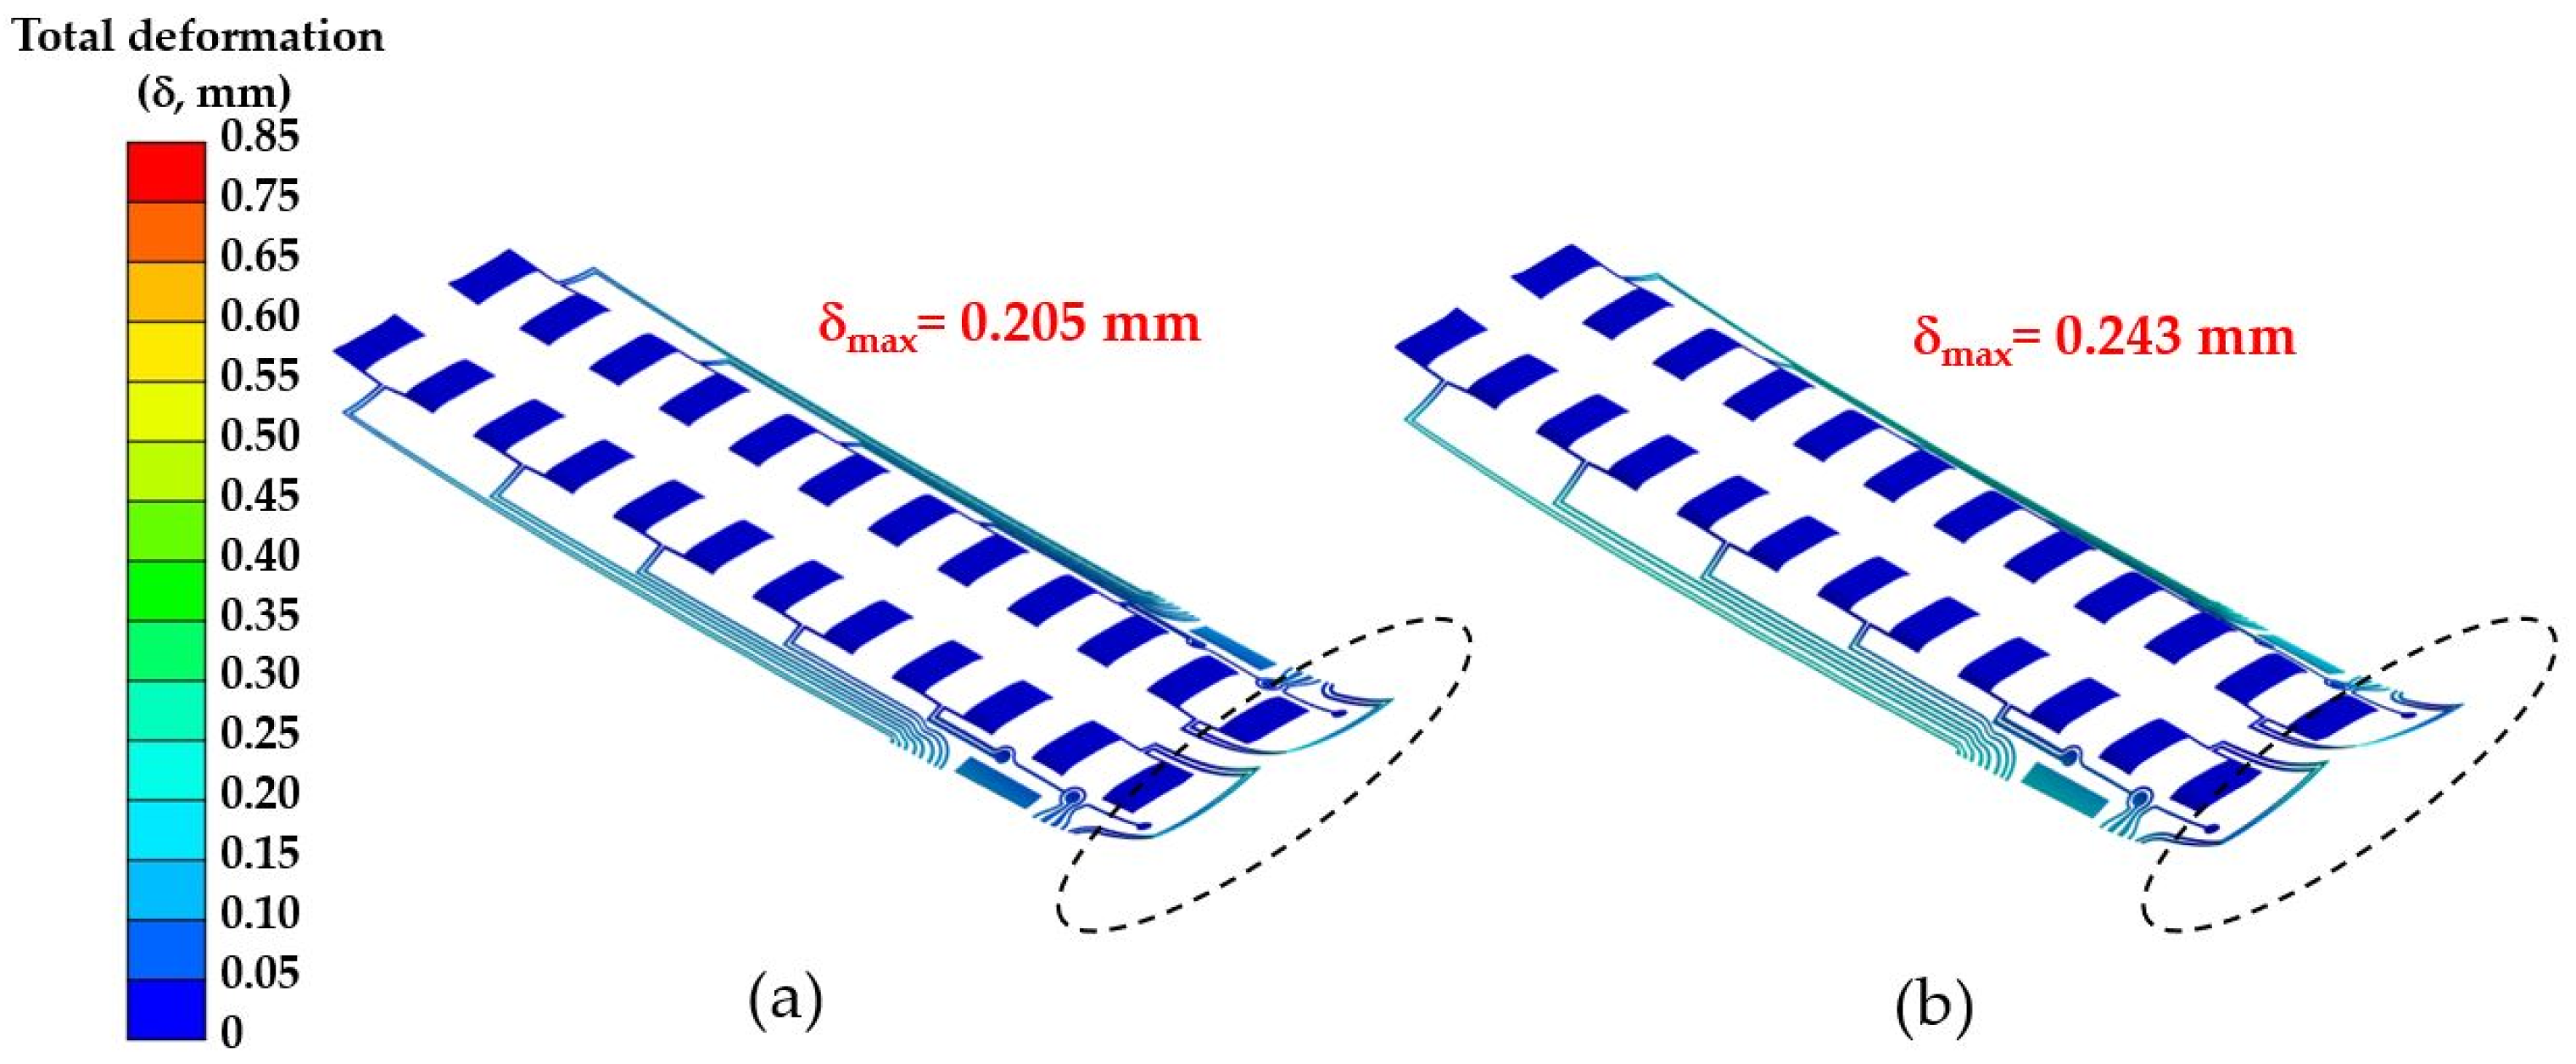
4.3.2. Mechanical Response
5. Conclusions
Author Contributions
Funding
Data Availability Statement
Acknowledgments
Conflicts of Interest
Nomenclature
| h | convection film coefficient (W/mm2·°C) |
| ρ | density (Kg/mm3) |
| {F} | external load vector (N) |
| FPC | flexible printed circuit |
| HDD | hard disk drive |
| HSA | head stack assembly |
| heat flux (W/m2) | |
| d | layer thickness (mm) |
| δmax | maximum total deformation (µm) |
| {u} | nodal displacement vector (m) |
| ν | Poisson’s ratio |
| PCC | printed circuit cable |
| RSP | reflow soldering process |
| cp | specific heat (mJ/kg·°C) |
| [K] | stiffness matrix (N/m) |
| T | temperature (°C) |
| δ | total deformation (mm) |
| k | thermal conductivity (W/mm·°C) |
| WT | welding tip |
| E | Young’s modulus (Pa) |
References
- Luksamee-Arunothai, M. The structure of Thailand’s hard disk drive sector and international production networks: An input-output analysis. J. Multidiscip. Humanit. Soc. Sci. 2023, 6, 448–468. (In Thai) [Google Scholar]
- Yongpisanphob, W. Industry Outlook 2021–2023: Electronics. Available online: https://www.krungsri.com/en/research/industry/industry-outlook/hi-tech-industries/electronics/io/io-Electronics-21 (accessed on 19 June 2024). (In Thai).
- Illés, B.; Krammer, O.; Geczy, A. Reflow Soldering; Elsevier: Amsterdam, The Netherlands, 2020. [Google Scholar]
- Sengupta, R. Principles of Reliable Soldering Techniques; New Age International: New Delhi, India, 1997. [Google Scholar]
- Deng, S.S.; Hwang, S.J.; Lee, H.H. Temperature Prediction for System in Package Assembly During the Reflow Soldering Process. Int. J. Heat Mass Transf. 2016, 98, 1–9. [Google Scholar] [CrossRef]
- Thongsri, J. Transient Thermal-Electric Simulation and Experiment of Heat Transfer in Welding Tip for Reflow Soldering Process. Math. Probl. Eng. 2018, 2018, 4539054. [Google Scholar] [CrossRef]
- Thongsri, J.; Jansaengsuk, T. A Development of Welding Tips for the Reflow Soldering Process Based on Multiphysics. Processes 2022, 10, 2191. [Google Scholar] [CrossRef]
- Luo, D.; Wang, R.; Yu, W.; Zhou, W. A Novel Optimization Method for Thermoelectric Module Used in Waste Heat Recovery. Energy Convers. Manag. 2020, 209, 112645. [Google Scholar] [CrossRef]
- Luo, D.; Yan, Y.; Wang, R.; Zhou, W. Numerical Investigation on the Dynamic Response Characteristics of a Thermoelectric Generator Module under Transient Temperature Excitations. Renew. Energy 2021, 170, 811–823. [Google Scholar] [CrossRef]
- Sun, Z.; Luo, D.; Wang, R.; Li, Y.; Yan, Y.; Cheng, Z.; Chen, J. Evaluation of Energy, Recovery Potential of Solar Thermoelectric Generators using a Three-Dimension Transient Numerical Model. Energy 2022, 256, 124667. [Google Scholar] [CrossRef]
- Kattan, H.; Chung, S.W.; Henkel, J.; Amrouch, H. On-Demand Mobile CPU Cooling with Thin-Film Thermoelectric Array. IEEE Micro 2021, 41, 67–73. [Google Scholar] [CrossRef]
- Zhang, H.; Shen, T.; Yap, S.H.; Young-Fisher, K.; Justison, P. Thermal-Electric Transient Analysis for Metal Line under High Frequency Pulse Direct Current. In Proceedings of the 2019 18th IEEE Intersociety Conference on Thermal and Thermomechanical Phenomena in Electronic Systems (ITherm), Las Vegas, NV, USA, 28–31 May 2019; pp. 761–765. [Google Scholar] [CrossRef]
- Zaretabar, M.; Asadian, H.; Ganji, D.D. Numerical Simulation of Heat Sink Cooling in the Mainboad Chip of a Computer with Temperature Dependent Thermal Conductivity. Appl. Therm. Eng. 2018, 130, 1450–1459. [Google Scholar] [CrossRef]
- Thognsri, J.; Srathonghuam, K.; Boonpan, A. Gas Flow and Ablation of 122 mm Supersonic Rocket Nozzle Investigation by Conjugate Heat Transfer Analysis. Processes 2022, 10, 1823. [Google Scholar] [CrossRef]
- ANSYS, Inc. Thermal Analysis Software. Available online: https://www.ansys.com/applications/thermal-analysis-simulation-software (accessed on 21 June 2024).
- Soni, A.K.; Godara, S.S.; Gade, R.; Brenia, V.; Shekhawat, R.S.; Saxena, K.K.; Prasad, R. Modelling and Thermal Analysis for Automobile Piston using ANSYS. Int. J. Interact. Des. Manuf. 2023, 17, 2473–2487. [Google Scholar] [CrossRef]
- Appadurai, M.; Fantin, E.; Venkadeshwaran, K. Finite element design and thermal analysis of an induction motor used for a hydraulic pumping system. Mater. Today Proc. 2021, 45, 7100–7106. [Google Scholar] [CrossRef]
- Moeller, A.; Buennagel, C.; Monir, S.; Sharp, A.; Vagapov, Y.; Anuchin, A. Numerical Design and Optimisation of a Novel Heatsink using ANSYS Steady-State Thermal Analysis. In Proceedings of the 27th International Workshop on Electric Drives: MPEI Department of Electric Drives 90th Anniversary (IWED), Moscow, Russia, 27–30 January 2020; pp. 1–5. [Google Scholar] [CrossRef]
- Tang, X.Q.; Zhao, S.J.; Huang, C.Y.; Lu, L.K. Thermal Stress Strain Simulation Analysis of BGA Solder Joint Reflow Soldering Process. In Proceedings of the 2018 19th International Conference on Electronic Packaging Technology (ICEPT), Shanghai, China, 8–11 August 2018; pp. 981–986. [Google Scholar] [CrossRef]
- ANSYS, Inc. Module 01: Introduction. In Introduction to ANSYS Mechanical; ANSYS Inc.: Canonsburg, PA, USA, 2016. [Google Scholar]
- Hibbeler, R.C. Structural Analysis, 10th ed.; Pearson Education Inc.: Kuala Lumpur, Malaysia, 2020; pp. 1–18. [Google Scholar]
- Bergman, T.L.; Lavine, A.S.; Incropera, F.P.; Dewitt, D.P. Introduction to Heat Transfer, 6th ed.; John Wiley & Son: Hoboken, NJ, USA, 2011; pp. 112–116. [Google Scholar]
- ANSYS, Inc. Module 07: Modal, Thermal, and Multistep Analysis. In Introduction to ANSYS Mechanical; ANSYS Inc.: Canonsburg, PA, USA, 2016. [Google Scholar]
- ANSYS, Inc. Module 05: Mesh Quality & Advanced Topics. In Introduction to ANSYS Meshing; ANSYS Inc.: Canonsburg, PA, USA, 2016. [Google Scholar]
- Sadrehaghighi, I. Mesh Independent Sensitivity & Independent Study; CFD Open Series; 2020; pp. 1–20. Available online: https://www.researchgate.net/publication/339289671_Mesh_Sensitivity_Mesh_Independence_Study (accessed on 17 September 2024).


| Material | ρ (×10−6 Kg/mm3) | cp (×105 mJ/kg·°C) | k (W/mm·°C) | d (µm) | ν | E (MPa) | h (W/mm2 ·°C) |
|---|---|---|---|---|---|---|---|
| Stainless steel | 8.02 | 4.80 | 0.0151 | 15 | 0.32 | 1.93 × 10⁵ | 10−12 |
| Polyimide | 1.40 | 23.00 | 0.0003 | 10 | 0.30 | 6190 | |
| Copper alloy | 8.30 | 3.85 | 0.4010 | 0.1 | 0.34 | 1.1 × 10⁵ | |
| Glue (Epoxy) | 1.19 | 15.79 | 0.0003 | 14 | 3000 | 3000 | |
| Solder (lead) | 8.90 | 2.10 | 0.4948 | 90 | 14,870 | 14,870 | |
| FCC (FR−4) | 1.90 | 11.00 | 0.0004 | 100 | 24,600 | 11.03 × 10⁵ |
| Heat Flux | Theory (W/mm2) | Thermal Analysis (W/mm2) | Difference |
|---|---|---|---|
| −0.179 | −0.193 | 7.25% | |
| 0.189 | 0.193 | 2.07% |
Disclaimer/Publisher’s Note: The statements, opinions and data contained in all publications are solely those of the individual author(s) and contributor(s) and not of MDPI and/or the editor(s). MDPI and/or the editor(s) disclaim responsibility for any injury to people or property resulting from any ideas, methods, instructions or products referred to in the content. |
© 2024 by the authors. Licensee MDPI, Basel, Switzerland. This article is an open access article distributed under the terms and conditions of the Creative Commons Attribution (CC BY) license (https://creativecommons.org/licenses/by/4.0/).
Share and Cite
Kimaporn, N.; Samakkarn, C.; Thongsri, J. Multiphysics to Investigate the Thermal and Mechanical Responses in Hard Disk Drive Components Due to the Reflow Soldering Process. Processes 2024, 12, 2029. https://doi.org/10.3390/pr12092029
Kimaporn N, Samakkarn C, Thongsri J. Multiphysics to Investigate the Thermal and Mechanical Responses in Hard Disk Drive Components Due to the Reflow Soldering Process. Processes. 2024; 12(9):2029. https://doi.org/10.3390/pr12092029
Chicago/Turabian StyleKimaporn, Napatsorn, Chawit Samakkarn, and Jatuporn Thongsri. 2024. "Multiphysics to Investigate the Thermal and Mechanical Responses in Hard Disk Drive Components Due to the Reflow Soldering Process" Processes 12, no. 9: 2029. https://doi.org/10.3390/pr12092029
APA StyleKimaporn, N., Samakkarn, C., & Thongsri, J. (2024). Multiphysics to Investigate the Thermal and Mechanical Responses in Hard Disk Drive Components Due to the Reflow Soldering Process. Processes, 12(9), 2029. https://doi.org/10.3390/pr12092029