


Linking Catalyst Development and Chemical Reactor Design with Ethanol to Butadiene Processes


Abstract
1. Introduction
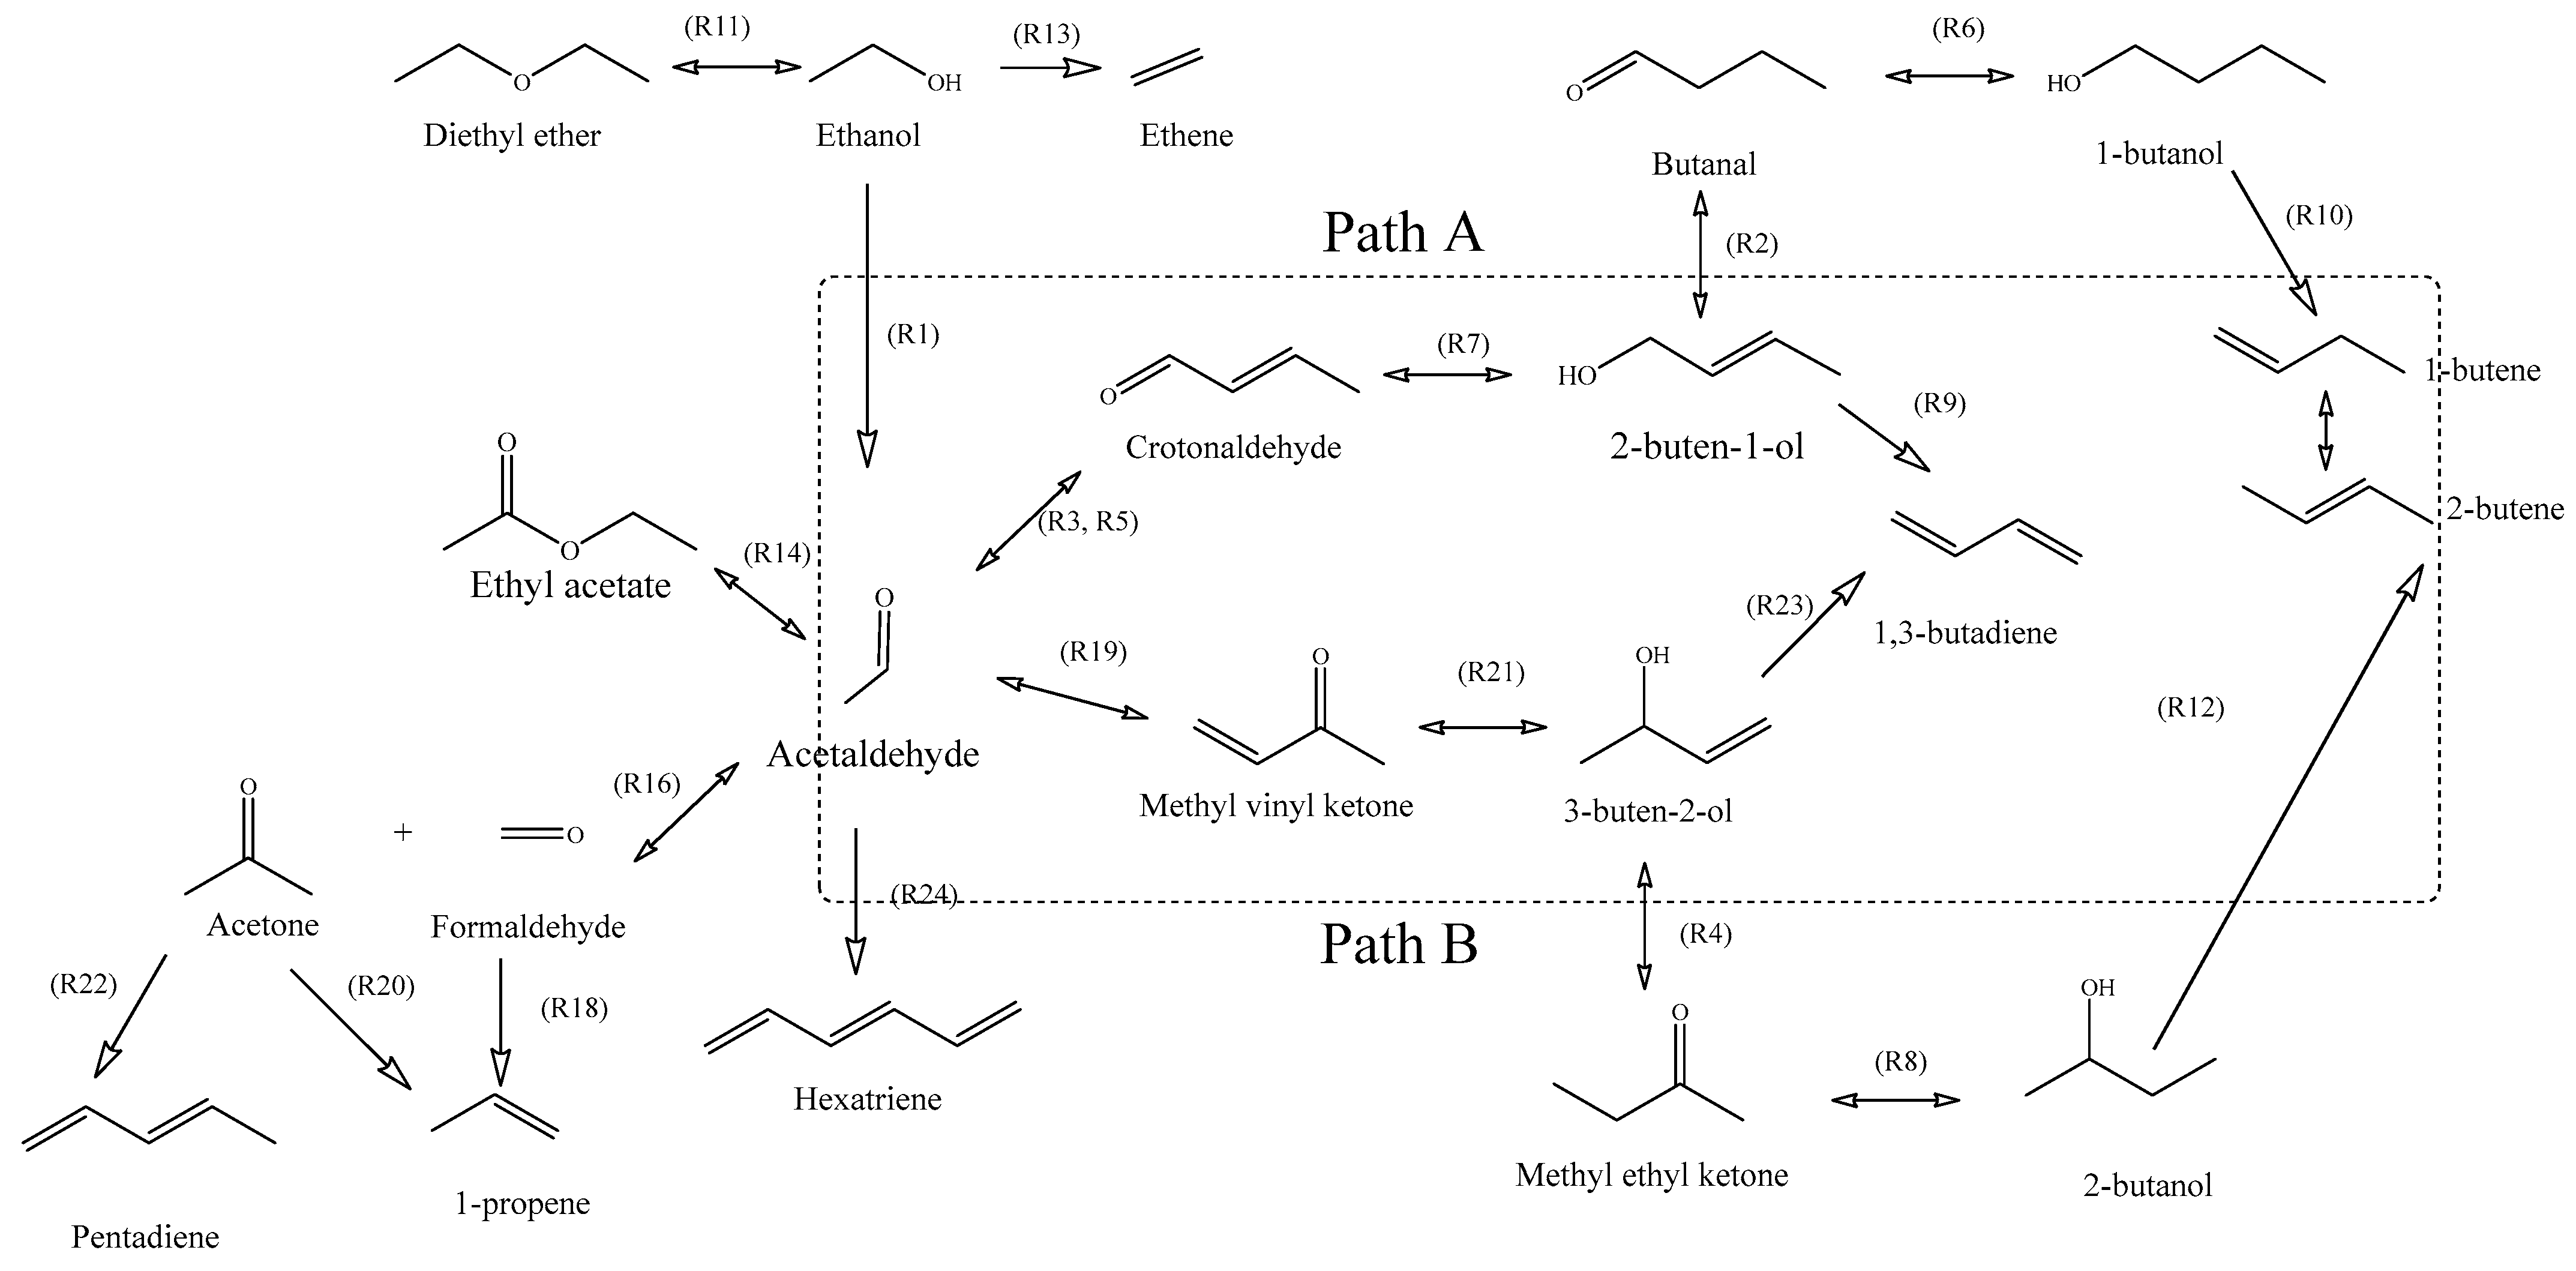
2. Chemistry
3. Catalysts
4. Thermodynamic Analysis
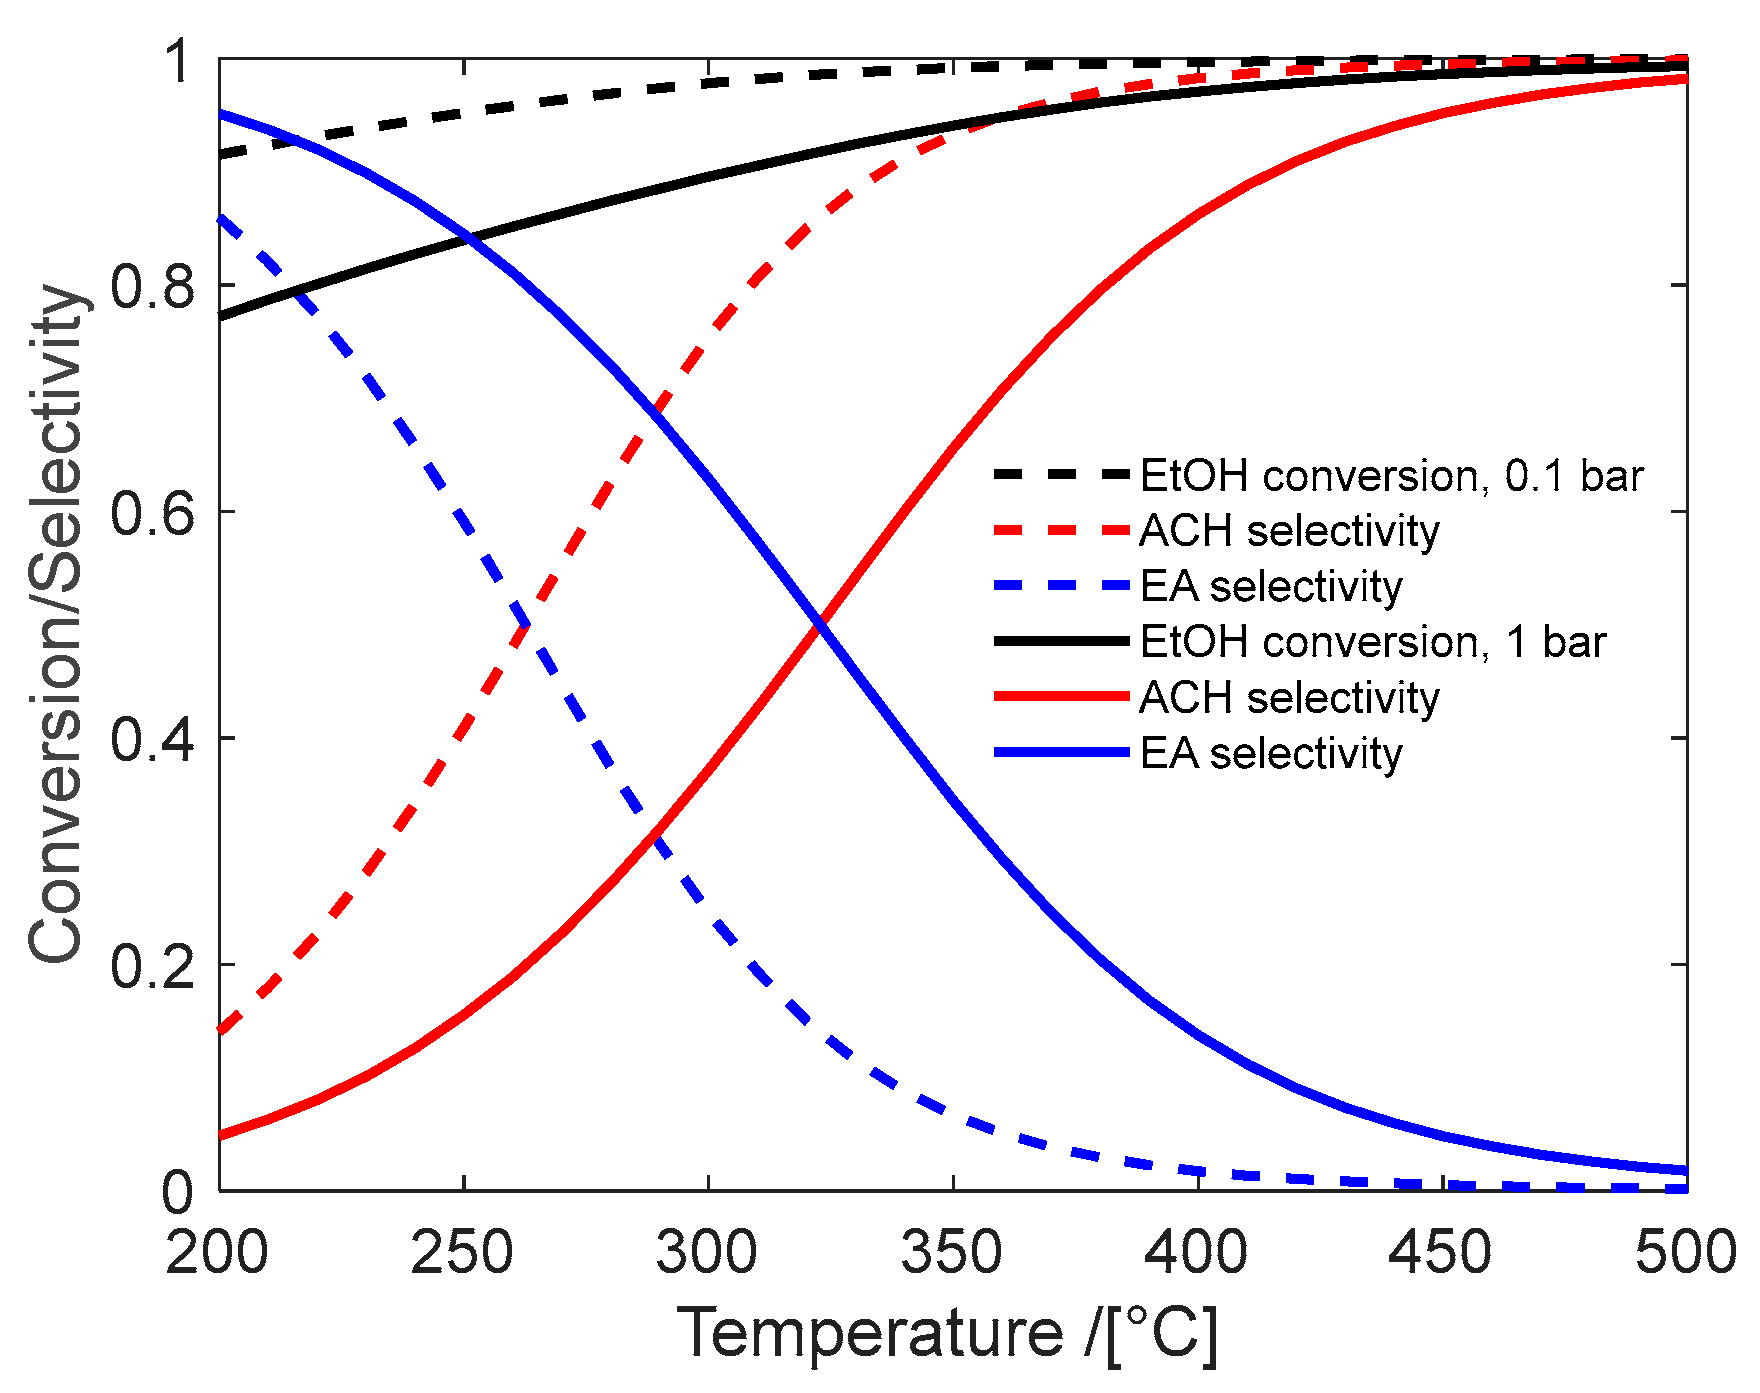
4.1. Acetaldehyde Synthesis

| Catalyst | Temp. °C | PEtOH bar | Conv. EtOH | Sel ACH | Sel C2H4 | Sel DEE | Sel EA | TOS h | Reference | |
|---|---|---|---|---|---|---|---|---|---|---|
| 1 | CuO-asbest | 225–285 | 1–10 | <0.50 | 96 | 0 | 0 | 3 | - | Franckaerts and Froment [44] |
| 2 | CuO-Cr2O3 | 225–285 | 1–10 | <0.25 | 99 | - | - | 1 | 150 | Peloso et al. [45] |
| 3 | Cu-1234 | 200–290 | 20–30 | <0.6 | > 98 | - | - | 1.5 | - | Santacesaria et al. [42] |
| 4 | Cu/C/SiC | 280 | 0.05 | 0.814 | 99 | - | - | - | 8 | Li et al. [46] |
| 5 | Cu/ZnAl2O4 | 200–400 | 0.07 | <0.95 | > 95 | 0 | 0 | 0 | - | Garbarino et al. [47] |
| 6 | Cu/SiO2 | 280 | 0.04 | 0.90 | >98 | - | - | 500 | Zhang et al. [48] | |
| 7 | ZnO/MOR | 400 | Atm. | 0.4 | 89 | 4 | 4 | 3 | 120 | Raynes and Taylor [49] |
| 8 | γ-Al2O3 | 350–400 | <0.16 | 0.1 | 30 | 60 | 10 | - | - | DeWilde et al. [52] |
| 9 | SiO2/Al2O3 | 150–450 | Atm | 0–100 | 0 | 0–100 | 60–0 | 0 | - | Phung and Busca [50] |
| 10 | MgO-SiO2 | 325 | 0.037 | - | 20 | 80 | - | - | 12 | Abdulrazzaq et al. [53] |
4.2. Butadiene Synthesis
4.3. Catalyst Selection for Process Design
5. Chemical Reaction Engineering Issues
5.1. Fluidized Bed Reactor for ETB Process
5.1.1. Two-Phase Fluidized Bed Modelling
5.1.2. Reactor Model Equations
- (a)
- Plug flow of gas in both phases (PFb-PFd)
- -
- balance equation of species j in the bubble phase:
- -
- balance equation of species j in the dense phase:
- -
- pressure variation along the bed:
- (b)
- Plug flow of gas into the bubble phase and full mixing into dense phase (PFb-CSTRd)
- -
- the balance of species j in the bubble phase is expressed by Equation (8)
- -
- the balance equation of species j in the dense phase:
- -
- the pressure variation along the bed is defined by Equation (10).
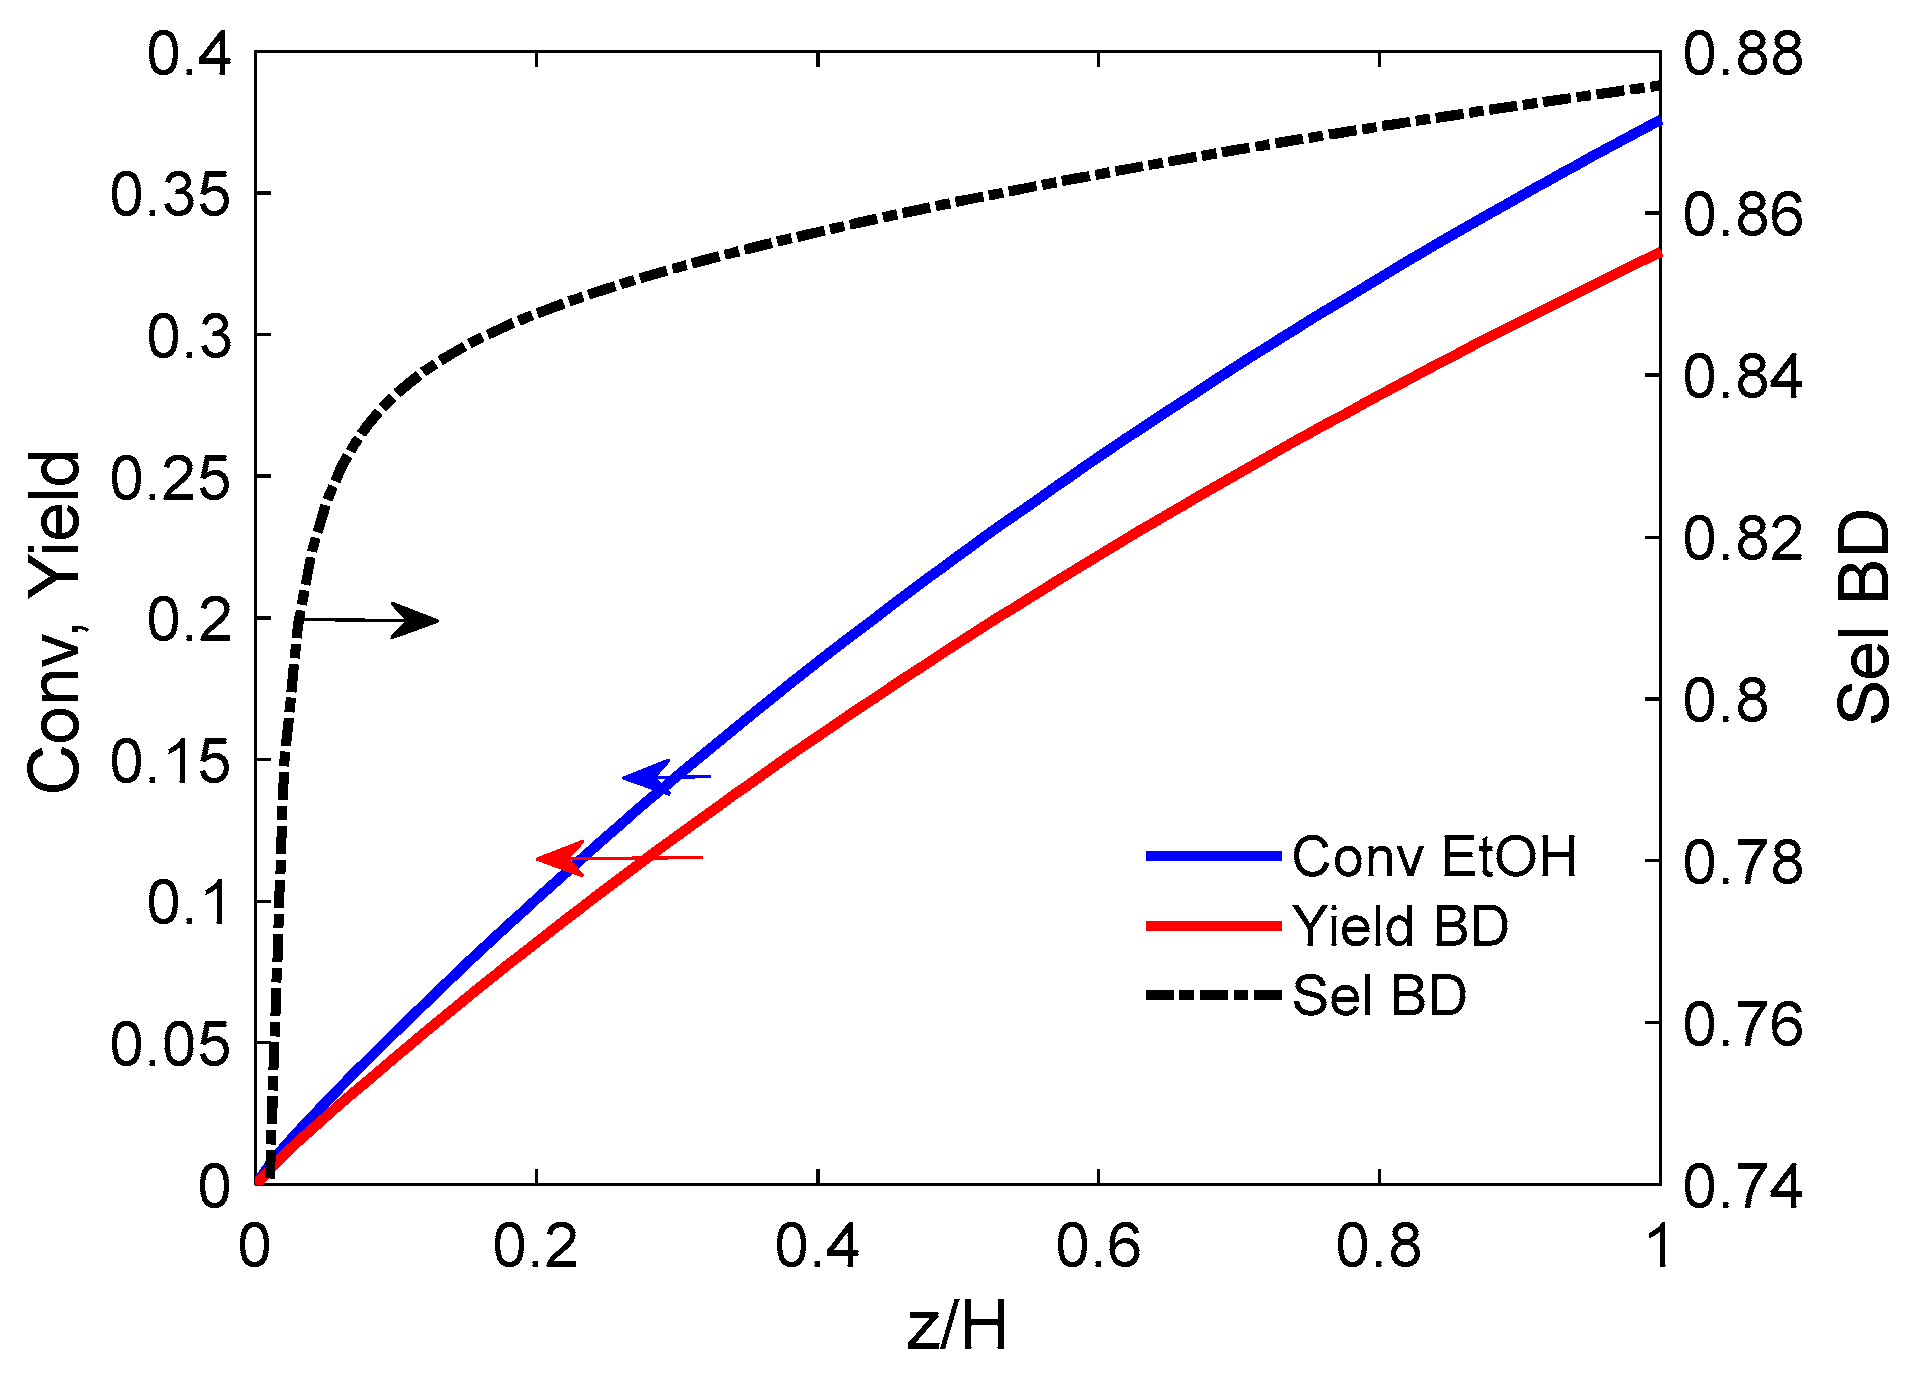
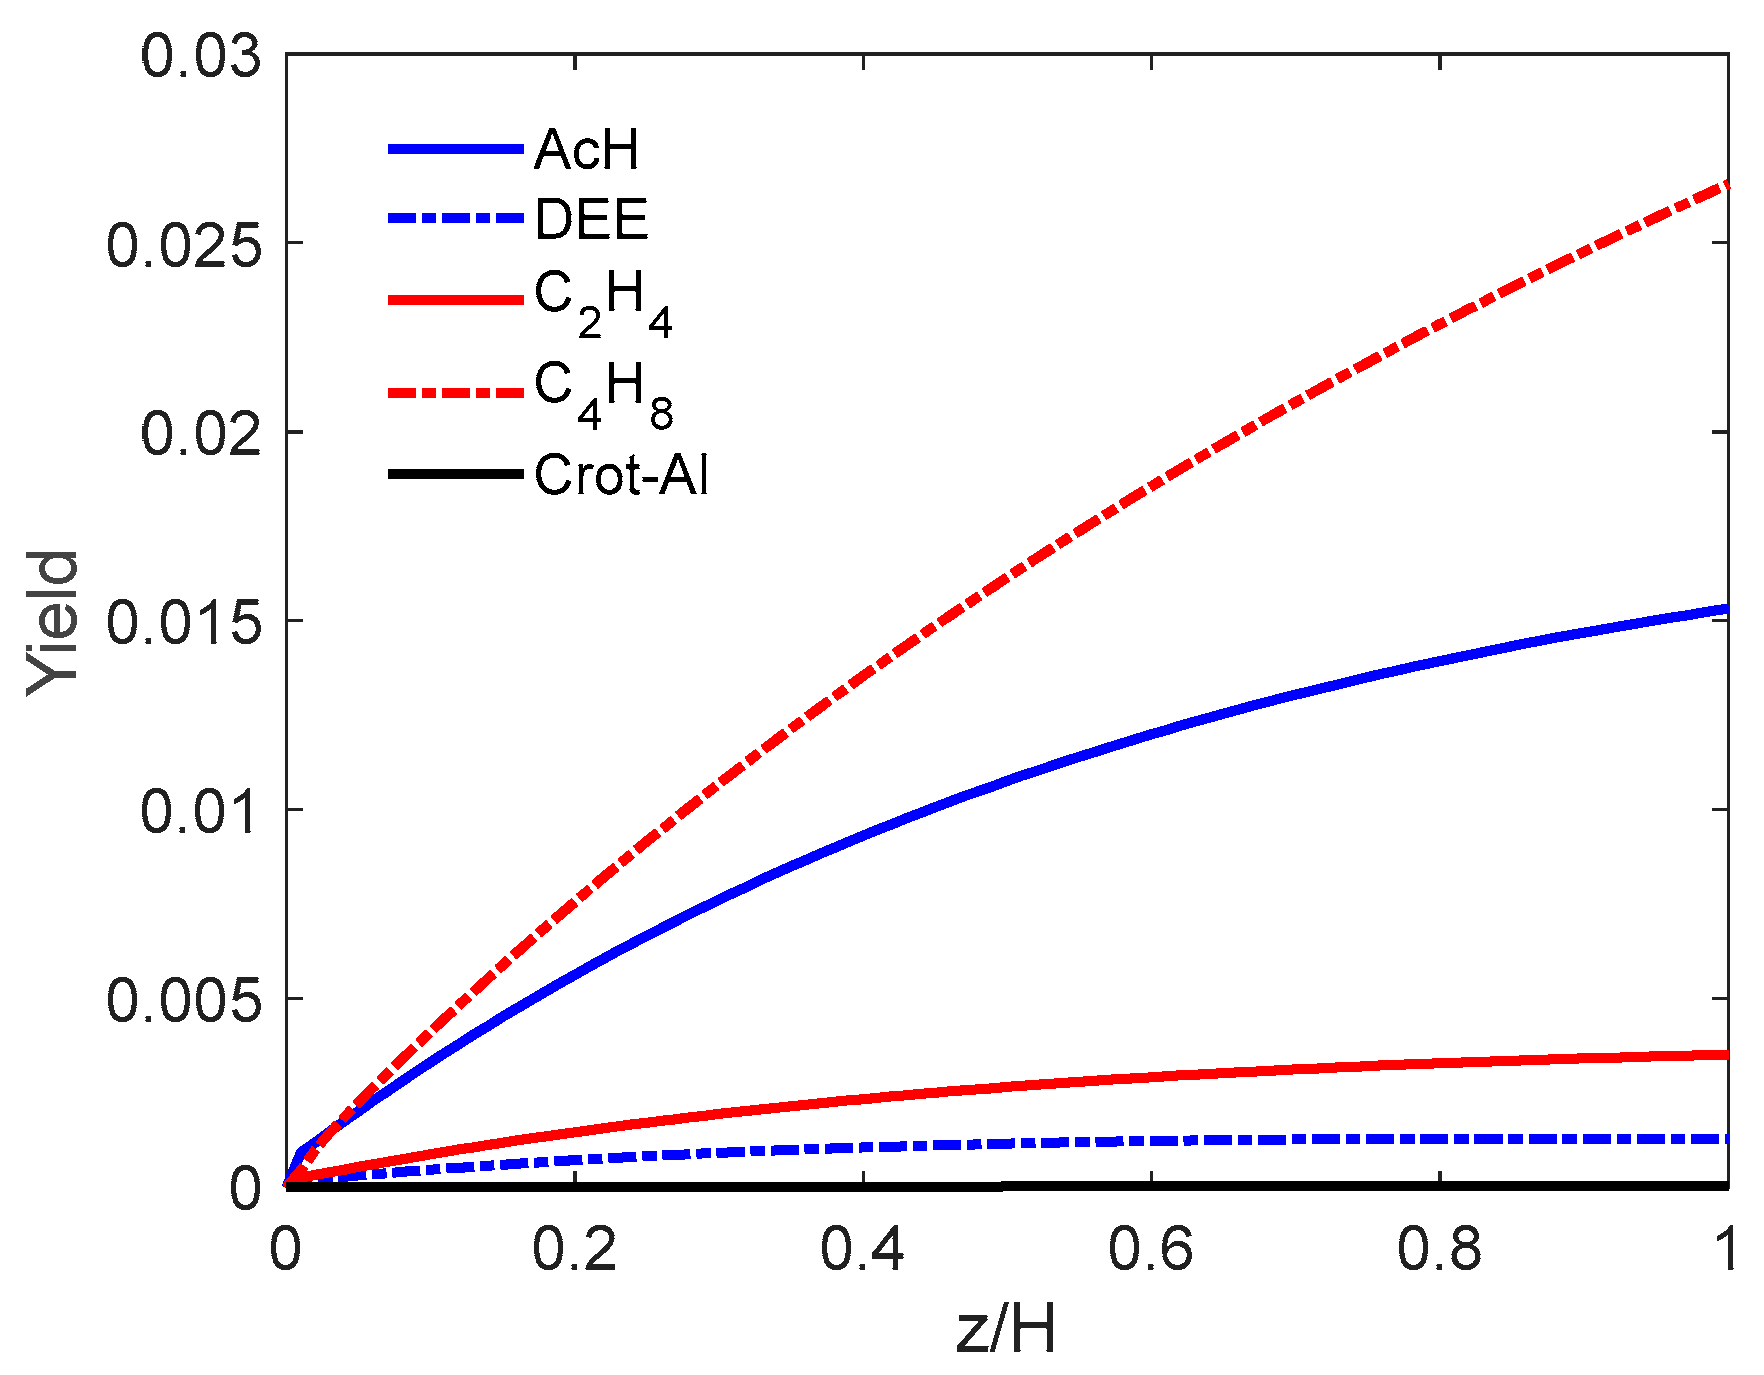
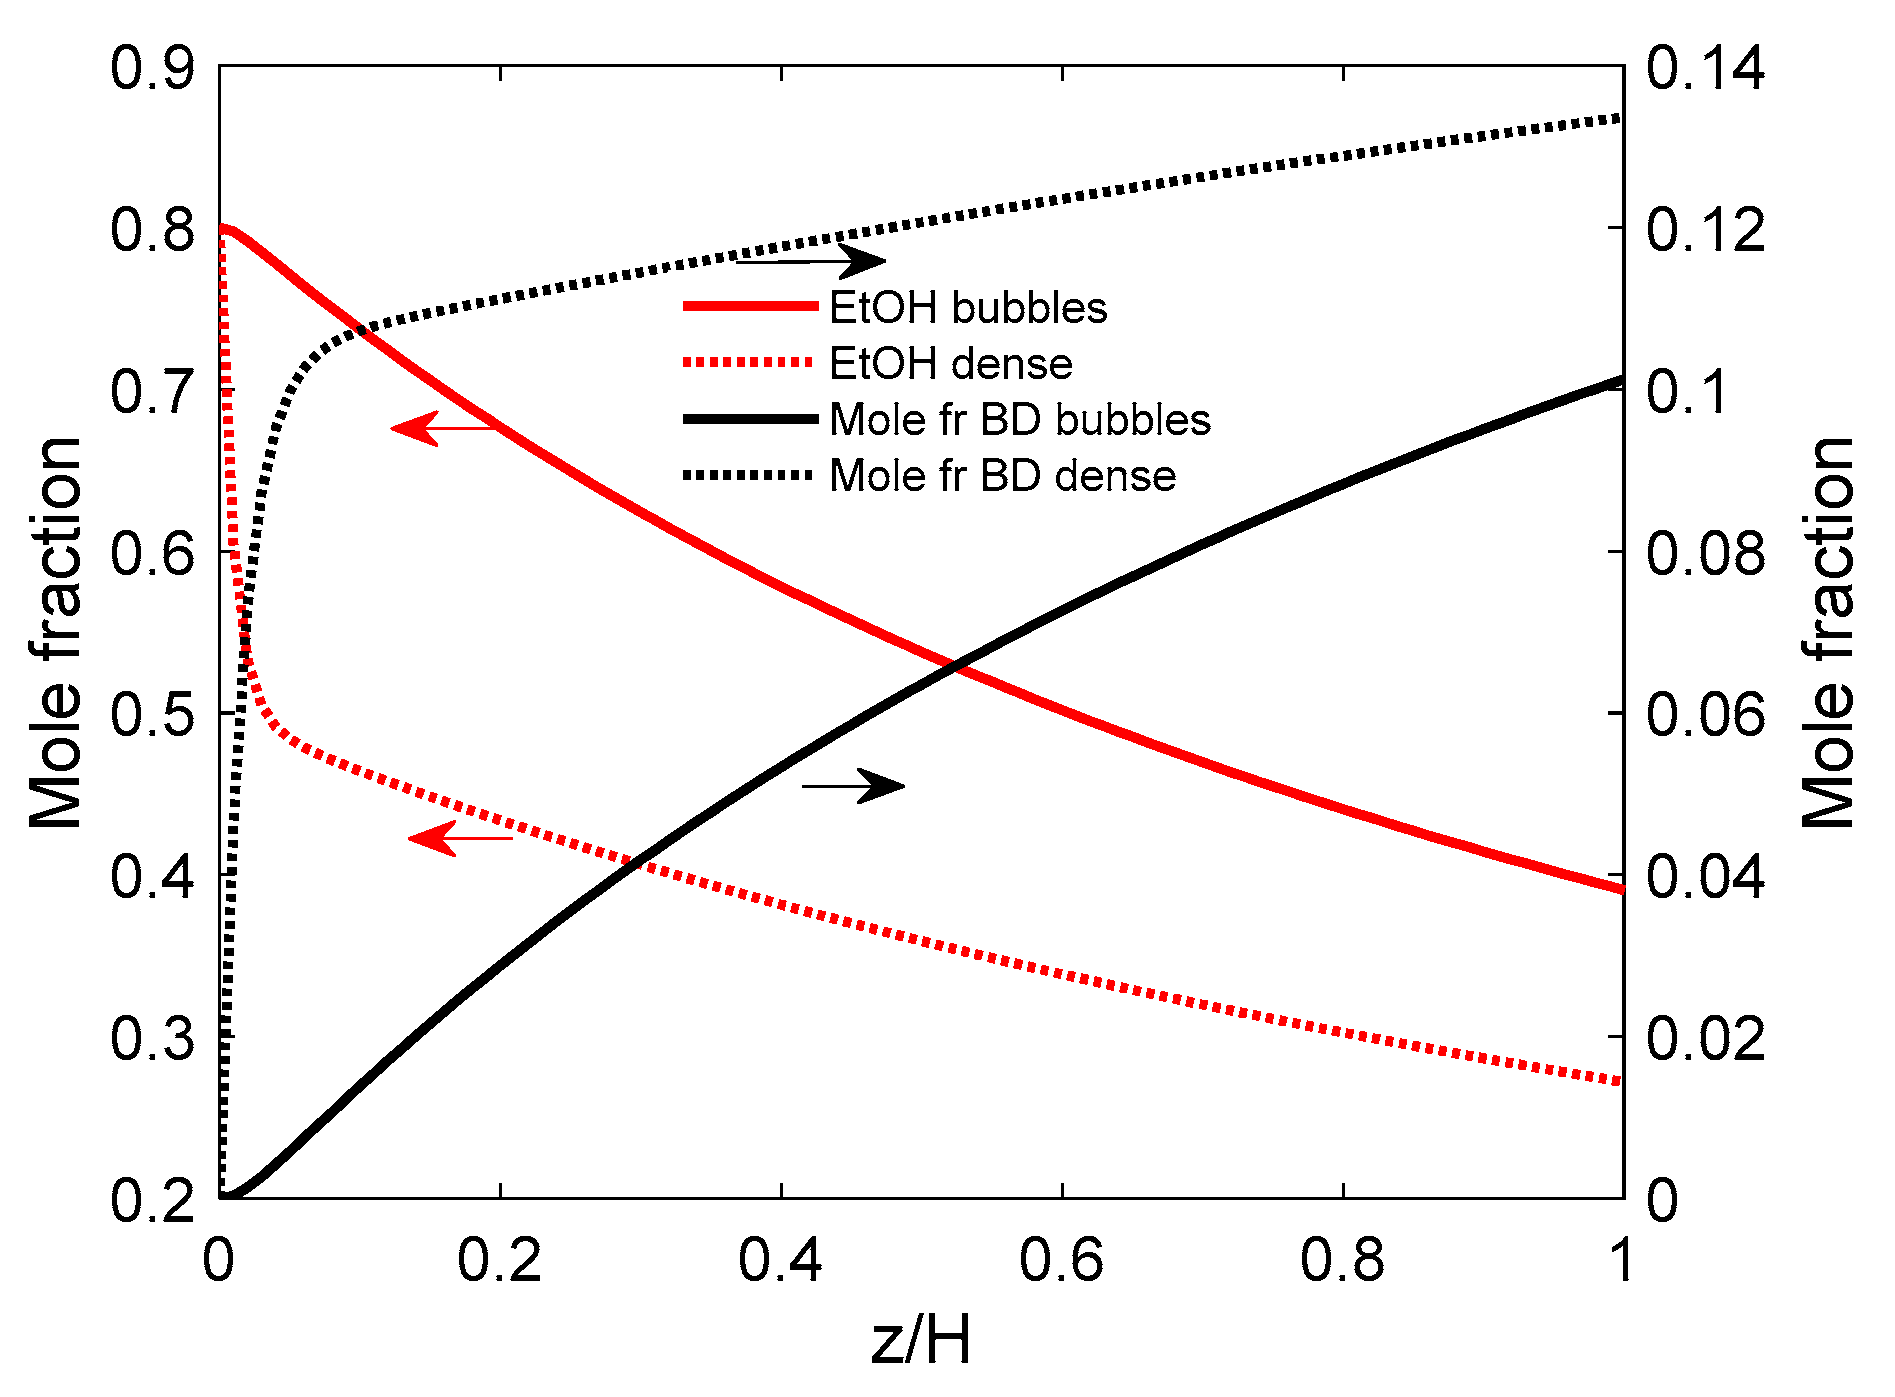
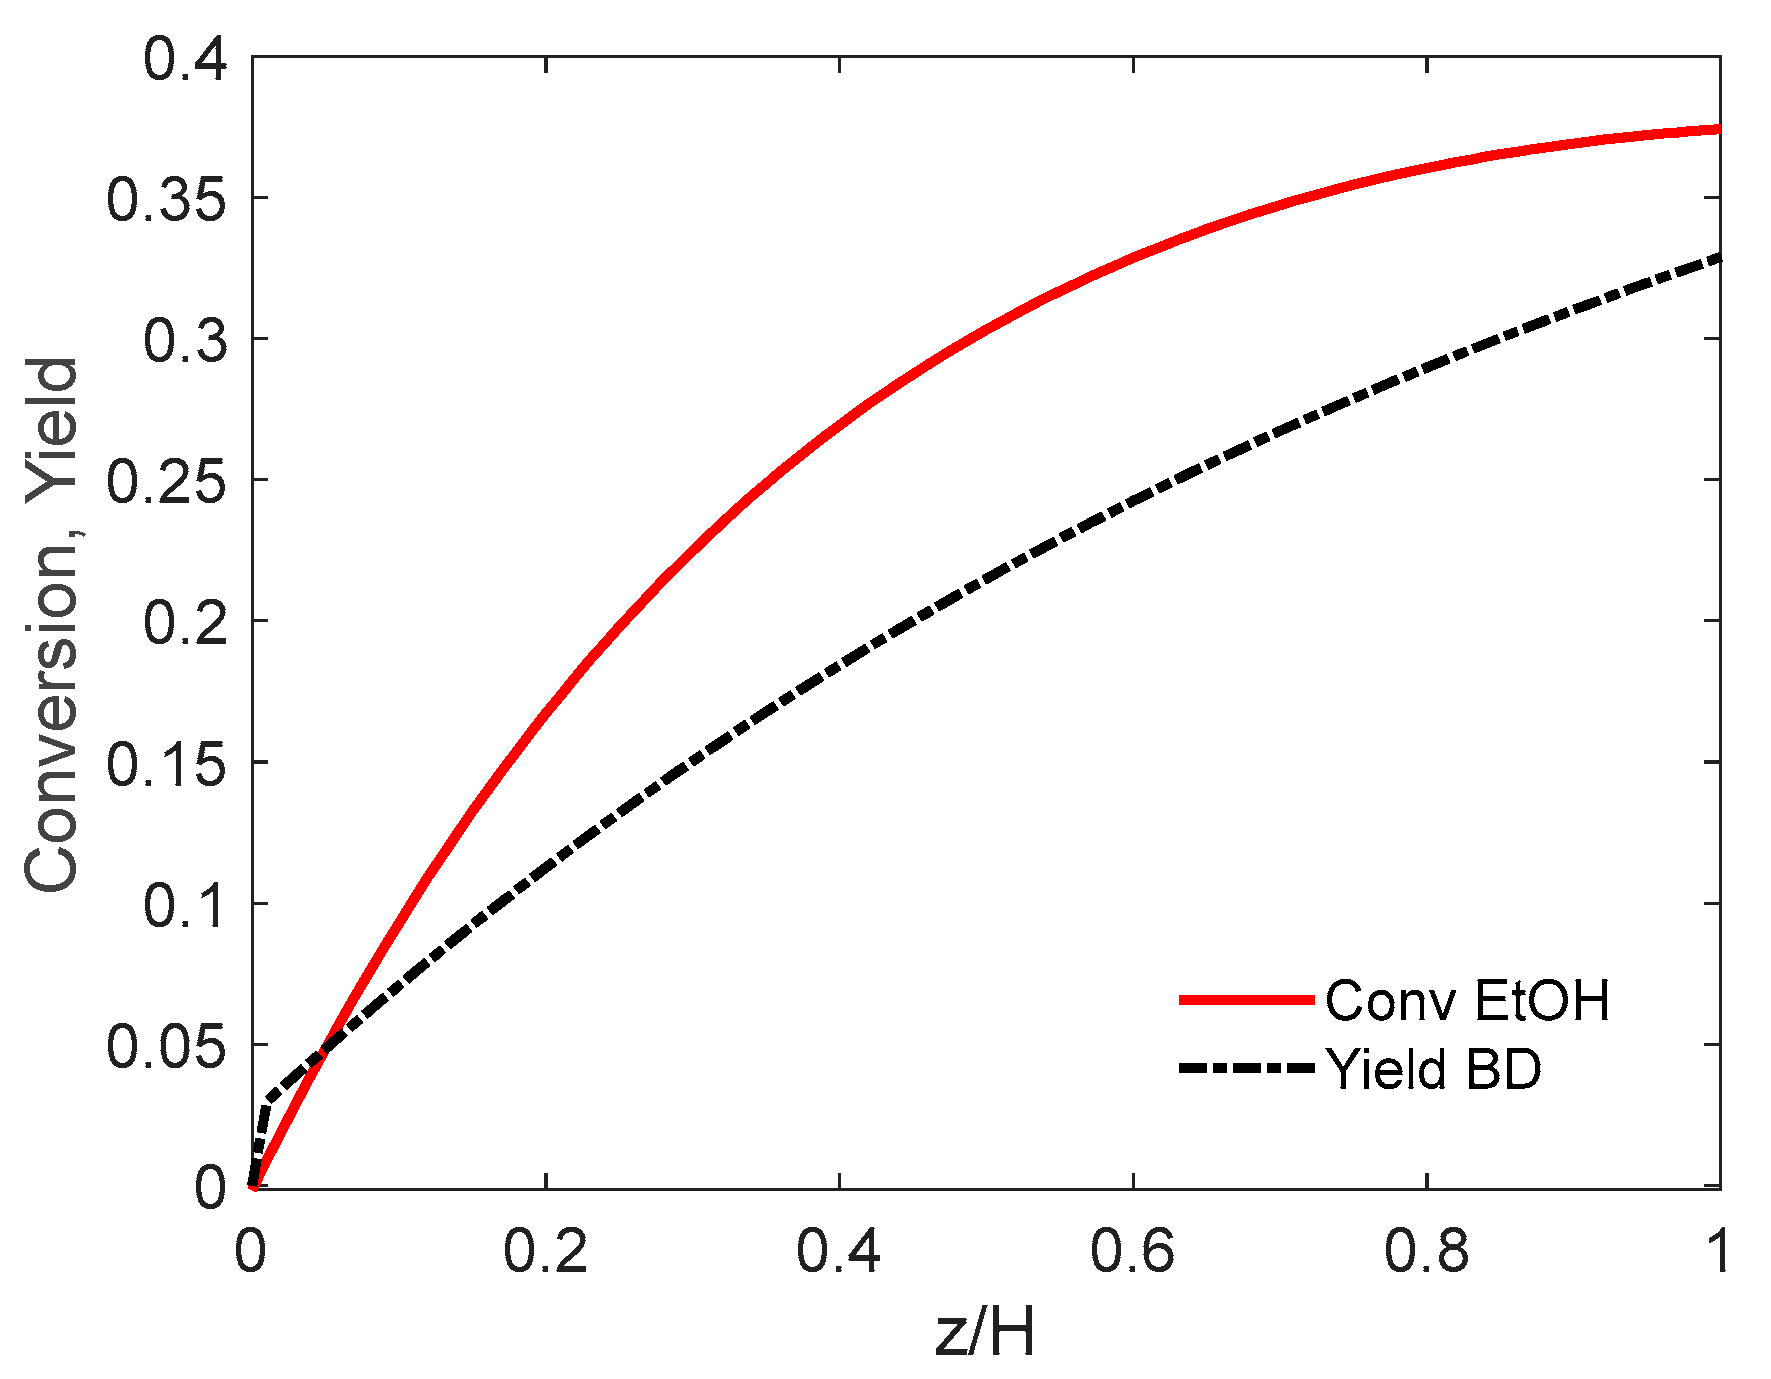
5.1.3. Simulation Results
- (a)
- PFb-PFd hypothesis
- (b) PFb-CSTRd flow
5.1.4. Influence of the Gas Feed Velocity
5.1.5. Influence of Bubble Size
- -
- Increasing the bubble diameter from 4 to 20 cm drops both the ethanol conversion and BD yield by about 2.4-times. This effect, common to both flow patterns, is due to lower interphase mass transfer (Kbd) and lower bubble residence time (tb).
- -
- At small bubble diameters, the performance of the PFd model is better, but at bubble diameters larger than 8 cm, the CSTRd pattern seems slightly superior. This may be explained again by the autocatalytic effect of the recycled acetaldehyde on the butadiene synthesis rate.
- -
- An interesting aspect is that in the range of smaller diameters (4 to 8 cm), the performance of the CSTRd seems to be insensitive to the bubble diameters. Therefore, this bubble size range is recommended for designing the gas distribution and redistribution devices. In this way, the reactor performance should be high but not greatly affected by the mixing model.
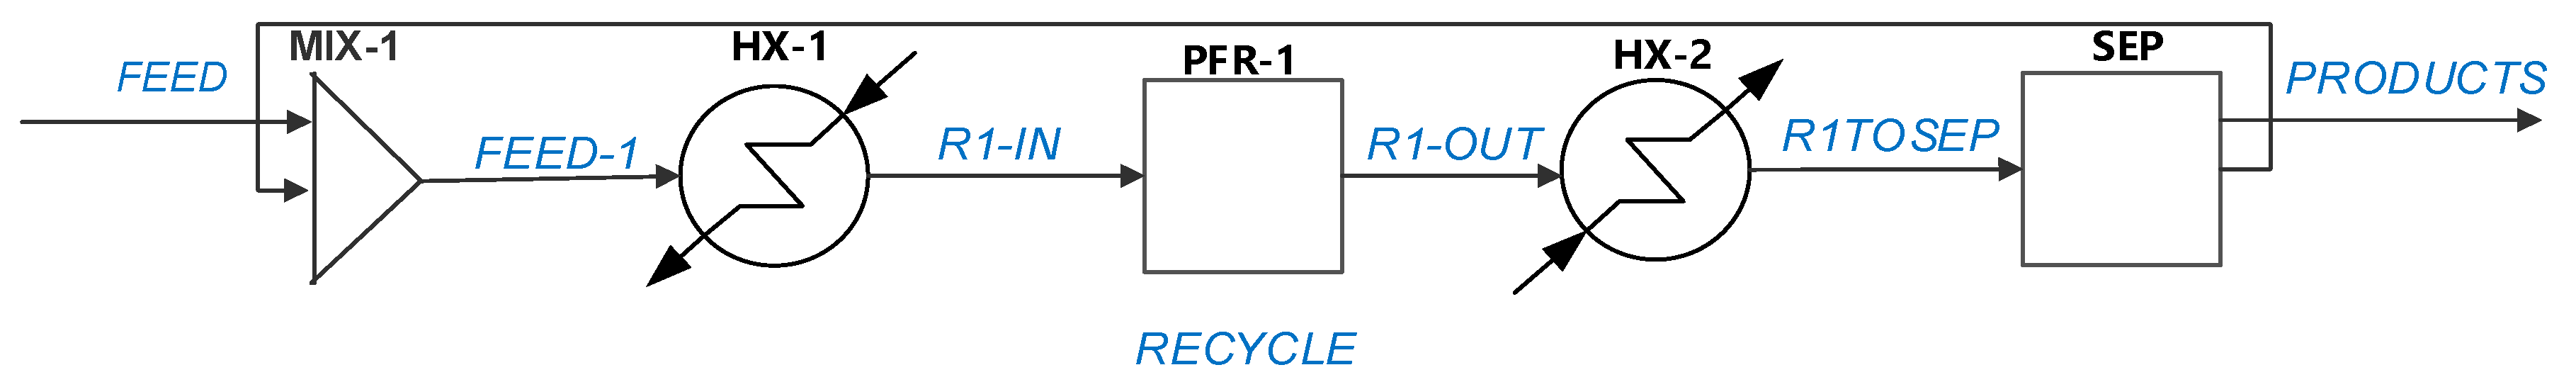
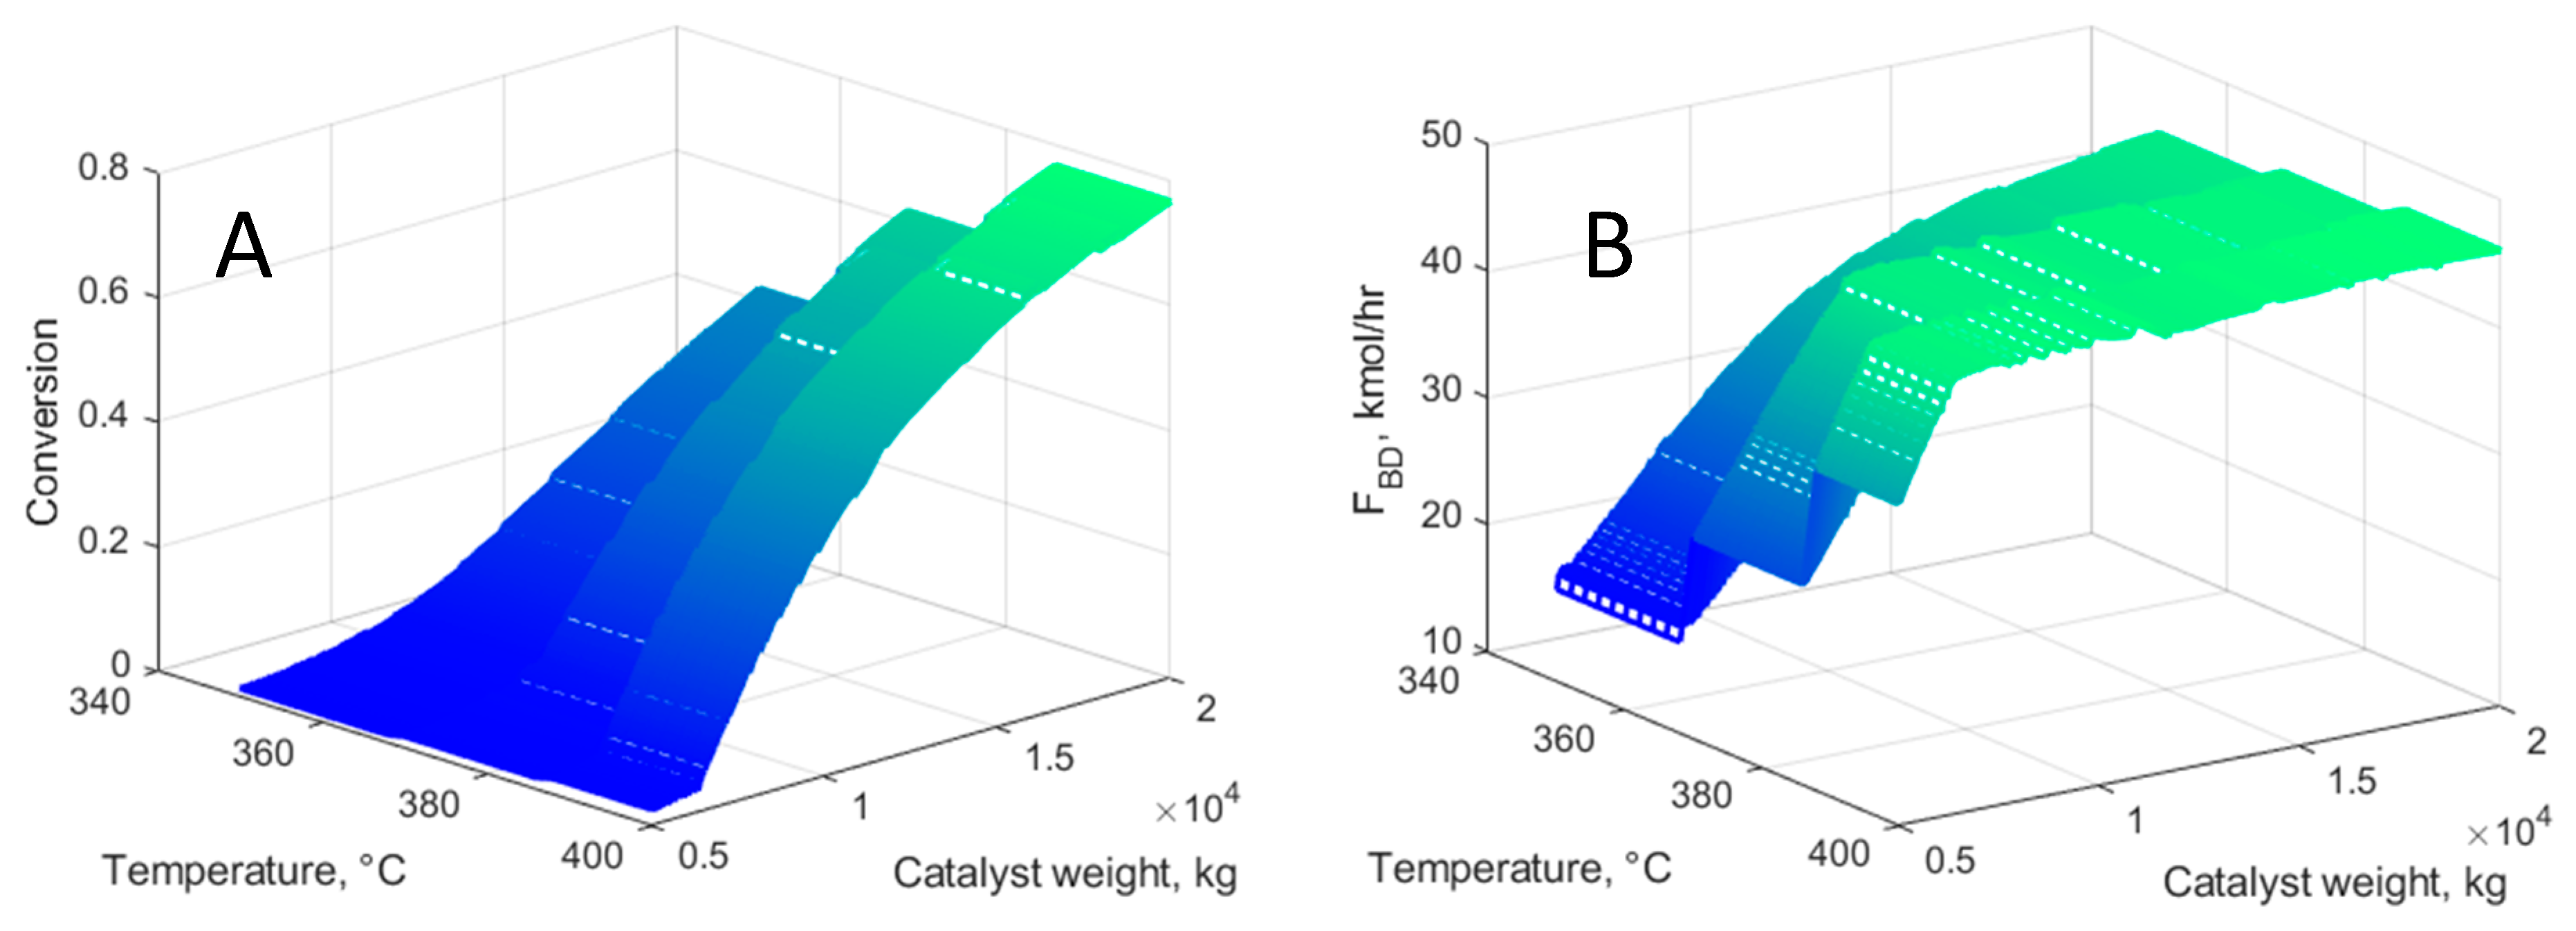
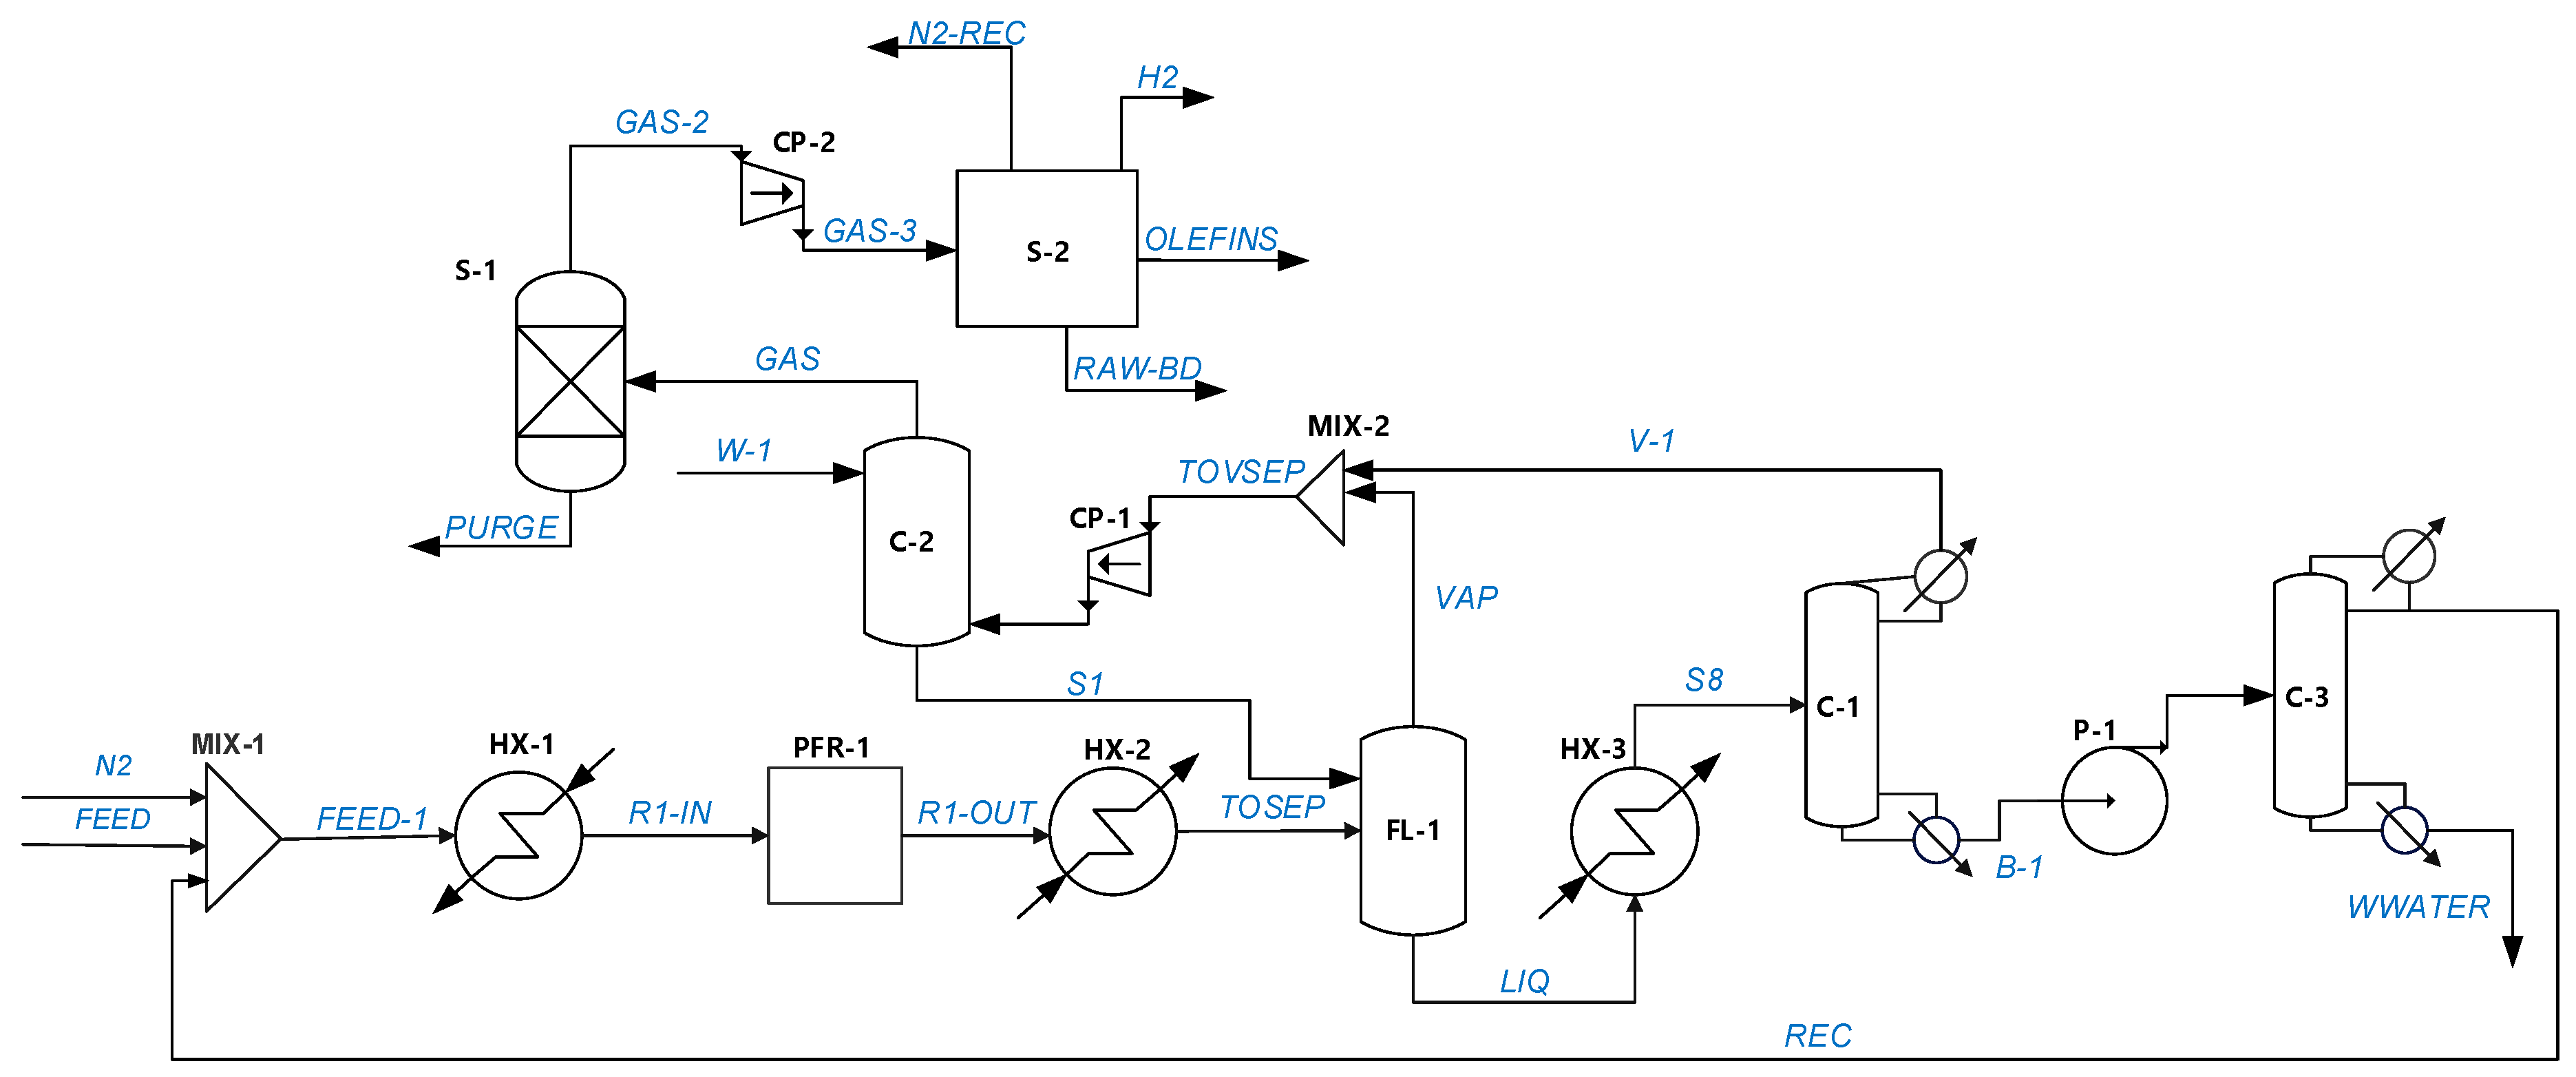
5.2. ETB Reactor Design in a Recycle Structure
- (a)
- Butadiene cost of 1.5 USD/kg, medium in the 2010–2020 period (www.intratec.us, accessed on 1 February 2025), and bioethanol cost of 0.45 USD/kg as internal biorefinery production price.
- (b)
- The multitube reactor cost is based on heat transfer area A estimated as A = 4W/ρcDt. (W: weight of catalyst; Dt: tube diameter; ρc: catalyst bed density). The equipment purchasing cost is C = a + bAn (USD) with a = 32,000, b = 70 and n = 1.2 [7]. In addition, material factors of 2 and installation of 3 are considered. The reactor cost is annualized by assuming an ROI of 0.2.
- (c)
- Catalyst cost estimation assumes regeneration/replacement each month over 12 months. To simplify, we assume the same cost for new and regenerated catalysts. This is 5 USD/kg, considering the cost of MgO and SiO2 raw materials 1.5 USD/kg plus 3.5 USD/kg additional costs for on-site production and regeneration.
- (d)
- The reactor duty is calculated by multiplying the butadiene production rate with the enthalpy of reaction (2 × 44.7 MJ/kmol) for an efficiency factor of 0.85.
- (e)
- The energy cost of ethanol recycling is approximated from the molar flow, enthalpy of vaporization of 37.6 MJ/kmol and a reflux ratio of 1.75.
- (f)
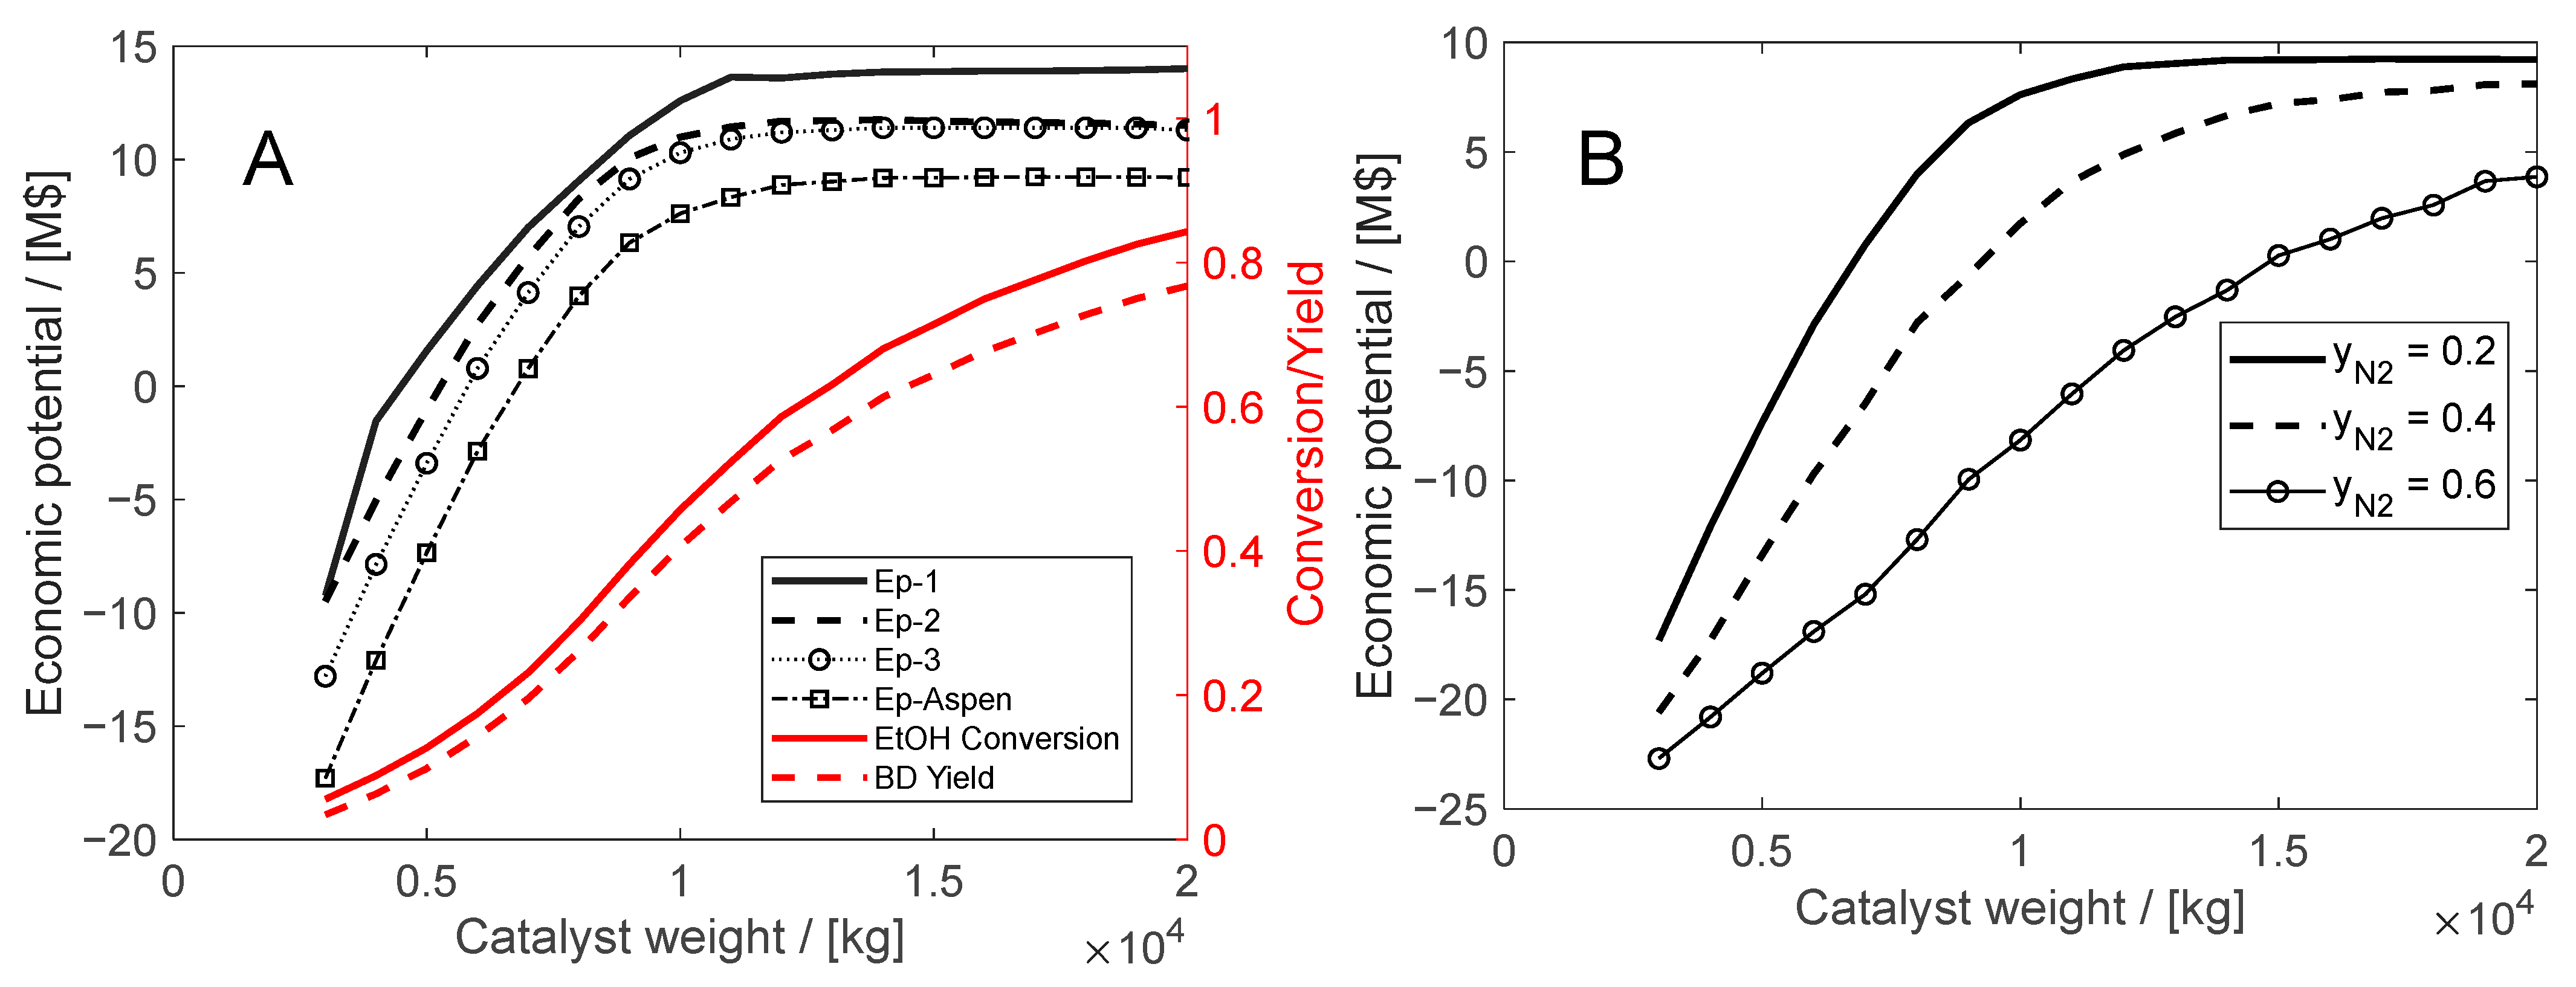
- The inert (nitrogen) flow is varied by a ‘design specification’ to keep constant a molar fraction of 0.2 at the rector inlet. The inert (nitrogen) recycling cost is calculated from the compression energy from 1.1 to 25 bar (to butadiene separation). The specific consumption determined by simulation is 0.12 kWh/kg.
- (g)
- The energy prices have a strong impact on the procedure in today’s unstable market. There are large differences in industrial prices between the USA (www.eia.gov, accessed on 1 February 2025) and Europe (https://ec.europa.eu/eurostat, accessed on 1 February 2025), as 80 vs. 200 USD /MWh for electricity and 15 vs. 22 USD/GJ for thermal energy. US prices are used here as a benchmark.
6. Conclusions
- This study investigates the relationship between the development of ethanol to butadiene (ETB) catalysts and the design of the chemical reaction system. The ETB catalyst must achieve two tasks, converting ethanol into a substantial amount of acetaldehyde and performing butadiene synthesis through a multi-step reaction chain. While specialized catalysts can fulfill these requirements efficiently, combining them into a multifunctional performant single catalyst is much more challenging. Additionally, the formation of numerous by-products and impurities seriously affects the butadiene yield.
- A thermodynamic analysis is performed in Aspen PlusTM for both acetaldehyde and butadiene synthesis steps, with the original feature of considering the simultaneous formation of the main products, by-products and impurities. Comparing the predictions with selected experimental data demonstrates that the performance of the ETB catalysts is controlled essentially by kinetic factors and not by thermodynamics. This study highlights the constraint of using inert gas at industrial scale to achieve a higher butadiene yield due to large additional processing costs. This requirement restricts the catalyst selection to a shortlist based essentially on mixed oxides, namely ZrO2, and on SiO2-type support boosted by metal promoters for ethanol dehydrogenation, such as Cu, Ag, Au, and La. The catalyst proposed by Da Ros et al. [15], with kinetic modelling developed by the authors, appears suitable for testing conceptual reactor designs.
- From an industrial perspective, the ETB catalyst assessment should consider the catalyst deactivation and regeneration. As a novelty, this study addresses this topic by analyzing the application of a fluidized bed reactor. A thorough two-phase simulation model was implemented in MatlabTM, which was successful in solving the algorithmic challenges arising from the complex chemical kinetics.
- The simulation demonstrates the feasibility of operating the reactor in the bubble fluidization bed (BFB) regime. High superficial velocity ratios u0/umin, and bubble sizes in the range 4 to 8 cm favor the reactor performance (ethanol conversion and butadiene yield). The simulation reveals an autocatalytic effect due to acetaldehyde chemistry. Surprisingly, the performance of a well-mixed dense phase becomes better compared to the plug flow model, though the differences are minimal due to limited ethanol conversion (around 50%).
- A second case study deals with the optimization of the ETB reaction section. This approach is generic and takes place in the reactor–separation–recycle (RSR) structure by evaluating the economic potential in relation to the costs of the reactor, catalyst, and recycling operations. The RSR analysis demonstrates the importance in the economic assessment of inert gas recycling, which the designer should consider if involved in catalyst development. In the present case, the recycling of nitrogen might shift the operation into the infeasible region, findings confirmed by rigorous simulation in Aspen PlusTM.
- The insights from this study can be applied for developing suitable industrial catalysts for the one-stage ETB process. The recommendations are as follows: (1) targeting higher butadiene C-selectivity (over 80 to 85%), including acetaldehyde at reasonable ethanol conversion; (2) suppressing or limiting the use of inert gas; (3) improving catalyst robustness; (4) performing more kinetic investigations for catalyst assessment by process design; (5) targeting productivity better than 0.15 kg butadiene/kg cat/h.
Supplementary Materials
Author Contributions
Funding
Data Availability Statement
Conflicts of Interest
References
- Srivastava, V.K.; Saha, S.; Sarkar, P.; Srinivasa Rao, G.S.; Jasra, R.V. Industrial Chemicals and Intermediates from 1,3-Butadiene. Recent. Adv. Petrochem. Sci. 2018, 6, 129–143. [Google Scholar] [CrossRef]
- Dimian, A.C. Renewable raw materials: Chance and challenge for computer-aided process engineering. In Computer Aided Chemical Engineering; Pleşu, V., Agachi, P.Ş., Eds.; Elsevier: Amsterdam, The Netherlands, 2007; Volume 24, pp. 309–318. [Google Scholar]
- Shylesh, S.; Gokhale, A.A.; Scown, C.D.; Kim, D.; Ho, C.R.; Bell, A.T. From Sugars to Wheels: The Conversion of Ethanol to 1,3-Butadiene over Metal-Promoted Magnesia-Silicate Catalysts. ChemSusChem 2016, 9, 1462–1472. [Google Scholar] [CrossRef]
- Farzad, S.; Mandegari, M.A.; Görgens, J.F. Integrated techno-economic and environmental analysis of butadiene production from biomass. Bioresour. Technol. 2017, 239, 37–48. [Google Scholar] [CrossRef]
- Moncada, J.; Vural Gursel, I.; Huijgen, W.J.J.; Dijkstra, J.W.; Ramírez, A. Techno-economic and ex-ante environmental assessment of C6 sugars production from spruce and corn. Comparison of organosolv and wet milling technologies. J. Clean. Prod. 2018, 170, 610–624. [Google Scholar] [CrossRef]
- Rodgers, S.; Meng, F.; Poulston, S.; Conradie, A.; McKechnie, J. Renewable butadiene: A case for hybrid processing via bio- and chemo-catalysis. J. Clean. Prod. 2022, 364, 132614. [Google Scholar] [CrossRef]
- Dimian, A.C.; Bildea, C.S.; Kiss, A. Integrated Design and Simulation of Chemical Processes, 2nd ed.; Elsevier: Amsterdam, The Netherlands, 2014; p. 1. [Google Scholar]
- Dimian, A.C.; Bezedea, N.I.; Bildea, C.S. Novel Two-Stage Process for Manufacturing Butadiene from Ethanol. Ind. Eng. Chem. Res. 2021, 60, 8475–8492. [Google Scholar] [CrossRef]
- Dussol, D.; Cadran, N.; Laloue, N.; Renaudot, L.; Schweitzer, J.M. New insights of butadiene production from ethanol: Elucidation of concurrent reaction pathways and kinetic study. Chem. Eng. J. 2020, 391, 123586. [Google Scholar] [CrossRef]
- Cabrera Camacho, C.E.; Villanueva Perales, A.L.; Alonso-Fariñas, B.; Vidal-Barrero, F.; Ollero, P. Assessing the economic and environmental sustainability of bio-olefins: The case of 1,3-butadiene production from bioethanol. J. Clean. Prod. 2022, 374, 133963. [Google Scholar] [CrossRef]
- Dimian, A.C.; Bildea, C.S. Novel one-stage process for manufacturing 1,3-butadiene from ethanol. Chem. Eng. Res. Des. 2023, 193, 460–478. [Google Scholar] [CrossRef]
- Banu, I.; Brosteanu, A.-V.; Bumbac, G.; Bozga, G. Ethanol Conversion to Butadiene: A Thermodynamic Analysis. Ind. Eng. Chem. Res. 2021, 60, 13071–13083. [Google Scholar] [CrossRef]
- Bozga, G.; Brosteanu, A.V.; Banu, I.; Dimian, A.C. One-stage ethanol to butadiene process: Analysis and design of a multi-tubular fixed bed reactor. Chem. Eng. Res. Des. 2024, 203, 608–618. [Google Scholar] [CrossRef]
- Brosteanu, A.-V.; Bozga, G.; Banu, I. A kinetic model for the direct conversion of ethanol to 1,3-butadiene. Univ. Politeh. Buchar. Bull. Ser. B-Chem. Mater. Sci. 2022, 84, 112–122. [Google Scholar]
- Da Ros, S.; Jones, M.D.; Mattia, D.; Schwaab, M.; Barbosa-Coutinho, E.; Rabelo-Neto, R.C.; Noronha, F.B.; Pinto, J.C. Microkinetic analysis of ethanol to 1,3-butadiene reactions over MgO-SiO2 catalysts based on characterization of experimental fluctuations. Chem. Eng. J. 2017, 308, 988–1000. [Google Scholar] [CrossRef]
- Kagan, O.M.; Lyubarskii, M.Y.; Podurovskaya, G.D. Mechanism of the catalytic synthesis of bivinyl from ethyl alcohol. Izv. Akad. Nauk. SSSR Ser. Khim. 1947, 173–181. [Google Scholar]
- Toussaint, W.J.; Dunn, J.T.; Jackson, D.R. Production of butadiene from alcohol. Ind. Eng. Chem. 1947, 39, 120–125. [Google Scholar]
- Inoue, R.; Ichikawa, A.; Furukawa, K. Synthesis of butadiene from 4-oxy-2-butanone and alcohol. J. Chem. Soc. Jpn. 1958, 61, 566–569. [Google Scholar]
- Pomalaza, G.; Arango Ponton, P.; Capron, M.; Dumeignil, F. Ethanol-to-butadiene: The reaction and its catalysts. Catal. Sci. Technol. 2020, 10, 4860–4911. [Google Scholar] [CrossRef]
- Pomalaza, G.; Capron, M.; Ordomsky, V.; Dumeignil, F. Recent Breakthroughs in the Conversion of Ethanol to Butadiene. Catalysts 2016, 6, 203. [Google Scholar] [CrossRef]
- Kyriienko, P.I.; Larina, O.V.; Soloviev, S.O.; Orlyk, S.M. Catalytic Conversion of Ethanol into 1,3-Butadiene: Achievements and Prospects: A Review. Theor. Exp. Chem. 2020, 56, 213–242. [Google Scholar] [CrossRef]
- Makhin, M.; Bedenko, S.; Budnyak, A.; Dmitriev, G.; Zanaveskin, L. Investigations into the conversion of ethanol to butadiene-1,3 using CuO/La2O3/ZrO2/SiO2 catalyst systems. Comptes Rendus. Chim. 2023, 26, 37–50. [Google Scholar] [CrossRef]
- Sushkevich, V.L.; Ivanova, I.I.; Ordomsky, V.V.; Taarning, E. Design of a metal-promoted oxide catalyst for the selective synthesis of butadiene from ethanol. ChemSusChem 2014, 7, 2527–2536. [Google Scholar] [CrossRef] [PubMed]
- Sushkevich, V.L.; Ivanova, I.I. Mechanistic study of ethanol conversion into butadiene over silver promoted zirconia catalysts. Appl. Catal. B Environ. 2017, 215, 36–49. [Google Scholar] [CrossRef]
- Santos, M.L.A.; Pacheco, H.P.; Toniolo, F.S. Tuning acid and basic features on MgxAlOy-SiO2 impacted ethanol upgrading to 1,3-butadiene. Catal. Today 2025, 444, 115017. [Google Scholar] [CrossRef]
- Wang, K.; Zhang, W.; Gao, W.; Liu, Z.; Gao, X.; Ma, Q.; Zhang, J.; Zhao, T.-S.; Tsubaki, N. Recent advances in tailor-made catalysts for the direct conversion of ethanol to butadiene. Fuel 2024, 370, 131872. [Google Scholar] [CrossRef]
- Chung, S.H.; de Miguel, J.C.N.; Li, T.; Lavrik, P.; Komaty, S.; Yuan, Y.; Poloneeva, D.; Anbari, W.H.; Hedhili, M.N.; Zaarour, M.; et al. Core–shell structured magnesia–silica as a next generation catalyst for one-step ethanol-to-butadiene Lebedev process. Appl. Catal. B Environ. 2024, 344, 123628. [Google Scholar] [CrossRef]
- Chung, S.-H.; Li, T.; Shoinkhorova, T.; Komaty, S.; Ramirez, A.; Mukhambetov, I.; Abou-Hamad, E.; Shterk, G.; Telalovic, S.; Dikhtiarenko, A.; et al. Origin of active sites on silica–magnesia catalysts and control of reactive environment in the one-step ethanol-to-butadiene process. Nat. Catal. 2023, 6, 363–376. [Google Scholar] [CrossRef]
- Samsudin, I.B.; Jaenicke, S.; Chuah, G.-K. Conversion of Ethanol to Butadiene over Binary MgO-SiO2 Mixed Oxides Prepared by the Ammonia Evaporation Method. Chemistry 2023, 5, 544–558. [Google Scholar] [CrossRef]
- Huang, X.; Men, Y.; Wang, J.; An, W.; Wang, Y. Highly active and selective binary MgO–SiO2 catalysts for the production of 1,3-butadiene from ethanol. Catal. Sci. Technol. 2017, 7, 168–180. [Google Scholar] [CrossRef]
- Szabó, B.; Novodárszki, G.; May, Z.; Valyon, J.; Hancsók, J.; Barthos, R. Conversion of ethanol to butadiene over mesoporous In2O3-promoted MgO-SiO2 catalysts. Mol. Catal. 2020, 491, 110984. [Google Scholar] [CrossRef]
- Da Ros, S.; Jones, M.D.; Mattia, D.; Schwaab, M.; Noronha, F.B.; Pinto, J.C. Modelling the effects of reaction temperature and flow rate on the conversion of ethanol to 1,3-butadiene. Appl. Catal. A-Gen. 2017, 530, 37–47. [Google Scholar] [CrossRef]
- Dagle, V.L.; Dagle, R.; Lopez, J.S.; Flake, M.; Lemmon, T. Single-step conversion of ethanol to butadiene over Ag-ZrO2/SiO2 catalysts. Abstr. Pap. Amer. Chem. Soc. 2018, 255, 290. [Google Scholar]
- Li, H.; Pang, J.; Jaegers, N.R.; Kovarik, L.; Engelhard, M.; Savoy, A.W.; Hu, J.; Sun, J.; Wang, Y. Conversion of ethanol to 1,3–butadiene over Ag–ZrO2/SiO2 catalysts: The role of surface interfaces. J. Energy Chem. 2021, 54, 7–15. [Google Scholar] [CrossRef]
- Kyriienko, P.I.; Larina, O.V.; Soloviev, S.O.; Orlyk, S.M.; Calers, C.; Dzwigaj, S. Ethanol Conversion into 1,3-Butadiene by the Lebedev Method over MTaSiBEA Zeolites (M = Ag, Cu, Zn). ACS Sustain. Chem. Eng. 2017, 5, 2075–2083. [Google Scholar] [CrossRef]
- Larina, O.V.; Kyriienko, P.I.; Soloviev, S.O. Effect of Lanthanum in Zn-La(-Zr)-Si Oxide Compositions on their Activity in the Conversion of Ethanol into 1,3-Butadiene. Theor. Exp. Chem. 2016, 52, 51–56. [Google Scholar] [CrossRef]
- De Baerdemaeker, T.; Feyen, M.; Muller, U.; Yilmaz, B.; Xiao, F.S.; Zhang, W.P.; Yokoi, T.; Bao, X.H.; Gies, H.; De Vos, D.E. Bimetallic Zn and Hf on Silica Catalysts for the Conversion of Ethanol to 1,3-Butadiene. Acs Catal. 2015, 5, 3393–3397. [Google Scholar] [CrossRef]
- Cabello González, G.M.; Villanueva Perales, A.L.; Campoy, M.; López Beltran, J.R.; Martínez, A.; Vidal-Barrero, F. Kinetic modelling of the one-step conversion of aqueous ethanol into 1,3-butadiene over a mixed hemimorphite-HfO2/SiO2 catalyst. Fuel Process. Technol. 2021, 216, 106767. [Google Scholar] [CrossRef]
- Cabello González, G.M.; Villanueva Perales, A.L.; Martínez, A.; Campoy, M.; Vidal-Barrero, F. Conversion of aqueous ethanol/acetaldehyde mixtures into 1,3-butadiene over a mesostructured Ta-SBA-15 catalyst: Effect of reaction conditions and kinetic modelling. Fuel Process. Technol. 2022, 226, 107092. [Google Scholar] [CrossRef]
- Kim, J.-W.; Kim, T.-W.; Chae, H.-J.; Kim, C.-U.; Kim, J.-R.; Jeong, S.-Y. Catalytic Conversion of Bioethanol and Acetaldehyde to Butadiene over a Tantalum Oxide-Supported Spherical Mesoporous Silica Catalyst in a Circulating Fluidized Bed. J. Nanosci. Nanotechnol. 2017, 17, 4322–4325. [Google Scholar] [CrossRef]
- Parmon, V.N. Catalysis and non-equilibrium thermodynamics: Modern in situ studies and new theoretical approaches. Catal. Today 1999, 51, 435–456. [Google Scholar] [CrossRef]
- Santacesaria, E.; Carotenuto, G.; Tesser, R.; Di Serio, M. Ethanol dehydrogenation to ethyl acetate by using copper and copper chromite catalysts. Chem. Eng. J. 2012, 179, 209–220. [Google Scholar] [CrossRef]
- Huang, Y.; Wang, B.; Yuan, H.; Sun, Y.; Yang, D.; Cui, X.; Shi, F. The catalytic dehydrogenation of ethanol by heterogeneous catalysts. Catal. Sci. Technol. 2021, 11, 1652–1664. [Google Scholar] [CrossRef]
- Franckaerts, J.; Froment, G.F. Kinetic study of the dehydrogenation of ethanol. Chem. Eng. Sci. 1964, 19, 807–818. [Google Scholar] [CrossRef]
- Peloso, A.; Moresi, M.; Mustachi, C.; Soracco, B. Kinetics of the dehydrogenation of ethanol to acetaldehyde on unsupported catalysts. Can. J. Chem. Eng. 1979, 57, 159–164. [Google Scholar] [CrossRef]
- Li, M.-Y.; Lu, W.-D.; He, L.; Schüth, F.; Lu, A.-H. Tailoring the Surface Structure of Silicon Carbide Support for Copper Catalyzed Ethanol Dehydrogenation. ChemCatChem 2019, 11, 481–487. [Google Scholar] [CrossRef]
- Garbarino, G.; Riani, P.; Villa García, M.; Finocchio, E.; Sanchez Escribano, V.; Busca, G. A study of ethanol dehydrogenation to acetaldehyde over copper/zinc aluminate catalysts. Catal. Today 2020, 354, 167–175. [Google Scholar] [CrossRef]
- Zhang, H.; Tan, H.-R.; Jaenicke, S.; Chuah, G.-K. Highly efficient and robust Cu catalyst for non-oxidative dehydrogenation of ethanol to acetaldehyde and hydrogen. J. Catal. 2020, 389, 19–28. [Google Scholar] [CrossRef]
- Raynes, S.J.; Taylor, R.A. Zinc oxide-modified mordenite as an effective catalyst for the dehydrogenation of (bio)ethanol to acetaldehyde. Sustain. Energy Fuels 2021, 5, 2136–2148. [Google Scholar] [CrossRef]
- Phung, T.K.; Busca, G. Ethanol dehydration on silica-aluminas: Active sites and ethylene/diethyl ether selectivities. Catal. Commun. 2015, 68, 110–115. [Google Scholar] [CrossRef]
- Sushkevich, V.L.; Ivanova, I.I.; Taarning, E. Mechanistic Study of Ethanol Dehydrogenation over Silica-Supported Silver. ChemCatChem 2013, 5, 2367–2373. [Google Scholar] [CrossRef]
- DeWilde, J.F.; Czopinski, C.J.; Bhan, A. Ethanol Dehydration and Dehydrogenation on γ-Al2O3: Mechanism of Acetaldehyde Formation. ACS Catal. 2014, 4, 4425–4433. [Google Scholar] [CrossRef]
- Abdulrazzaq, H.T.; Rahmani Chokanlu, A.; Frederick, B.G.; Schwartz, T.J. Reaction Kinetics Analysis of Ethanol Dehydrogenation Catalyzed by MgO–SiO2. ACS Catal. 2020, 10, 6318–6331. [Google Scholar] [CrossRef]
- Chieregato, A.; Velasquez Ochoa, J.; Bandinelli, C.; Fornasari, G.; Cavani, F.; Mella, M. On the Chemistry of Ethanol on Basic Oxides: Revising Mechanisms and Intermediates in the Lebedev and Guerbet reactions. ChemSusChem 2015, 8, 377–388. [Google Scholar] [CrossRef]
- Zhang, M.; Gao, M.; Chen, J.; Yu, Y. Study on key step of 1,3-butadiene formation from ethanol on MgO/SiO2. RSC Adv. 2015, 5, 25959–25966. [Google Scholar] [CrossRef]
- Taifan, W.; Baltrusaitis, J. Elucidation of ethanol to 1,3-butadiene reaction mechanism: Combined experimental and DFT study. Abstr. Pap. Amer. Chem. Soc. 2016, 252, 152. [Google Scholar]
- Dagle, V.L.; Flake, M.D.; Lemmon, T.L.; Lopez, J.S.; Kovarik, L.; Dagle, R.A. Effect of the SiO2 support on the catalytic performance of Ag/ZrO2/SiO2 catalysts for the single-bed production of butadiene from ethanol. Appl. Catal. B Environ. 2018, 236, 576–587. [Google Scholar] [CrossRef]
- Sushkevich, V.L.; Ivanova, I.I.; Taarning, E. Ethanol conversion into butadiene over Zr-containing molecular sieves doped with silver. Green. Chem. 2015, 17, 2552–2559. [Google Scholar] [CrossRef]
- Kunii, D.; Levenspiel, O. Fluidization Engineering, 2nd ed.; Butterworth-Heinemann: Boston, MA, USA, 1991; p. 27. 491p. [Google Scholar]
- Levenspiel, O. Chemical Reaction Engineering, 3rd ed.; Wiley: New York, NY, USA, 1999; p. 668S. [Google Scholar]
- Mahecha-Botero, A. Catalytic Fluidized Bed Reactors. In Essentials of Fluidization Technology; Grace, J.R., Bi, X., Ellis, N., Eds.; Wiley-VCH: Weinheim, Germany, 2020; pp. 333–361. [Google Scholar]
- Sundaresan, S.; Amundson, N.R. Studies in char gasification—II: The Davidson-Harrison two phase model of fluidization. Chem. Eng. Sci. 1979, 34, 355–358. [Google Scholar] [CrossRef]
- Werther, J. Scale-up modeling for fluidized bed reactors. Chem. Eng. Sci. 1992, 47, 2457–2462. [Google Scholar] [CrossRef]
- Chaouki, J.; Klvana, D.; Guy, C. Selective and complete catalytic oxidation of natural gas in Turbulent Fluidized Beds. Korean J. Chem. Eng. 1999, 16, 494–500. [Google Scholar] [CrossRef]
- Jafari, R.; Sotudeh-Gharebagh, R.; Mostoufi, N. Performance of the wide-ranging models for fluidized bed reactors. Adv. Powder Technol. 2004, 15, 533–548. [Google Scholar] [CrossRef]
- Rowe, P.N.; Yates, J.G. Fluidized-Bed Reactors. In Chemical Reaction and Reactor Engineering; Carberry, J.J., Varma, A., Eds.; Marcel Dekker, Inc.: New York, NY, USA, 1987; pp. 441–498. [Google Scholar]
- Grace, J.R.; Bi, X.; Ellis, N. Essentials of Fluidization Technology; Wiley-VCH: Weinheim, Germany, 2020; p. 21. [Google Scholar]
- Ho, T.C. Mass Transfer. In Handbook of Fluidization and Fluid-Particle Systems; Yang, W.C., Ed.; Marcel Dekker, Inc.: New York, NY, USA, 2003; pp. 287–307. [Google Scholar]
- Da Ros, S.; Jones, M.D.; Mattia, D.; Pinto, J.C.; Schwaab, M.; Noronha, F.B.; Kondrat, S.A.; Clarke, T.C.; Taylor, S.H. Ethanol to 1,3-Butadiene Conversion by using ZrZn-Containing MgO/SiO2 Systems Prepared by Co-precipitation and Effect of Catalyst Acidity Modification. Chemcatchem 2016, 8, 2376–2386. [Google Scholar] [CrossRef]
- Bîldea, C.S.; Győrgy, R.; Brunchi, C.C.; Kiss, A.A. Optimal design of intensified processes for DME synthesis. Comput. Chem. Eng. 2017, 105, 142–151. [Google Scholar] [CrossRef]
- Brosteanu, A.V.; Banu, I.; Bozga, G. An Analysis of Fixed-Bed Catalytic Reactors Performances for One-Stage Butadiene Synthesis from Ethanol. Catalysts 2024, 14, 83. [Google Scholar] [CrossRef]


| Catalyst | EPP [bar] | Conv [%] | BD sel. [%] | Temp. [°C] | WHSV [kg/kg/h] | Prod. [kg/kg/h] | Reference | |
|---|---|---|---|---|---|---|---|---|
| 1 | MgO/SiO2 | 0.06 | 95 | 77 | 450 | 4.1 | 1.35 | Huang et al. [30] |
| 2 | MgO/SiO2 | 0.15 | 50 | 60 | 300 | 0.5 | - | Szabó et al. [31] |
| 3 | Au/MgO/SiO2 | 0.20 | 60 | 78.3 | 300 | 1.1 | 0.506 | Shylesh et al. [3] |
| 4 | K/Zr/Zn/MgO/SiO2 | 0.4–0.8 | 41.8 | 50.1 | 400 | 0.21 | 0.21 | Da Ros et al. [32] |
| 5 | 1Ag/10ZrO2/SiO2 | 0.5 | 45.6 | 73 | 320 | 0.32 | 0.06 | Sushkevich et al. [23] |
| 6 | Ag/ZrO2/SiO2 | 0.5 | 89 | 73.6 | 325 | 0.47 | 0.17 | Dagle et al. [33] |
| 7 | Ag/ZrO2/SiO2 | 0.29 | 87 | 71.8 | 325 | 0.47 | Li et al. [34] | |
| 8 | Cu/TaSiBEA | 0.3 | 88 | 72.6 | 325 | 0.40 | 0.19 | Kyriienko et al. [35] |
| 9 | La/ZnSiO2 | 0.18 | 36 | 70 | 325 | 1 | 0.15 | Larina et al. [36] |
| 10 | Hf/Zn/SiO2 | 0.025 | 98.8 | 70.0 | 360 | 0.64 | 0.26 | De Baerdemaeker et al. [37] |
| 11 | Hf/Zn/SiO2 | 0.21 | 81.9 | 58.8 | 380 | 1.12 | 1.15 | Cabello González et al. [38] |
| 12 | CuO/La2O3/ZrO2/SiO2 | 1.013 | 48 | 60 | 340 | 1.3 | 0.32 | Makhin et al. [22] |
| 13 * | Ta2O2/SiO2 mol EtOH/ACH = 2.5 | Atm | Xtot = 43 | >75 | 340 | 1.18 | - | Dussol et al. [9] |
| 14 * | Ta-SBA-15 mol EtOH/ACH = 1.7 | Atm | 68 | 75 | 325 | 1.03 | - | Cabello González et al. [39] |
| 15 * | Ta/SMS | Atm. | 56.7 | 70.5 | 350 | - | - | Kim et al. [40] |
| BD1 | BD1 + BD2 | BD1 + C2H4 | BD1 + BUTAL * | BD1 + C2H4 + BUTAL | BD1 + BD2 + BUTOLS * | BD1 + BD2 + BUTENES | |
|---|---|---|---|---|---|---|---|
| Total kmoles | 1.9981 | 1.998 | 1.9995 | 1.943 | 1.9864 | 1.7210 | 1.5120 |
| ETOH | 0.0019 | 0.002 | 0.0005 | 0.002 | 0.0005 | 0.0013 | 4.35 × 10⁻⁵ |
| ACH | 0.0395 | 0.038 | 0.0357 | 0.035 | 0.0336 | 0.0310 | 0.0165 |
| H2 | 0.5190 | 0.536 | 0.1415 | 0.517 | 0.1461 | 0.3994 | 0.0216 |
| CROT-ALD * | 2.06 × 10⁻⁴ | 1.90 × 10⁻⁴ | 1.68 × 10⁻⁴ | 1.74 × 10⁻⁴ | 0.0002 | 1.51 × 10⁻⁴ | 3.52 × 10⁻⁵ |
| CROT-OL * | 1.71 × 10⁻⁶ | 1.62 × 10⁻⁶ | 3.78 × 10⁻⁷ | 1.48 × 10⁻⁶ | 3.12 × 10⁻⁷ | 1.12 × 10⁻⁶ | 1.60 × 10⁻⁸ |
| MVK * | NONE | 0.018 | NONE | NONE | NONE | 0.0023 | 0.0005 |
| 3BTE2OL * | NONE | 1.32 × 10⁻¹⁹ | NONE | NONE | NONE | 9.57 × 10⁻⁶ | 1.37 × 10⁻⁷ |
| H2O | 0.9584 | 0.9426 | 0.9637 | 0.9075 | 0.9526 | 0.8055 | 0.9821 |
| BD | 0.4798 | 0.4623 | 0.1054 | 0.4261 | 0.0990 | 0.3216 | 0.0033 |
| C2H4 | - | NONE | 0.7526 | NONE | 0.7412 | NONE | NONE |
| DEE | - | NONE | NONE | NONE | NONE | NONE | NONE |
| BUTAL * | - | NONE | NONE | 0.055 | 0.0552 | 0.0417 | 5.99 × 10⁻⁴ |
| 1-BUTOL * | - | NONE | - | NONE | NONE | 0.1118 | 9.88 × 10⁻⁵ |
| 2-BUTOL * | - | NONE | - | - | - | 0.0061 | 5.42 × 10⁻⁶ |
| 1-BUTENE | - | - | - | - | - | - | 0.1926 |
| 2-BUTENE | - | - | - | - | - | - | 0.2945 |
| Catalyst | EPP [bar] | Conv. [%] | Temp. [°C] | BD % | ACH % | Olefin % | DEE % | Oxy % | References | |
|---|---|---|---|---|---|---|---|---|---|---|
| 1 | Ag/ZrO2/SiO2 | 0.5 | 30 | 320 | 73.8 | - | 8.6 | 3.7 | 4.6 | Sushkevich et al. [51] |
| 2 | K/Zr/Zn/MgO/SiO2 | 0.6 | 41.8 | 400 | 50.1 | 22.0 | 20.1 | 2.4 | - | Da Ros et al. [15] |
| 3 | Cu/TaSiBEA | 0.3 | 88 | 325 | 72.6 | 15.0 | 2.7 | 1.0 | 8.5 | Kyriienko et al. [35] |
| 4 | Ag/ZrO2/SiO2 | 0.5 | 89 | 325 | 73.6 | 6.7 | 12.2 | 3.0 | 2.7 | Dagle et al. [57] |
| 5 | Ag/ZrO2/SiO2 | 0.29 | 86.9 | 325 | 71.8 | 5.1 | 7.8 | 4.9 | 4.1 | Li et al. [34] |
| 6 | Cu/La/ZrO2/SiO2 | 1.0 | 47.7 | 340 | 60.3 | - | 15.1 | - | 12.3 | Makhin et al. [22] |
| Parameter | Value | Parameter | Value |
|---|---|---|---|
| Weight space velocity (WHSV) | 1.3 h−1 | Amount of catalyst | 2537 kg |
| Reactor feed rate, Fm | 3800 kg/h | Feed ethanol molar fraction | 0.80 |
| Feed pressure of reactants, P0 | 1.5 bar | Reaction temperature, T | 673 K |
| Catalyst particle diameter, dp | 100 μm | Min fluidization velocity, umf | 5.7 mm/s |
| Superficial feed gas velocity, u0 | (10 ÷ 40) umf | Terminal velocity, ut | 0.26 m/s |
| Catalyst particle density, ρp | 1250 kg/m3 | Bubble diameter, Db | 0.08 m |
| Fluidized Bed | Flow Model | Kbd tb | ||
|---|---|---|---|---|
| PFb-PFd | PFb-CSTRd | |||
| u0 = 10 umf | Conv EtOH | 0.280 | 0.289 | 0.57 |
| Yield BD | 0.252 | 0.260 | ||
| Sel BD | 0.898 | 0.90 | ||
| u0 = 20 umf | Conv EtOH | 0.340 | 0.348 | 1.18 |
| Yield BD | 0.301 | 0.310 | ||
| Sel BD | 0.885 | 0.887 | ||
| u0 = 30 umf | Conv EtOH | 0.376 | 0.374 | 1.890 |
| Yield BD | 0.329 | 0.329 | ||
| Sel BD | 0.876 | 0.879 | ||
| u0 = 40 umf | Conv EtOH | 0.396 | 0.382 | 2.48 |
| Yield BD | 0.345 | 0.334 | ||
| Sel BD | 0.871 | 0.875 | ||
| Mixed fluidized bed T = 400 °C | Conv EtOH | 0.385 | ||
| Yield BD | 0.334 | |||
| Sel BD | 0.868 | |||
| Fixed bed dp = 3 mm; T = 400 °C | Conv EtOH | 0.413 | ||
| Yield BD | 0.355 | |||
| Sel BD | 0.860 | |||
| Vbed/Dv0 | 4.43 s | |||
Disclaimer/Publisher’s Note: The statements, opinions and data contained in all publications are solely those of the individual author(s) and contributor(s) and not of MDPI and/or the editor(s). MDPI and/or the editor(s) disclaim responsibility for any injury to people or property resulting from any ideas, methods, instructions or products referred to in the content. |
© 2025 by the authors. Licensee MDPI, Basel, Switzerland. This article is an open access article distributed under the terms and conditions of the Creative Commons Attribution (CC BY) license (https://creativecommons.org/licenses/by/4.0/).
Share and Cite
Dimian, A.C.; Bozga, G.; Banu, I. Linking Catalyst Development and Chemical Reactor Design with Ethanol to Butadiene Processes. Processes 2025, 13, 1024. https://doi.org/10.3390/pr13041024
Dimian AC, Bozga G, Banu I. Linking Catalyst Development and Chemical Reactor Design with Ethanol to Butadiene Processes. Processes. 2025; 13(4):1024. https://doi.org/10.3390/pr13041024
Chicago/Turabian StyleDimian, Alexandre C., Grigore Bozga, and Ionut Banu. 2025. "Linking Catalyst Development and Chemical Reactor Design with Ethanol to Butadiene Processes" Processes 13, no. 4: 1024. https://doi.org/10.3390/pr13041024
APA StyleDimian, A. C., Bozga, G., & Banu, I. (2025). Linking Catalyst Development and Chemical Reactor Design with Ethanol to Butadiene Processes. Processes, 13(4), 1024. https://doi.org/10.3390/pr13041024