Article

Computational Modeling of the Effect of Nitrogen on the Plasma Spray Process with Ar–H2–N2 Mixtures

by
Byeongryun Jeon
1,
Hansol Kwon
1,
Yeon Woo Yoo
1,
Do Hyun Kim
1,
Youngjin Park
1,
Yong-jin Kang
1,
Anthony B. Murphy
2 and
Hunkwan Park
1,*
1
Extreme Materials Research Institute, Korea Institute of Materials Science, 797 Changwondae-ro, Changwon 51508, Republic of Korea
2
CSIRO Manufacturing, P.O. Box 218, Lindfield, NSW 2070, Australia
*
Author to whom correspondence should be addressed.
Processes 2025, 13(4), 1155; https://doi.org/10.3390/pr13041155
Submission received: 26 February 2025 / Revised: 3 April 2025 / Accepted: 8 April 2025 / Published: 10 April 2025
(This article belongs to the Section Materials Processes)

Abstract

:
Plasma spray coating employs a high-temperature plasma jet to melt and deposit powdered materials onto substrates and plays a critical role in aerospace and manufacturing. Despite its importance, the influence of torch behavior, particularly the thermal response of plasma to gas composition changes, remains inadequately characterized. In this study, a three-dimensional MHD simulation using OpenFOAM (v2112) was performed on a Metco 9MB plasma torch operating in an Ar–H2–N2 environment under the LTE assumption to investigate the effect of nitrogen addition. The simulation revealed that increasing nitrogen levels results in a dual effect on the temperature distribution: temperatures rise near the cathode tip and decrease downstream, likely due to variations in the net emission coefficient and enthalpy characteristics of nitrogen. Furthermore, although the outlet velocity remained largely unaffected, the Mach number increased as the nitrogen reduced the speed of sound. These findings provide essential insights for optimizing ternary gas mixtures to enhance coating efficiency in thermal spray applications.

1. Introduction

Plasma spray coating is a thermal spray process that uses an extremely high-temperature plasma jet to melt and deposit powdered material onto a substrate. Upon impact, the molten particles rapidly solidify, forming a dense and adherent coating. The versatility of this technique allows for the use of a wide range of materials, from ceramics to metal alloys and composites, enabling customized solutions for specific industrial needs. A coating can be created with excellent mechanical and physical properties such as wear resistance, thermal barrier capabilities, and corrosion protection. As a result, plasma spray coating is crucial in various industries, including the aerospace, automotive, energy, and biomedical engineering fields [1].
The efficiency of thermal plasma processes such as plasma spraying, arc welding, and plasma arc cutting is significantly influenced by the process gases or gas mixtures used to form thermal plasma. Commonly used gases like argon, helium, hydrogen, and nitrogen are employed either individually or in combination to optimize the performance [2,3,4]. When a mixture of two or three gases is used, it is very difficult to understand the effects of the mixture on the plasma process. Thus, computational modeling is widely used to predict the characteristics of the arc plasma with various gas mixtures. Previous computational models of plasma sprays have generally focused on pure argon and binary gas mixtures such as argon–hydrogen, argon–nitrogen, and argon–helium mixtures. Many studies on binary gas mixtures have examined the use of argon–hydrogen mixtures in the atmospheric plasma spray (APS) process [5,6,7,8,9,10]. Wen et al. studied process gas ratios for the F6 torch and compared the results with DVP2000 and enthalpy probe measurements [5,10]. Dalir et al. also simulated interactions with suspensions in a computational domain that included both the interior and exterior of the SG100 torch [6]. The use of N2–Ar in the APS process has also been studied [11,12]. There have also been studies on the use of binary gas mixtures in the plasma spray–physical vapor deposition (PS–PVD) and vacuum plasma spray (VPS) processes [13,14,15,16]. Zhang et al. discussed the development and results of a numerical model of arc plasma and powder interactions in PS–PVD, considering Ar–H2 and Ar–He process gases, along with various process parameters [13]. Additionally, for arc welding, analysis models for mixed gases with 2–3 components have been developed by applying combined diffusion coefficient models [17,18], with simulation results published on gas mixing and demixing [19,20]. For plasma spraying, three-component gases have been used to maximize the advantages of gas mixtures, with studies on spray processes using Ar–He–H2 or Ar–H2–N2 mixtures [21,22,23]. However, the related model development research has been insufficient, making it difficult to understand the physical phenomena of three-component gas mixtures. Therefore, modeling studies are needed to understand the effects of three-component gas mixtures.
Baeva et al. investigated the effects of electric field reversal and convection on cathode erosion using a unified microarc model [24]. Saifutdinov presented simulation results to predict the temperature variations in electrodes under different current conditions [25]. Zhukovskii et al. incorporated the electrodes of a cascade torch into the computational domain and provided various simulation results based on the local thermodynamic equilibrium (LTE) and two-temperature (2T) models [26,27]. Zhang et al. analyzed both the internal flow, including the cascade torch electrodes, and the external ambient flow influenced by different turbulence models [28]. In addition to torch-scale modeling, several studies have explored fundamental discharge and cathode phenomena [29,30,31]. Anders reviewed glow, arc, and ohmic discharges, focusing on cathode-driven mode transitions [29]. Tsonev et al. used a 2D model to show how emission mechanisms influence the discharge near the cathode [30]. Benilov showed that cathode spots result from mode transitions driven by multiple steady-state solutions in the glow and arc discharge [31].
Moreover, although the 9MB torch is one of the most commonly used plasma torches, there has been little modeling research on this torch [8,32,33]. Kwon et al. conducted numerical simulations with various Ar and H2 flow rates to deposit Ni particles [8]. Other studies have examined particle characteristics based on powder parameters [32,33]. Most plasma modeling research has only provided simulation results for SG100 or F4 torches. Consequently, recognizing the need for 9MB-related simulations, this study developed an arc plasma model for the 9MB torch.
Although the Metco 9MB plasma spray torch has been widely used in industrial applications, computational models specifically designed for this torch are still limited. Most of the existing plasma spray models focus on pure Ar or binary gas mixtures. However, the use of ternary gas mixtures has become increasingly common in recent years owing to the pursuit of improved coating quality and process efficiency. However, computational and experimental studies on the effects of ternary gas mixtures remain insufficient. Therefore, in this study, a numerical magnetohydrodynamic (MHD) model was developed to investigate the effect of the nitrogen flow rate in ternary gas mixtures on the plasma spray process in a Metco 9MB torch. The analysis focused on the influence of nitrogen addition on voltage characteristics, temperature distribution, and flow behavior. Specifically, this study aimed to examine the impact of varying the nitrogen content in a ternary gas mixture on the arc dynamics and heat transfer mechanisms, ultimately influencing the overall plasma spray process.

2. Methodology

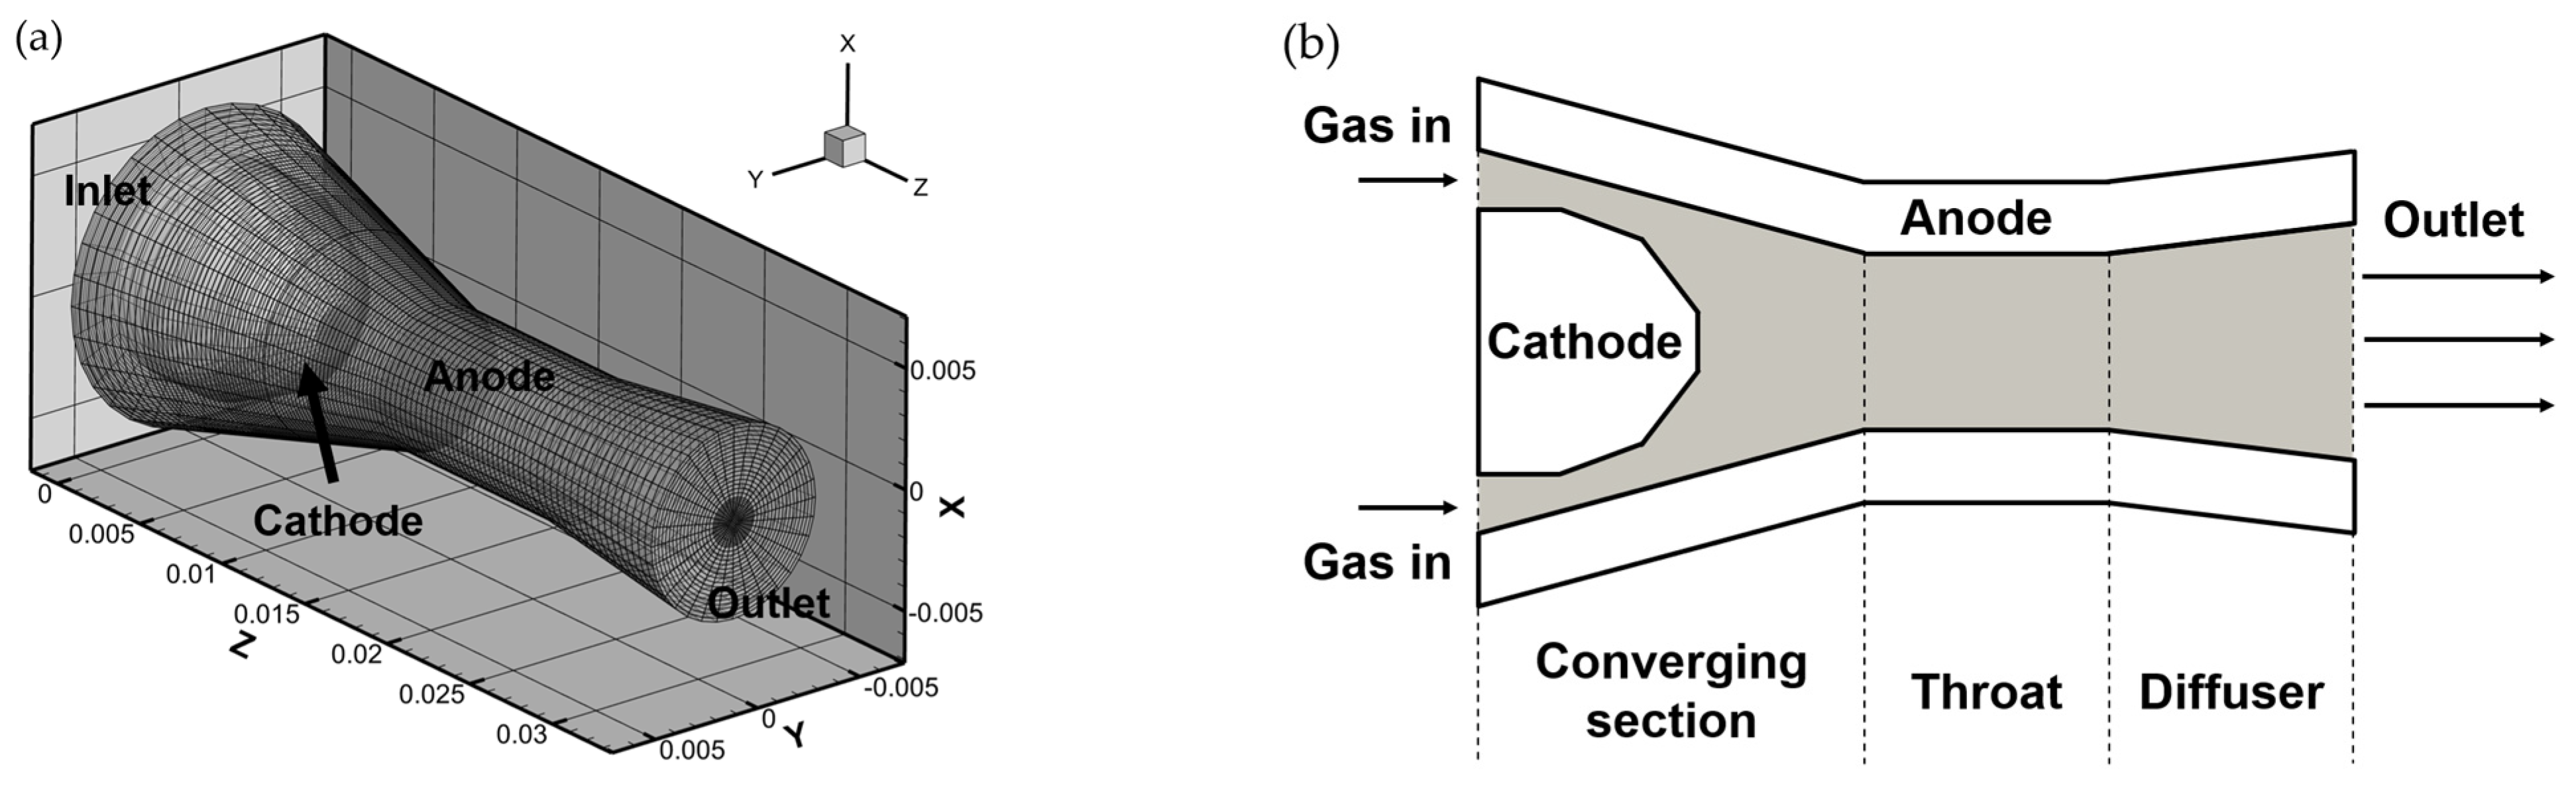
2.1. Geometry and Operating Conditions

The internal plasma flow and arc characteristics of the Metco 9MB (Oerlikon Metco, Wohlen, Switzerland) plasma torch were investigated using computational fluid dynamics (CFDs) simulations. Figure 1a illustrates the three-dimensional computational domain of the plasma torch used for these simulations, which was divided into the inlet, outlet, anode, and cathode regions. Figure 1b shows the cross-sectional structure of the plasma torch.
The working gas was injected through the inlet under swirl conditions, forming a clockwise rotational flow. The injected gas absorbed energy from the arc connecting the cathode and anode, undergoing excitation and ionization processes to transition into a plasma state. During this process, the anode and cathode were protected from thermal damage by a water-based cooling system. The high-temperature plasma gas was then discharged through the diffuser to the outlet.
The working gases used in this study are listed in Table 1. A constant total volumetric flow rate of 102 SCFH was maintained, while the proportions of Ar and N2 were systematically varied. Table 1 outlines the specific flow rates of Ar and N2 for each test case. Starting with a high-Ar and zero-N2 configuration (Case 1), the N2 flow rate was incrementally increased to 12 and 24 SCFH, while the Ar flow rate was correspondingly decreased to 84 and 72 SCFH (Cases 2–3). This configuration facilitated the investigation of plasma jet characteristics across a range of Ar–N2 compositions, with the H2 flow rate fixed at 6 SCFH throughout the study.

2.2. Governing Equations

A three-dimensional, unsteady MHD model was employed to simulate the plasma fields inside the torch. This included accurately capturing the arc movement and its interaction with the flow. The customized rhoPimpleFoam solver in OpenFOAM v2116 was employed to capture the unsteady behavior and solve the full set of MHD equations [34]. The electromagnetic field calculations were integrated into the momentum and energy equations to account for Lorentz forces and Joule heating, respectively, while maintaining local thermodynamic equilibrium (LTE) conditions.
In this model, plasma was assumed to be quasi-neutral and in LTE. In other words, the particle populations and energy states were governed by the local temperature and pressure. Radiative losses were represented using a net emission coefficient method, and temperature-dependent thermodynamic and transport properties (e.g., the viscosity, thermal conductivity, electrical conductivity, and specific heat capacity) were considered. The primary set of governing equations is as follows [3,4,20,34,35,36].
  • Continuity equation
The mass conservation in the plasma flow is given by the continuity equation:
ρ t + · ( ρ u ) = 0 ,
where ρ is the plasma density, and u is the velocity vector.
  • Momentum conservation equation
The momentum conservation equation includes the effects of the pressure, viscous stresses, and electromagnetic forces due to the arc current:
t ρ u + · ρ u u = p + · μ u + J × B ,
where p is the pressure, μ is the dynamic viscosity, J is the current density, and B is the magnetic flux density vector.
  • Energy conservation equation
The energy conservation equation describes the thermal state of plasma, accounting for the conduction, pressure work, Joule heating, and radiative losses:
t ρ h + · ρ u h = · κ c p h + D p D t + 5 2 k B e ( J · T ) + J · E Q r ,
where h is the specific enthalpy, κ is the thermal conductivity, c p is the specific heat at a constant pressure, T is the temperature, k B is Boltzmann’s constant, e is the elementary charge, E is the electric field, and Q r represents the radiative heat losses.
  • Electric potential
The LTE assumption is applied to handle the thermophysical properties of plasma, while electric potential ϕ is introduced to compute the electric field and current density. We calculated the following based on Ohm’s law:
J = σ ϕ ,
where σ is temperature-dependent electrical conductivity. The charge conservation is enforced as follows:
· ( σ ϕ ) = 0 .
The electric field is then determined by E = ϕ . Both J and E are incorporated into the energy and momentum equations to account for the Joule heating and Lorentz force, respectively, thereby capturing the complex behavior of the plasma in the torch. Additionally, the net emission coefficient (NEC) model was adopted under the LTE condition to represent radiative losses. This method consolidates the radiative emission characteristics of high-temperature regions into a single coefficient in the energy equation. Further details on the NEC formulation can be found in Section 2.4.
  • Magnetic field
The magnetic field B is derived from vector potential A :
B = × A .
The vector potential satisfies the Poisson equation as follows:
2 A = μ 0 J ,
where μ 0 is the permeability of free space. The Lorentz force J × B is evaluated by coupling this magnetic field calculation with the momentum equation.
The fully integrated three-dimensional MHD approach ensures that the velocity, electric, and magnetic fields are solved in a consistent manner, enabling accurate predictions of the arc formation, motion, and restrike phenomena within the plasma torch.

2.3. Boundary Conditions

A convective heat transfer boundary condition was applied at the anode wall to simulate forced cooling with the heat transfer coefficient h w = 1.0 × 10 5   W / K · m 2 and reference wall temperature T w = 300   K [11,37]. Under these settings, the heavy particle temperature near the anode converged toward 300 K. However, the electron temperature in that region remained much higher. Thus, enforcing LTE to a strictly low temperature would unrealistically reduce the electrical conductivity. To mitigate this issue, a thin layer (0.1 mm) of artificially high electrical conductivity (10,000 S/m) was used along the anode surface [6,38]. Both enhanced conductivity and layer thickness strongly influenced the simulated arc attachment and overall plasma behavior.
At the inlet, a specified flow rate was imposed, and T i n = 300   K was used to represent room temperature. The cathode was treated as a stationary wall with the following Gaussian-type radial profiles for temperature and current density:
T r = 300 + 3200   e x p r 2 r c 4 ,
J r = J 0 e x p r r c 4 ,
where r is the radial distance from the torch axis, r c is the characteristic radius (e.g., 0.928 mm), and J 0 is chosen so that the integral of J r over the cathode tip equals the working current (e.g., 600 A). This ensures a peak current density of 2.5 × 10 8   A / m 2 . Such Gaussian expressions match the experimental and numerical findings, showing that most of the heat and charge are concentrated near the cathode center. By matching the total current through J r d A , these boundary profiles provide a physically realistic representation of the localized energy input driving the plasma arc.
Table 2 summarizes the overall boundary settings: the outlet was set to ambient pressure ( p a m b ) with zero-gradient conditions for the velocity and temperature, while the anode and cathode walls had a no-slip velocity condition ( u = 0 ). For electric potential ϕ and magnetic potential A , zero-gradient ( / n = 0 ) or fixed-value (e.g., ϕ = 0 at the anode) conditions were applied as needed. These specifications collectively captured the essential physics of forced cooling at the anode, localized arc attachment at the cathode, and consistent charge transport near the electrodes under the LTE assumption.

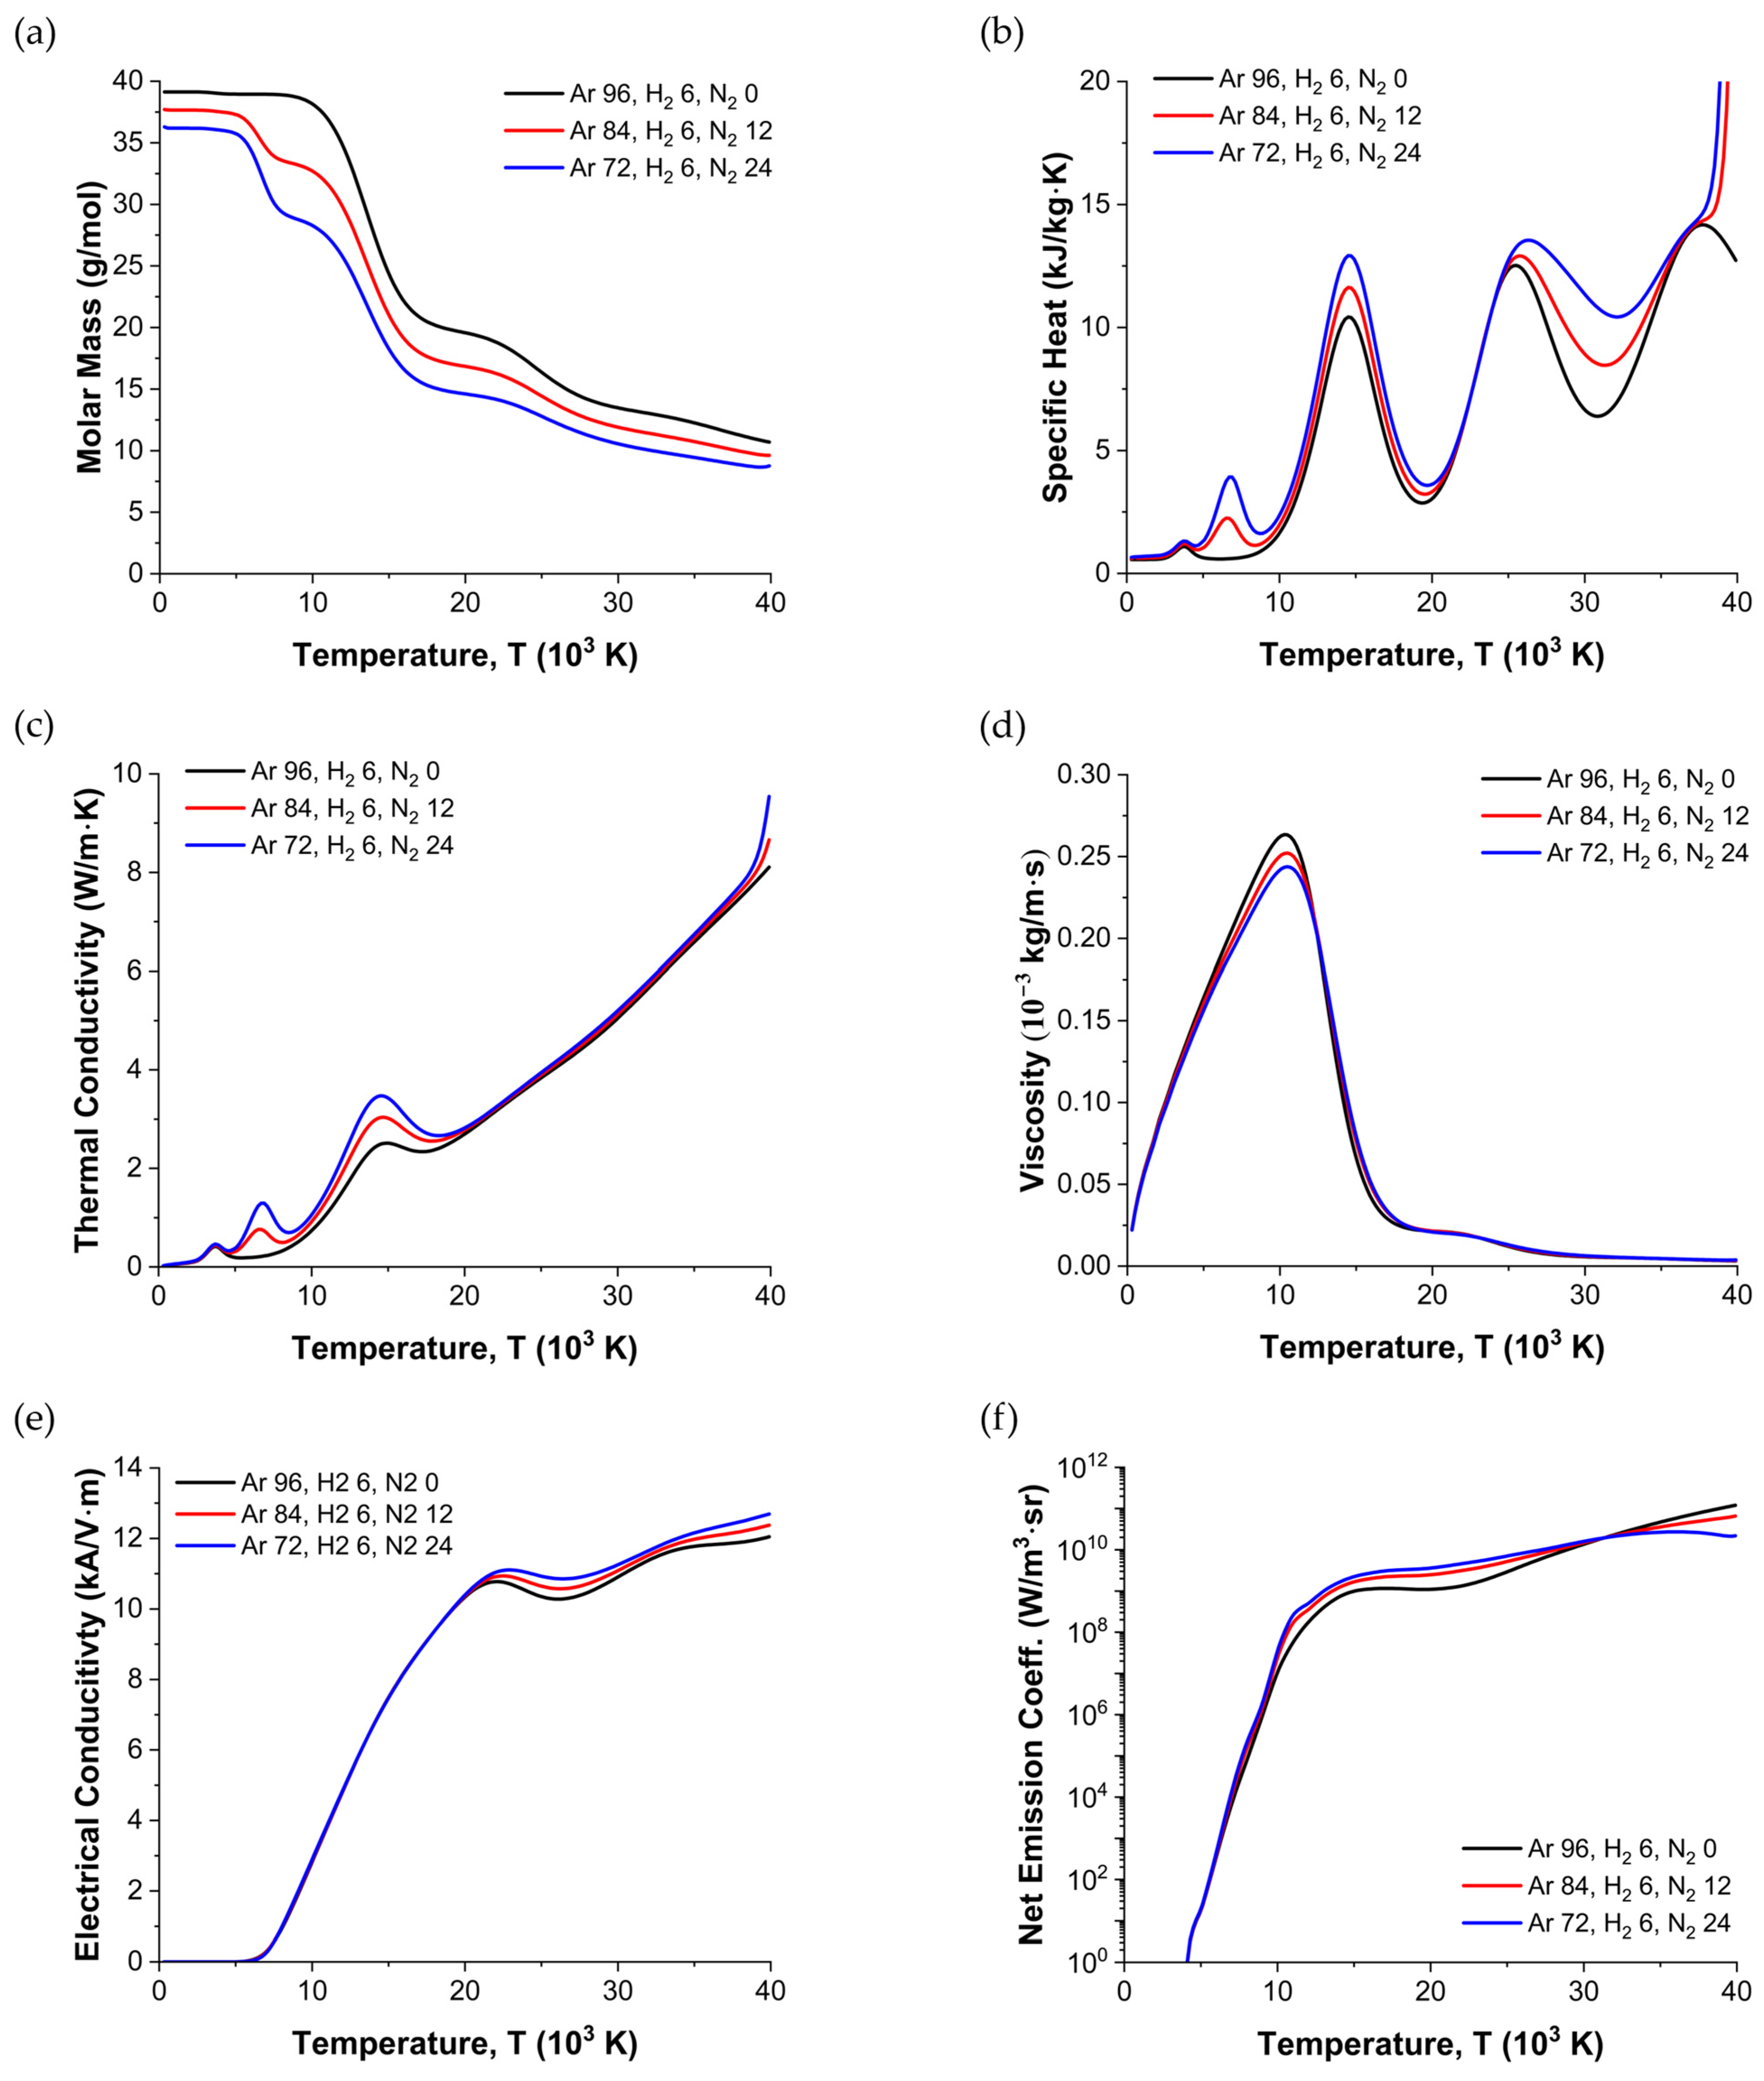
2.4. Thermodynamic and Transport Properties

For the numerical simulations, a thermophysical property database spanning 0.1 bar to 4 bar was created for Ar–H2–N2 mixtures, with representative data at 1 bar shown in Figure 2. These property curves (molar mass, specific heat, thermal conductivity, viscosity, and electrical conductivity) were primarily obtained using the approach used by Murphy [39,40]. The net emission coefficient was taken from Cram for argon [41], from Cressault for hydrogen [42], and from Ernst for nitrogen [43]. Despite the comprehensive range, only a few properties directly influenced the voltage behavior and temperature distributions discussed in Section 3 and Section 4.
  • Electrical Conductivity: The electrical conductivity increased significantly with the temperature (especially above ∼20,000 K), with a steeper increase as the nitrogen fraction increased, which enhanced the ionization and free-electron density. This property played a key role in determining the arc voltage and current density profiles.
  • Net Emission Coefficient: The NEC governed radiative heat losses. While the NEC typically increased with nitrogen at moderate temperatures, it decreased in extremely hot regions (>32,000 K) where N2 was extensively ionized, decreasing the radiative transitions. This variation in the NEC partially explained the temperature changes observed in the torch.
  • Thermal Conductivity: Thermal conductivity affects how quickly heat diffuses through the plasma. Elevated nitrogen levels tended to raise the overall thermal conductivity, aiding in the efficient cooling of the plasma core and influencing the temperature field near the outlet.
These properties collectively supported the LTE assumption and helped explain why certain operating voltages, arc lengths, and temperature distributions emerged in the results.

2.5. Validation

To verify that the numerical results were not overly sensitive to the grid resolution, a mesh independence study was carried out. The computational domain was discretized using ANSYS ICEM CFD (2021 R1), testing multiple mesh configurations ranging from approximately 20,000 to 160,000 cells. After reaching a quasi-steady state, the temperature fields at the outlet were time-averaged over a stable window (e.g., 10–20 ms) and then radially averaged to obtain representative temperature profiles.
Figure 3 illustrates the radially averaged temperature distributions that resulted in different mesh densities. As the number of cells increased, the temperature curves began to converge, indicating reduced sensitivity to further refinement. Based on these results, a mesh with approximately 85,000 cells was chosen to balance the computational cost and solution accuracy.
To further validate the numerical approach, the predicted voltage drop in the Metco 9MB plasma torch (operating with an Ar–H2 gas mixture) was compared to experimental measurements, as shown in Figure 4. The simulation results exhibited good agreement with the measured data, demonstrating that the adopted MHD formulation and boundary conditions effectively captured the essential electrical characteristics of the plasma torch under the tested conditions.

3. Results and Discussion

In this study, the voltage variations observed during the final 10 μs of the total 20 μs simulation period were examined. Figure 5 compares the average, maximum, and minimum arc voltages under different simulation conditions. As the nitrogen flow rate increased from 0 to 12 and 24 SCFH, the average voltage increased from 58.52 V to 65.55 V (+7.03 V) and 75.48 V (+9.93 V), respectively. Notably, a larger fraction of nitrogen induced a larger voltage increase. The maximum voltage similarly increased from 66.36 V to 78.34 V (+11.98 V) and 100.99 V (+22.65 V), respectively, while the minimum voltage increased from 50.03 V to 51.58 V (+1.55 V) and 53.42 V (+1.84 V), respectively. Consequently, the overall voltage fluctuation range (ΔV) expanded sharply from 16.33 V to 26.51 V and ultimately reached 47.57 V.
Figure 2 shows that the operating voltage increases with a higher nitrogen content. As Murphy et al. [44] noted, this phenomenon is attributed to the thermal pinch effect, driven by nitrogen’s high volumetric enthalpy, which intensifies the arc constriction and raises the voltage. In this narrower arc column, increased local temperatures and current densities ultimately require a higher voltage to sustain the discharge.
In a plasma spray torch, factors such as the plasma arc length and current density play key roles in determining the operating voltage. To better understand these influences, the average arc length was first examined using the average current–density distribution, as illustrated in Figure 6. Near the cathode tip, the boundary condition enforced a peak current density of roughly 2.5 × 10⁸ A/m2, which then decreased along the flow direction toward the outlet. Defining the arc length as the distance over which the current density decreased to 10% of its maximum value (i.e., 2.5 × 10⁷ A/m2), this arc length showed an increase from 9.72 mm to 10.3 mm (+0.58 mm) and 11.26 mm (+0.96 mm) as the nitrogen flow increased from 0 to 12 and 24 SCFH, respectively. As the nitrogen ratio increased, the average arc length also grew. Given the well-established phenomenon that the arc root moves downstream and raises the voltage [45], the increases observed in both maximum voltage and arc length suggest that this longer arc—driven by a higher nitrogen content—contributed to the overall rise in voltage.
Next, Figure 7 shows how the current density varied spatially along the axial direction. The data reveal that not only did the arc length increase with the nitrogen fraction, but the current density itself increased across the entire computational domain. This effect could be attributed to the way additional nitrogen modified the electrical and thermal properties of the plasma, thereby enhancing the ionization and storing more energy. In the absence of nitrogen (0 SCFH), a local rise in the current density was observed at approximately 6 mm from the cathode tip, which was due to the torch’s geometry. Specifically, in this torch, restrike (arc reignition) events repeatedly occur in the throat region, such that the shortest plasma arc that is formed effectively starts near the 6 mm mark. There, contact with the anode drives a localized jump in current density.
Interestingly, as the nitrogen flow increased, the current density at the 6 mm position increased from 4.9 × 10⁷ A/m2 to 5.3 × 10⁷ A/m2 and 5.7 × 10⁷ A/m2, which correlated with the increases in the previously noted minimum voltage. In other words, the intensified current density near the local arc attachment point effectively elevated the baseline voltage, causing the overall voltage level to remain higher.
Furthermore, the restrike interval was examined as a function of the nitrogen content, as illustrated in Figure 8. When the nitrogen flow increased from 0 to 12 and 24 SCFH, the restrike period substantially decreased from approximately 64.5 µs to 53.5 µs and 45.1 µs, respectively. This behavior indicates that the time required for the arc attachment point to travel along the anode was significantly reduced, suggesting the more frequent extinction and re-establishment of the arc at higher nitrogen concentrations. In other words, the arc lifetime became shorter, and its unstable behavior increased.
In other words, increasing the nitrogen content simultaneously increased the plasma arc length, increased the overall current density, and decreased the restrike period. Together, these factors increased not only the average and maximum voltages but also the minimum voltage, ultimately causing the voltage fluctuation amplitude to increase considerably. From a physical standpoint, nitrogen introduced additional thermal and energy demands—particularly the thermal pinch effect, along with intensified Joule heating, molecular dissociation, and ionization. These combined mechanisms ultimately resulted in the observed increase in the operating voltage.
The temperature distributions within the plasma torch and at the outlet were examined. Figure 9 presents the cross-sectional temperature profiles obtained under various simulation conditions, revealing that the highest temperature occurred near the cathode tip, where the plasma arc initially formed on the cathode surface, and the current density and electric field were highly concentrated. Notably, when the nitrogen flow rate increased from 0 to 12 and 24 SCFH, the maximum temperature increased from approximately 34,900 K to 35,400 K and 36,000 K, respectively. This finding was interpreted to be a consequence of the thermal pinch force.
Meanwhile, the temperature decreased with an increase in the distance from the cathode tip, moving toward the exit, and higher nitrogen ratios produced lower temperatures. As shown in Figure 2, the added nitrogen increased the gas’s thermal conductivity and heat capacity, causing the plasma heat to diffuse and cool more efficiently. The influx of nitrogen also increased the NEC, which increased the radiative heat loss and further contributed to the decrease in the overall temperature.
Interestingly, in the ultra-high-temperature region above approximately 30,000 K, the NEC actually decreased as the nitrogen fraction increased. Figure 10a,b compare the temperature and NEC variations along the z-axis at the center of the torch, thus illustrating how the NEC depended on the temperature. When the nitrogen flow was 0 SCFH, the NEC was approximately 7.4 × 10¹⁰ W/(m3·sr), whereas at 12 and 24 SCFH, it fell markedly to 5.8 × 10¹⁰ W/(m3·sr) and 4.3 × 10¹⁰ W/(m3·sr), respectively. In other words, under extremely high-temperature conditions near the cathode tip, increasing the nitrogen concentration tended to suppress radiative emissions, which allowed the plasma temperature to remain higher. This phenomenon can be explained by the fact that, in such a high-temperature state, nitrogen molecules (and atoms) are already extensively ionized, reducing the available emission spectrum and thereby weakening the overall radiative cooling effect.
Furthermore, this study examined the temperature, velocity, and Mach number distributions at the torch outlet (Figure 11a–c). As shown in Figure 11a, increasing the nitrogen flow rate from 0 to 12 and 24 SCFH caused a general decrease in the outlet temperature. The maximum temperature at the outlet decreased from approximately 15,400 K to 14,300 K and 13,800 K, respectively, while the weighted average temperature decreased from 7850 K to 7530 K and 7390 K, respectively. The largest differences were found in the 5000–10,000 K range: when nitrogen was absent, a steep temperature increase was observed within this interval, whereas with added nitrogen, changes in the heat capacity and thermal conductivity moderated the temperature increase. As seen in Figure 2, nitrogen dissociation became significant between 5000 K and 10,000 K, absorbing and consuming energy and thus limiting the overall temperature increase.
Meanwhile, Figure 11b shows the velocity distribution, revealing that when the nitrogen flow was 0 SCFH, the velocity at the outlet center was approximately 1825 m/s, which changed only slightly to 1808 m/s at 12 SCFH and 1847 m/s at 24 SCFH, indicating no clear monotonic trend. However, the highest velocity was found at a slightly off-center position. In the absence of nitrogen, the maximum velocity (1912 m/s) was found at approximately 1 mm from the center, whereas at 12 SCFH, it shifted to approximately 0.7 mm away with a peak of 1847 m/s, and at 24 SCFH, it appeared 0.5 mm off-center at 1856 m/s. Additionally, the weighted average velocity exhibited an increasing trend, rising from 754 m/s to 763 m/s and then to 818 m/s. Thus, unlike the temperature distribution, no clear trend in the velocity distribution was observed with changes in the nitrogen flow, although the overall velocity gradually increased. Notably, the highest velocity occurred off-center rather than at the center, which is presumably attributable to the viscosity changes influenced by temperature.
Finally, Figure 11c shows the Mach number distribution, which was derived by combining the velocity and temperature data. In the nitrogen-free case (0 SCFH), the Mach number was 0.77 at the center and peaked at 0.83, whereas at 12 SCFH, it increased to 0.85 at the center, with a maximum value of 0.87. At 24 SCFH, these values further increased to 0.92 and 0.93, respectively, demonstrating a clear tendency for higher Mach numbers at greater nitrogen ratios. This behavior suggests that, unlike the temperature or velocity, the Mach number is driven by a combination of molecular-weight reduction and thermodynamic changes that lower the speed of sound while also altering the flow velocity, thereby increasing the relative flow velocity (Mach number).
Table 3 lists the input power, output power, overall efficiency, average temperature, and velocity at the torch outlet for each simulation case. The output energy was approximated using enthalpy at the outlet, whereas the input energy was determined by multiplying the average voltage by the current (600 A) [46]. As the nitrogen fraction increased from Case 1 to Case 3, the rising arc voltage drove the input power upward (from 37.797 to 52.276 kW), while the outlet energy also increased (from 23.626 to 26.548 kW). However, the corresponding efficiency decreased (from 62.51% to 50.78%) owing to higher energy losses such as electrode cooling and radiation [9]. In addition, the outlet temperature decreased at a higher nitrogen content, whereas the velocity increased.
Based on these findings, when optimizing thermal spray processes, although the outlet temperature decreases as the nitrogen ratio increases, a higher enthalpy can help reduce the fraction of unmelted particles. However, the accompanying increase in velocity may shorten the particle dwell time, potentially hindering the in-flight heat transfer and affecting the final coating thickness, microstructure, and adhesion [8]. In addition to these temperature–velocity trade-offs, the observed decrease in efficiency translates to increased operating costs, and the elevated power output can accelerate electrode erosion. Therefore, a more advanced model is needed that accounts for factors such as dwell time, in-flight particle temperature evolution, and the thermodynamic/flow effects of varying nitrogen ratios to elucidate how coating quality responds under these conditions. By integrating these industrial constraints and process variables, future work can balance enhanced particle melting with the operational challenges posed by higher power usage and reduced efficiency.

4. Limitations

In this study, the heated cathode was treated as a stationary wall with the boundary temperature and current density near the cathode tip imposed via Gaussian-type radial profiles. Although this approach greatly simplified the modeling of arc attachments, several real-world phenomena remain unaddressed.
In actual operation, complex processes occur at the cathode tip, ranging from microscale phenomena, such as intense thermionic emission, evaporation, melting, and shape change over prolonged usage, to macroscale effects, including transient arc wandering and inhomogeneous electrode wear [24,25]. These behaviors could locally alter the current distribution and cathode surface geometry; however, our model treated the cathode tip as a fixed boundary without accounting for microstructural changes or detailed electron-emission mechanisms.
In addition to these limitations, the present model relied on the assumption of LTE to calculate the plasma properties and transport coefficients [9]. Under LTE, the electron temperature was assumed to be equal to the heavy-particle temperature, and the plasma composition was determined solely by the local temperature and pressure. However, in regions close to the electrodes, especially near the cathode tip and in the arc attachment region, strong temperature gradients and rapid cooling could lead to significant deviations from the LTE [46]. These non-equilibrium effects could result in inaccuracies in predicting the plasma parameters, which, in turn, influence arc behavior and stability.

5. Conclusions

Adding nitrogen to the Ar–H2 mixture in a Metco 9MB torch significantly increases the arc voltage, modifies the thermal and flow profiles, and reduces overall process efficiency. These outcomes, observed through three-dimensional MHD simulations, highlight the complex role of N2 in enhancing particle heating but also imposing operational trade-offs. The primary findings of this study are as follows.
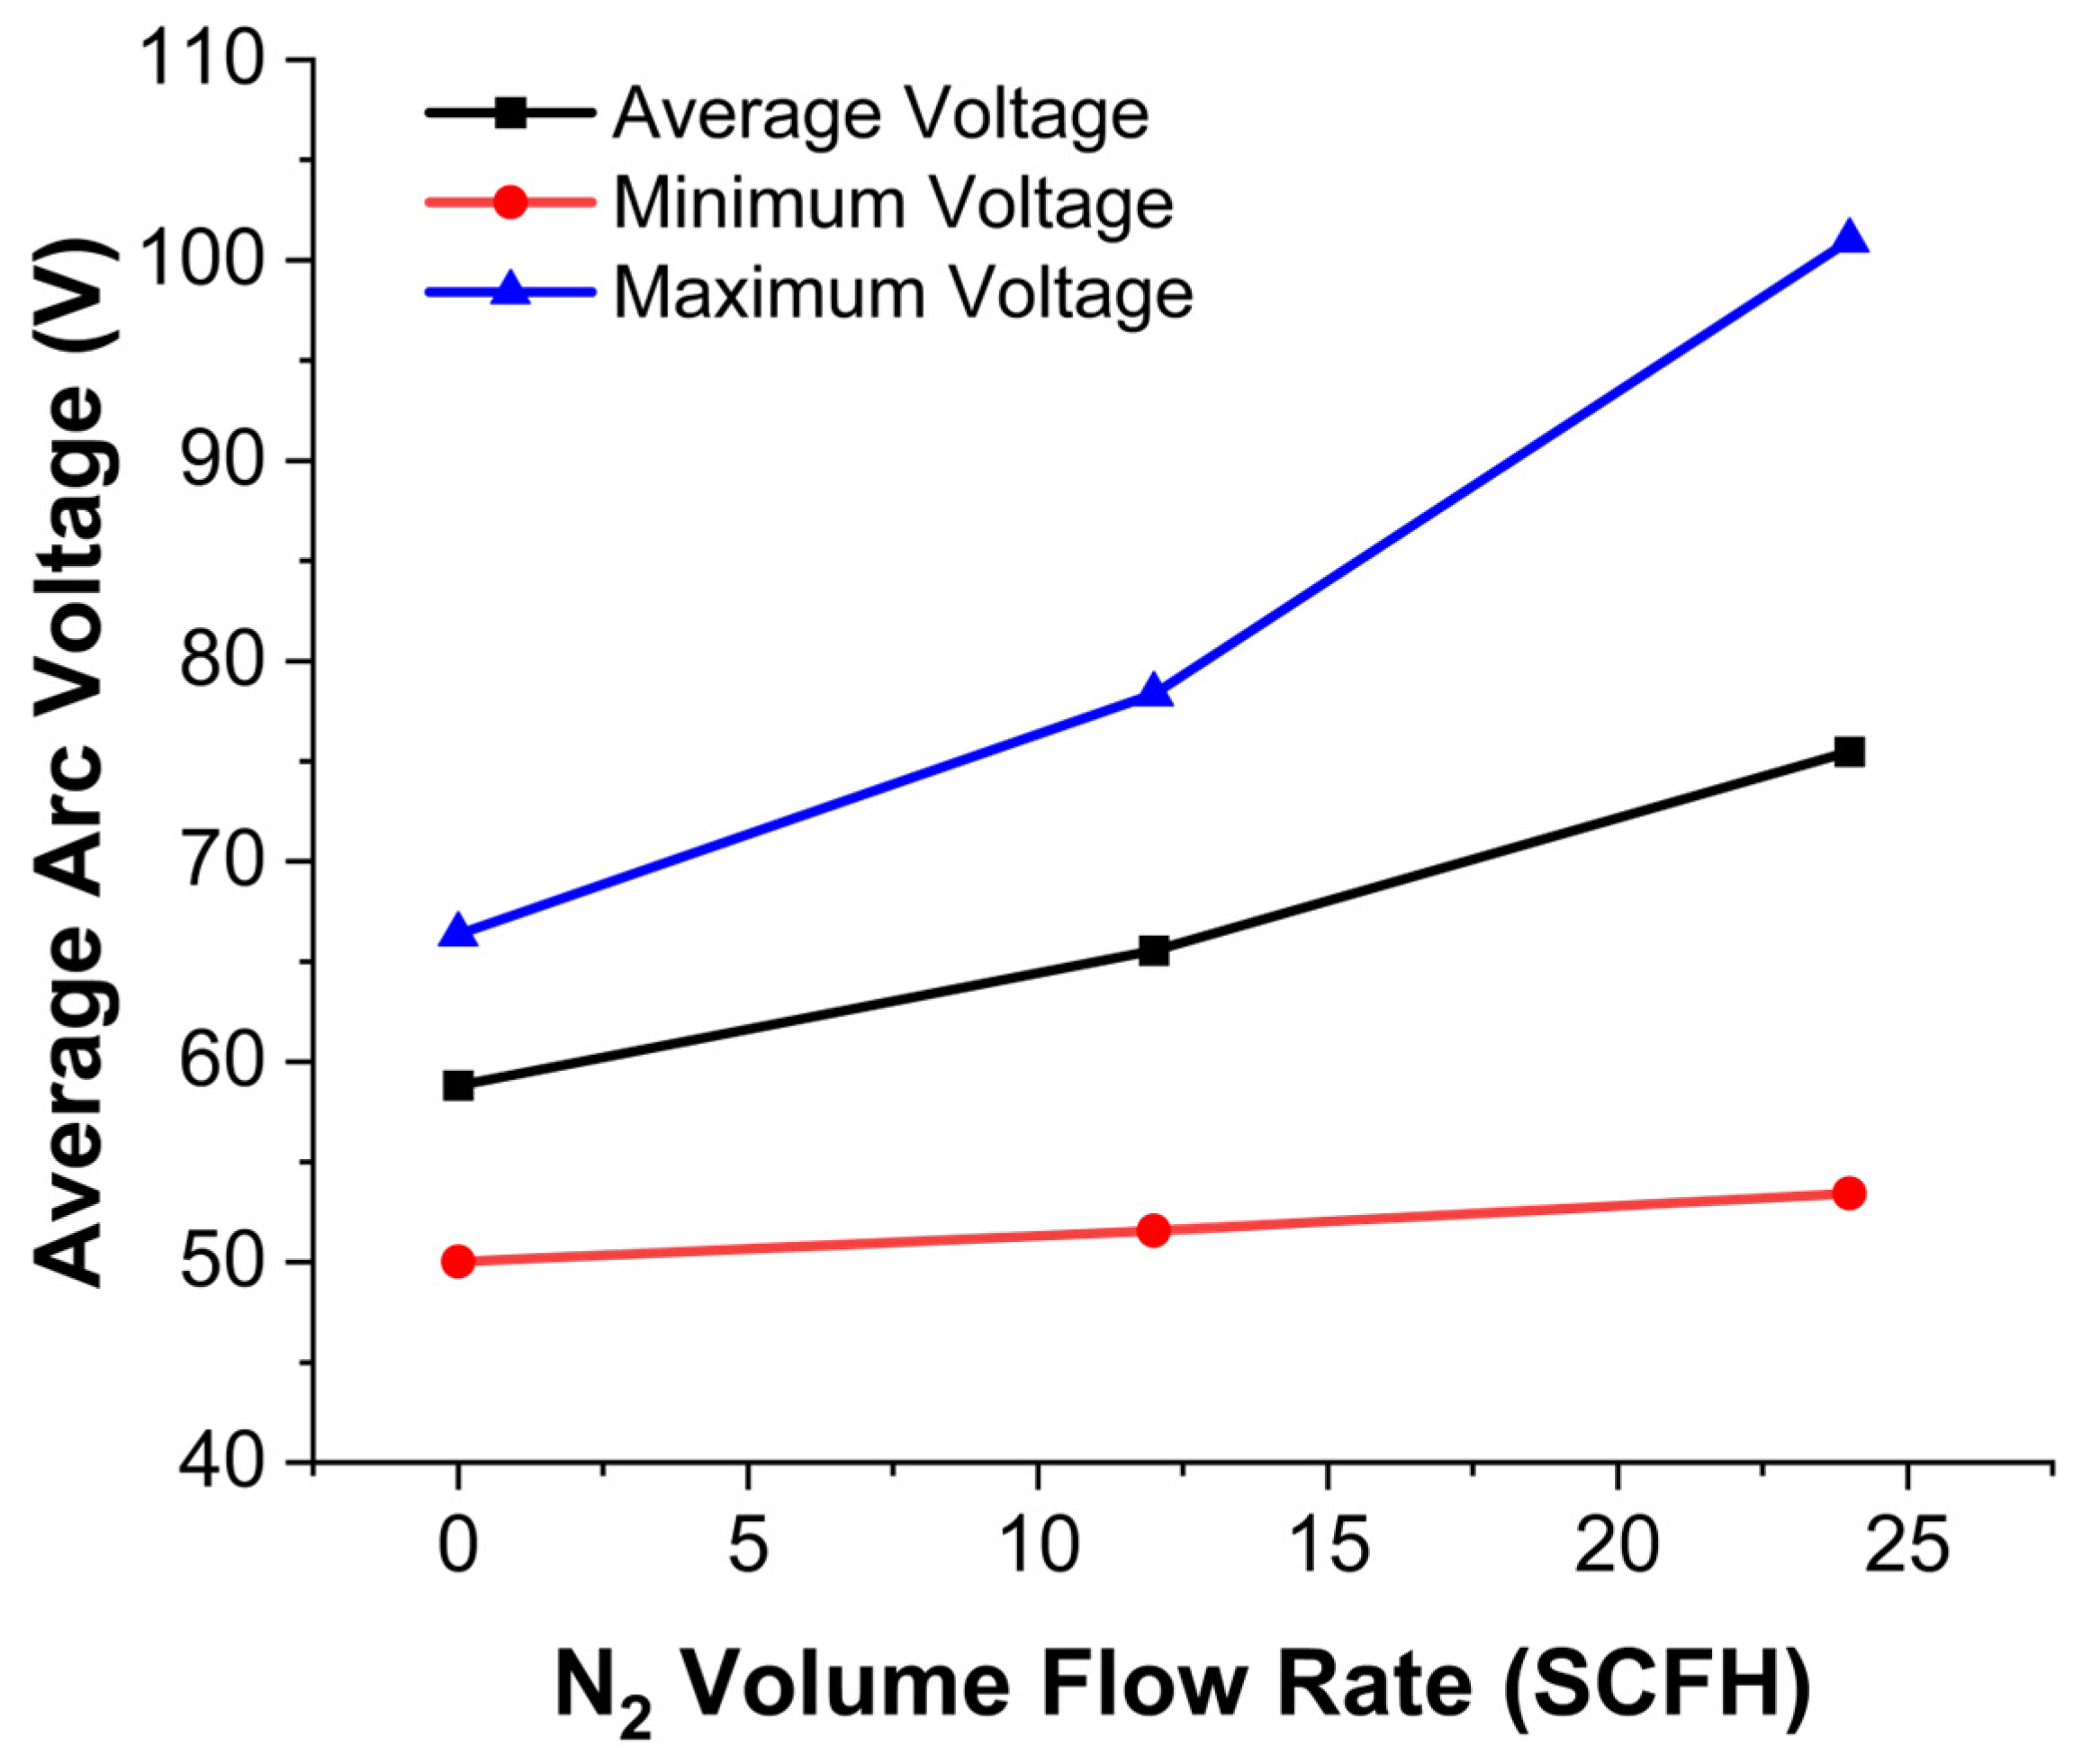
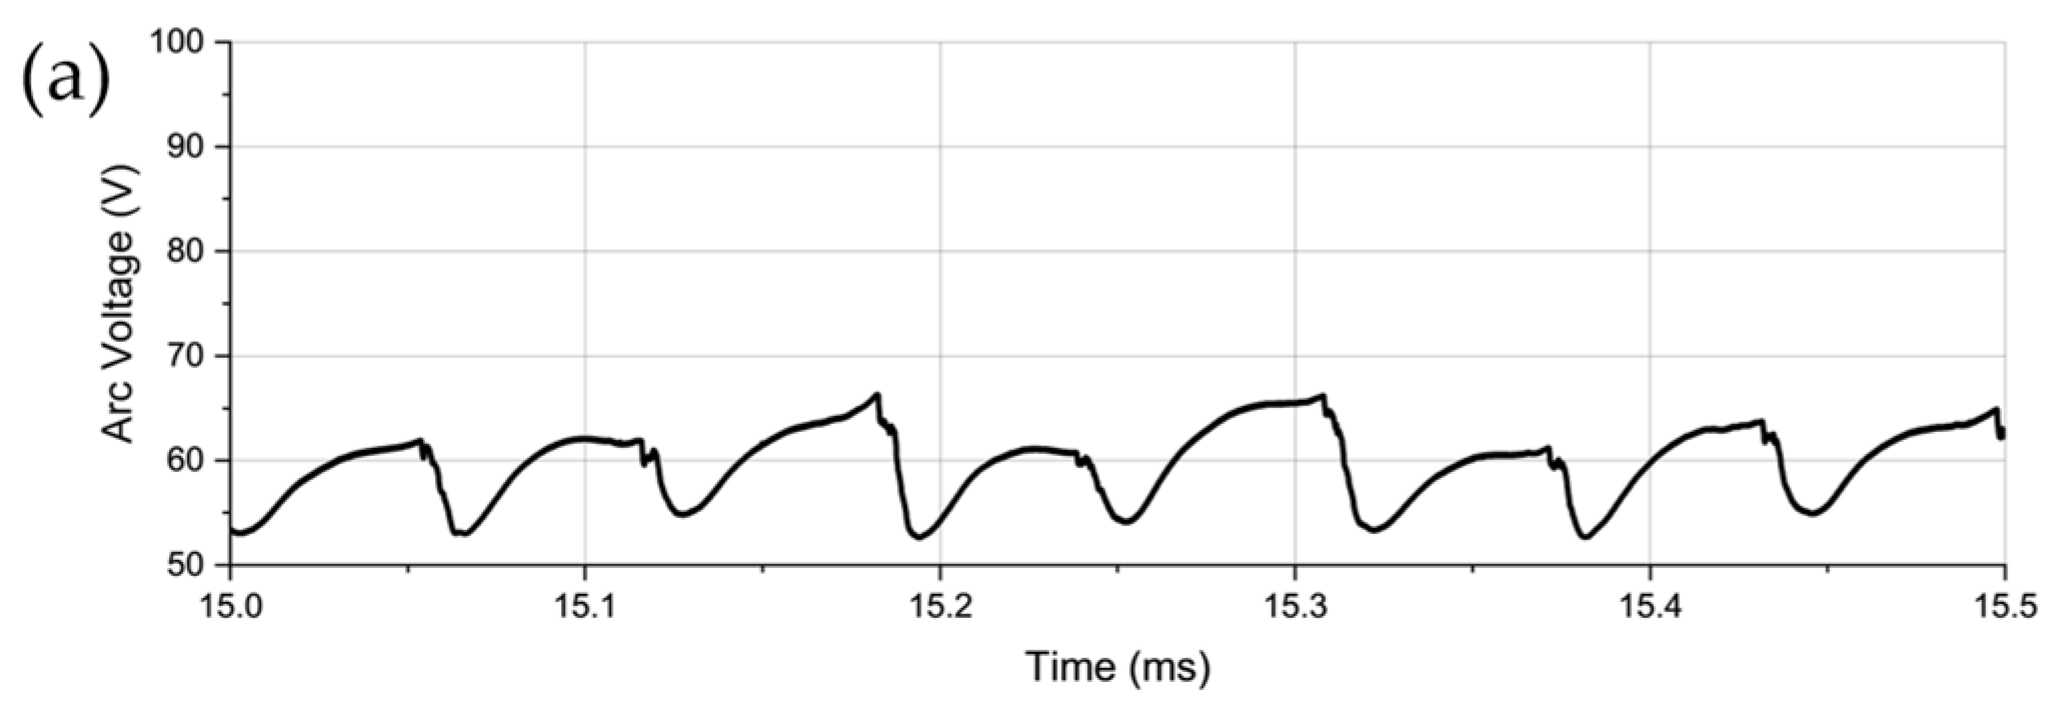
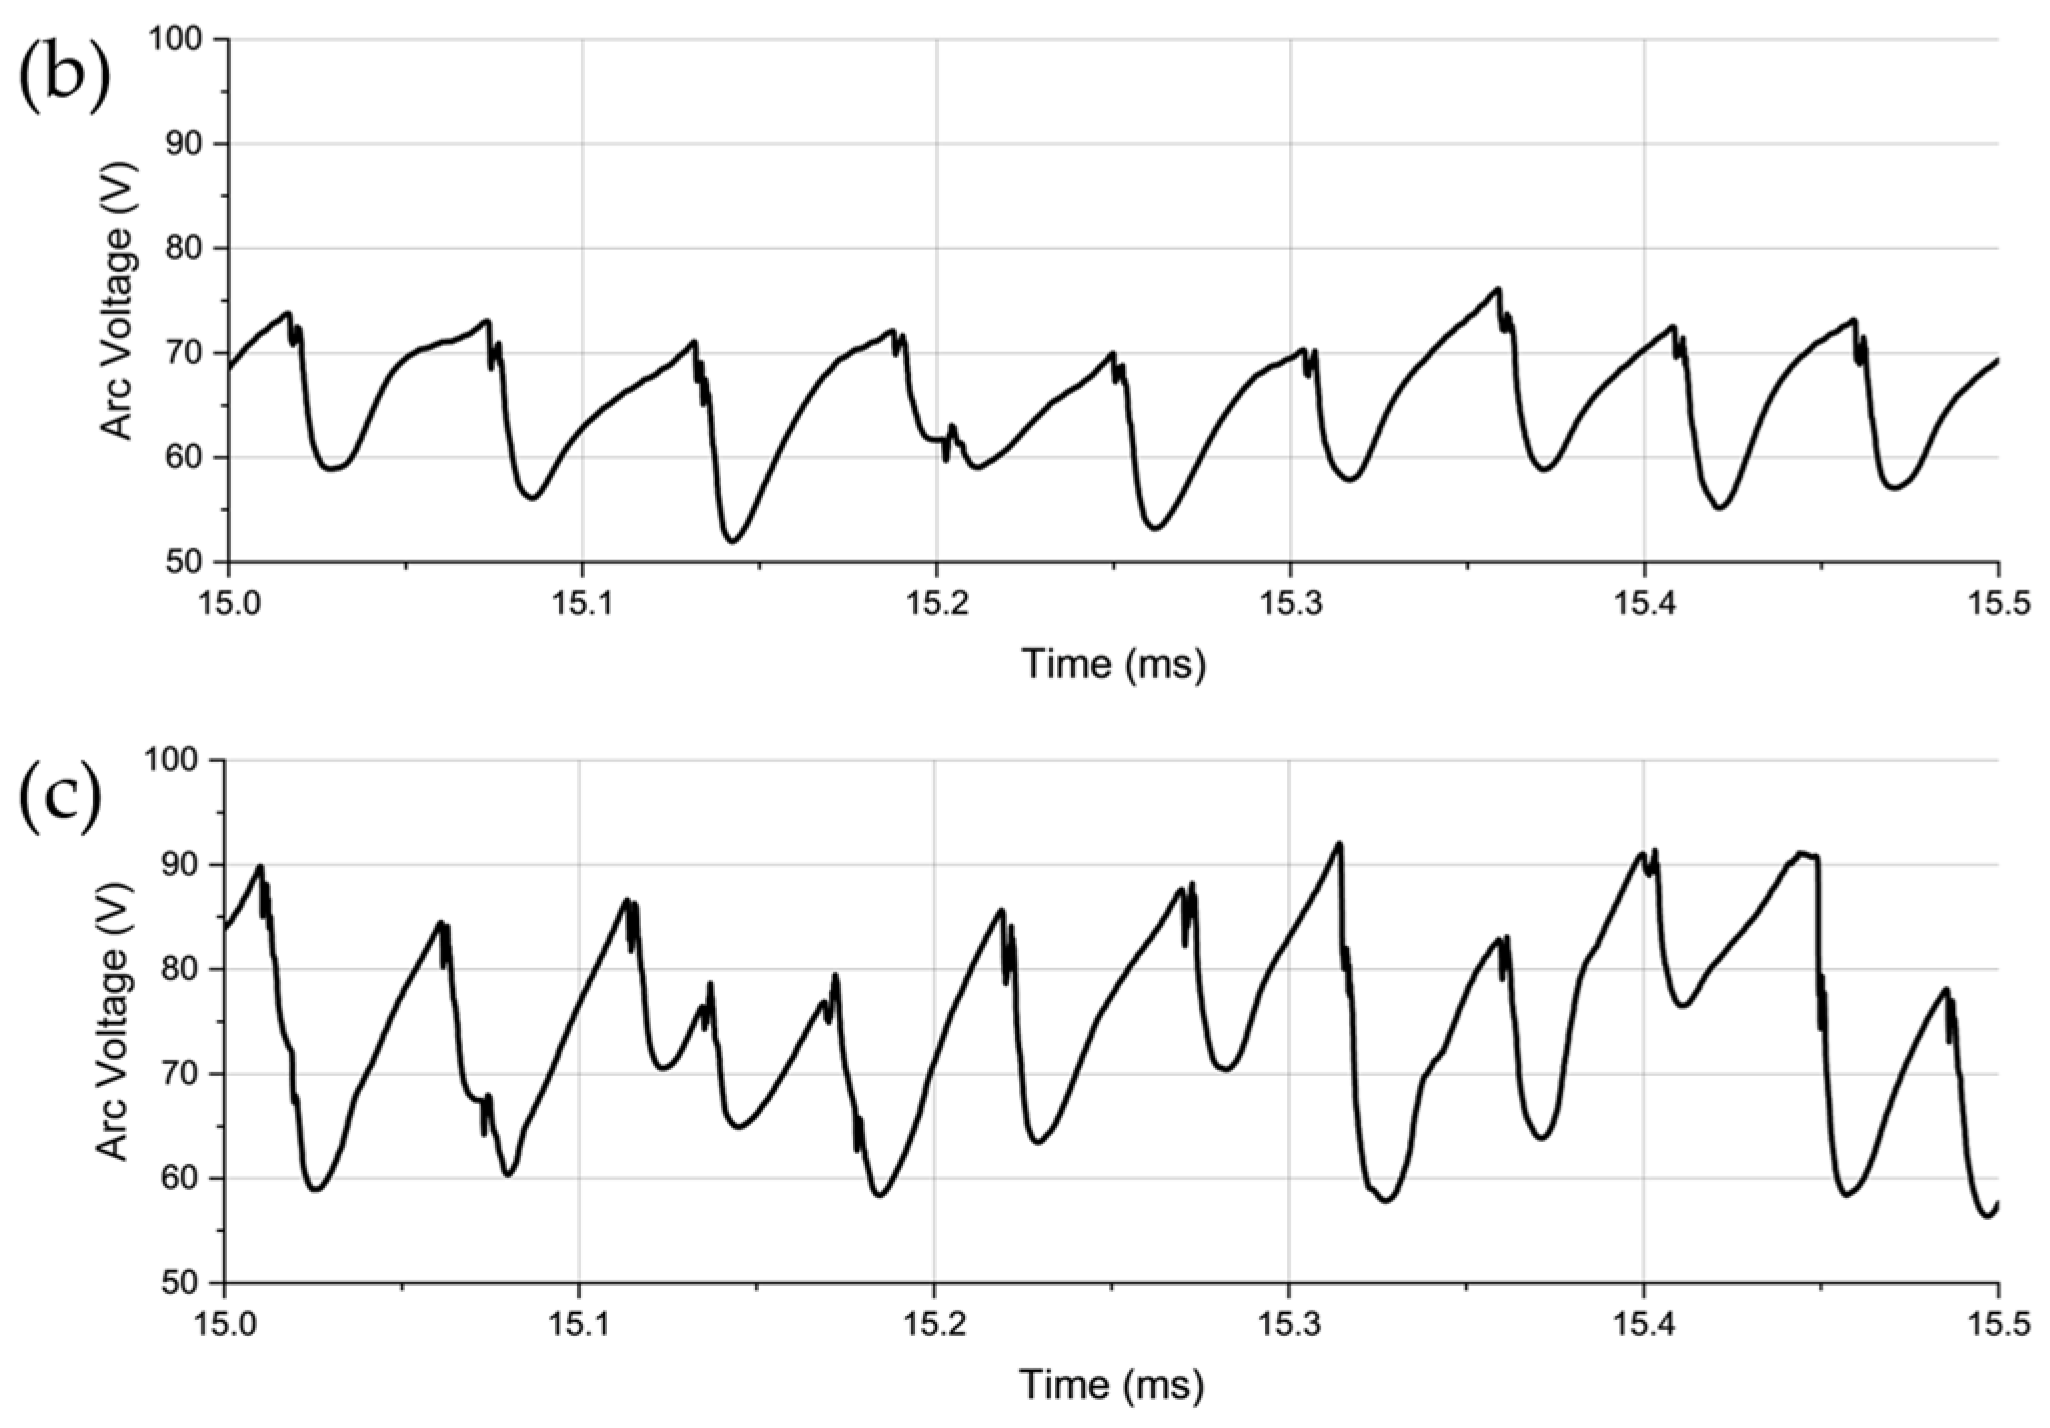
  • Arc Voltage and Instability:
The addition of nitrogen sharply increased both the average and fluctuation ranges of the torch voltage. The restrike period decreased as N2 flow increased, indicating more frequent arc re-ignitions. This rise in voltage and the accompanying instability originated from the thermal pinch effects and the longer arc length produced by nitrogen.
2.
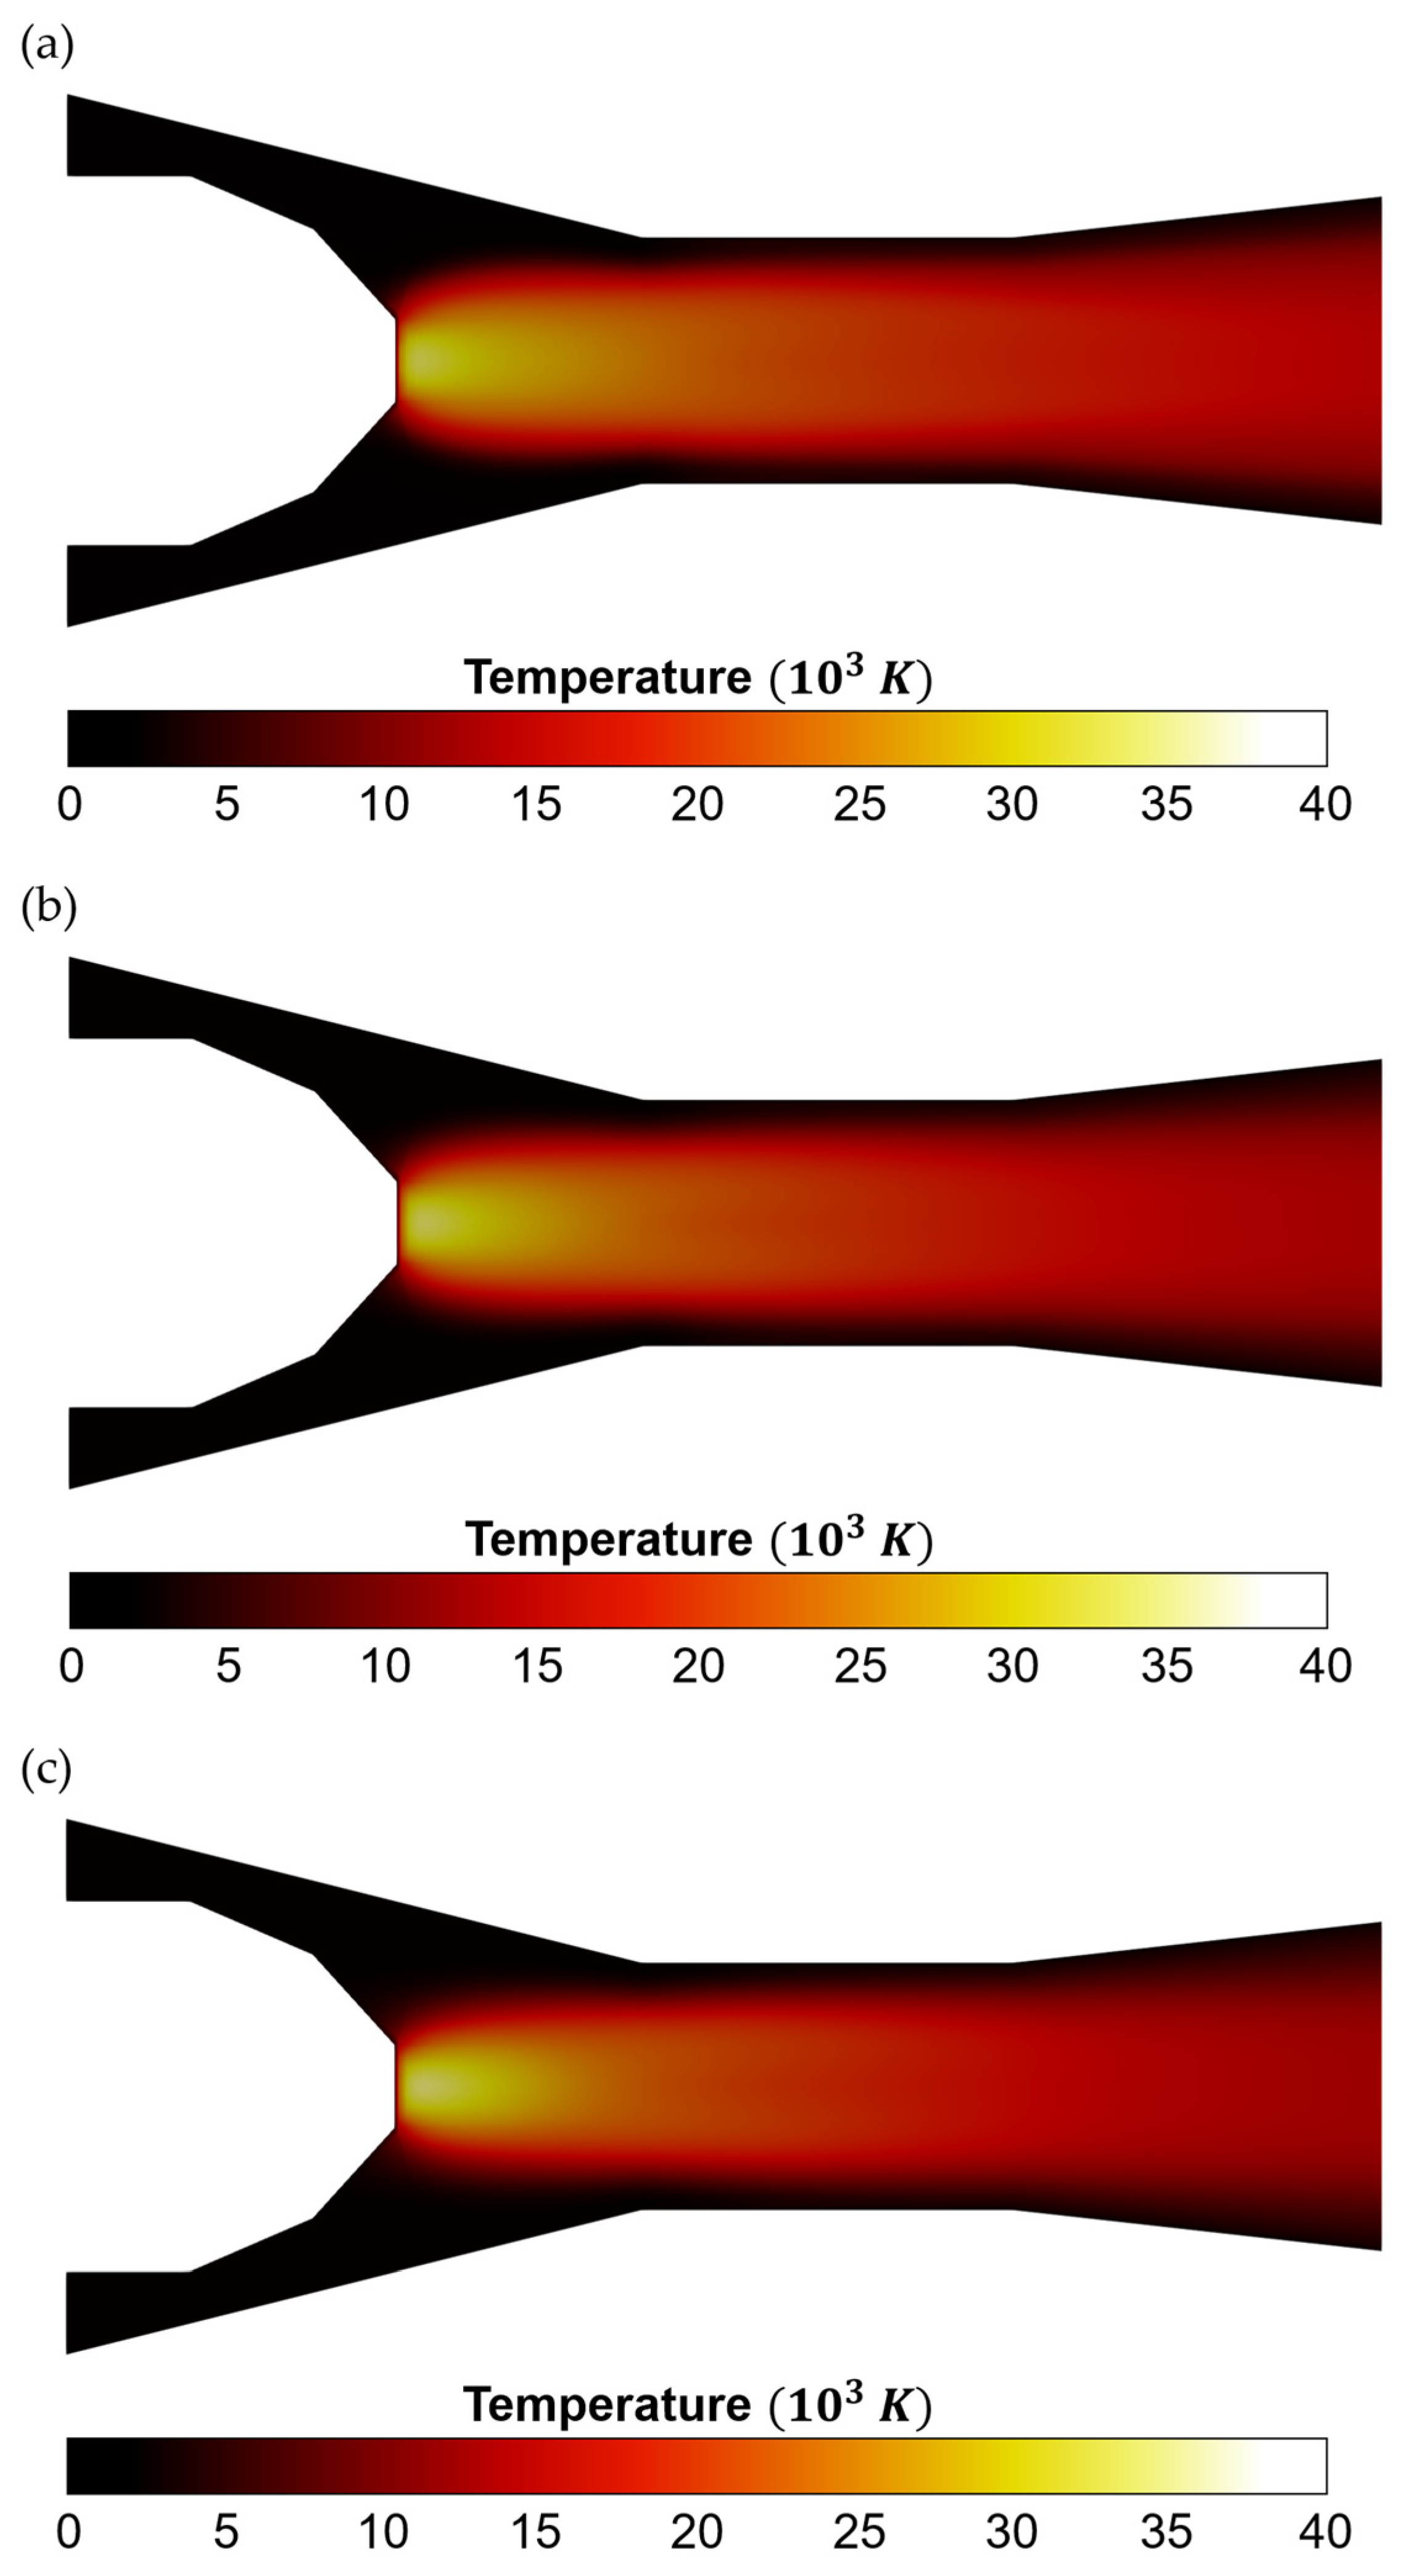
Temperature Distribution and Plasma Properties:
A strong arc constriction near the cathode tip led to higher local temperatures. Conversely, the plasma cooled more rapidly downstream, reducing the outlet temperature. The higher thermal conductivity, heat capacity, and radiative losses of nitrogen collectively enhance heat diffusion.
3.
Velocity and Mach Number:
Although the centerline velocity at the torch exit did not show a strict monotonic trend, an overall tendency existed toward a higher off-center velocity as N2 flow increased. The Mach number increased significantly because nitrogen lowered the local speed of sound, making the flow more effective than that under sonic conditions.
4.
Efficiency Trade-Offs:
Elevated voltage requirements led to higher input power but did not proportionally increase the enthalpy delivered to the outlet. Consequently, the torch efficiency decreased with the increasing N2 fraction, and a greater power draw accelerated electrode wear. Although a higher arc voltage and better heat transfer could help melt the particles more effectively, the increased velocity and shorter in-flight time may affect the coating thickness and adhesion.
Collectively, these results emphasize that the ternary Ar–H2–N2 gas composition exerts strong control over arc behavior, temperature fields, and flow characteristics in plasma spray torches. Careful tuning of the nitrogen content could capitalize on the increased heating capacity while minimizing inefficiencies and wear, laying the groundwork for future studies on torch design and particle–plasma interactions.

Author Contributions

Conceptualization, B.J., A.B.M. and H.P.; Methodology, B.J. and Y.P.; Software, A.B.M. and H.P.; Validation, Y.-j.K. and A.B.M.; Formal analysis, Y.W.Y.; Investigation, H.K., D.H.K., Y.P. and Y.-j.K.; Writing—original draft, B.J. and H.P.; Writing—review & editing, H.K., Y.W.Y., D.H.K., A.B.M. and H.P.; Funding acquisition, H.P. All authors have read and agreed to the published version of the manuscript.

Funding

This research was supported by the Fundamental Research Program of the Korea Institute of Materials Science (No. PNKA430).

Data Availability Statement

Data are contained within the article.

Acknowledgments

The authors would like to thank the Korea Institute of Materials Science (KIMS) for supporting this research through the Fundamental Research Program (No. PNKA430). The authors also acknowledge MDPI for providing an APC waiver for the publication of this article.

Conflicts of Interest

The author declares no conflicts of interest.

References

  1. Fauchais, P.L.; Heberlein, J.V.R.; Boulos, M.I. Thermal Spray Fundamentals; Springer: Cham, Switzerland, 2014. [Google Scholar]
  2. Boulos, M.I.; Fauchais, P.L.; Pfender, E. Handbook of Thermal Plasmas. 2023. Available online: https://link.springer.com/referencework/10.1007/978-3-030-84936-8?page=2#toc (accessed on 26 February 2025).
  3. Murphy, A.B. Computational modelling of thermal plasmas for industry. Rev. Mod. Plasma Phys. 2024, 8, 26. [Google Scholar] [CrossRef]
  4. Murphy, A.B.; Uhrlandt, D. Foundations of High-Pressure Thermal Plasmas. Plasma Sources Sci. Technol. 2018, 27, 063001. [Google Scholar] [CrossRef]
  5. Wen, K.; Liu, X.; Liu, M.; Zhou, K.; Long, H.; Deng, C.; Mao, J.; Yan, X.; Liao, H. Numerical simulation and experimental study of Ar-H2 DC atmospheric plasma spraying. Surf. Coat. Technol. 2019, 371, 312–321. [Google Scholar] [CrossRef]
  6. Dalir, E.; Dolatabadi, A.; Mostaghimi, J. Modeling of Suspension Plasma Spraying Process Including Arc Movement Inside the Torch. J. Therm. Spray Technol. 2019, 28, 1105–1125. [Google Scholar] [CrossRef]
  7. Guo, Z.; Yin, S.; Liao, H.; Gu, S. Three-dimensional simulation of an argon–hydrogen DC non-transferred arc plasma torch. Int. J. Heat Mass Transf. 2015, 80, 644–652. [Google Scholar] [CrossRef]
  8. Kwon, H.; Kang, Y.-j.; Yoo, Y.W.; Kim, D.H.; Park, Y.; Lee, S.; Park, H. Effect of Process-Gas Composition on In-Flight and Deposition Characteristics of Atmospheric Plasma-Sprayed Ni Particles. Met. Mater. Int. 2022, 29, 1825–1840. [Google Scholar] [CrossRef]
  9. Perambadur, J.K.; Rat, V.; Niane, T.N.; Chazelas, C. Simulation of the Axial III Plus Plasma Torch and Its Arc Fluctuations. J. Therm. Spray Technol. 2024, 33, 2526–2547. [Google Scholar] [CrossRef]
  10. Wen, K.; Liu, X.; Zhou, K.; Liu, M.; Zhu, H.; Huang, J.; Zhang, Z.; Huang, R.; Mao, J.; Yan, X.; et al. 3D time-dependent numerical simulation for atmospheric plasma spraying. Surf. Coat. Technol. 2019, 371, 344–354. [Google Scholar] [CrossRef]
  11. Liu, S.H.; Trelles, J.P.; Murphy, A.B.; Li, L.; Zhang, S.L.; Yang, G.J.; Li, C.X.; Li, C.J. Numerical simulation of the flow characteristics inside a novel plasma spray torch. J. Phys. D Appl. Phys. 2019, 52, 335203. [Google Scholar] [CrossRef]
  12. Bobzin, K.; Heinemann, H.; Erck, M.; Warkentin, S.; Mokrov, O.; Sharma, R.; Reisgen, U.; Jasutyn, K. Modeling of arcs with binary gas mixtures in a multi-arc plasma generator. Mater. Werkst. 2024, 56, 77–87. [Google Scholar] [CrossRef]
  13. Zhang, T.; Mariaux, G.; Vardelle, A.; Li, C.J. Numerical simulation of plasma jet characteristics under very low-pressure plasma spray conditions. Coatings 2021, 11, 726. [Google Scholar] [CrossRef]
  14. Ivchenko, D.; Zhang, T.; Mariaux, G.; Vardelle, A.; Goutier, S.; Itina, T.E. On the Validity of Continuum Computational Fluid Dynamics Approach Under Very Low-Pressure Plasma Spray Conditions. J. Therm. Spray Technol. 2018, 27, 3–13. [Google Scholar] [CrossRef]
  15. Liu, S.-H.; Trelles, J.P.; Li, C.-J.; Li, C.-X.; Guo, H.-B. A review and progress of multiphase flows in atmospheric and low pressure plasma spray advanced coating. Mater. Today Phys. 2022, 27, 100832. [Google Scholar] [CrossRef]
  16. Liu, S.H.; Trelles, J.P.; Murphy, A.B.; He, W.T.; Shi, J.; Li, S.; Li, C.J.; Li, C.X.; Guo, H.B. Low-pressure plasma-induced physical vapor deposition of advanced thermal barrier coatings: Microstructures, modelling and mechanisms. Mater. Today Phys. 2021, 21, 100481. [Google Scholar] [CrossRef]
  17. Murphy, A.B. Calculation and application of combined diffusion coefficients in thermal plasmas. Sci. Rep. 2014, 4, 4304. [Google Scholar] [CrossRef]
  18. Zhang, X.N.; Murphy, A.B.; Li, H.P.; Xia, W.D. Combined diffusion coefficients for a mixture of three ionized gases. Plasma Sources Sci. Technol. 2014, 23, 065044. [Google Scholar] [CrossRef]
  19. Park, H.; Trautmann, M.; Tanaka, K.; Tanaka, M.; Murphy, A.B. Mixing of multiple metal vapours into an arc plasma in gas tungsten arc welding of stainless steel. J. Phys. D-Appl. Phys. 2017, 50, 43LT03. [Google Scholar] [CrossRef]
  20. Park, H.; Trautmann, M.; Tanaka, K.; Tanaka, M.; Murphy, A.B. A computational model of gas tungsten arc welding of stainless steel: The importance of considering the different metal vapours simultaneously. J. Phys. D Appl. Phys. 2018, 51, 395202. [Google Scholar] [CrossRef]
  21. Dolmaire, A.; Hartikainen, E.; Goutier, S.; Béchade, E.; Vardelle, M.; Geffroy, P.-M.; Joulia, A. Benefits of Hydrogen in a Segmented-Anode Plasma Torch in Suspension Plasma Spraying. J. Therm. Spray Technol. 2021, 30, 236–250. [Google Scholar] [CrossRef]
  22. Joeris, J.; Tiwari, A.; Brinckmann, S.; Kurze, F.; Guillon, O.; Vaßen, R. Evaluation of major factors influencing the TBC topcoat formation in axial suspension plasma spraying (SPS). Int. J. Appl. Ceram. Technol. 2023, 20, 884–895. [Google Scholar] [CrossRef]
  23. Xiang, J.; Chen, F.F.; Park, H.; Tanaka, K.; Shigeta, M.; Tanaka, M.; Murphy, A.B. Numerical study of the metal vapour transport in tungsten inert-gas welding in argon for stainless steel. Appl. Math. Model. 2020, 79, 713–728. [Google Scholar] [CrossRef]
  24. Baeva, M.; Benilov, M.S.; Zhu, T.; Testrich, H.; Kewitz, T.; Foest, R. Modelling and experimental evidence of the cathode erosion in a plasma spray torch. J. Phys. D Appl. Phys. 2022, 55, 365202. [Google Scholar] [CrossRef]
  25. Saifutdinov, A.I.; Timerkaev, B.A.; Ibragimov, A.R. Numerical Simulation of Temperature Fields in a Direct-Current Plasma Torch. Tech. Phys. Lett. 2018, 44, 164–166. [Google Scholar] [CrossRef]
  26. Zhukovskii, R.; Chazelas, C.; Vardelle, A.; Rat, V.; Distler, B. Effect of Electromagnetic Boundary Conditions on Reliability of Plasma Torch Models. J. Therm. Spray Technol. 2020, 29, 894–907. [Google Scholar] [CrossRef]
  27. Zhukovskii, R.; Chazelas, C.; Rat, V.; Vardelle, A.; Molz, R. Predicted Anode Arc Attachment by LTE (Local Thermodynamic Equilibrium) and 2-T (Two-Temperature) Arc Models in a Cascaded-Anode DC Plasma Spray Torch. J. Therm. Spray Technol. 2022, 31, 28–45. [Google Scholar] [CrossRef]
  28. Zhang, H.; Mauer, G.; Liu, S.; Liu, M.; Jia, Y.; Li, C.; Li, C.; Vaßen, R. Modeling of the Effect of Carrier Gas Injection on the Laminarity of the Plasma Jet Generated by a Cascaded Spray Gun. Coatings 2022, 12, 1416. [Google Scholar] [CrossRef]
  29. Anders, A. Glows, arcs, ohmic discharges: An electrode-centered review on discharge modes and the transitions between them. Appl. Phys. Rev. 2024, 11, 031310. [Google Scholar] [CrossRef]
  30. Tsonev, I.; Boothroyd, J.; Kolev, S.; Bogaerts, A. Simulation of glow and arc discharges in nitrogen: Effects of the cathode emission mechanisms. Plasma Sources Sci. Technol. 2023, 32, 054002. [Google Scholar] [CrossRef]
  31. Benilov, M.S. Multiple solutions in the theory of dc glow discharges and cathodic part of arc discharges. Application of these solutions to the modeling of cathode spots and patterns: A review. Plasma Sources Sci. Technol. 2014, 23, 054019. [Google Scholar] [CrossRef]
  32. Xiong, H.-B.; Zheng, L.-L.; Sampath, S.; Williamson, R.L.; Fincke, J.R. Three-dimensional simulation of plasma spray: Effects of carrier gas flow and particle injection on plasma jet and entrained particle behavior. Int. J. Heat Mass Transf. 2004, 47, 5189–5200. [Google Scholar] [CrossRef]
  33. Martínez-Villegas, I.; Mora-García, A.G.; Ruiz-Luna, H.; McKelliget, J.; Poblano-Salas, C.A.; Muñoz-Saldaña, J.; Trápaga-Martínez, G. Swirling Effects in Atmospheric Plasma Spraying Process: Experiments and Simulation. Coatings 2020, 10, 388. [Google Scholar] [CrossRef]
  34. Weller, H.G.; Tabor, G.; Jasak, H.; Fureby, C. A tensorial approach to computational continuum mechanics using object-oriented techniques. Comput. Phys. 1998, 12, 620–631. [Google Scholar] [CrossRef]
  35. Trelles, J.P.; Modirkhazeni, S.M. Variational multiscale method for nonequilibrium plasma flows. Comput. Methods Appl. Mech. Eng. 2014, 282, 87–131. [Google Scholar] [CrossRef]
  36. Bobzin, K.; Heinemann, H.; Dokhanchi, A. Numerical and Experimental Analysis of a Solid Shroud in Multi-arc Plasma Spraying. J. Therm. Spray Technol. 2024, 33, 1191–1204. [Google Scholar] [CrossRef]
  37. Huang, R.; Fukanuma, H.; Uesugi, Y.; Tanaka, Y. Simulation of Arc Root Fluctuation in a DC Non-Transferred Plasma Torch with Three Dimensional Modeling. J. Therm. Spray Technol. 2012, 21, 636–643. [Google Scholar] [CrossRef]
  38. Lowke, J.J.; Tanaka, M. ‘LTE-diffusion approximation’ for arc calculations. J. Phys. D Appl. Phys. 2006, 39, 3634. [Google Scholar] [CrossRef]
  39. Murphy, A.B. Transport coefficients of plasmas in mixtures of nitrogen and hydrogen. Chem. Phys. 2012, 398, 64–72. [Google Scholar] [CrossRef]
  40. Murphy, A.B.; Arundelli, C.J. Transport coefficients of argon, nitrogen, oxygen, argon-nitrogen, and argon-oxygen plasmas. Plasma Chem. Plasma Process. 1994, 14, 451–490. [Google Scholar] [CrossRef]
  41. Cram, L.E. Statistical evaluation of radiative power losses from thermal plasmas due to spectral lines. J. Phys. D Appl. Phys. 1985, 18, 401–411. [Google Scholar] [CrossRef]
  42. Cressault, Y.; Rouffet, M.E.; Gleizes, A.; Meillot, E. Net emission of Ar–H 2 –He thermal plasmas at atmospheric pressure. J. Phys. D Appl. Phys. 2010, 43, 335204. [Google Scholar] [CrossRef]
  43. Ernst, K.A.; Kopainsky, J.G.; Maecker, H.H. The Energy Transport, Including Emission and Absorption, in N2-Arcs of Different Radii. IEEE Trans. Plasma Sci. 1973, 1, 3–16. [Google Scholar] [CrossRef]
  44. Murphy, A.B.; Tanaka, M.; Tashiro, S.; Sato, T.; Lowke, J.J. A computational investigation of the effectiveness of different shielding gas mixtures for arc welding. J. Phys. D Appl. Phys. 2009, 42, 115205. [Google Scholar] [CrossRef]
  45. Coudert, J.F.; Planche, M.P.; Fauchais, P. Characterization of d.c. plasma torch voltage fluctuations. Plasma Chem. Plasma Process. 1995, 16, S211–S227. [Google Scholar] [CrossRef]
  46. Trelles, J.P.; Heberlein, J.V.R.; Pfender, E. Non-equilibrium modelling of arc plasma torches. J. Phys. D Appl. Phys. 2007, 40, 5937. [Google Scholar] [CrossRef]
Figure 1. Numerical and schematic representations of the Metco 9MB plasma torch. (a) The three-dimensional computational domain used in the simulation, including key components such as the cathode, anode, inlet, and outlet regions. (b) The cross-sectional schematic of the plasma torch, illustrating the gas flow, and structural sections.
Processes 13 01155 g001
Figure 2. Thermodynamic and transport properties of plasma gas mixtures by volume at 1 atm: (a) molar mass; (b) specific heat; (c) thermal conductivity; (d) viscosity; (e) electrical conductivity; and (f) net emission coefficient.
Processes 13 01155 g002
Figure 3. Radial temperature distributions with different mesh resolutions.
Processes 13 01155 g003
Figure 4. Comparison of measured and predicted voltages with various H2 gas flow rates.
Processes 13 01155 g004
Figure 5. Variation in arc voltage with N2 flow rate.
Processes 13 01155 g005
Figure 6. Current density and arc length variation during the restrike process for different N2 flow rates: (a) arc length of 9.72 mm with Ar:H2:N2 = 96:6:0 SCFH; (b) arc length of 10.3 mm with Ar:H2:N2 = 84:6:12 SCFH; and (c) arc length of 11.26 mm with Ar:H2:N2 = 72:6:24 SCFH.
Processes 13 01155 g006
Figure 7. Axial distribution of current density with various N2 flow rates.
Processes 13 01155 g007
Figure 8. Time-dependent arc voltage variation during the restrike process for various N2 flow rates: (a) Ar: H2: N2 = 96: 6: 0 SCFH; (b) Ar: H2: N2 = 84: 6: 12 SCFH; and (c) Ar: H2: N2 = 72: 6: 24 SCFH.
Processes 13 01155 g008aProcesses 13 01155 g008b
Figure 9. Temperature distributions within the plasma torch with various N2 flow rates: (a) Ar: H2: N2 = 96: 6: 0 SCFH; (b) Ar: H2: N2 = 84: 6: 12 SCFH; and (c) Ar: H2: N2 = 72: 6: 24 SCFH.
Processes 13 01155 g009
Figure 10. Temperature and net emission coefficient profiles in a Metco 9MB Plasma Torch. (a) Temperature distribution along the axial distance from the cathode tip for different gas compositions (Ar–H2–N2 mixtures). (b) Net emission coefficient (NEC) variation as a function of the distance from the cathode tip for the same gas compositions.
Processes 13 01155 g010
Figure 11. Radial profiles at the torch outlet for various N2 flow rates: (a) radial temperature distribution at the torch nozzle; (b) radial velocity profiles at the nozzle; and (c) radial Mach number profiles.
Processes 13 01155 g011
Table 1. Gas flow conditions (Ar, H2, N2) for each case.
CaseArH2N2
Volume Flow Rate (SCFH)Volume Flow Rate (SCFH)Volume Flow Rate (SCFH)
19660
284612
372624
Table 2. Boundary conditions applied in the numerical simulations.
BoundaryPressureVelocityTemperatureElectric
Potential
Magnetic
Potential
Inlet P n = 0 Flow rate T i n φ n = 0 0
Cathode P n = 0 0 T ( r ) J ( r ) A n = 0
Anode P n = 0 0 Q = h w ( T T w ) 0 A n = 0
OutletAmbient P V n = 0 T n = 0 φ n = 0 A n = 0
Table 3. Input/output energy, efficiency, temperature, and velocity for each simulation.
CaseInput
(kW)
Output
(kW)
Efficiency
(%)
Temperature
(K)
Velocity
(m/s)
137.79723.62662.517850754
243.87523.77654.197530763
352.27626.54850.787390818
Disclaimer/Publisher’s Note: The statements, opinions and data contained in all publications are solely those of the individual author(s) and contributor(s) and not of MDPI and/or the editor(s). MDPI and/or the editor(s) disclaim responsibility for any injury to people or property resulting from any ideas, methods, instructions or products referred to in the content.

