Article

Energy Recuperation in a Spiral Reactor for Lean Methane Combustion: Heat Transfer Efficiency and Design Guidelines

by
Joseph P. Mmbaga
1,
Robert E. Hayes
1,*,
Joanna Profic-Paczkowska
2,
Roman Jędrzejczyk
3,4,
Damian K. Chlebda
2,3,
Jacek Dańczak
3 and
Robert Hildebrandt
5
1
Department of Chemical and Materials Engineering, University of Alberta, Edmonton, AB T6G 2G6, Canada
2
Faculty of Chemistry, Jagiellonian University in Kraków, Gronostajowa 2, 30-387 Kraków, Poland
3
CTiPT Center for Technology Transfer and Promotion, Katowice Sp. z.o.o., ul. Armii Krajowej 44, 40-698 Katowice, Poland
4
Małopolska Centre of Biotechnology, Jagiellonian University in Kraków, Gronostajowa 7A, 30-387 Kraków, Poland
5
Central Mining Institute National Research Institute, Experimental Mine Barbara, Podleska 72, 43-190 Mikołów, Poland
*
Author to whom correspondence should be addressed.
Processes 2025, 13(4), 1168; https://doi.org/10.3390/pr13041168
Submission received: 10 March 2025 / Revised: 1 April 2025 / Accepted: 10 April 2025 / Published: 12 April 2025
(This article belongs to the Section Chemical Processes and Systems)

Abstract

:
Fugitive methane emissions contained in the ventilation air (VAM) from underground coal mines make a significant contribution to the global methane emissions. These methane emissions have a high global warming potential (GWP) and should be mitigated to combat climate change. This study reports on a novel integrated recuperator reactor concept designed to mitigate these low-concentration methane streams using catalytic combustion. The paper analyzes the heat recovery aspects of the novel design and illustrates a computer-aided design approach to system development. Both computational and experimental methods were used in the investigation. The double-spiral counterflow design is shown to be able to eliminate methane from the flow stream with the feed at room temperature. A methodology is illustrated that can be used to determine the operating limits of the proposed recuperative reactor system. This system is suitable for use inside a mine.

1. Introduction

The ongoing change in the world’s climate has been attributed by many to be a result of the presence in the atmosphere of the so-called greenhouse gases (GHGs), of which the two largest contributors are carbon dioxide and methane. Whilst methane is less abundant in the atmosphere than carbon dioxide, it has a much higher global warming potential (GWP). Depending on the time period, methane has a GWP of between 25 and 30 times that of carbon dioxide (100-year time scale) or about 80 times on a 20-year time scale [1]. Furthermore, because methane has a shorter life span in the atmosphere than carbon dioxide, its mitigation offers the promise of significant GWP mitigation over the shorter term. This latter observation is widely recognized, and has resulted in the Global Methane Pledge, under which many countries have agreed to a significant reduction in methane emissions [2].
The sources of methane emissions are many and varied. Whilst a significant amount of methane emissions can be defined as naturally occurring, the remainder are a result of human activity. There is a lot of extant information that details the quantities of methane that are produced from different emission sources, and recent information is given in reference [3]. Whilst these numbers should be treated with caution, because of the high degree of uncertainty in their accuracy, there is no doubt that the fossil fuel industries (coal, oil and natural gas) produce copious amounts of fugitive methane emissions, either in the production or the consumption phases, and are considered to be the second highest human-caused emission source [3,4].
Underground coal mining faces a unique challenge in managing methane emissions, which is crucial for both worker safety and environmental protection. Methane occurs naturally in coal seams. It presents a significant safety risk to miners due to its explosive properties when present in air at concentrations between 5 and 15%. During coal extraction, methane is released into the mine workings, necessitating robust ventilation systems to introduce fresh air and expel methane and other gases, thus maintaining a safe working environment. This diluted methane in the ventilation air, referred to as Ventilation Air Methane (VAM), represents the largest source of methane emissions from most underground coal mines [5,6,7]. These systems dilute the methane concentration to well below the lower explosive limit, typically maintaining levels under 1% and often below 0.5% [5]. However, due to the substantial volume of air circulated through these ventilation systems, the total quantity of methane released into the atmosphere is very large.
As noted, VAM typically contains highly dilute concentrations of methane, usually less than 1% [5]. This low concentration creates a significant challenge for utilization of mitigation technologies. Furthermore, the methane content in VAM can fluctuate substantially over time, influenced by factors such as coal production cycles and contributions from sealed areas during changes in barometric pressure [7].
The removal of methane by conversion to carbon dioxide offers the possibility of a substantial reduction in GWP. Assuming that the global warming potential of methane is about 25 times that of carbon dioxide, the combustion of 1 tonne of methane yields 2.75 tonnes of carbon dioxide, thus giving a net reduction in GWP of 87%.
Emission streams with low methane concentration and low temperature are not easily destroyed using homogeneous (thermal) combustion, and using a catalyst is advantageous. Catalytic combustion is a flameless combustion that has received considerable attention over the last few decades, although it has been reported on for over one hundred years [8,9,10]. The key advantages of catalytic combustion compared to conventional combustion are the elimination of the standard flammability limits and the ability to combust the reactants at a lower temperature.
Many catalysts have been used for hydrocarbon combustion in general, and for methane oxidation in particular [11,12]. Several metals have been reported, both non-noble (or earth common) as well as metals from the platinum group metals (PGMs), especially platinum and palladium. Earth common metals obviously lead to a lower-cost catalyst, but the reactor size tends to be larger because of their relatively low activity compared with the PGM catalysts. A good review of the use of PGM in methane combustion catalysts can be found in several references [13,14,15,16,17,18,19].
It is often desired that the catalytic reactor operates adiabatically and has autogenous operation; that is, the energy generated by the combustion reaction will maintain the reactor at a sufficiently high temperature to obtain essentially complete conversion. For the low-temperature VAM stream, autogenous operation cannot be realized without pre-heating the feed to the ignition threshold. There are many options for autogenous operation and a good review can be found in [20]. That review discusses reactor concepts such as the reverse flow reactor, as well as counterflow designs. Examples relating to methane combustion can be found in [4].
Conceptually, the thermal energy generated in the combustion reaction can be used to pre-heat the feed stream. Ideally, this would be performed in an integrated unit. Heat-integrated concepts, also referred to as thermal management systems, typically utilize a form of combined reactor heat exchanger, where thermal energy from the effluent gas is transferred to the influent. A comprehensive overview of various combined reactor heat exchanger designs is available in the literature [21]. One notable design, first proposed in the 1930s and subsequently refined by many researchers, is the catalytic flow reversal reactor (CFRR), which has been studied for the combustion of low concentration methane streams with large scale flows [22,23,24]. The CFRR uses a heat trap effect to maintain a high reactor temperature. These reactors have been employed at the large scale for the destruction of VAM, notably in China. The reactor is usually situated on the surface, not inside the mine shaft. Smaller-scale units have also been used for applications such as exhaust gas treatment from natural gas-fuelled vehicles [25,26]. A drawback of the CFRR is the number of moving parts, which might be a drawback in an in situ mine environment, especially if explosion-proof operation is required. Therefore, other concepts can be considered.
Other types of integrated reactor and heat exchanger concepts have been presented in the literature [27,28]. These designs can be broadly categorized into two groups. The first group features separate reactor and heat exchanger units, allowing for the independent control of heat transfer parameters and potentially simpler construction, conceptually illustrated in Figure 1. In the second group, reaction and heat exchange occur within the same physical unit, enabling continuous heat exchange within the reactor. One possible system is also illustrated in Figure 1. While this second approach may lead to more compact designs, the available heat transfer area becomes more dependent on the internal configuration. Additionally, material selection for reactor construction becomes a critical factor. Consequently, careful consideration of the design is essential to optimize performance and efficiency.
The objective of this paper is to illustrate an autothermal reactor concept that is suitable for an in situ deployment in an underground coal mine for the destruction of VAM using catalytic combustion. The crucial factor in an integrated reactor concept is the magnitude and efficiency of the heat transfer, and that aspect is the focus of this work. Because the design and testing, that is, prototyping, of even a relatively small-scale unit is a complex and time-consuming process that has a significant cost, we show how a computer-aided design process (CAPD) that makes use of advance computational fluid dynamics (CFD) can be effectively used for preliminary design. Thus, we present a detailed workflow based on computer modelling and experimental prototyping to showcase this VAM reactor concept.

2. Materials and Methods

2.1. A Description of the Catalyst Used as a Basis for This Study

The goal of this work was to propose a system that could be progressed rapidly to a working prototype at full scale. With this objective in mind, a commercial methane oxidation catalyst was selected. The detailed kinetic analysis, water resistance and deactivation performance of this catalyst have been described elsewhere [18]. The properties of the catalyst, which is available in the form of a washcoated Cordierite monolith honeycomb, are provided in Table 1.
The first step in the rational design of a potential catalytic combustion system must be an analysis of the catalyst to be employed, which can then be used to determine the operating window. It is essential that the catalyst activity is quantified through the development of an appropriate rate equation, for only thus can a computational model for the reactor be constructed. Referring to [18], the following rate expression was obtained. The catalyst activity was measured for the fresh catalyst, as well as after several cycles of hydrothermal ageing. The reader should refer to [18] for details. For dry feed (no water present) on the fresh catalyst, the rate expression based on the total monolith volume was
r CH 4 = k C CH 4 1 + K C H 2 O = 5.151 × 10 8 exp 80,800 R g T C CH 4 1 + 0.823 exp 21,290 R g T C H 2 O mol m 3 s
After three cycles of hydrothermal ageing [18], the activity for dry feed had decreased and the pre-exponential factor was reduced to a value of 2.012 × 10⁸ s−1.
Note that, for illustration purposes, we only discuss in this paper the case of the dry methane feed for two levels of catalyst activity. For wet feed conditions, or for a different catalyst, the design methodology is the same, and the appropriate rate equation would be used.

2.2. The Basic Design Concept for the Recuperative Systems: Factors Influencing the Design

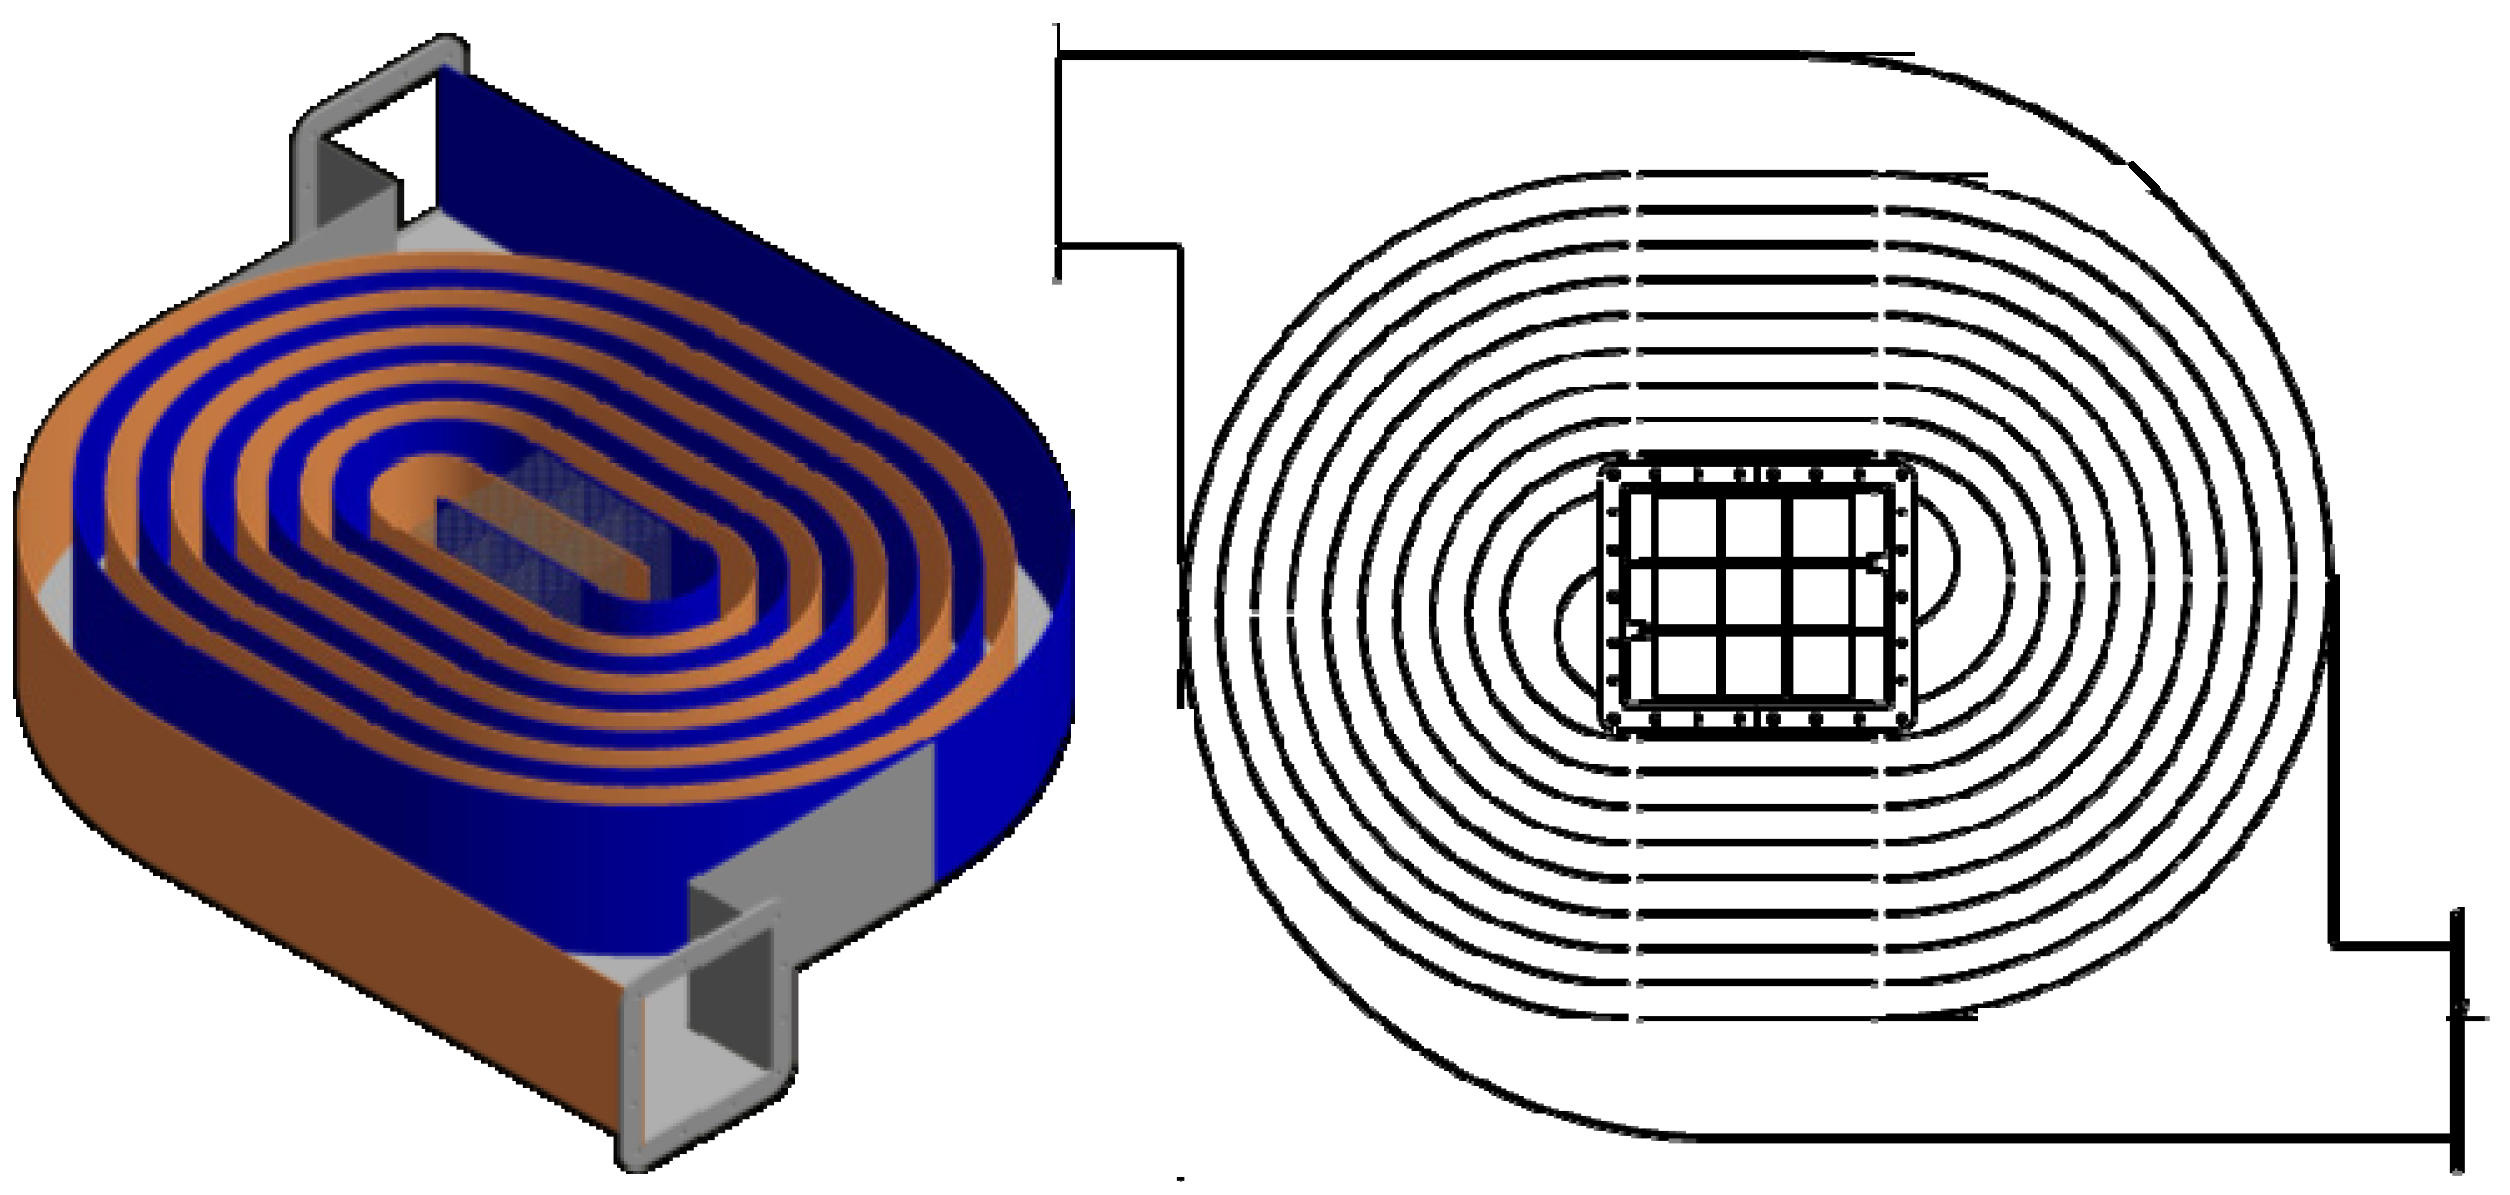
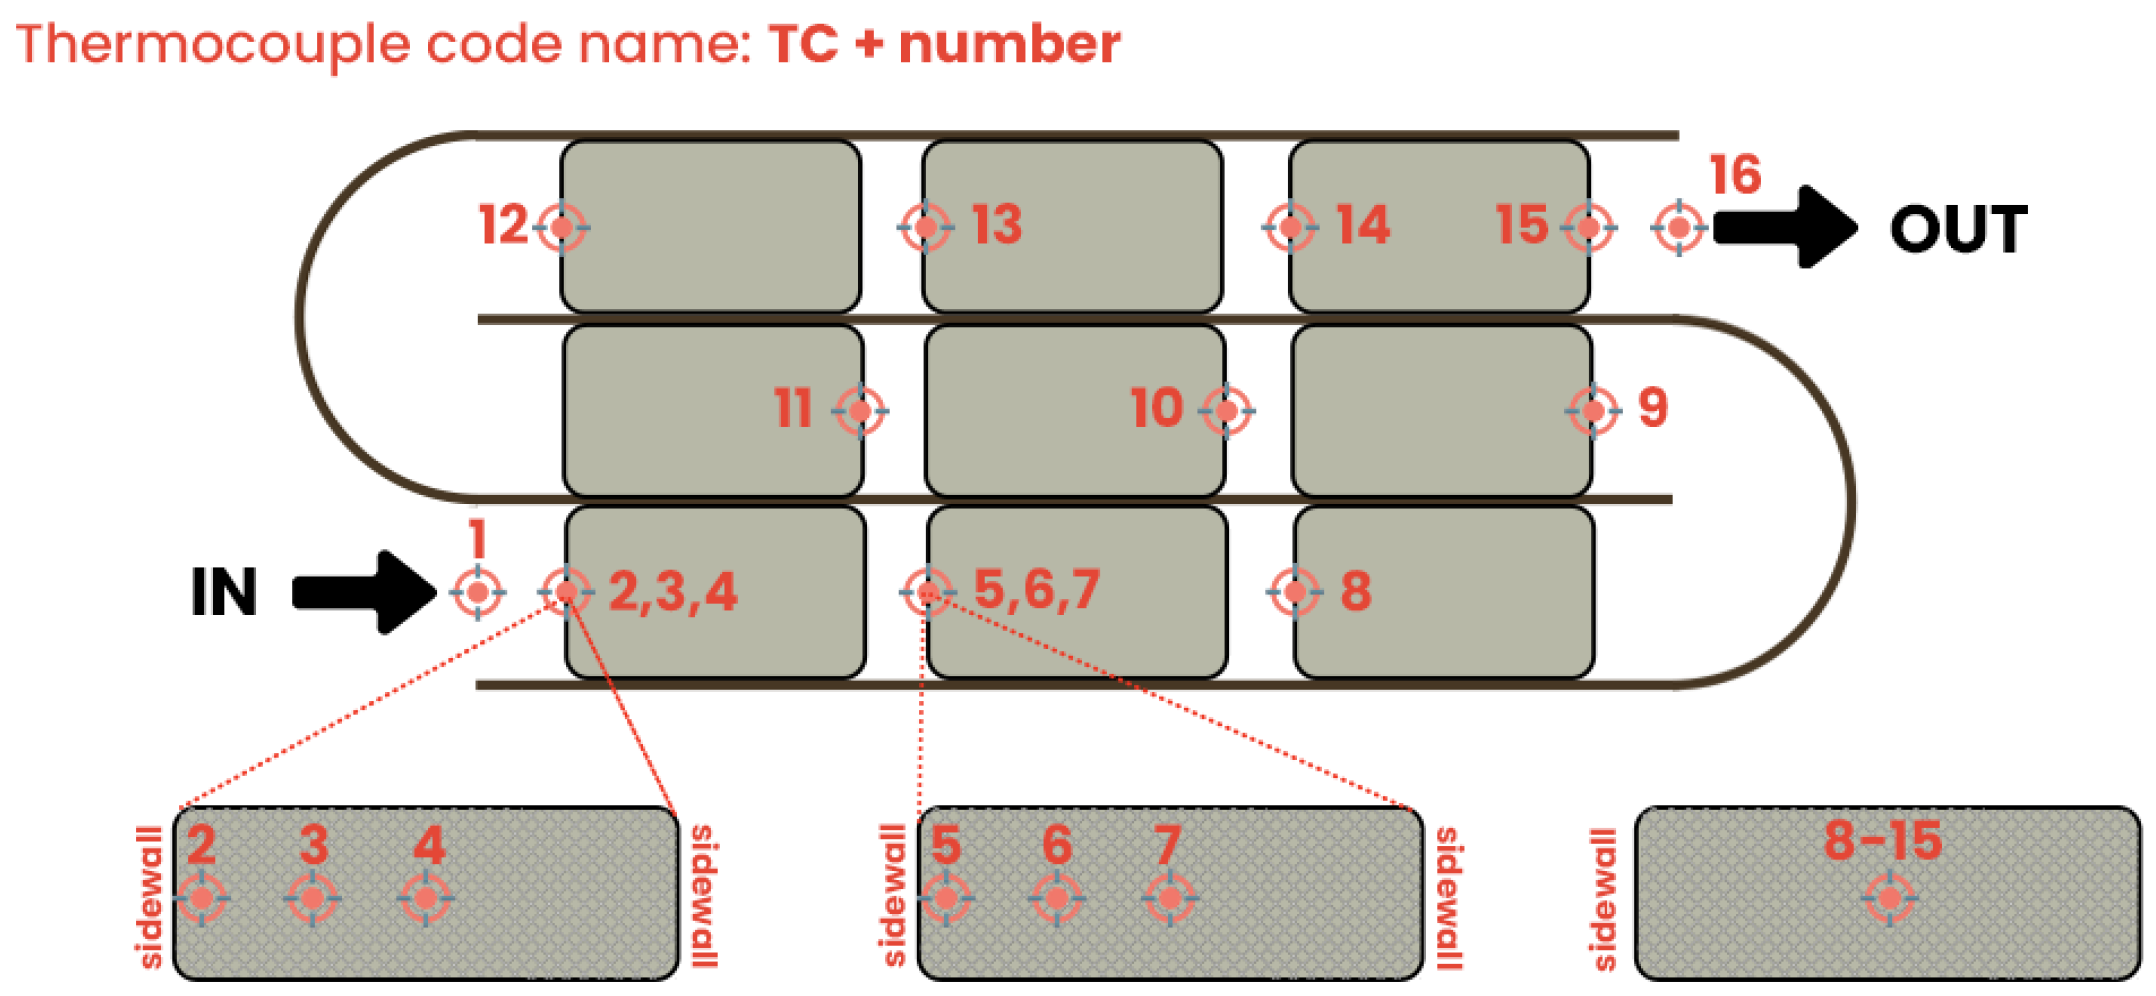
In previous papers we have published numerous works on the modelling of recuperative types of reactors for methane combustion with different configurations [22,23,24,25,26,29,30]. Based on our experience and some preliminary investigation, the design shown in Figure 2 was proposed. Figure 3 shows the details of the prototype that was constructed. The unit consists of a central block that contains up to three channels of monolith catalyst blocks, each row being designed for a catalyst length of 150 mm. The monolith bricks were supplied by the manufacturer as bricks of 50 mm length. The height of the catalyst channels was 50 mm, and the unit had a width of 150 mm. The central catalyst core is surrounded by two spiral-shaped “snails”, through which the feed and the effluent flow in counter-current directions, thus forming the recuperative heat exchanger. The snails were constructed from carbon steel. The internal wall spacing of the snails was 25 mm. The catalyst section consisted of nine catalyst bricks, arranged as shown in Figure 4. Sixteen thermocouples were placed in the catalyst section, the locations of which are also shown in Figure 4. Thermocouples 1 and 16 were placed in the gas stream approximately 1 cm before (TC 1) and 1 cm after (TC 16) the first and last catalyst bricks, respectively. The remainder of the thermocouples were inserted into the monolith channels to measure the catalyst temperature. Thermocouples 4, 7 and 8 to 15 were placed in the centre of the monolith bricks, as shown. Thermocouples 2, 3, 5 and 6 were placed in the first two bricks at various distances from the wall to measure the temperature distribution within the monolith sections. Two further thermocouples measured the temperature at the inlet to the reactor system (after the pre-heaters) and at the effluent of the reactor system.

2.3. Experimental Methodology

The reactor/recuperator unit was installed in a computer-controlled flow system. The system consisted of a blower and associated flow measuring device to control the flow rate. Two electric pre-heaters were used to initiate the reactor operation. They were used to heat the feed stream, which in turn heated the catalyst to the ignition temperature. They were also used as required to maintain operation at low methane concentrations. The heaters were switched off once autogenous operation was attained. The pre-heated feed was fed into the reactor inlet, where it passed through the recuperation section prior to entering the catalyst module. The computer-controlled system was monitored via the control panel. In case emergency shutdown was required, the system could be flooded with liquid nitrogen. The apparatus is shown schematically in Supplementary Information as Figure S1.
Experiments were performed to test various aspects of the systems, and each experiment is described in detail in either the Results section or the Supplementary Information. The general methodology was to set the air feed flow rate to the desired value without any added methane. The pre-heaters were then switched on and adjusted to give a temperature at the inlet to the catalyst section in the range of 575 to 600 K. Once a steady-state temperature profile was attained, the flow of methane was started at the desired concentration. Steady state was defined as the point where the change in any thermocouple reading was less than 5 K over one hour. Changes in the desired variable were made in a stepwise manner. After each step, the system was allowed to reach steady state. The inlet temperature to the unit was adjusted by changing the power to the pre-heaters. Other variables studied were the volumetric flow rate and the inlet methane concentration. For each experiment, a set of apparent steady-state points was selected for detailed modelling and analysis.

2.4. Computational Model

A detailed computational model was constructed for the experimental unit described in Section 2.2. The focus of the current paper is the heat transfer aspects of the device, and therefore the computational model consisted of the conservation equations for momentum and energy. For the open fluid sections, the equations are the standard ones for a fluid. The flow in these sections was modelled using a Reynolds-Averaged Navier–Stokes (RANS) turbulence model equation.
The monolith sections were modelled as a continuous porous medium. A pseudo-homogeneous model was selected, in which the fluid and solid temperatures are the same, and a Volume-Averaged Navier–Stokes (VANS) equation was used in these sections. In the VANS equation, the porous inertia was included by introducing a source term into the Navier–Stokes equations. We used a Darcy-type term to give the following equation [10]:
· ρ f v S v S = p + · τ μ K v S
The monolith permeability, K, was estimated from the Hagen–Poiseuille equation assuming circular channels (reasonable for washcoated square channels) [31]:
K = ϕ D H 2 32
The monolith substrate in the reacting sections was a Cordierite 400/6.5 CPSI (400 cells per square inch with 6.5 mil thick walls). The channels were covered with a catalytic washcoat, which gave the following disposition of fluid, washcoat and Cordierite:
λ = 0.243 volume   fraction   of   Cordierite ξ = 0.12 volume   fraction   of   washcoat ϕ = 1 λ ξ = 0.637 volume   fraction   of   fluid
The channel hydraulic diameter was 1.014 mm, to give the axial permeability as 2.04 × 10⁻⁸ m2. The permeability in the direction transverse to the flow was set to 0.1% of the value in the flow direction, to eliminate the possibility of transverse flow. The gas density is computed using the ideal gas law and the viscosity from the kinetic theory of gases.
μ = 2.67 × 10 6 M W T σ 2 Ω μ
The characteristic length, σ, is 3.711, and Ωμ depends on the reduced temperature [32,33]. The gas composition was methane in air.
The steady-state energy balance in the presence of a chemical reaction is as follows:
k T ρ f C P , f v s T + ( Δ H R ) r CH 4 = 0
The reaction source term applies in the reaction section. For the study of the heat transfer characteristics, we did not impose the rate equation, but rather specified thermal energy source terms in the catalyst bricks that generated thermal energy that corresponded to 100% conversion of the inlet methane at the designated flow rate, as shown below:
k T ρ f C P , f v s T + q ˙ = 0
The source terms were imposed uniformly over a catalyst length of 150 mm. This volumetric generation rate was calculated based on the inlet flow rate and methane mole fraction. The total amount of thermal energy released, assuming 100% conversion, is as follows:
q gen = F CH 4 × Δ H R
The molar flow rate of methane, which depends on the inlet total volumetric flow rate, the total molar concentration and the mole fraction of methane, is calculated as follows:
F CH 4 = Q × C T × Y CH 4
The inlet temperature and pressure were taken as 300 K and 101.325 kPa, respectively. The total inlet concentration (molar density) of the feed is therefore
C T = P R g T = 101325 8.314 300 = 40.62 mol m 3
The volumetric rate of thermal energy generation is therefore given by
q ˙ = q gen V = Q × C T × Y CH 4 × Δ H R V
where the enthalpy of reaction in J/mol is given by the following:
Δ H R = 806.9 + 1.586 × 10 2 T 8.485 × 10 6 T 2 3.963 × 10 9 T 3 + 2.16 × 10 12 T 4
The thermal conductivity depends on the domain. For the open sections it is the thermal conductivity of the fluid, which was calculated using the kinetic theory of gases [32].
k f = 15 4 R g M W μ 4 15 C P M W R g + 1 3
For the monolith reaction sections, the value for the effective axial thermal conductivity is 0.546 W/(m·K) and the transverse value is 0.342 W/(m·K).
The temperature-dependent heat capacity of the gas is calculated using
C P = a 0 + a 1 T + a 2 T 2 + a 3 T 3 + a 4 T 4 + a 5 T 5 + a 6 T 6 + a 7 T 7
These equations and constant values are provided in the used computational software.
The fluid boundary conditions were zero slip at all solid/fluid interfaces, with a pressure outlet and a fixed uniform velocity at the inlet. The temperature conditions were adiabatic (zero flux) for the outlet, a fixed temperature for the inlet and continuity of flux across internal boundaries.
The computational model was solved using ANSYS Fluent version 2020 R2.

3. Results and Discussion

3.1. Determining the Catalyst Operating Window

An essential step in the rational design, once the catalytic rate equation is determined, is to determine an operating window for the catalyst. This operating window is typically presented as a function of catalyst volume (or mass), flow rate of feed, inlet methane concentration and the subsequent temperature required at the inlet of the reaction section to achieve complete methane conversion. The flow rate and corresponding catalyst volume can be lumped into a single parameter, called the gas hourly space velocity (GHSV), which is the volumetric flow rate of the gaseous feed, measured at a reference temperature and pressure, divided by the catalyst volume.
The operating characteristics of the catalyst can be explored using a simple one-dimensional plug flow reactor model that was solved using POLYMATH [18]. The objective is to determine a value for the temperature at the entrance of the catalytic section that will result in an essentially 100% conversion for a given GHSV and methane concentration. Table 2 summarizes the catalyst inlet temperature required to give 99.9% methane conversion for both fresh and aged catalysts over a range of GHSV. Results are given for methane concentrations of 0.4, 0.7 and 1.0 mole percent. The GHSV was changed by fixing the catalyst length and changing the inlet velocity. All inlet velocities and hence GHSV are based on a reference temperature of 300 K and a pressure of 1 atm. The data are also presented graphically in Figure 5.
These temperatures should only be used as a guide to system design. Catalyst activity changes with time, and the flow patterns in a real system make the accurate determination of an actual inlet reactor temperature subject to an additional error.

3.2. Determining the Recuperation Ability

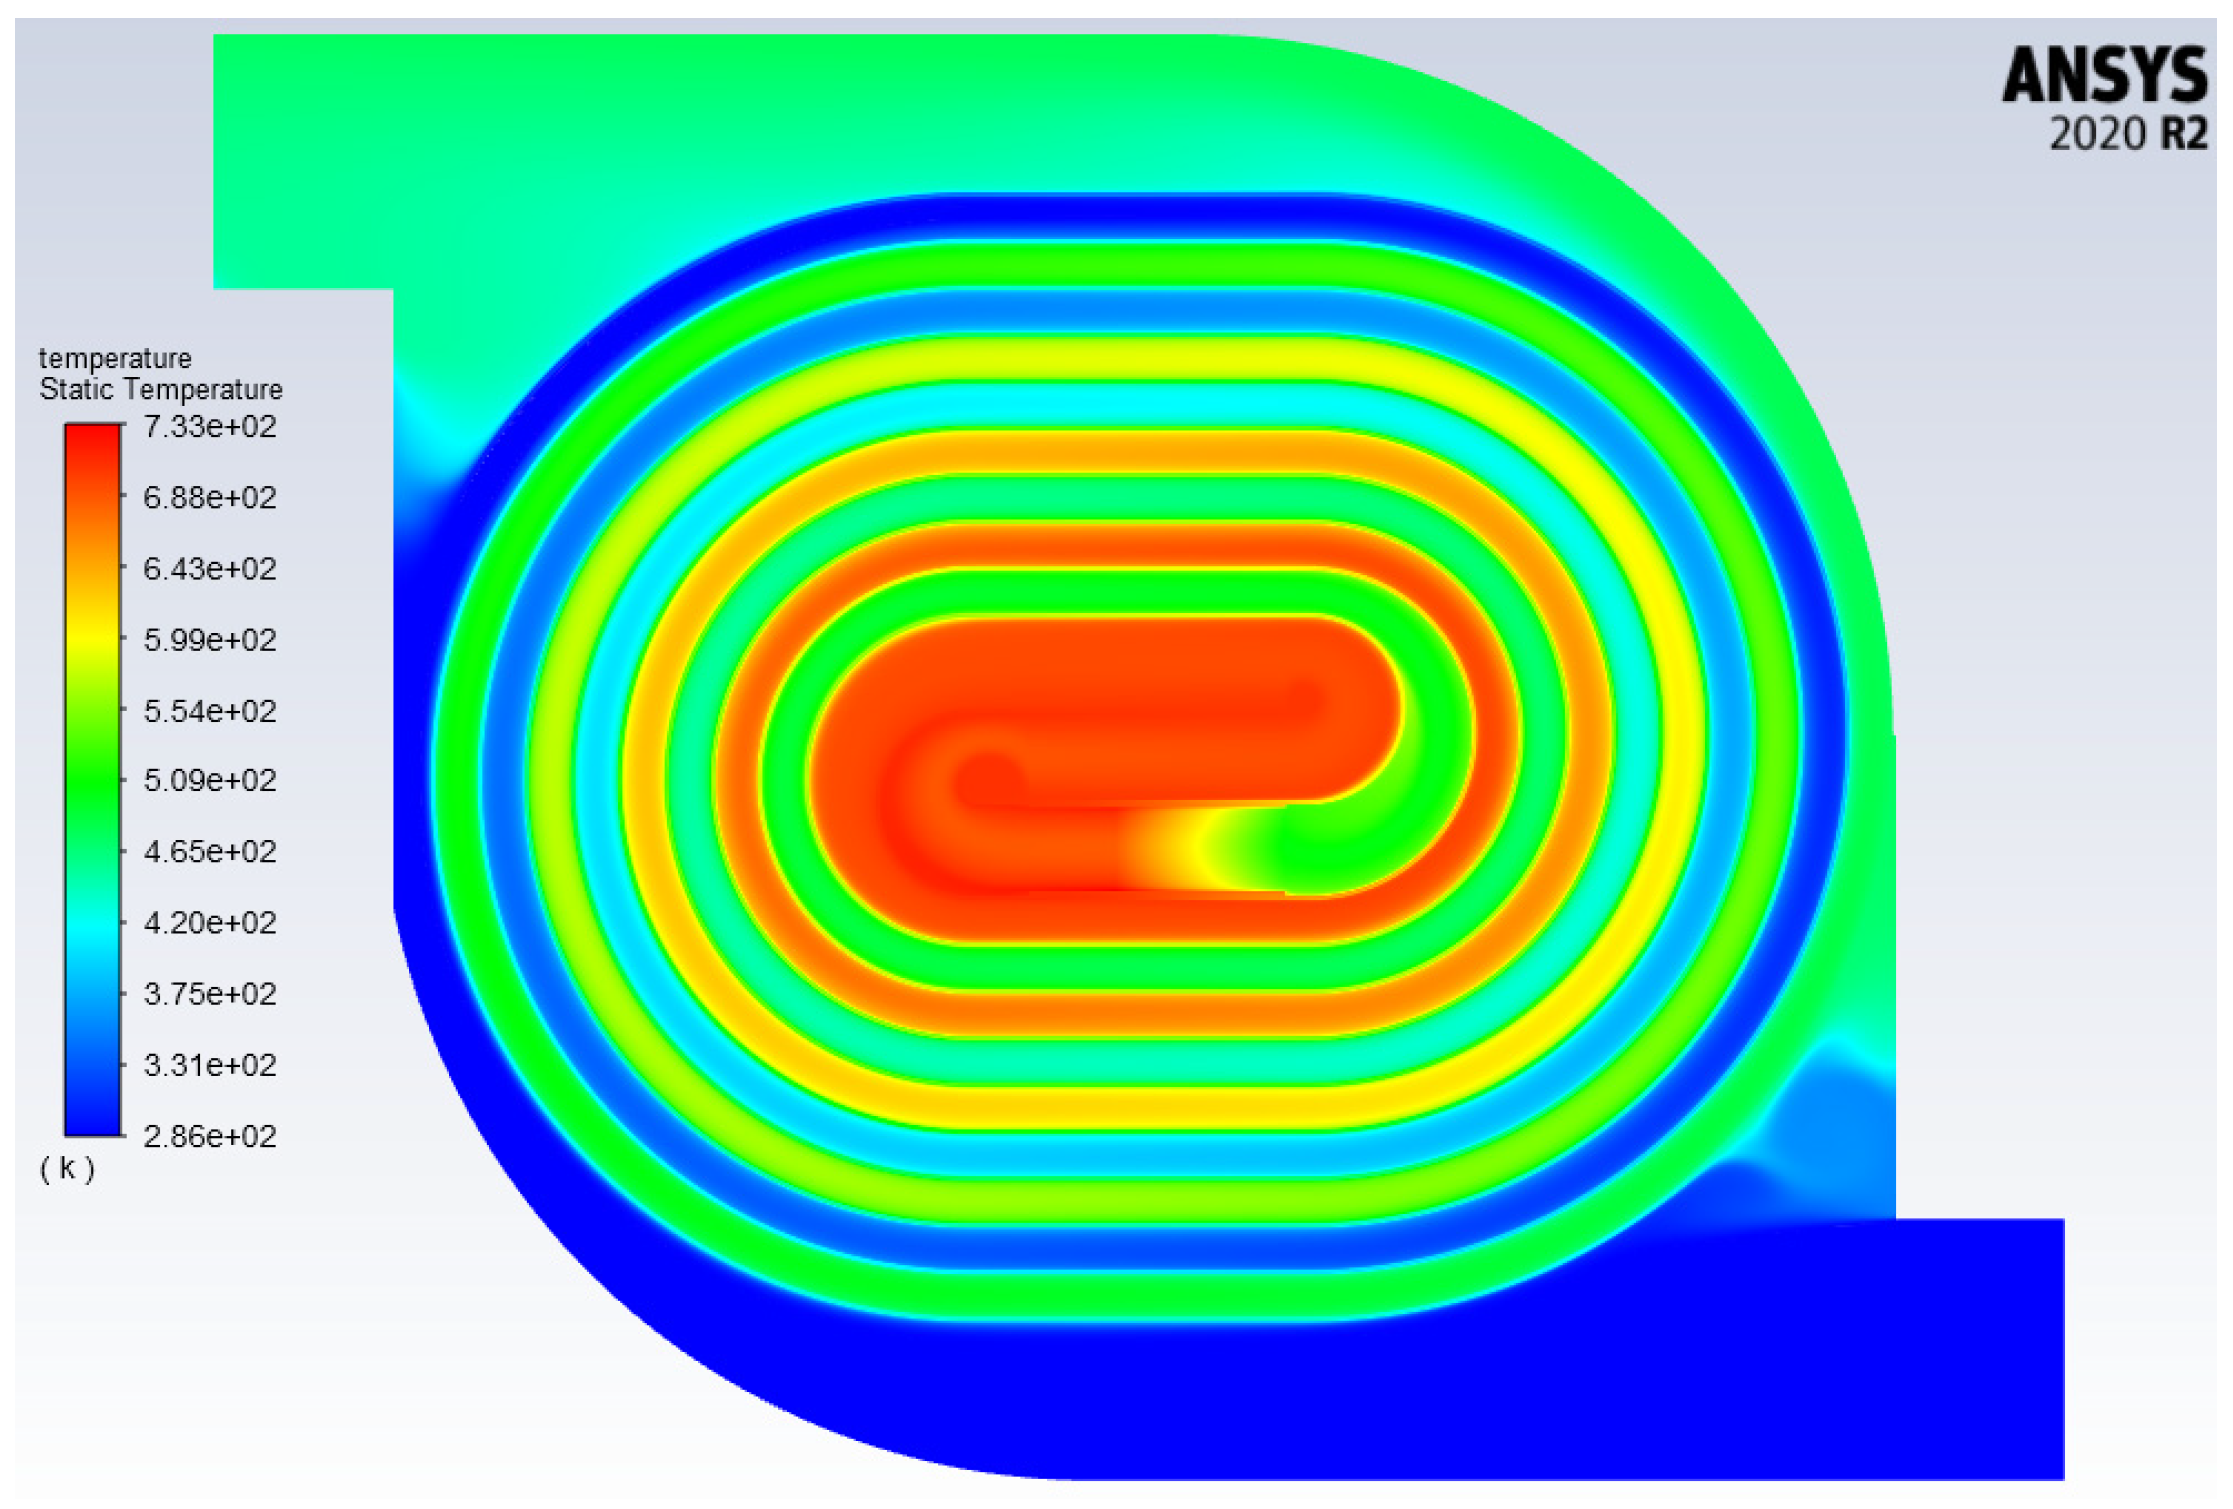
Computational modelling was used to evaluate the recuperative ability of the twin snail recuperator. Simulations were performed over a range of inlet volumetric flow rates at effective methane concentrations of 0.4, 0.7 and 1.0 mole %. The source term in the energy balance equation for the catalytic sections was computed as explained in Section 2. A typical colour contour plot of the temperature distribution is given in Figure 6. As can be seen from this figure, the temperature in the central catalyst section is clearly the maximum, and the recuperation effect is evident. Table 3 summarizes the results from this set of simulations.
We now analyze the data to develop a generalized result. We do this by the application of classical heat transfer analysis. For illustration purposes, even though the proposed system is an integrated design, we can represent it schematically according to Figure 7, as a separate reactor and heat exchanger unit.
Classical heat exchanger analysis includes the log mean temperature difference (LMTD) method, which can be applied to any heat exchanger regardless of flow pattern. Consider the generic heat transfer system illustrated in Figure 7. The box on the left represents the spiral recuperation section. Temperature Tin is the inlet temperature to the system, whilst temperature Tout is the outlet temperature. For a perfectly insulated system, it follows that the difference between these two temperatures is equal to the adiabatic temperature rise. Temperature T1 is the temperature at the outlet of the inlet recuperator channel, or, in other words, the temperature at the inlet to the catalyst system represented by thermocouple 1 in the experimental system (see Figure 4). Temperature T16 represents the temperature at the outlet of the catalyst section, which is the value recorded by thermocouple 16 (see Figure 4) of the experimental system. It also follows, although perhaps less obviously, that the difference between these two points is also approximately equal to the adiabatic temperature rise. The LMTD method of heat exchanger analysis is valid for any heat exchanger regardless of flow pattern. The transfer of heat in a heat exchanger is governed by the following LMTD design equation:
q = F U A Δ T ¯ L
where U is the overall heat transfer coefficient, A is the area for heat transfer and F is a correction factor that depends on the flow pattern. Note that F can also be a function of temperature, but for this investigation, it was assumed to be constant. Δ T ¯ L is the LMTD:
Δ T ¯ L = T 16 T 1 T out T in ln T 16 T 1 T out T in
As noted in the foregoing, the two temperature differences in the numerator will be equal, both having the value of the adiabatic temperature rise, thus leading to an indeterminate solution. In such a case, it is noted that the temperature driving force is thus the same everywhere in the recuperator section, and equals the adiabatic temperature rise. If we assume constant values for the enthalpy of reaction, and the average molar heat capacity, then the relationship between Tin and Tout is
T out = T in + Δ H R Y CH 4 C ¯ P X CH 4
Y CH 4 is the mole fraction of methane in the feed and X CH 4 is the fractional conversion. Assuming a conversion of 100%, a constant heat capacity of 30 J/(mol K) and a constant enthalpy of reaction of (−802) kJ/mol, the adiabatic temperature rise that corresponds to complete conversion is
Δ T ad = Δ H R Y CH 4 C ¯ P X CH 4 = 802,000 Y CH 4 30 1 = 26,733 Y CH 4
The adiabatic temperature rise for 1 mole % methane is 267 K, for 0.7% methane it is 187 K, and for 0.4% methane it is 107 K.
Note that it is not necessary to determine each of U, A and F separately, but rather, for a given geometry, we use the product as the defining feature of the system. The heat transferred to the inlet stream (which is equal to the transfer from the exit stream) can be calculated from
q = Q × C T × C P T 1 T in
We combined the two equations and substituted the values from the CFD simulations. This allowed the calculation of the product (FUA). The results are shown in Table 4.
From Table 4 it can be seen that the product (FUA) depends only on the flow rate, and not on the temperature or the methane concentration. This result is quite significant, because it allows for a simple method of calculating the recuperation, once the value of (FUA) is determined for the specified configuration.
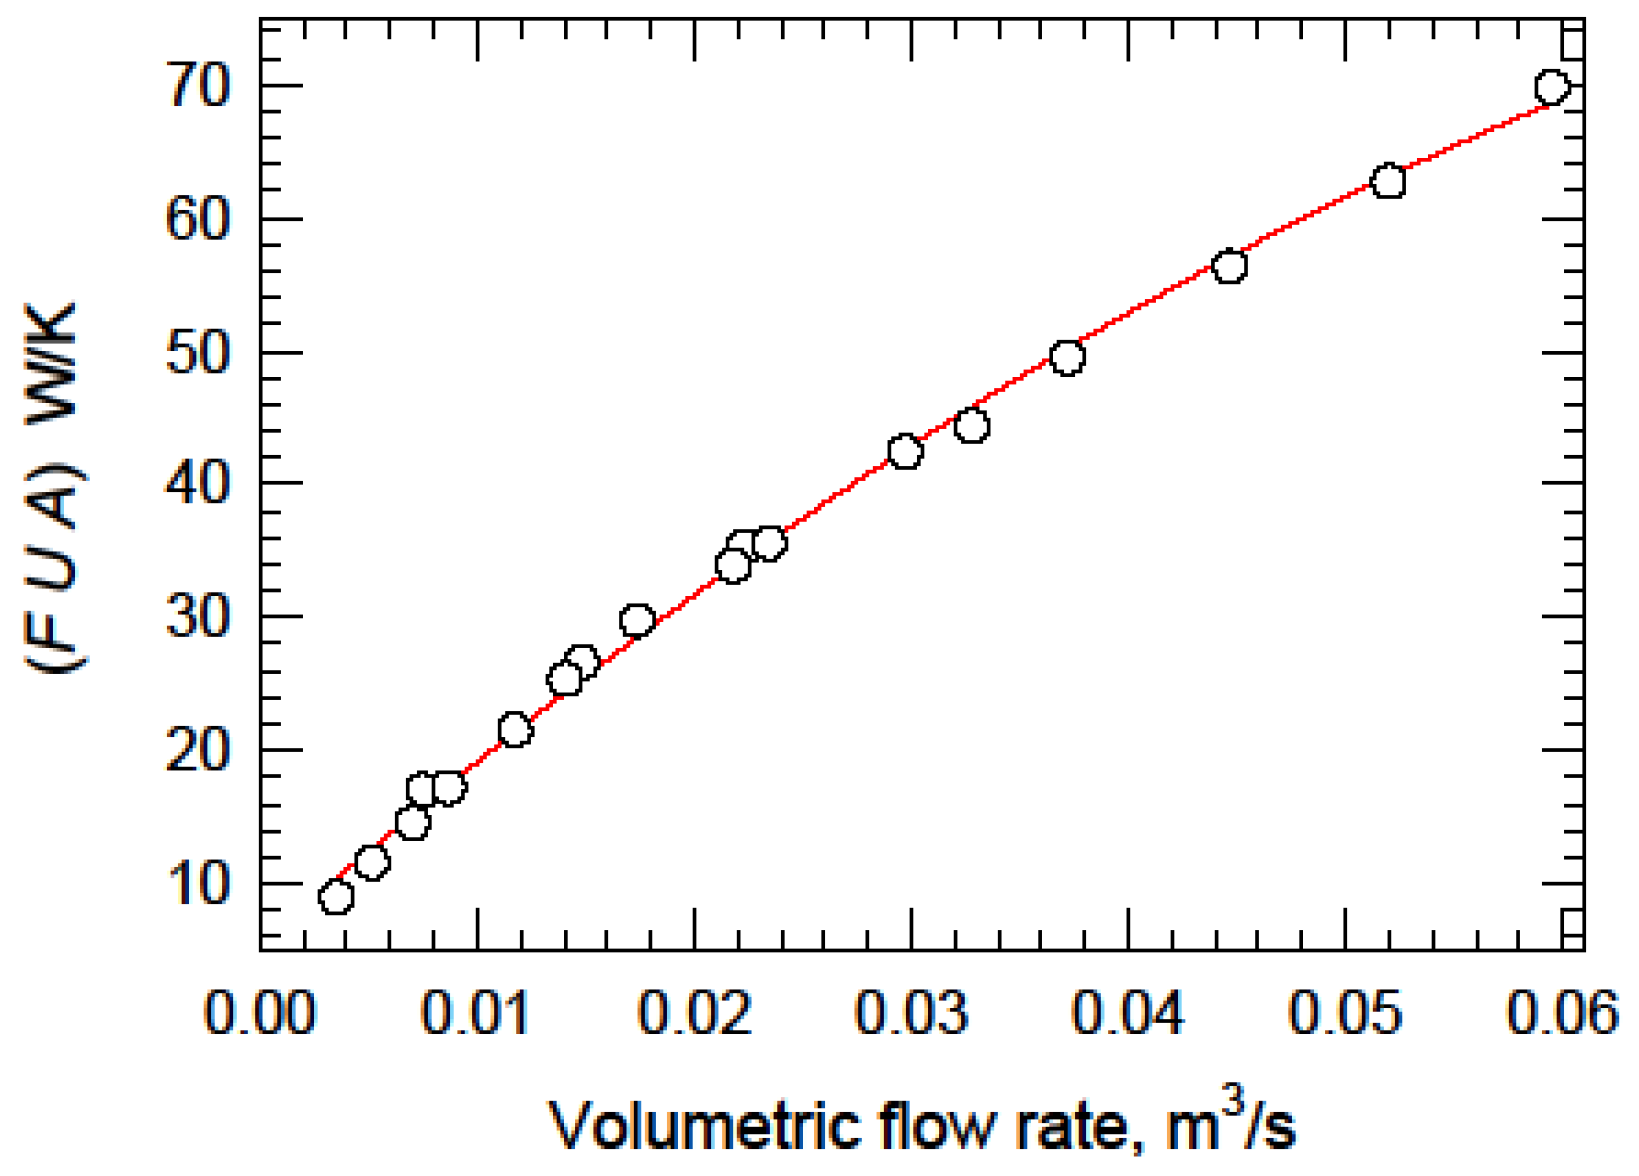
Based on the preceding observations, further simulations were performed to allow for the development of a good correlation to predict the inlet catalyst temperature for a given flow rate and methane feed concentration. These simulations, which are also given in Table 4 as Experiments 17 to 26, were performed using 0.96% methane, a concentration for which the adiabatic temperature rise was 257 K. These additional simulations added more accuracy to the correlation at lower flow rates. The results are presented graphically in Figure 8 for the volumetric flow rate referenced at 300 K and 101.325 kPa.
The data presented in Table 4 and Figure 8 can be correlated using a quartic equation, to yield
F U A = 2.8348 + 1892.82 Q 24,902 Q 2 + 202,965 Q 3
where the flow rate, Q, has units of m3/s. Equation (20) can be combined with Equations (15), (18) and (19) to provide for a prediction of the inlet temperature at the catalyst:
T 1 = T in + 62.181 Q + 41,519 546,225 Q + 4,452,037 Q 2 Y CH 4
Table 5 shows the comparison of the inlet catalyst temperature obtained from the CFD simulations with those from the simple correlation. Note that this relationship does contain some simplifying assumptions, so will not provide an exact answer. Equation (21) gives an approximate value of the inlet temperature, with a maximum error of about six degrees for inlet flow rates greater than 1.0 × 10⁻² m3/s.
To facilitate analysis, an equation can be curve-fit to the data shown in Table 2 and Figure 5. The ignition temperature required can be correlated to the GHSV using an equation of the following form:
T 1 ig = a + b ln GHSV 1000 + c
where the GHSV has units of h−1. The values of the constants in Equation (22) for the six cases represented in Figure 5 are given in Table 6. Equation (22) can be written explicitly in terms of volumetric flow rate and catalyst length. We recall that the catalyst monolith measures 50 mm by 150 mm, to give a cross-sectional area of 7.5 × 10⁻³ m2. Thus,
T 1 ig = a + b ln 480 Q L + c
The catalyst length, L, has units of m and the flow rate has units of m3/s.
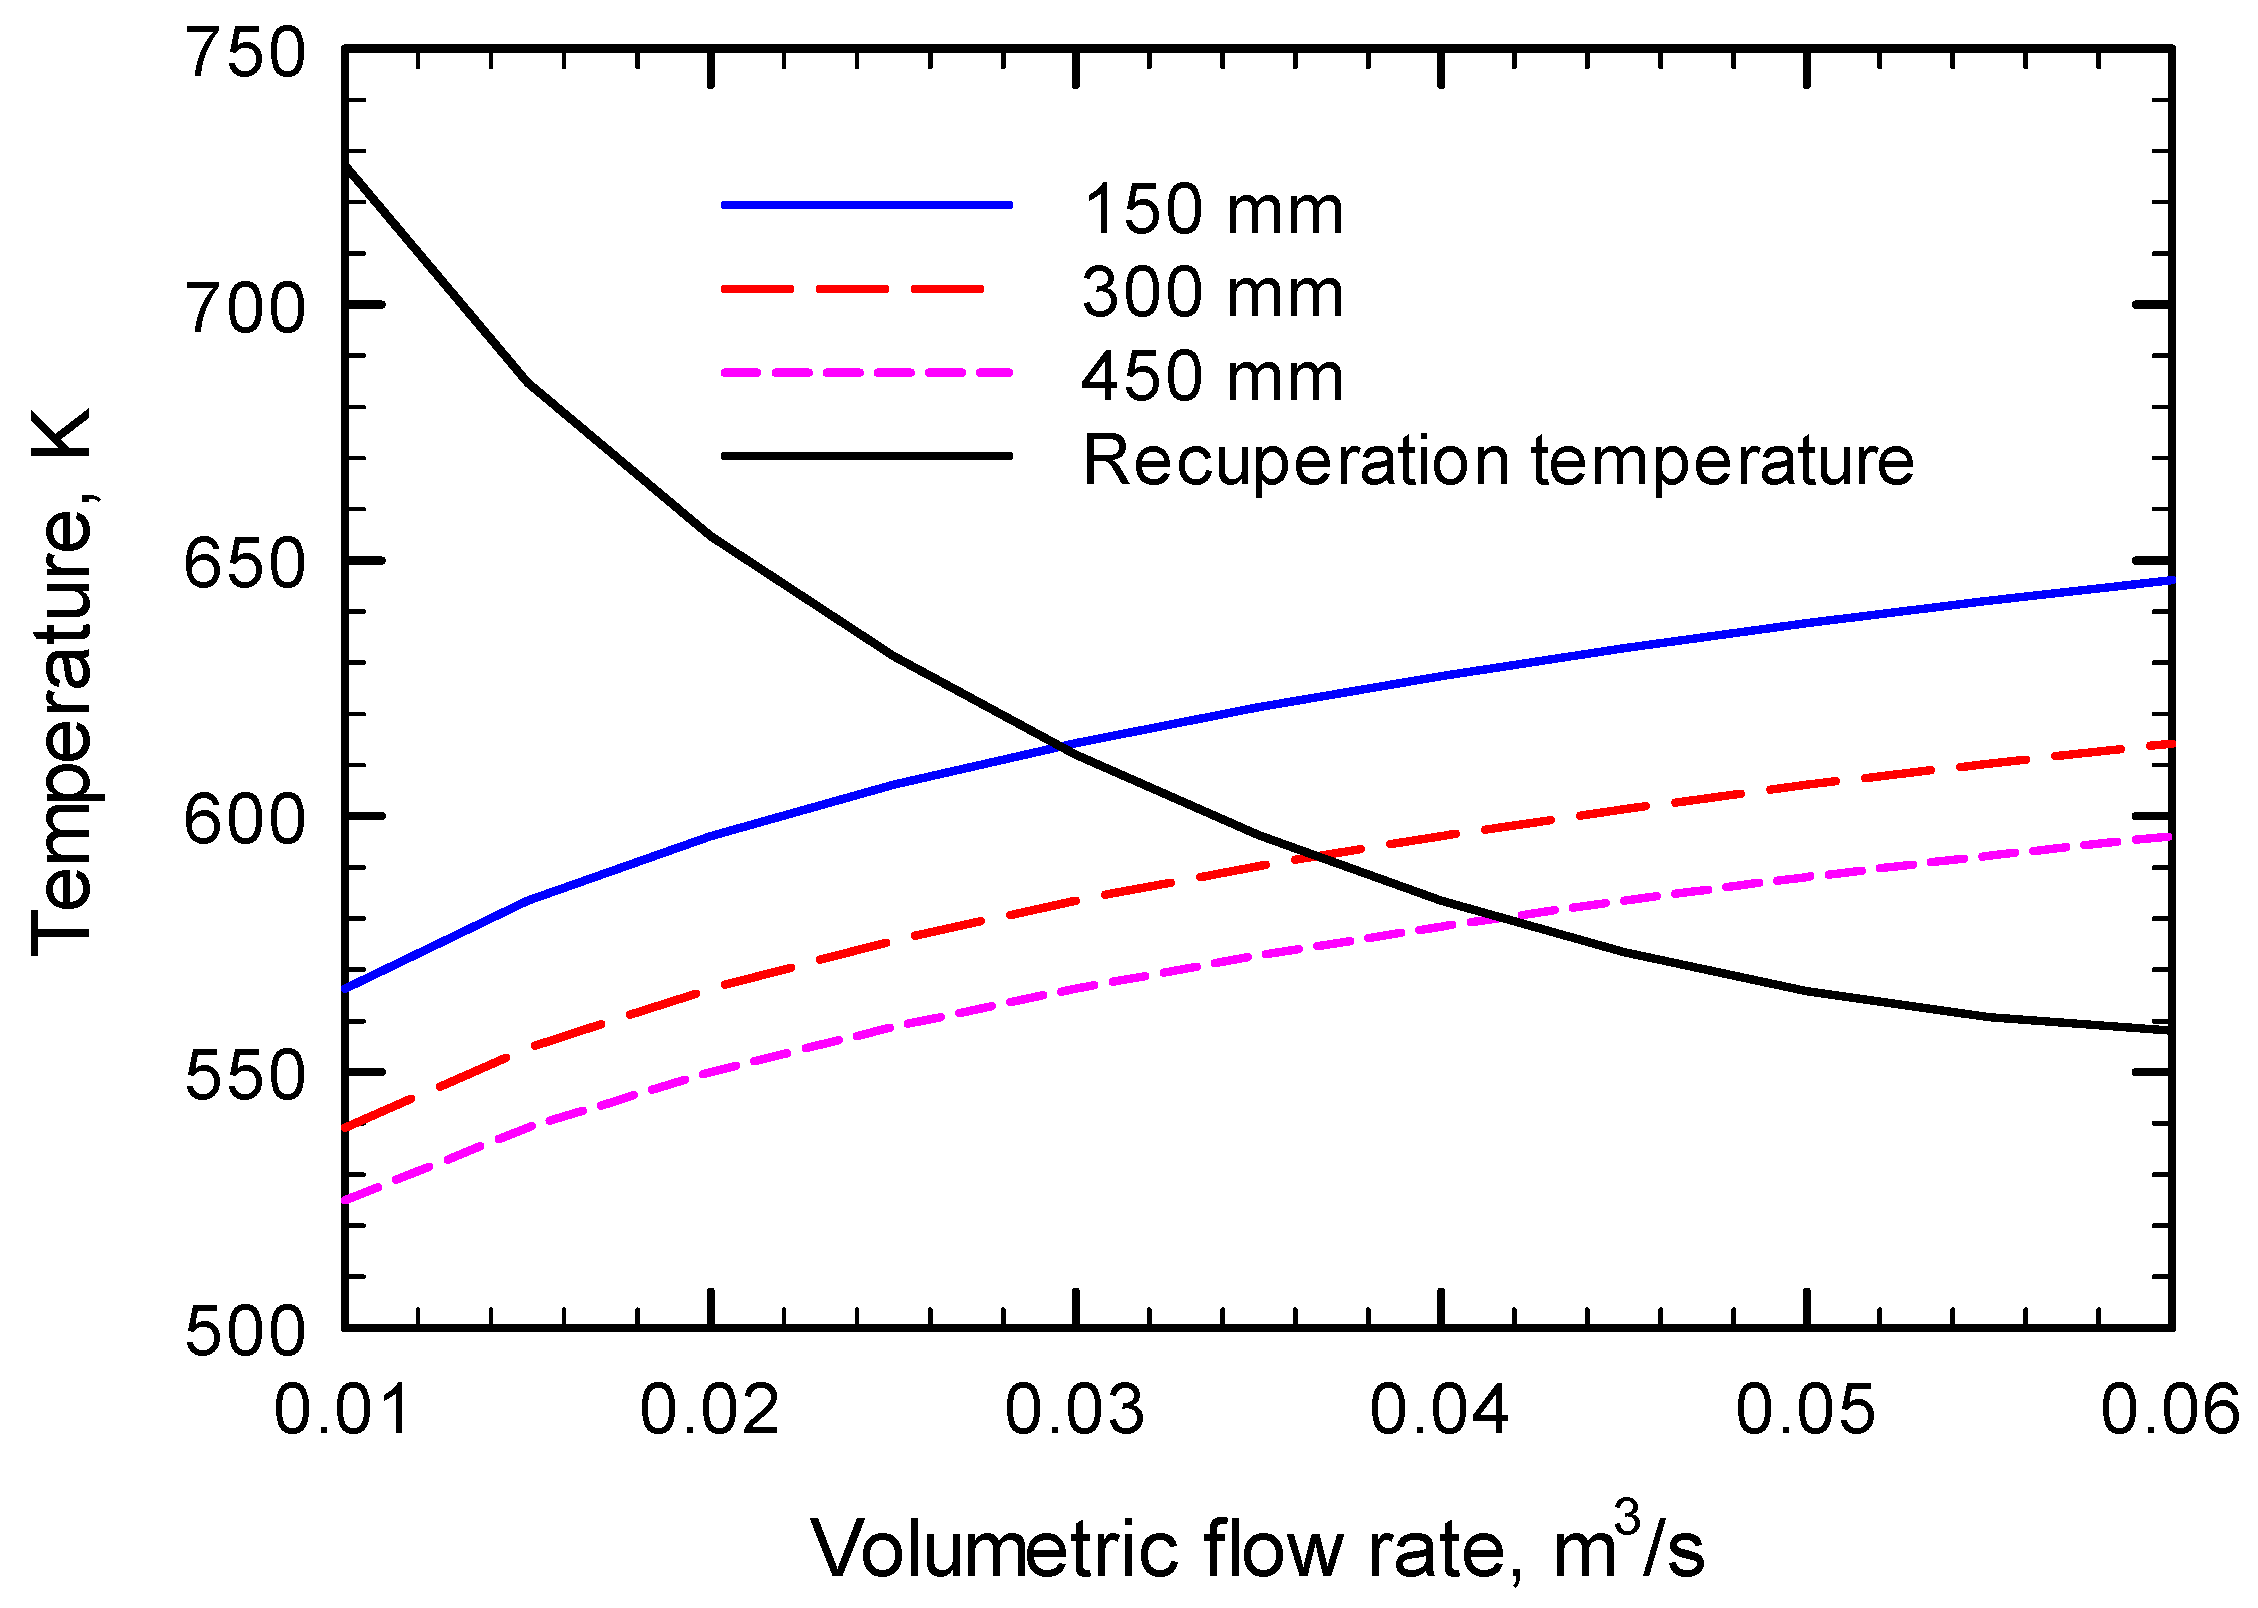
Equations (21) and (23) provide a useful set of design equations that can be used to evaluate the operating limits of the unit for a given system inlet temperature, catalyst length, feed flow rate and methane concentration. Figure 9 shows a plot of the inlet catalyst temperature required to achieve 99.9% methane conversion for an inlet methane mole fraction of 0.01 for the fresh catalyst at three catalyst lengths. The monolith lengths of 150, 300 and 450 mm correspond to the amount of catalyst that can be inserted into one, two and three channels, respectively. The temperatures required are shown as a function of the inlet flow rate referenced at 300 K and 101.325 kPa, with the system inlet temperature of 300 K. Also shown in Figure 9 is the temperature achieved at the catalyst inlet following the recuperation (the recuperation temperature), at a methane mole fraction of 0.01. Provided that the recuperation temperature is greater than the ignition temperature, the unit will function and the methane will be converted. The point of intersection of the line representing the necessary ignition temperature and recuperation temperature is the maximum flow rate possible to achieve methane conversion at the corresponding flow rate. The maximum flow rate for the simulated conditions are given in Table 7. Note that for a methane mole fraction of 0.004, the unit cannot operate at any flow rate above 1 m3/s and the results are not shown.
The trends observed are consistent with the expected behaviour. For the recuperation section, the heat transfer coefficient increases with increasing flow rate, which provides a better driving force for the heat transfer, which is beneficial. At the same time, an increasing flow rate requires more energy to be transferred to the incoming stream, and also increases the catalyst ignition temperature. The resulting trade-off determines the operating limits on the performance of the unit.
A final comment on these results is that they are valid for an inlet temperature of 300 K. Increasing this temperature through an additional heat transfer device, for example, with an external heat exchanger, will extend the operating range.

3.3. Experimnetal Validation

Seven experiments were performed using the methodology described in Section 2. Complete details of all of the experiments can be found in the Supplementary Information. The objective of the experiments was to determine and evaluate the heat transfer characteristics of the unit, and to compare the actual performance to that predicted by the CFD model. Table 8 shows the temperatures at the inlet and the outlet of both the entire unit and the catalyst section for some steady-state operating points for all of the seven experiments.
The numerical simulations assumed that the system was adiabatic. In practice, the system loses energy to the surroundings in spite of the insulation. We estimated the amount of energy lost by the systems to the surroundings. Although this information is not directly transferable to a scaled-up system, it provides useful information. The energy balances are based on the temperature differences observed between the inlet and the outlet of the system. It should be noted that these temperatures are single-point temperatures measured at the centre of the duct, and thus may not be exactly the same as the average bulk temperature of the entire flowing gas stream.
The calculation of the energy lost is performed by computing the outlet temperature expected using the adiabatic temperature rise equations given earlier and then comparing them to the ones measured in the experiments. The energy loss is then computed from the temperature difference, the heat capacity and the flow rate. The results are summarized in Table 9.
The energy losses vary; however, the trend is that more energy is lost at higher reactor temperatures. As the inlet methane concentration and the inlet flow rate increase, there is a trend to lower heat loss. This observation is consistent with classical heat transfer principles. The driving force for heat loss is the temperature difference between the system and the surroundings. As the methane concentration was increased, the inlet temperature was decreased, so in many experiments the average system temperature was constant. However, with a higher methane concentration, more thermal energy is generated in the reactor, and therefore the heat loss, which remains more or less constant, is a smaller percentage of the thermal energy generated. Overall, the heat loss at high flow rate and methane concentration is acceptable, and is expected to be lower in a full-sized unit.
Next, we calculated the experimental values of the constant FUA from the data. We used the LMTD based on the inlet and outlet temperatures from the system, and the inlet and outlet temperatures from the catalyst section. The heat transfer is then described by
q = F U A Δ T ¯ L = F U A T 16 T 1 T out T in ln T 16 T 1 T out T in
The heat transfer for a given stream is computed as before; the heat transferred to the inlet and outlet streams are
q inlet = Q × C T × C P T 1 T in
q outlet = Q × C T × C P T 16 T out
For the adiabatic reactor, these two values are the same, as noted earlier. However, for the non-adiabatic system they are different; therefore, for the calculation of FUA we used the mean value. The results are shown in Table 10 and plotted in Figure 10.
At the lowest flow rates, the difference between the predicted and measured FUA values is small, but at higher flow rates the experimental values are up to 20% larger than the CFD predictions.
We now consider the CFD simulations that replicate Experiments 1 and 5. These two experiments represent between them a range of methane concentrations (Experiment 1) and a wide range of flow rates at a constant methane concentration (Experiment 5). We consider the steady-state operating points. Computational simulations were performed for the experimental conditions of flow rate and inlet temperature. We compared the results obtained from the CFD simulations (which are insulated) and then the experimental results, which had some heat loss to the surroundings. Table 11 shows the results obtained from these CFD simulations.
Comparing the results from the experiments and the CFD simulations, some observations can be made. For Experiment 1, the experimental and simulated temperatures agree well. The experimental values typically fall below the predicted ones, which is expected because there is heat loss in the experimental unit. The monolith inlet temperature predicted by the correlation is within the error of the correlation. For Experiment 5, the experimental temperatures observed at the inlet to the catalyst section is consistently higher than the value predicted by the CFD. These observations are reasonable. For Experiment 1, the flow rate was low and the percentage of heat loss was relatively high; thus, a lower than predicted inlet catalyst temperature is not surprising. For Experiment 5, there was a lower percentage of heat loss because of the higher feed flow rate, and at these flow rates the FUA value is observed to be higher than the model; thus, a higher inlet catalyst temperature is also reasonable.

4. Concluding Remarks

The detailed results presented in Section 3 clearly demonstrate the efficacy of the proposed design for the application of combustion of ventilation air methane. The agreement between the experimental operation and the computational model predictions is very good, and certainly justifies this approach. The construction of such a prototype is quite time-consuming and costly, and therefore the use of CFD to reduce the prototyping is a very useful and cost-saving measure.
The CFD simulations are not very time-consuming to perform, although setting up the problem correctly is important. We believe that using a set of complex CFD simulations to develop simplified design equations is a good approach. Clearly, being able to predict the operation of the prototype does require a detailed knowledge of the catalyst characteristics, and that is likely the most time-consuming part of the investigation. However, this step must be performed in any design workflow.
A final point to note is that we have only considered one arrangement for the recuperator. Having demonstrated that the computational model is able to give reliable results, the method can be used to perform more in-depth shape optimization, as well as provide scale-up guidelines. These topics will be addressed in future papers concerning this reactor concept.

Supplementary Materials

The following supporting information can be downloaded at: https://www.mdpi.com/article/10.3390/pr13041168/s1, Figure S1: Schematic of the equipment used in the prototype testing; Figure S2: Temperatures of selected thermocouples and methane concentration as a function of time for Experiment 1; Figure S3: Temperatures of selected thermocouples and methane concentration as a function of time for Experiment 2; Figure S4: Temperatures of selected thermocouples and methane concentration as a function of time for Experiment 3; Figure S5. Temperatures of selected thermocouples and methane concentration as a function of time for Experiment 4; Figure S6. Temperatures of selected thermocouples and methane concentration as a function of time for Experiment 5; Figure S7: Temperatures of selected thermocouples and methane concentration as a function of time for Experiment 6; Figure S8: Temperatures of selected thermocouples and methane concentration as a function of time for Experiment 7; Figure S9: Temperatures measured at different spatial positions at the front of the first catalyst brick (left) and the second catalyst brick (right) for Experiment 1, data point 6; Figure S10: Temperatures measured at different spatial positions at the front of the first catalyst brick (left) and the second catalyst brick (right) for Experiment 5, data point 5; Figure S11: Typical pressure profiles obtained from the numerical simulation of the experiments. Experiment 5 is shown; Figure S12: Typical temperature profiles obtained from the numerical simulation of the experiments. Experiment 5 is shown; Table S1: Steady state points of operation used for analysis of Experiment 1; Table S2: Steady state points of operation used for analysis of Experiment 2; Table S3. Steady state points of operation used for analysis of Experiment 3; Table S4: Steady state points of operation used for analysis of Experiment 4; Table S5: Steady state points of operation used for analysis of Experiment 5; Table S6: Steady state points of operation used for analysis of Experiment 6; Table S7: Steady state points of operation used for analysis of Experiment 7; Table S8: Catalyst length required for 99+ % conversion for some selected data points for the experimental runs 1 to 5.

Author Contributions

Conceptualization, R.E.H., J.P.-P. and J.D.; methodology, J.P.-P., R.E.H. and J.D.; software, J.P.M. and R.E.H.; formal analysis, J.P.M., R.E.H., R.J. and D.K.C.; investigation, J.P.M., R.E.H., J.P.-P., R.J., D.K.C., R.H. and J.D.; resources, J.P.-P., R.E.H. and R.H.; data curation, R.E.H., J.P.-P. and R.J.; writing—original draft preparation, R.E.H.; writing—review and editing, R.E.H.; visualization, J.P.M., R.E.H. and J.D.; supervision, R.E.H. and J.P.-P.; project administration, J.P.-P.; funding acquisition, J.P.-P. All authors have read and agreed to the published version of the manuscript.

Funding

The research was financed within the National Research Centre project VAMPIRE, no: POIR.01.01.01-00-1096/17-00.

Data Availability Statement

The data presented in this study may be available on request from the corresponding author. The data are not publicly available.

Conflicts of Interest

Authors Roman Jędrzejczyk Damian Chlebda and Jacek Dańczak were employed by CTiPT Center for Technology Transfer and Promotion, Katowice Sp. z.o.o. The remaining authors declare that the research was conducted in the absence of any commercial or financial relationships that could be construed as a potential conflict of interest.

References

  1. Harvey, L.D.D. A guide to global warming potentials (GWPs). Energy Policy 1993, 21, 24–34. [Google Scholar] [CrossRef]
  2. O’Connor, F.M. Why Methane Matters. Front. Sci. 2024, 2, 1462198. [Google Scholar] [CrossRef]
  3. IEA Global Methane Tracker 2024, Paris. Available online: https://www.iea.org/reports/global-methane-tracker-2024 (accessed on 7 March 2025).
  4. Hayes, R.E. Catalytic solutions for fugitive methane emissions in the oil and gas sector. Chem. Eng. Sci. 2004, 59, 4073–4080. [Google Scholar] [CrossRef]
  5. Wang, W.; Ren, J.; Li, X.; Li, H.; Li, D.; Li, H.; Song, Y. Enrichment experiment of ventilation air methane (0.5%) by the mechanical tower. Sci. Rep. 2020, 10, 808. [Google Scholar] [CrossRef]
  6. Schatzel, S.J.; Krog, R.B.; Dougherty, H. Methane emissions and airflow patterns on a longwall face: Potential influences from longwall gob permeability distributions on a bleederless longwall panel. Trans. Soc. Min. Metall. Explor. 2017, 342, 51–61. [Google Scholar] [CrossRef] [PubMed]
  7. Swolkien, J.; Fix, A.; Gałkowski, M. Factors influencing the temporal variability of atmospheric methane emissions from Upper Silesian coal mines. Atmos. Chem. Phys. 2022, 22, 16031–16052. [Google Scholar] [CrossRef]
  8. Kesselring, J. Catalytic combustion. In Advanced Combustion Methods; Weinberg, J., Ed.; Academic Press: London, UK, 1986; pp. 237–275. [Google Scholar]
  9. Prasad, R.; Kennedy, L.; Ruckenstein, E. Catalytic combustion. Catal. Rev. Sci. Eng. 1984, 29, 219–267. [Google Scholar] [CrossRef]
  10. Hayes, R.E.; Kolaczkowski, S.T. Introduction to Catalytic Combustion; Gordon and Breach Science Publishers: Reading, UK, 1997. [Google Scholar]
  11. Chen, J.; Arandiyan, H.; Gao, X.; Li, J. Recent advances in catalysts for methane combustion. Catal. Surv. Asia 2015, 19, 140–171. [Google Scholar] [CrossRef]
  12. Forzatti, P.; Groppi, G. Catalytic combustion for the production of energy. Catal. Today 1999, 54, 165–180. [Google Scholar] [CrossRef]
  13. Cullis, C.F.; Willatt, B.M. Oxidation of methane over supported precious metal catalysts. J. Catal. 1983, 83, 267–285. [Google Scholar] [CrossRef]
  14. Choudhary, T.; Banerjee, S.; Choudhary, V. Catalysts for combustion of methane and lower alkanes. Appl. Catal. A Gen. 2002, 234, 1–23. [Google Scholar] [CrossRef]
  15. Gélin, P.; Primet, M. Complete oxidation of methane at low temperature over noble metal based catalysts: A review. Appl. Catal. B Environ. 2002, 39, 1–37. [Google Scholar] [CrossRef]
  16. Ciuparu, D.; Lyubovsky, M.; Altman, E.; Pfefferle, L.; Datye, A. Catalytic combustion of methane over palladium-based catalysts. Catal. Rev. Sci. Eng. 2002, 44, 593–649. [Google Scholar] [CrossRef]
  17. Monai, M.; Montini, T.; Gorte, R.; Fornasiero, P. Catalytic Oxidation of Methane: Pd and Beyond. Eur. J. Inorg. Chem. 2018, 25, 2884–2893. [Google Scholar] [CrossRef]
  18. Kumar, R.S.; Mmbaga, J.P.; Semagina, N.; Hayes, R.E. Methane Combustion Kinetics over Palladium Based Catalysts: Review and Modelling Guidelines. Catalysts 2024, 14, 319. [Google Scholar] [CrossRef]
  19. Istratescu, G.M.; Hayes, R.E. Ageing studies of Pt and Pd based catalysts for the combustion of lean methane mixtures. Processes 2023, 11, 1373. [Google Scholar] [CrossRef]
  20. Kolios, G.; Frauhammer, J.; Eigenberger, G. Autothermal fixed-bed reactor concepts. Chem. Eng. Sci. 2000, 55, 5945–5967. [Google Scholar] [CrossRef]
  21. Churchill, S.W. The Interaction of Reactions and Transport Part II: Combined Reactors and Exchangers. Int. J. Chem. React. Eng. 2007, 5, A55. [Google Scholar] [CrossRef]
  22. Salomons, S.; Hayes, R.E.; Poirier, M.; Sapoundjiev, H. Modelling a reverse flow reactor for the catalytic combustion of fugitive methane emissions. Comput. Chem. Eng. 2004, 28, 1599–1610. [Google Scholar] [CrossRef]
  23. Kushwaha, A.; Poirier, K.; Hayes, R.E.; Sapoundjiev, H. Heat Extraction from a Flow Reversal Reactor in Lean Methane Combustion. Chem. Eng. Res. Des. 2005, 83, 205–213. [Google Scholar] [CrossRef]
  24. Kushwaha, A.; Hayes, R.E.; Poirier, M.; Sapoundjiev, H. Effect of reactor internal properties on the performance of a flow reversal catalytic reactor for methane combustion. Chem. Eng. Sci. 2004, 59, 4081–4093. [Google Scholar] [CrossRef]
  25. Liu, B.; Checkel, M.D.; Hayes, R.E. Experimental study of a reverse flow catalytic converter for a dual fuel engine. Can. J. Chem. Eng. 2001, 79, 491–506. [Google Scholar] [CrossRef]
  26. Liu, B.; Hayes, R.E.; Mmbaga, J.P.; Yi, Y.; Checkel, M.D.; Zheng, M. Three-dimensional modelling of methane ignition in a reverse flow catalytic converter. Comput. Chem. Eng. 2007, 31, 292–306. [Google Scholar] [CrossRef]
  27. Kolios, G.; Gritsch, A.; Morillo, A.; Tuttlies, U.; Bernnat, J.; Opferkuch, F.; Eigenberger, G. Heat-integrated reactor concepts for catalytic reforming and automotive exhaust purification. Appl. Catal. B Environ. 2007, 70, 16–30. [Google Scholar] [CrossRef]
  28. Bernnat, J.; Rink, M.; Tuttlies, U.; Danner, T.; Nieken, U.; Eigenberger, G. Heat-integrated concepts for automotive exhaust purification. Top. Catal. 2009, 52, 2052–2057. [Google Scholar]
  29. Salamon, E.; Cornejo, I.; Mmbaga, J.P.; Kołodziej, A.; Lojewska, J.; Hayes, R.E. Investigations of a three-channel autogenous reactor for lean methane combustion. Chem. Eng. Process. Process Intensif. 2020, 153, 107956. [Google Scholar] [CrossRef]
  30. Litto, R.; Nien, T.; Hayes, R.E.; Mmbaga, J.P.; Votsmeier, M. Parametric Study of a Recuperative Catalytic Converter. Catal. Today 2012, 188, 106–112. [Google Scholar] [CrossRef]
  31. Hayes, R.E.; Fadic, A.; Mmbaga, J.P.; Najafi, A. CFD Modelling of the Automotive Catalytic Converter. Catal. Today 2012, 188, 94–105. [Google Scholar] [CrossRef]
  32. ANSYS Inc. Ansys Fluent Ansys 18.2 Theory Guide; ANSYS Inc.: Canonsburg, PA, USA, 2017. [Google Scholar]
  33. Poling, B.E.; Prausnitz, J.M.; O’connell, J.P. The Properties of Gases and Liquids; McGraw-Hill: New York, NY, USA, 2001; Volume 5. [Google Scholar]
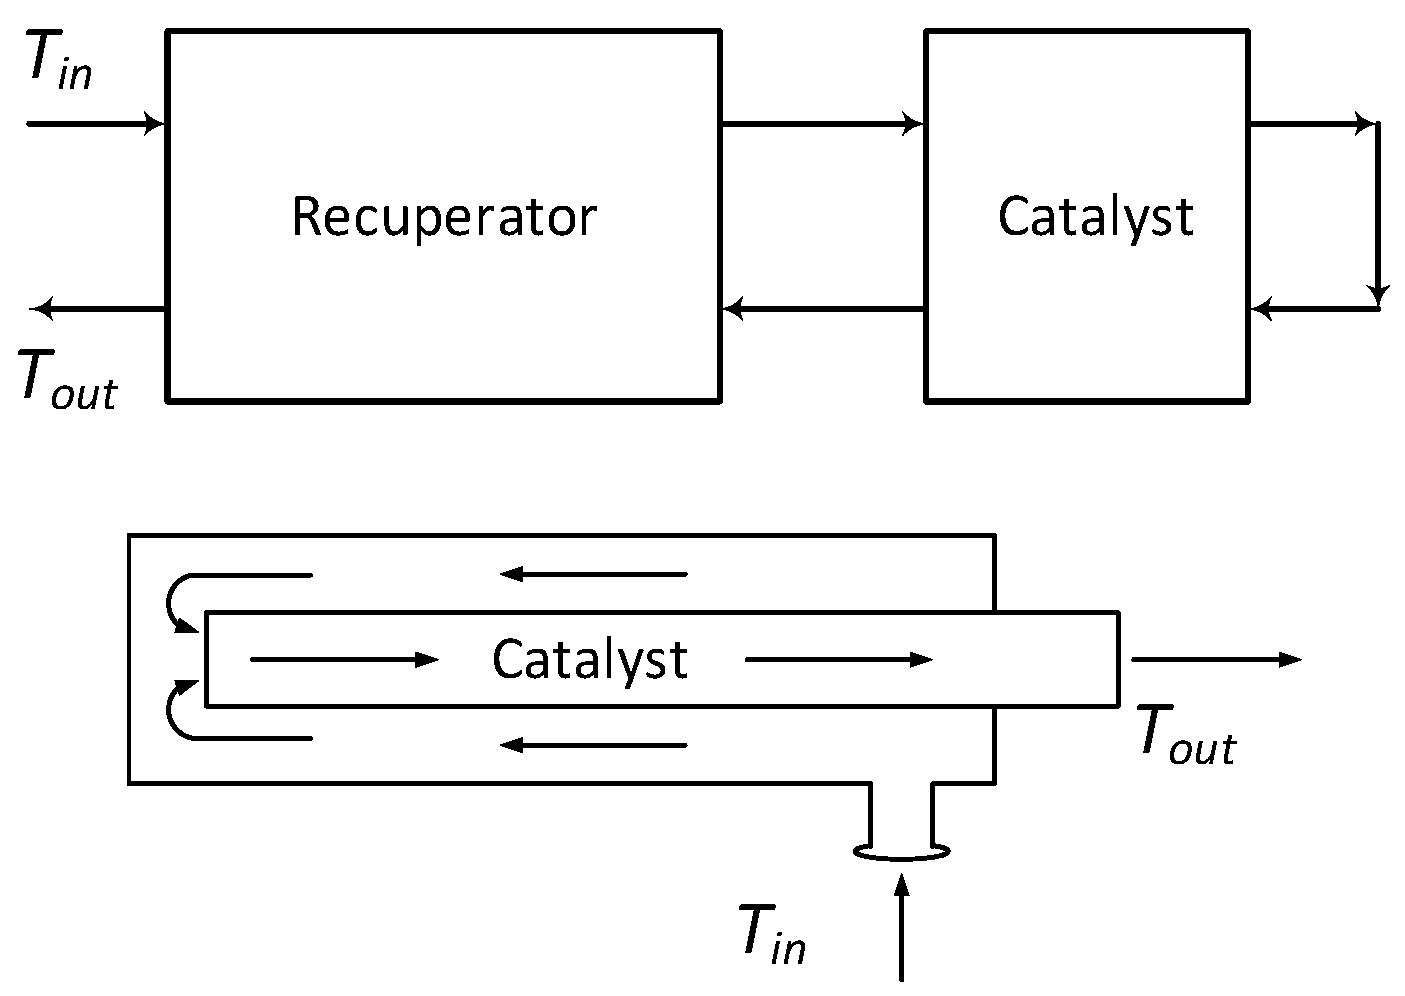
Figure 1. Catalytic reactor with heat recovery. Top: Reactor and heat exchanger as separate units. Bottom: Reactor and heat exchange occur in same unit.
Processes 13 01168 g001
Figure 2. Two views of the reactor internal arrangement. The central catalyst core is surrounded by a double-spiral recuperator.
Processes 13 01168 g002
Figure 3. Two views of the reactor before insulation. Left: Complete reactor module. Right: Zoomed view of the central catalyst holder.
Processes 13 01168 g003
Figure 4. The arrangement of the catalyst bricks in the catalyst section. The locations of the 16 thermocouples located in and around the catalyst are shown. The drawing is not to scale.
Processes 13 01168 g004
Figure 5. Ignition temperatures as a function of GHSV for (a) fresh and (b) aged catalyst at three inlet methane concentrations.
Processes 13 01168 g005
Figure 6. The temperature profile for a typical recuperation simulation. The high temperature in the central section is evident. The flow inlet is on the lower right and the outlet is the upper left.
Processes 13 01168 g006
Figure 7. The representation of the recuperator/reactor combination as a decoupled system.
Processes 13 01168 g007
Figure 8. Relationship between volumetric flow rate and the overall heat transfer coefficient factor (FUA). The volumetric flow rate referenced to 300 K and 101,325 Pa. The red line is the regression line.
Processes 13 01168 g008
Figure 9. A comparison of the required ignition temperature and the maximum recuperation temperature as a function of flow rate for the fresh catalyst at a methane mole fraction of 0.01.
Processes 13 01168 g009
Figure 10. The relationship between volumetric flow rate and the overall heat transfer coefficient factor (FUA). The volumetric flow rate is referenced to 300 K and 101,325 Pa. The plot compares the values obtained from the numerical simulations to those computed from the experimental results.
Processes 13 01168 g010
Table 1. Properties of the washcoated catalytic Cordierite monolith used in this study.
Cell density400 CPSI
Substrate density1650 kg/m3
Substrate volume fraction0.243
Washcoat density1100 kg/m3
Washcoat volume fraction0.12
Palladium loading in monolith (est)100–150 g/ft3
Table 2. Catalyst inlet temperature required to achieve 99.9% conversion of methane at different GHSV for three methane inlet concentrations. Values with dry feed for fresh and aged catalyst.
GHSV
h−1
Catalyst Entrance Temperature Required, Kelvin
Fresh CatalystAged Catalyst
1%0.7% t0.4%1%0.7%0.4%
180,000646678715704739775
120,000625658692677712748
90,000610643677660694730
72,000600630667647680717
60,000592620658638670707
48,000582610648626657695
36,000570597633612642678
24,000555580615593622659
18,000544568603580608645
12,000531553587564590627
9000521542577553578613
6000509528561539562597
4500501519551529551585
3000490507538517537571
Table 3. The simulation results from a perfectly insulated system with imposed thermal energy sources for different inlet conditions.
Exp. #Inlet Flow Rate, m3/sMole Fraction MethaneThermal Energy Generation Rate W/m3Monolith Inlet Temperature, K
11.48 × 10−20.014.312 × 106693
22.23 × 10−20.016.528 × 106646
32.97 × 10−20.018.704 × 106613
43.72 × 10−20.011.088 × 107592
54.47 × 10−20.011.306 × 107576
65.20 × 10−20.011.523 × 107564
75.95 × 10−20.011.741 × 107557
81.48 × 10−20.0073.046 × 106575
92.23 × 10−20.0074.569 × 106542
102.97 × 10−20.0076.092 × 106519
113.72 × 10−20.0077.515 × 106504
127.50 × 10−30.0048.75 × 105499
131.48 × 10−20.0041.74 × 106457
142.23 × 10−20.0042.61 × 106438
152.97 × 10−20.0043.48 × 106425
163.72 × 10−20.0044.35 × 106417
Table 4. Apparent heat transfer coefficients for the spiral recuperator design.
Exp. #Inlet Flow Rate, m3/sMole Fraction CH4Average Temperature at Monolith Inlet, K (T1) Temp   Increase T 1 T i n Energy Transfer kWFUA
W/K
11.48 × 10−20.016933937.126.6
22.23 × 10−20.016463469.435.3
32.97 × 10−20.0161331311.342.4
43.72 × 10−20.0159229213.249.5
54.47 × 10−20.0157627615.056.3
65.20 × 10−20.0156426416.762.7
75.95 × 10−20.0155725718.669.8
81.48 × 10−20.0075752754.9726.6
92.23 × 10−20.0075422426.5935.3
102.97 × 10−20.0075192197.9242.4
113.72 × 10−20.0075042049.2449.5
127.50 × 10−30.0044991991.8217.0
131.48 × 10−20.0044571572.8426.6
142.23 × 10−20.0044381383.7635.3
152.97 × 10−20.0044251254.2342.4
163.72 × 10−20.0044171175.3049.5
173.52 × 10−30.00968375372.308.95
185.16 × 10−30.00967744742.9811.59
197.03 × 10−30.00967374373.7414.57
208.67 × 10−30.00967184184.4217.19
211.17 × 10−20.00966873875.5321.51
221.41 × 10−20.00966803806.5125.34
231.73 × 10−20.00966623627.6529.77
242.18 × 10−20.00966283288.7133.90
252.34 × 10−20.00966203209.1435.57
263.28 × 10−20.009658528511.4044.35
Table 5. A comparison of the inlet temperature at the catalytic monolith inlet predicted by the CFD simulation with the one predicted by the correlation, Equation (23).
Inlet Flow Rate, m3/sMole Fraction CH4Temperature at Catalyst Inlet, K (T1), CFDTemperature at Catalyst Inlet, K (T1), Correlation
1.48 × 10−20.01693686
2.23 × 10−20.01646643
2.97 × 10−20.01613613
3.72 × 10−20.01592590
4.47 × 10−20.01576574
5.20 × 10−20.01564563
5.95 × 10−20.01557558
1.48 × 10−20.007575570
2.23 × 10−20.007542540
2.97 × 10−20.007519519
3.72 × 10−20.007504503
7.50 × 10−30.004499484
1.48 × 10−20.004457454
2.23 × 10−20.004438437
2.97 × 10−20.004425425
3.72 × 10−20.004417416
3.52 × 10−30.0096837850
5.16 × 10−30.0096774788
7.03 × 10−30.0096737749
8.67 × 10−30.0096718725
1.17 × 10−20.0096687694
1.41 × 10−20.0096680675
1.73 × 10−20.0096662655
2.18 × 10−20.0096628632
2.34 × 10−20.0096620625
3.28 × 10−20.0096585591
Table 6. Constants used in Equation (23) for the prediction of ignition temperature.
Methane Fractionabc
Fresh
0.01394.447.674.807
0.007407.851.584.104
0.004449.250.542.977
Aged
0.01394.958.455.447
0.007417.860.934.392
0.004461.659.443.510
Table 7. Maximum flow rate that will give 99.9% conversion of methane for various methane concentrations and catalyst activity levels.
Catalyst StateMethane Mole FractionCatalyst Length, mmMaximum Flow Rate, m3/s
Fresh0.011500.0296
3000.0365
4500.0416
Aged0.011500.0216
3000.0272
4500.0311
Fresh0.0071500.0105
3000.0137
4500.0159
Aged0.0071500.0075
3000.0098
4500.0114
Table 8. The temperatures at the inlet and outlet of the system and the catalyst section. The flow rates are corrected to 300 K and 101,325 Pa.
Data
Point
Time,
h
Mole % MethaneFlow Rate m3/sT in
K
T out
K
T1
K
T16
K
Experiment 1
1100.400.0082576648728827
2130.400.0096475563633739
3210.600.0072447580691833
4240.600.0070395536644796
5260.620.0076368515620778
6310.700.0070368539672844
7360.700.0036326505631810
Experiment 2
15.50.400.0031579653743843
28.80.400.0045440539614728
311.60.600.0076449588713860
4160.600.0083366519633793
518.50.700.0064370543684856
6230.700.0044327512647829
Experiment 3
1140.410.0126567637721810
2160.400.0130526601679772
3180.600.0102518626748868
4200.600.0118446568679809
5230.700.0113438586724868
6270.700.0160314479588767
Experiment 4
160.430.0087602664764839
29.50.700.0087474586746869
313.50.700.0097374517666807
4160.900.0077383547756905
518.50.900.0083315508710873
Experiment 5
180.700.0116381551693841
211.90.700.0124311473608772
312.40.700.0142311477604776
4130.700.0169312480596776
513.40.700.0209313485589787
Experiment 6
1230.400.0132477560636722
2280.600.0097437591725832
3340.800.0091438579757885
4430.800.0125309478626790
Experiment 7
1130.400.0071525557647719
2220.600.0073392489625731
3290.700.0067399498660769
4350.700.0084307442586736
5390.900.0058315471687813
Table 9. Heat losses from the unit at various steady-state operating points.
Data PointFlow Rate m3/sMole %
Methane
Combustion Energy, WΔT
Obs.
ΔT
Adi.
Heat Loss, W% Loss
Experiment 1
10.00820.4010737310734032
20.00960.4012498810722118
30.00720.60141413216025018
40.00700.60136814116016612
50.00760.62152514716617211
60.00700.7016001711871389
70.00360.70821179187364
Experiment 2
10.00310.403977410712231
20.00450.4059198107498
30.00760.60148913916019913
40.00830.601626153160755
50.00640.7014671731871118
60.00440.701000185187111
Experiment 3
10.01260.4116857011060936
20.01300.4016997510750730
30.01020.60199110816065033
40.01180.60230312216055124
50.01130.70257014818753721
60.01600.70364916518743212
Experiment 4
10.00870.4312246211556446
20.00870.7019809318799650
30.00970.70221614318752324
40.00770.90227316424172332
50.00830.90244419324148320
Experiment 5
10.01160.70264216918725610
20.01240.70283216218738013
30.01420.70322716618736411
40.01690.70386616818739510
50.02090.7047631721873858
Experiment 6
10.01320.4017258310738622
20.00970.601893154160764
30.00910.80237214021481935
40.01250.80325416921468321
Experiment 7
10.00710.409253210764870
20.00730.6014279716056440
30.00670.7015369918772347
40.00840.70191213518753328
Table 10. The experimentally determined values of the constant FUA for the steady-state points of the seven experiments. The values predicted by Equation (20) are also shown.
Data
Point
LMTD
K
Flow Rate m3/sq Inlet
W
q Outlet
W
q Mean
W
FUA
Exp
FUA
Model
Experiment 1
185.10.008215271803166519.616.8
296.60.009618422053194720.218.9
3137.20.007221502235219316.015.3
4146.40.007021232212216814.814.9
5152.40.007623192420237015.515.8
6171.40.007025992607260315.215.0
7179.10.00361340133813397.59.3
Experiment 2
186.10.00316107076587.68.4
2105.90.0045962104910069.510.9
3142.30.007624492521248517.515.9
4156.60.008327052773273917.517.0
5172.50.006424552455245514.214.0
6183.00.00441709169617039.310.7
Experiment 3
179.00.012623752649251231.823.2
283.40.013024302714257230.823.7
3114.20.010228533007293025.719.8
4125.80.011833463460340327.122.0
5146.20.011339173868389326.621.3
6172.00.016053535612548331.927.6
Experiment 4
168.20.008717201863179126.317.6
2117.50.008728822996293925.017.5
3141.70.009734563439344824.319.1
4156.20.007735243372344822.116.1
5177.00.008340173707386221.817.0
Experiment 5
1158.40.011644044107425526.921.7
2163.40.012444994529451427.622.9
3168.50.014250515156510330.325.2
4174.20.016958576107598234.328.7
5184.90.020970297678735339.833.4
Experiment 6
185.00.013225732615259430.524.0
2129.10.009734032845312424.219.0
3134.10.009135373394346525.818.1
4166.30.012548174738477728.723.0
Experiment 7
148.90.007110571401122925.115.1
2101.90.007320722149211120.715.4
3103.80.006721362220217821.014.5
4142.00.008428543006293020.617.1
5140.70.005826472431253918.013.1
Table 11. The steady-state points of operation used for the analysis of Experiments 1 and 5. The results shown were obtained from CFD analysis of the reactor, assuming that it is perfectly insulated.
Data Point Flow Rate m3/sMole % MethaneSystem Inlet T, KCatalyst Inlet T, K, ExpCatalyst Inlet T K, CFD
Experiment 1
18.23 × 10−30.4575728743
29.58 × 10−30.4475633635
37.23 × 10−30.6447691706
47.00 × 10−30.6395644656
57.55 × 10−30.62368620635
67.02 × 10−30.7368672670
73.60 × 10−30.7326631695
Experiment 5
11.16 × 10−20.70381693655
21.24 × 10−20.70311608580
31.42 × 10−20.70311604575
41.70 × 10−20.70312595563
52.09 × 10−20.70313589545
Disclaimer/Publisher’s Note: The statements, opinions and data contained in all publications are solely those of the individual author(s) and contributor(s) and not of MDPI and/or the editor(s). MDPI and/or the editor(s) disclaim responsibility for any injury to people or property resulting from any ideas, methods, instructions or products referred to in the content.