Article

Mechanical Characteristics and Mechanisms of Destruction of Trapezoidal Sandstone Samples Under Uneven Loading

1
School of Resource & Environment and Safety Engineering, Hunan University of Science and Technology, Xiangtan 411201, China
2
Work Safety Key Laboratory on Prevention and Control of Gas and Roof Disasters for Southern Coal Mines, Hunan University of Science and Technology, Xiangtan 411201, China
3
Hunan Province Key Laboratory of Coal Resources Clean-Utilization and Mine Environment Protection, Xiangtan 411201, China
4
School of Mining and Mechanical Engineering, Liupanshui Normal University, Shuicheng 553004, China
*
Authors to whom correspondence should be addressed.
Processes 2025, 13(4), 1169; https://doi.org/10.3390/pr13041169
Submission received: 2 March 2025 / Revised: 4 April 2025 / Accepted: 9 April 2025 / Published: 12 April 2025

Abstract

:
Predicting rock failure under excavation-induced non-uniform stress remains challenging due to the inability of conventional homogeneous specimens to replicate field-scale stress gradients. A novel trapezoidal sandstone specimen with adjustable top-surface inclinations (S75/S85) is proposed, uniquely simulating asymmetric stress gradients to mimic excavation unloading. Geometric asymmetry combined with multi-scale characterization (CT, SEM, PFC) decouples stress gradient effects from material heterogeneity. The key findings include the following points. (1) Inclination angles > 15° reduce peak strength by 24.2%, transitioning failure from brittle (transgranular cracks > 60) to mixed brittle-ductile modes (2) Stress gradients govern fracture pathways: transgranular cracks dominate high-stress zones, while intergranular cracks propagate along weak cementation interfaces. (3) PFC simulations reveal a 147% stress disparity between specimen sides and validate shear localization angles θ = 52° ± 3°), aligning with field data. This experimental–numerical framework resolves limitations of traditional methods, providing mechanistic insights into non-uniform load-driven failure. The methodology enables targeted support strategies for deep asymmetric roadways, including shear band mitigation and plastic zone reinforcement. By bridging lab-scale tests and engineering stress states, the study advances safety and sustainability in deep roadway excavation.

1. Introduction

Roadway engineering, serving as a critical infrastructure in mining and underground construction, faces escalating challenges due to the increasing demand for deep resource exploitation and urban underground space utilization [1]. Globally, the stability of surrounding rock under high-stress conditions has drawn significant attention, particularly in countries with intensive mining activities, such as Australia [2], Canada [3], China [4], and South Africa [5]. International studies have extensively explored the mechanical behavior of rock masses under complex loading scenarios, yet gaps persist in understanding the degradation mechanisms of partially damaged roadways under non-uniform stress fields.
In recent decades, researchers worldwide have emphasized the role of stress redistribution in rock failure. For instance, studies by Hoek and Brown [6] on empirical failure criteria for jointed rock masses laid the foundation for analyzing rock strength anisotropy. Meanwhile, advanced numerical methods, such as the Discrete Element Method (DEM) [7] and Particle Flow Code (PFC) [8], have been widely adopted to simulate crack propagation and stress evolution in heterogeneous media. However, these models often simplify boundary conditions, neglecting the geometric asymmetry inherent in practical engineering scenarios like inclined roadways or trapezoidal cross-sections.
Traditional rock mechanics approaches, predominantly reliant on homogeneous specimen testing, fail to capture the intrinsic heterogeneity of natural rocks—such as random microcracks, porosity variations, and mineralogical discontinuities—that govern fracture propagation and stress redistribution [9,10,11,12,13,14]. Recent advancements in multi-scale numerical modeling and high-resolution experimental characterization have revolutionized our ability to decode the interplay between microscopic heterogeneity and macroscopic failure, positioning this field at the forefront of geomechanics research [15]. Similarly, Ju et al. [16] investigated the transition from elastic to plastic deformation in fractured rock using high-resolution CT scanning, highlighting the importance of localized damage in progressive failure. Gomes [17] discussed the influence of anisotropy on the overall strength of rocks and proposed the Hoek Brown (HB) failure criterion for calculating strength anisotropy using non-uniform scaling of stress tensors. Despite these advancements, most laboratory tests remain constrained to homogeneous specimens, failing to replicate the gradient stress states induced by excavation unloading or structural discontinuities.
Recent advancements in numerical modeling techniques, particularly the discrete element method (DEM), have facilitated a more detailed analysis of rock mechanics. For instance, studies have employed the Particle Flow Code (PFC) to simulate the mechanical responses of rocks under various loading conditions. Song et al. [18] utilized a coupled FLAC3D/PFC3D model to replicate stress-controlled loading scenarios, demonstrating the model’s capability to accurately reproduce stress–strain relationships and acoustic emission behaviors during rock deformation. Jin et al. [19] focused on the strain rate field of rock to identify failure precursors, revealing statistical correlations between microcrack increments and strain rate data. Cui et al. [20] combined laboratory experiments with PFC simulations to analyze the failure processes of granite and sandstone under varying confining pressures, illustrating the effectiveness of numerical methods in characterizing the mechanical properties of rocks and understanding the initiation and propagation of micro-cracks during failure.
This study bridges these gaps by proposing a novel laboratory method to simulate non-uniform loading using trapezoidal sandstone specimens with adjustable top-surface inclinations. Integrating strain monitoring, CT-based defect characterization, and PFC simulations, we systematically analyze stress–strain evolution, shear stress redistribution, and damage localization under gradient axial loads. The research not only addresses the limitations of conventional homogeneous testing but also provides a mechanistic framework to interpret field observations in deep roadways, such as asymmetric fracture propagation and residual strength variability. By aligning with international efforts to enhance rock mechanics modeling and experimental realism, this work contributes to global knowledge on sustainable underground engineering in high-stress environments.

2. Compression Test

The open space created by tunnel excavation leads to stress concentration and failure near the tunnel’s surrounding rock, resulting in the redistribution and transfer of the stress field. As the stress in the surrounding rock around the tunnel changes, the surface rock mass exceeds its elastic limit and gradually enters a plastic stress state. Consequently, four distinct failure zones emerge successively from the tunnel surface towards the deeper sections of the surrounding rock, as illustrated in Figure 1.
To simulate the characteristics of surrounding rock load and rock fragmentation zones during the excavation and unloading process of a tunnel, uniaxial compression tests were conducted on sandstone specimens with trapezoidal cross-sections (as shown in Figure 2a), thereby achieving non-uniform load failure of a single rock block.
Developed by the Institute of Rock and Soil Mechanics, Chinese Academy of Sciences (Wuhan, China), the RMT-150C Rock Mechanics Test System was utilized to apply axial pressure to the specimens as documented in Figure 2b. The loading process was controlled by load, with a loading rate of 0.05 kN/s, and continued until the specimen failed. The D3816N real-time strain acquisition system was employed to monitor the specimens’ strain. The BX120-3AA strain gauge is a single-piece sensor designed for concrete strain measurement. It features a resistance of 120 ± 1 Ω, base and grid dimensions of 8 × 5 mm and 3 × 3 mm, and operates at 3–10 V bridge voltage. The key specifications include a sensitivity coefficient of 2.0 ± 1%, a strain limit of 20,000 µm/m, and a temperature range of −30 °C to 60 °C. Constructed with a Constantan base and phenolic–epoxy grid, it employs silver-plated leads. Given the variation in axial load across the horizontal direction of the specimens, electrical resistance strain gauges were evenly distributed horizontally at points 1, 2, 3, and 4 (x = 20, 40, 60, 80) on the specimen’s side, as illustrated in Figure 2a. Furthermore, due to the varying heights of the specimens’ right sides, the strain gauges were attached at the vertical center of the right side. A schematic diagram of the inclined specimens and their loading system is presented in Figure 2b.
The stress–strain curve of rock indicates that each stage of rock deformation corresponds to a different stress level. During the deformation of rock material, the relationship between the compression amount ∆l, the initial height l of the rock material, and the strain ε is given by ε = ∆l/l.
Taking the left side as x = 0 and the right side as x = 100 in terms of distance, the strain at each cross-section is as follows:
ε x = Δ l l x tan α ,
where εx represents the axial strain within the cross-section at position x, and α denotes the inclination angle of the top surface.
At this point, the axial load distribution of the inclined specimen varies with the inclination angle, and the axial stress σx at each cross-section is as follows:
σ x = F tan α ( l x tan α ) ln ( 1 1 tan α ) ,
where F represents the resultant axial force, which can be expressed as follows:
F = 0 100 σ x d x
This yields the variation pattern of axial stress as shown in Figure 3a.
Based on the stress—strain curve of standard specimen, two types of inclined specimens were designed: one where the left side is in plastic deformation when the right side fails, and the other where the left side remains in elastic deformation when the right side fails. The height of the left side was set at 100 mm, corresponding to a strain ε of 0.125% at the strain yield point. At this point, the compression amount Δl is 0.125 mm. By substituting εc = 0.156% into the equation for the right side, the critical height l’ of the right side was calculated to be 80.1 mm. Under these conditions, ignoring any internal influences within the specimen, the left side enters plastic deformation simultaneously with the failure of the right side. Conversely, if the height of the right side is greater than 80.1 mm, the left side will be in plastic deformation when the right side fails; if the height of the right side is less than 80.1 mm, the left side will remain in elastic deformation when the right side fails.
Therefore, specimens with right side heights of 75 mm and 85 mm (denoted as S75 and S85, respectively) were selected for testing. As shown in Figure 3b,c, when the right side of each specimen reached its peak strain, the left side of the S75 specimen was in the elastic deformation stage, while the left side of the S85 specimen was in the plastic deformation stage.

3. Microscopic Characteristics

During the compression process of inclined specimens, the strain difference between vertical sections of the specimens can lead to significant stress concentrations within the specimens. At this point, even minor defects within the specimens can cause abrupt changes in the overall strength of the specimens. To ensure the homogeneity of the specimens, CT scanning with a resolution of 1024 was employed to scan the processed specimens. Specimens with poor internal structural homogeneity were selected and discarded. This technique enables multi-scale, non-destructive detection of internal information within the rock cores and has been widely applied in areas such as characterizing rock fracture development features and pore structures.
Figure 4 presents the 3D morphology of a sandstone sample observed through CT scanning. The quality of this image is influenced not only by the material’s density and moisture content but also by the intensity parameters of the X-rays. The CT value is a crucial parameter in CT scanning, as adjusting the X-ray intensity allows for the observation of substances with varying densities. Figure 4 left illustrates the sample’s morphology at a low CT value, while Figure 4 right shows it at a high CT value. To visualize the minerals (yellow portions) and cementing materials (black portions) within the sandstone sample under 3D conditions, the X-ray intensity was set to a level that allowed penetration through the entire sample. However, due to differences in moisture content between the edges and the center of the sample, the edges may appear blurred in the image.
For a more reliable assessment, the CT scan results of the sample were sliced for further analysis [21]. CT scanning enables imaging of cross-sectional slices of the sample at every 2 mm interval. To gain deeper insights and evaluate the internal structure of the sandstone sample, CT scan slices were extracted at every 10 mm interval and processed through binarization. Images with a resolution of 1024 pixels provide a clear representation of the sandstone material’s structural characteristics. Figure 5 displays the sliced images of a uniformly textured sandstone sample, offering a direct view of its internal structural morphology. This allows for the identification and exclusion of samples with evident cracks or defects.
Figure 6 shows the results of scanning electron microscopy (SEM) at the sandstone fracture surface. The SEM analysis of sandstone fracture surfaces at magnifications ranging from 500× to 20,000× reveals a complex interplay of brittle and ductile fracture mechanisms, governed by mineralogical heterogeneity and localized stress gradients. Three primary crack types are identified: transgranular cracks propagating through quartz and feldspar grains, intergranular cracks following weak cementation interfaces, and microvoids (1–5 μm in diameter) nucleating at grain-cement boundaries. Transgranular cracks dominate (>60% of total crack length), exhibiting straight or zigzag paths (Figure 6c), indicative of high-stress concentration and cleavage activation in hard minerals. Intergranular cracks, characterized by tortuous branches (Figure 6b), reflect shear-induced debonding along clay-rich interfaces. Microvoids, often surrounded by plastic deformation halos (Figure 6f), signify localized tensile stress exceeding cohesive strength.
The fracture mode transitions from brittle-dominated to mixed brittle-ductile with increasing magnification. At low strain (ε < 0.8%), brittle failure prevails, evidenced by conchoidal fractures and minimal plasticity (Figure 6a,b). At higher strain (ε > 1.2%), ductile features emerge, including dimple structures (3–8 μm diameter, Figure 6h) and shear bands (2–10 μm width, Figure 6i), where clay minerals undergo plastic flow. The coexistence of transgranular cracks, intergranular cracks, and microvoids (Figure 6d) underscores a mixed-mode fracture mechanism driven by heterogeneous stress distribution and mineral stiffness contrasts.
Fracture evolution progresses through three stages. Nucleation: Microvoids initiate at weak cementation zones under tensile stress (Figure 6f). Propagation: Transgranular cracks advance through quartz grains, while intergranular cracks bifurcate along clay interfaces (Figure 6c). Coalescence: Shear bands interconnect microvoids and cracks, culminating in macroscopic failure (Figure 6h).
These findings highlight the critical role of mineralogical heterogeneity in governing fracture pathways. The dominance of transgranular cracking suggests that high-stress gradients preferentially activate cleavage in quartz, whereas ductile features in clay-rich regions mitigate catastrophic failure. This dual mechanism provides a microstructure-informed basis for predicting rock instability in deep roadways, emphasizing the need for targeted reinforcement strategies in high-gradient stress zones.

4. Particle Flow Analysis

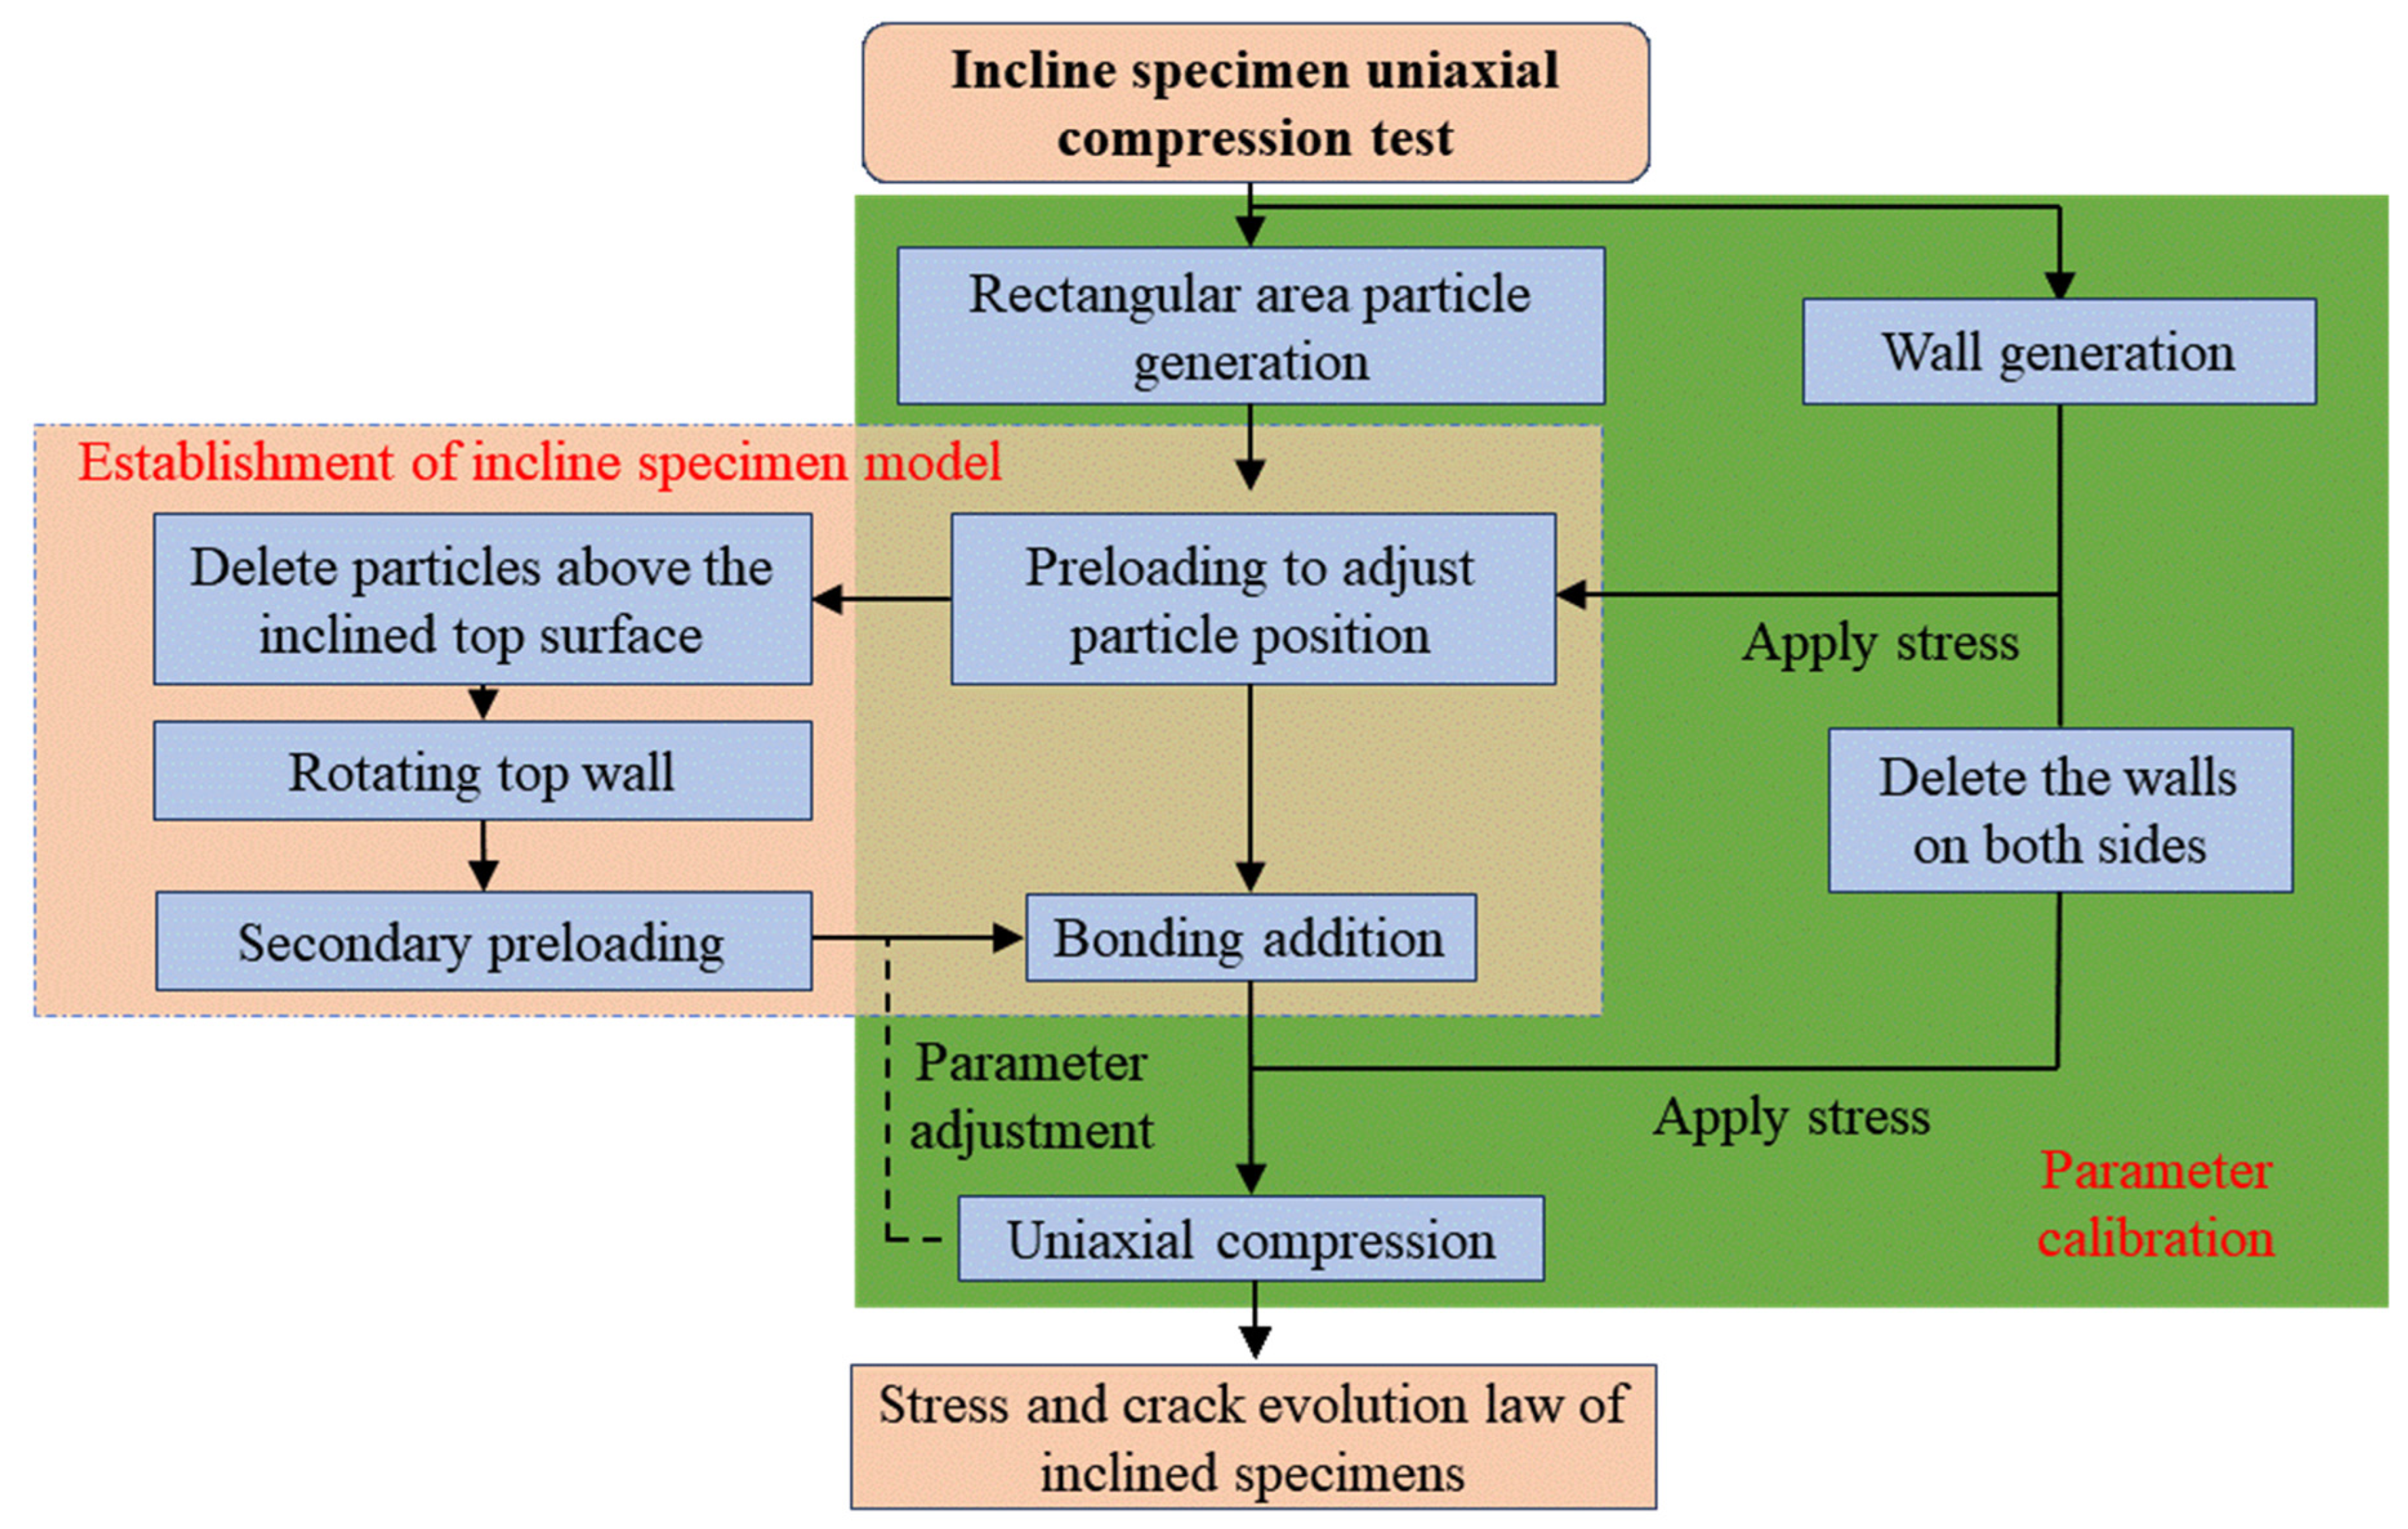
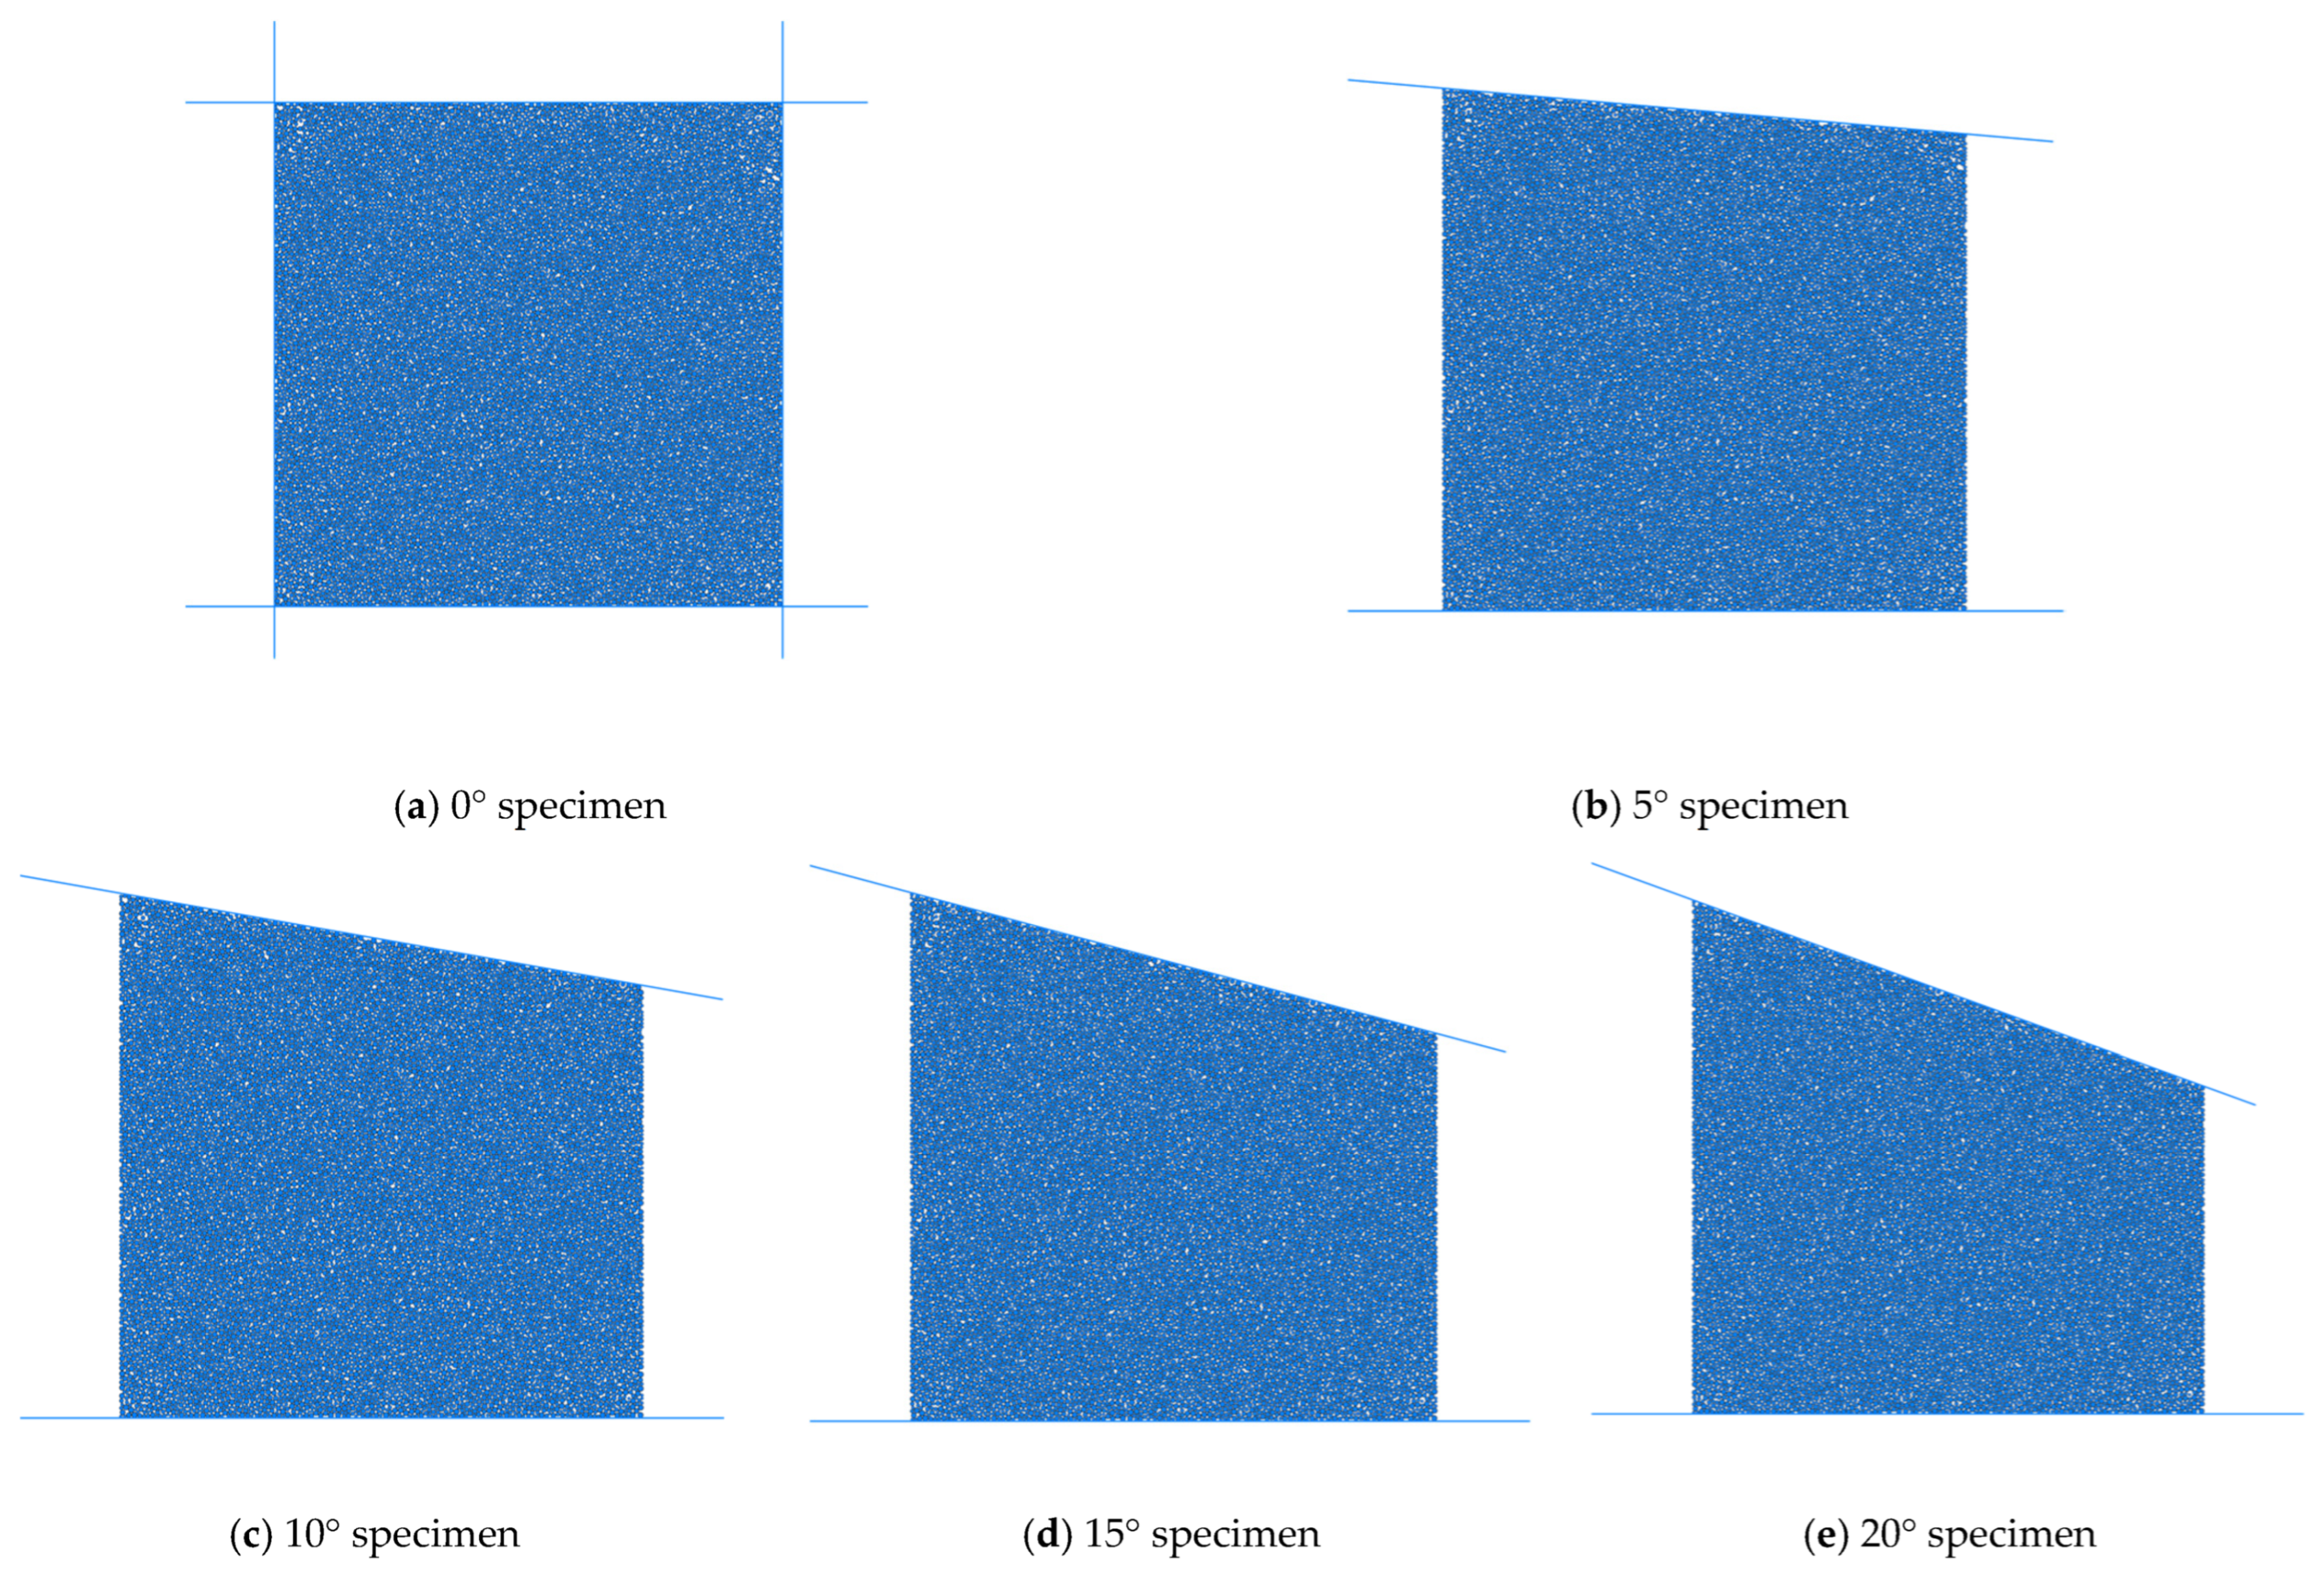
4.1. Establishment of Inclined Specimen Model

The uniaxial compression test for inclined specimens can be divided into two main steps: parameter calibration and modeling of the inclined specimen. Firstly, a standard specimen is established and subjected to uniaxial compression to determine its macroscopic mechanical parameters. Based on these parameters, the mesoscopic parameters of the particles are adjusted to ensure that the simulation results closely approximate those of laboratory experiments. Subsequently, the calibrated mesoscopic parameters are used to establish the model of the inclined specimen. The detailed steps are illustrated in Figure 7.
In this process, the bonding between particles is achieved through parallel bond contact, while the contact between particles and walls is linear. To prevent the specimen from sliding sideways during compression, a friction coefficient of 0.1 is assigned between the walls and the balls. Table 1 presents the mesoscopic parameters of the specimen and the corresponding experimental results.
The calibration of mesoscopic parameters was achieved through iterative adjustments of contact modulus, stiffness ratio, and bond strength to align the simulated elastic modulus (3.86 GPa) and uniaxial compressive strength (63.98 MPa) with experimental values (3.94 GPa and 63.5 MPa, respectively), resulting in a relative error of less than 2.5% (Table 1).
After determining the mesoscopic parameters, the particle located at the top-right corner of the rectangular area is removed, and then the upper wall is rotated to a specific angle. To ensure that the surface of the particles at the top is even and in uniform contact with the upper wall, further pre-compression is necessary before proceeding with the uniaxial compression test. Figure 8 shows the specimen models for angles of 0°, 5°, 10°, 15°, and 20°, respectively.

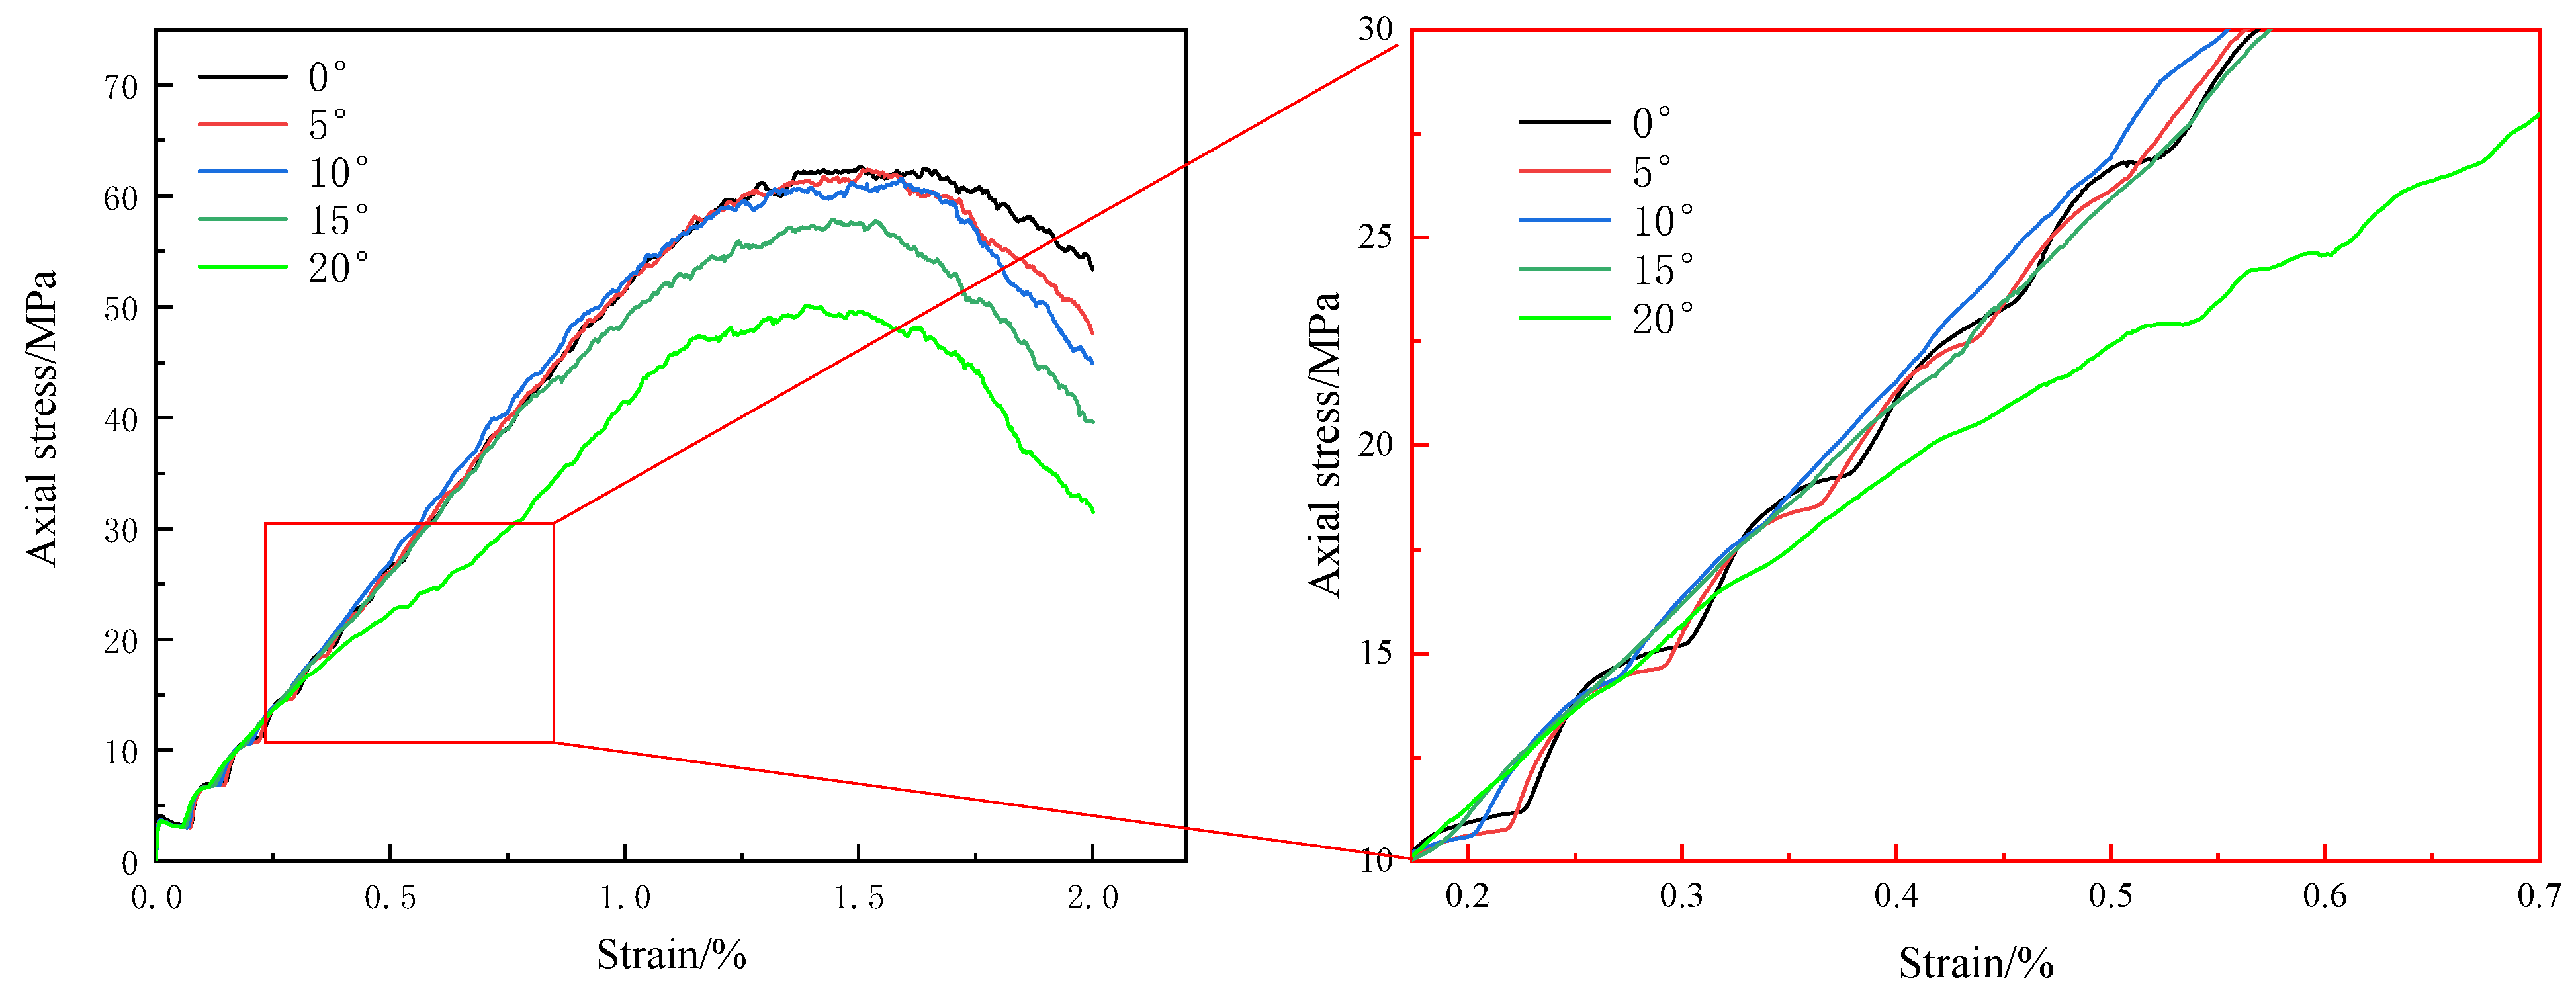
4.2. Mechanical Characteristics of Inclined Specimens

Figure 9 shows the uniaxial compression stress–strain curves of specimens at 0°, 5°, 10°, 15°, and 20°.
Due to the pre-compression process applied to the specimens, the stress–strain curves exhibit no compaction stage. During the compression process, all specimens undergo three stages: elastic deformation, plastic deformation, and post-peak stage.
In the elastic deformation stage, specimens at all angles exhibit elastic behavior, with stress increasing linearly with strain. The elastic modulus of all specimens is approximately 4.71. As the strain increases, the specimens enter the yield stage, where the stress growth slows down. The yield stress varies among specimens of different angles, with the 0° specimen having the highest yield stress, gradually decreasing to the lowest in the 20° specimen.
Each curve reaches a peak stress point, representing the uniaxial compressive strength at that angle. The 0° specimen exhibits the highest peak stress, and as the angle increases, the peak stress gradually decreases, indicating that the increase in angle weakens the load-bearing capacity of the specimens.
In the post-peak stage, each curve tends to stabilize, exhibiting a certain level of residual stress. The 0° specimen has the highest residual stress, while the 20° specimen has the lowest, suggesting that an increase in angle leads to a reduction in the residual stress of the specimens.
As the inclination angle increases, the peak strength exhibits a progressive decline, from σc ≈ 63.5 MPa for the 0° specimen to σc ≈ 48.2 MPa for the 20° specimen. This reduction is attributed to stress localization near the shorter face, where geometric asymmetry amplifies axial stress gradients and reduces the effective load-bearing area. Post-peak behavior transitions from brittle failure (sharp stress drops at 0–10°) to ductile-like responses (gradual softening at 15–20°), with residual strength increasing to 18.6 MPa. Notably, the elastic modulus remains stable (E ≈ 4.7 GPa), indicating that inclination primarily governs failure modes rather than elastic deformation

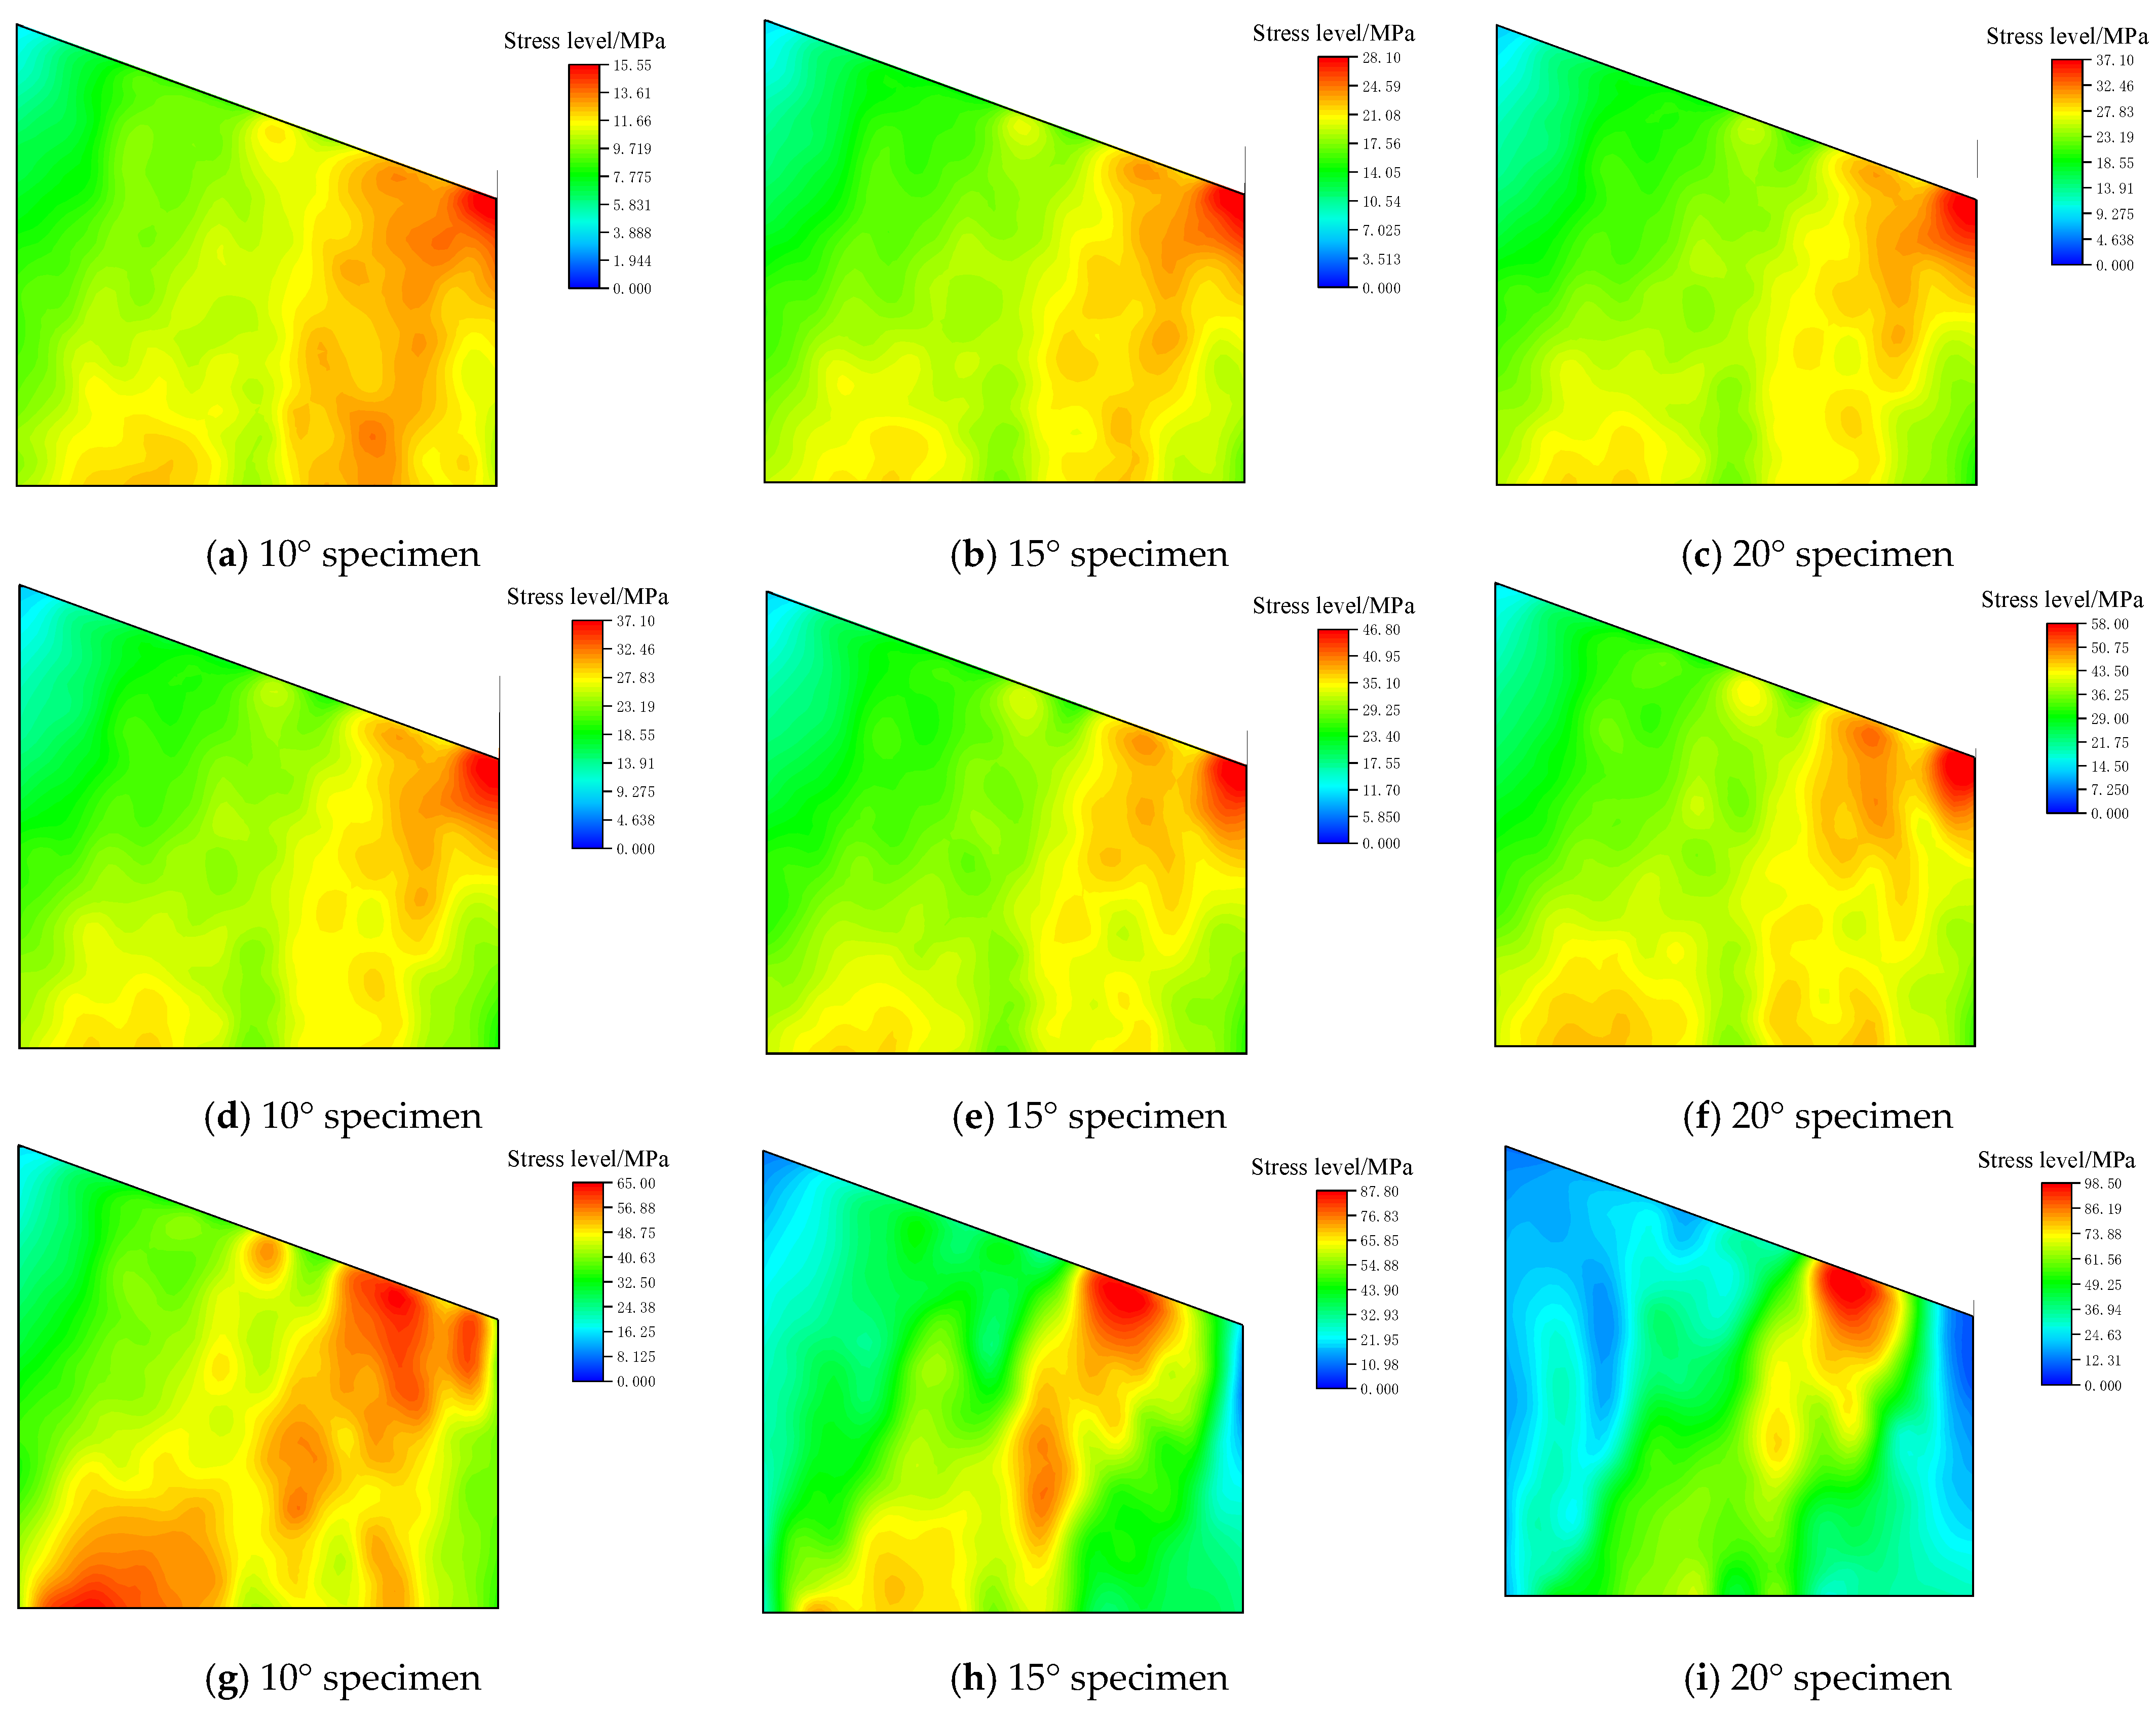
4.3. Stress Distribution Law of Inclined Specimen Loading

Figure 10 illustrates the stress distribution nephograms of rock specimens under uniaxial compression at different dip angles. When the dip angle is 0° (Figure 10a), the stress distribution within the specimen is relatively uniform, indicating a stable stress state. High-stress regions predominantly concentrate in the central vertical zone of the specimen, which is attributed to the boundary effect—stress redistribution from the unconfined lateral sides toward the central region. As the dip angle increases to 5° (Figure 10b), the stress distribution pattern begins to shift, with stress concentrations emerging at the top-right and bottom-left corners, while the central stress magnitude decreases. This suggests that the dip angle starts to influence stress redistribution mechanisms.
At a dip angle of 10° (Figure 10c), the stress distribution undergoes more pronounced changes: stress concentrations intensify at the top and bottom regions, accompanied by a further reduction in central stress. This highlights the significant role of dip angle in altering stress localization. When the dip angle reaches 15° (Figure 10d), the stress distribution exhibits a distinct diagonal pattern, with high-stress zones concentrated along oblique diagonals and a notable decrease in stress at the bottom. This reflects a fundamental shift in stress transmission pathways due to structural plane orientation. Finally, at a dip angle of 20° (Figure 10e), the stress distribution becomes highly asymmetric, with nearly all high-stress regions localized at the top-right portion of the specimen, while the bottom region remains almost stress-free. These observations underscore the dominant control of dip angle over stress distribution patterns, particularly in governing stress concentration and transfer mechanisms under uniaxial loading conditions. Furthermore, variations in dip angle not only dictate stress distribution but also profoundly influence the failure morphology of the rock, as the migration of stress concentration zones under higher dip angles promotes shear-dominated or tensile-dominated fracture propagation depending on structural plane interactions.
The sequential stress distribution patterns of the inclined specimen under uniaxial compression, captured at nine strain levels (ε = 0.2% to 1.8%), reveal distinct evolutionary phases (Figure 11). In the initial elastic regime (ε = 0.2–0.4%, Figure 11a,b), a pronounced stress concentration emerges at the right-side contact zone (σmax = 37.10 MPa, red region), contrasting sharply with the left-side low-stress region (σ = 15.00 MPa, blue), reflecting a 147% stress disparity. This asymmetry arises from the geometric gradient induced by the specimen’s inclined top surface. The resultant strain amplification (Δε ≈ 17.6%) drives localized stress accumulation.
As strain progresses to ε = 0.6–1.2% (Figure 11c–f), plasticity dominates stress redistribution. The primary high-stress zone (σmax = 64.05 MPa at ε = 1.2%, Figure 11f) propagates leftward along a steep gradient (23.4 MPa/mm), forming an inclined transition band (x = 60–80 mm). Concurrently, a secondary stress concentration (σ = 43.50 MPa) develops at x = 40 mm (arrow in Figure 11f), attributed to shear stress enhancement, which exceeds symmetric specimen values. This dual-stress architecture underscores the role of geometric asymmetry in generating spatially heterogeneous strain fields.
At critical strain levels (ε = 1.6–1.8%, Figure 11h,i), bimodal stress distribution emerges: the right-side stress peak collapses (σ drops from 64.05 MPa to 28.15 MPa, 56% reduction), while residual stress (17.05 MPa) persists on the left (x = 0–20 mm). Fracture initiates diagonally from the right (θ = 52° ± 3°), deviating 15.6% from the Mohr-Coulomb prediction (45°). This discrepancy correlates with an equivalent friction coefficient increment due to normal stress gradients.

4.4. Damage Evolution

Figure 12 presents the variation in rock mechanical properties of specimens with different inclination angles. Based on the method proposed by Khazaei and Hazzard [22], the moment tensor inversion theory is introduced into the PFC acoustic emission (AE) simulation. By monitoring the generation of cracks and calculating the moment tensor using the unbalanced forces of particles at both ends of the fracture, AE events can be identified. Additionally, since the failure within the specimen sometimes results in a series of cracks that interconnect and occur within a short period, it is necessary to monitor whether new cracks are generated in close proximity and within a short timeframe, and to merge them into a single event, ultimately generating an AE event file. To observe the crack evolution pattern, a coordinate grid is established on the model surface to search for the number of cracks near each point, ultimately forming a microcrack hotspot map.
The AE events are correlated with the development of the stress–strain curve. AE events prior to the peak strength contribute to the loss of specimen strength, manifested as fluctuations and a decrease in the slope of the stress–strain curve. Shortly before the specimen ruptures, the frequency of AE events begins to increase, reaching a maximum at the moment of rupture, with a sharp increase in the number of AE events. Subsequently, the fragmented blocks undergo further fracture and friction under compression, leading to concurrent AE events and accelerating the rate of strength reduction in the specimen.
The experiments revealed that the rock mechanical properties of inclined specimens varied significantly with the inclination angle. As the inclination angle increased, the yield stress, peak stress (uniaxial compressive strength), and residual stress of the specimens gradually decreased, while the elastic modulus remained relatively stable. Meanwhile, the crack evolution pattern also changed with the angle, with larger angles resulting in more complex crack networks concentrated near the inclined plane. These findings suggest that the inclination angle significantly affects the stress state, bearing capacity, and fracture behavior of rock specimens under non-uniform loading conditions.
Figure 13 shows the evolution of rock fractures in samples with different inclination angles. As the inclination of the top surface of the specimen increases, notable differences emerge in their mechanical properties and crack propagation laws. For specimens with a 0° inclination, where the top surface is parallel to the loading direction, stress distribution is relatively uniform. Cracks typically initiate from random locations within the specimen and propagate along multiple directions, forming a complex crack network. As the inclination rises to 5° and 10°, stress concentration becomes apparent, and cracks are more likely to initiate and propagate along the inclined direction, potentially due to the more concentrated stress in that direction.
When the inclination further increases to 15° and 20°, significant changes occur in the mechanical behavior of the specimens. Due to the inclination, stress distribution becomes more complex, leading to increased uncertainty in crack initiation and propagation paths. However, it can be observed that cracks tend to propagate perpendicular to the inclination direction, possibly because stress release is easier along this path. Additionally, as the inclination rises, the tensile strength and yield strength of the specimens may gradually decrease, while toughness may exhibit complex trends depending on the material’s microstructure and loading conditions.
In terms of crack propagation rate, it may initially increase and then decrease with rising inclination. At lower inclinations, the stress concentration effect is weaker, resulting in a relatively low crack propagation rate. As the inclination increases to a certain level, the stress concentration effect intensifies, accelerating crack propagation. However, when the inclination becomes too large, the complexity of stress distribution increases, potentially hindering crack propagation and causing the rate to decline.
Crack evolution patterns further highlight the role of inclination. For the 0° specimen, failure is dominated by vertical tensile cracks forming a conical “core”. At moderate angles (5–10°), oblique shear cracks initiate near the shorter face and propagate diagonally, accompanied by secondary microcracks that enhance energy dissipation. At higher angles (15–20°), shear localization becomes pronounced, with continuous shear bands aligning with the inclined plane and granular crushing zones near the shorter face. This transition from tensile- to shear-dominated failure is driven by increased shear stress and altered principal stress orientations, as predicted by the theoretical model.
In summary, the inclination of the top surface of specimens has a pronounced impact on their mechanical properties and crack propagation laws under uniaxial compression. As the inclination varies, the stress distribution, crack initiation and propagation paths, tensile strength, yield strength, and crack propagation rate all exhibit complex trends. These findings are crucial for understanding the mechanical behavior of materials under different loading conditions and provide valuable insights for relevant engineering designs and material selections.

5. Discussion

This study aims to address a critical gap in rock mechanics research: the inability of conventional homogeneous specimens to replicate the gradient stress states encountered in practical engineering scenarios, particularly in deep asymmetric roadways subjected to excavation-induced unloading. Traditional laboratory methods, while effective for analyzing uniform stress fields, fail to capture the complex stress redistribution and localized damage mechanisms inherent to real-world engineering structures. To resolve this limitation, the primary objective was to develop a methodology that bridges the gap between idealized laboratory conditions and field-scale stress gradients, enabling systematic investigation of failure initiation and progression under non-uniform loading.
The core problem tackled here is twofold, namely (1) the lack of experimental tools to isolate geometric asymmetry from material heterogeneity and (2) the absence of mechanistic insights into how stress gradients govern fracture pathways in heterogeneous rocks. By designing trapezoidal specimens with adjustable inclinations, this work successfully decouples geometric effects from intrinsic material properties, allowing stress gradients (up to 23.4 MPa/mm) to be explicitly controlled and analyzed. This approach directly addresses the oversimplification of boundary conditions in existing numerical models and homogeneous specimen tests.
These outcomes advance rock mechanics by providing a validated experimental–numerical protocol to analyze non-uniform load effects, overcoming the limitations of conventional methods. Practically, the findings offer actionable criteria for optimizing support systems in deep roadways, such as targeted reinforcement of high-stress zones and shear band mitigation. Future work should extend this framework to cyclic loading and multi-physical coupling to further enhance its predictive capability for complex underground environments.
While this study focuses on methodological advancements in simulating non-uniform stress fields, detailed quantitative characterization of the sandstone’s mineral composition, porosity, or grain size was beyond the scope. Future work should prioritize integrating advanced mineralogical mapping (e.g., XRD, EDS) and high-resolution image analysis to quantify microstructural heterogeneity. Such data will strengthen correlations between material properties and failure mechanisms, enhancing predictive models for rock instability under complex loading conditions.

6. Conclusions

This study advances the understanding of roadway surrounding rock stability under non-uniform stress fields through an integrated experimental–numerical framework. By innovatively designing trapezoidal sandstone specimens with variable inclination angles and employing multiscale characterization techniques, we systematically decoupled the interplay between geometric asymmetry, stress gradients, and mineralogical heterogeneity in governing rock failure mechanisms. These findings not only enrich fundamental rock mechanics theories but also provide actionable criteria for optimizing support systems in deep asymmetric roadways, addressing global challenges in sustainable underground resource exploitation.
  • By adjusting top-surface inclination angles and employing customized rigid loading plates, gradient-based non-uniform loading on intact rock specimens was successfully achieved. Experimental and theoretical analyses confirm that this method effectively simulates asymmetric stress fields induced by excavation unloading, establishing a new paradigm for studying constitutive relationships in surrounding rock mechanics.
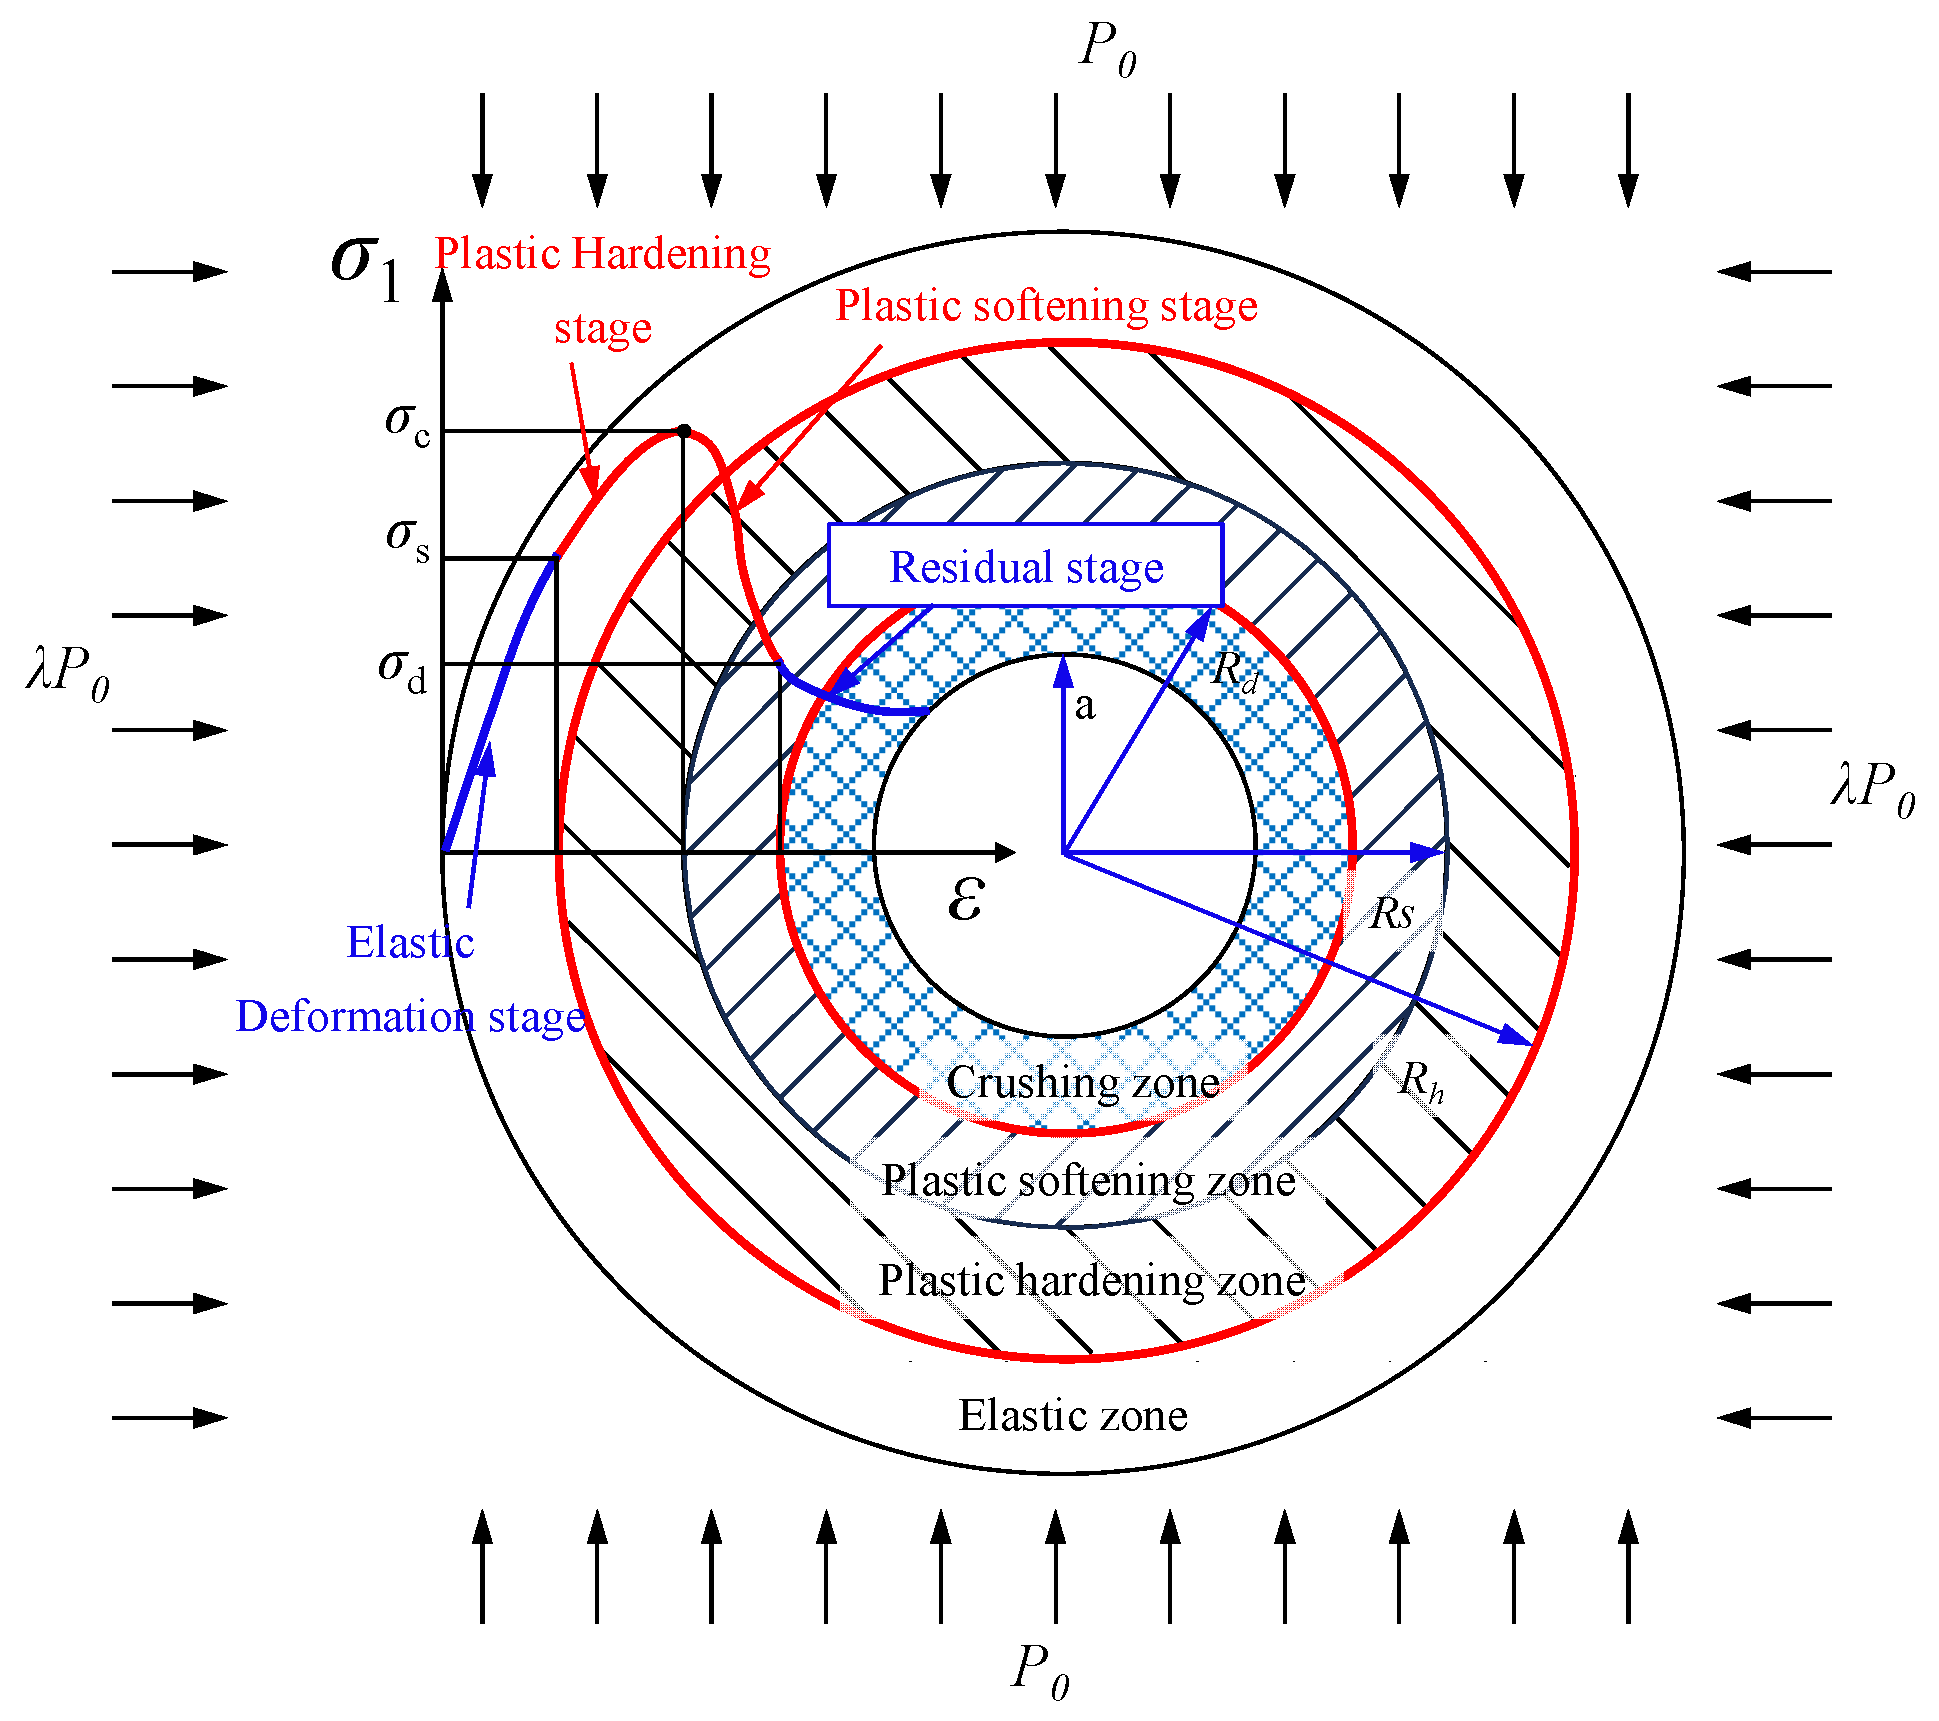
  • Increasing inclination angles critically alter stress states and failure patterns. For S75 specimens, the left flank remains elastic during failure, while S85 specimens exhibit plastic hardening, highlighting stress gradient-driven expansion of plastic softening zones (38% larger in 20° specimens compared to 0°). PFC simulations further reveal that inclination amplifies shear stress contributions (up to 67%), shifting failure modes from vertical tensile fracturing (0°) to oblique shear localization (20°, θ = 52° ± 3°).
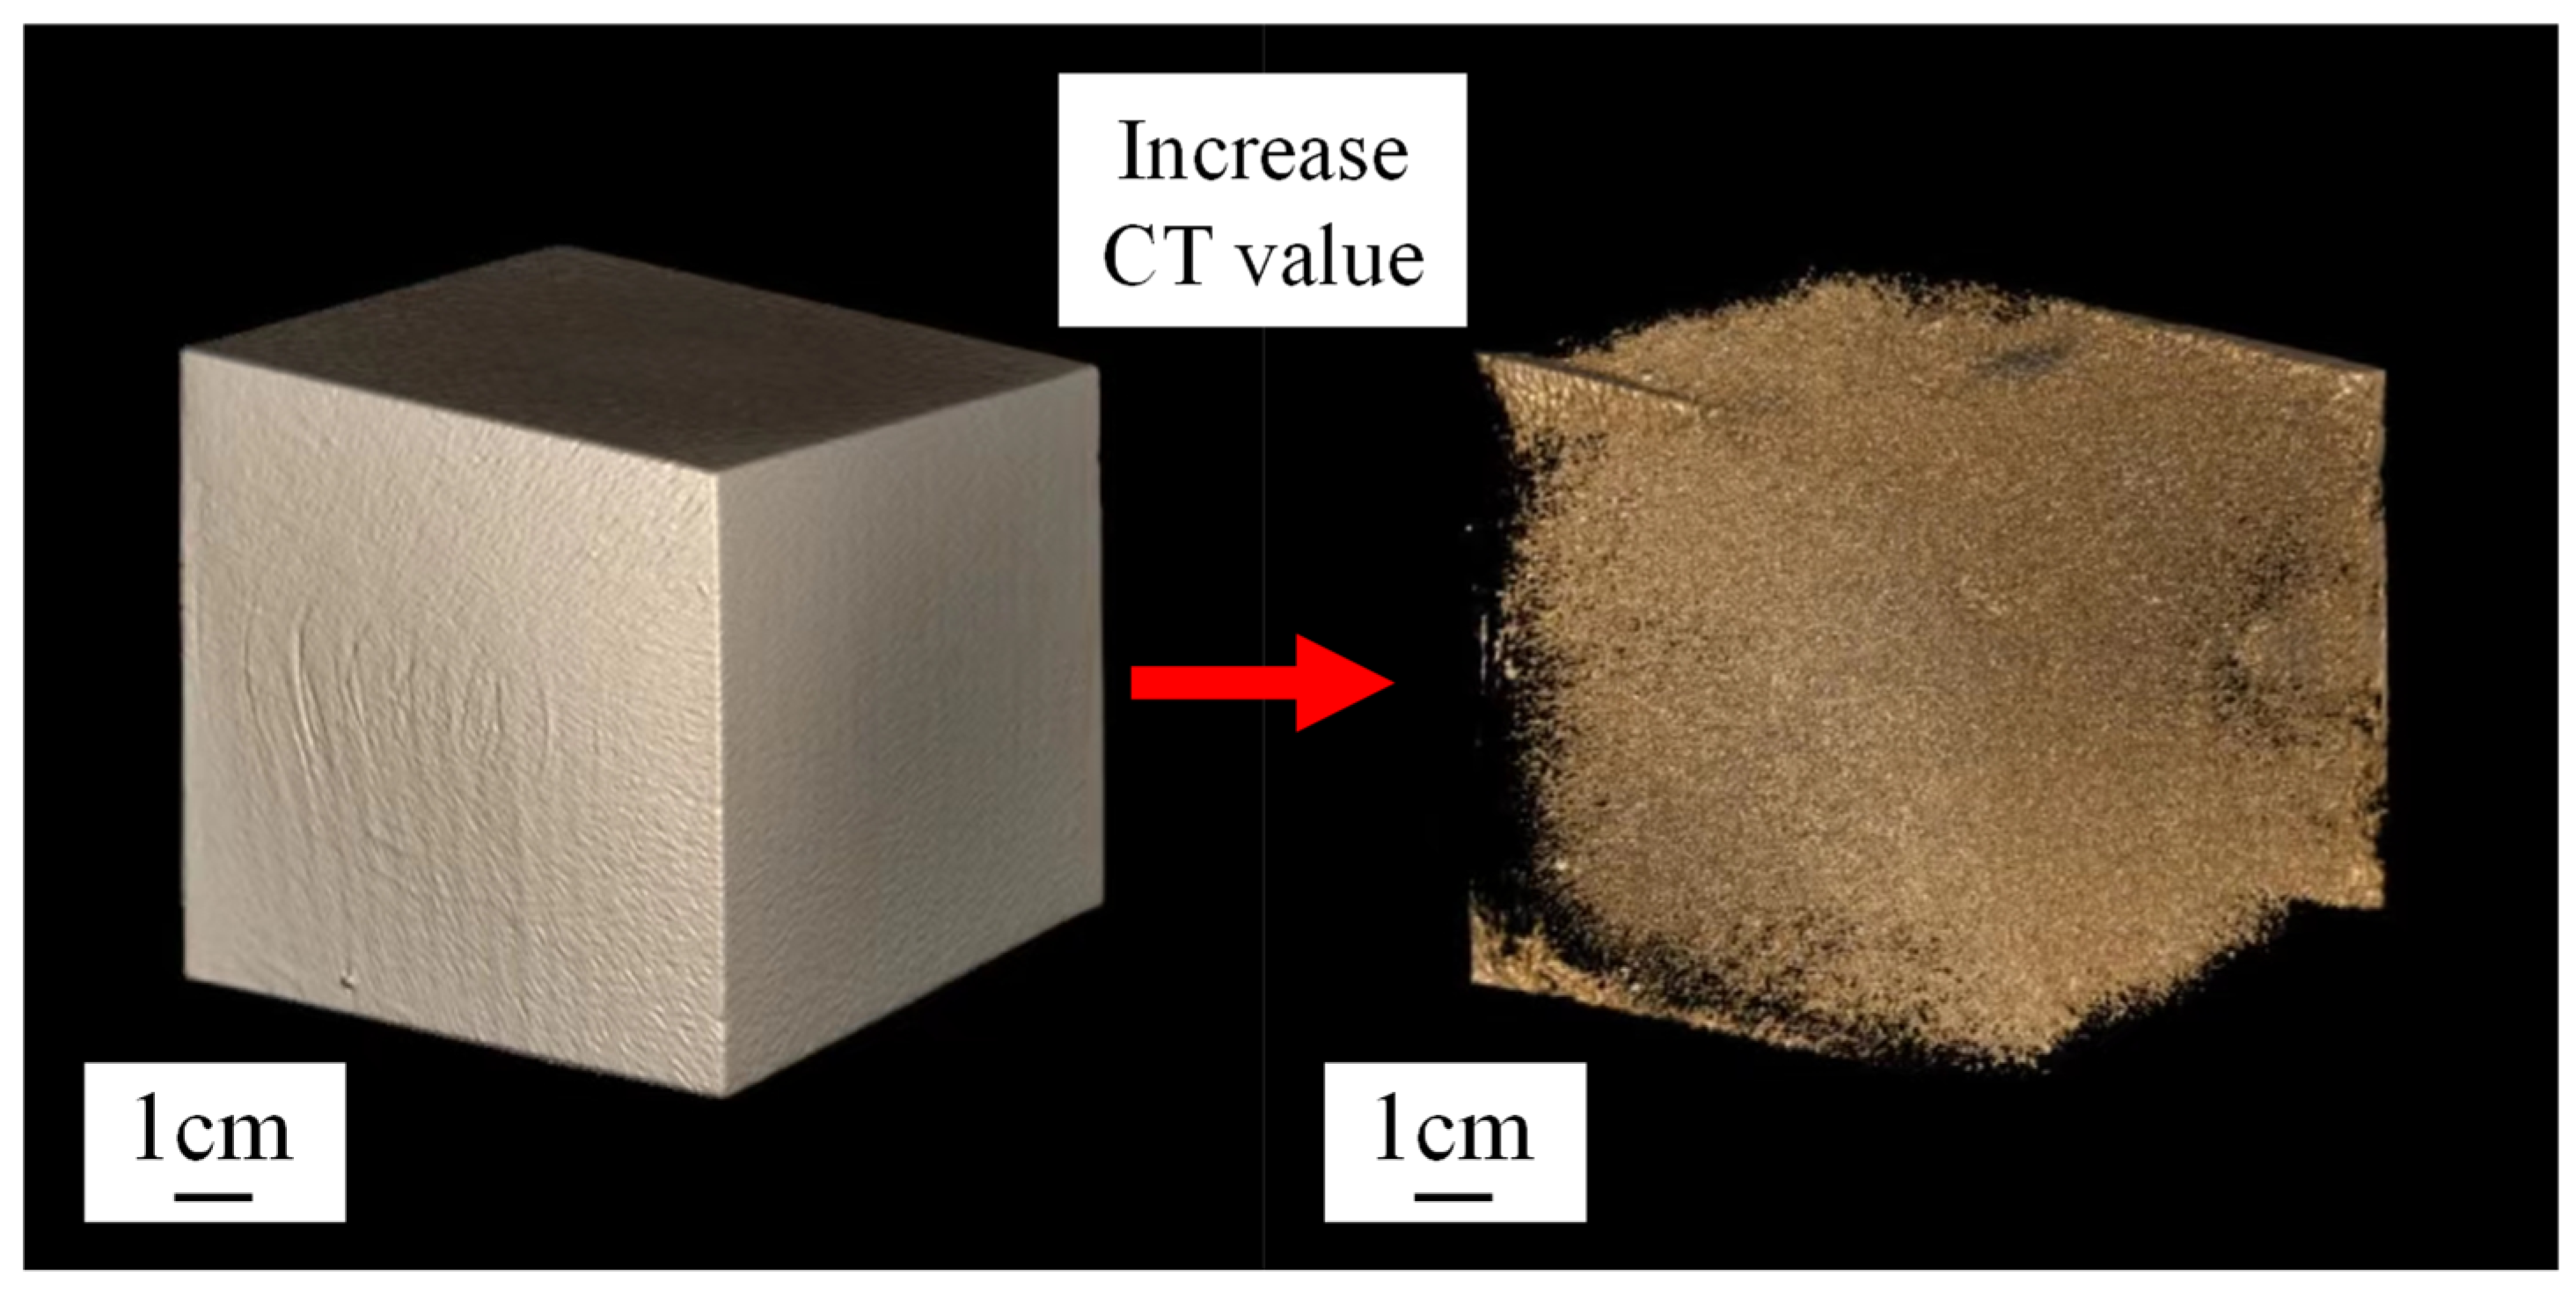
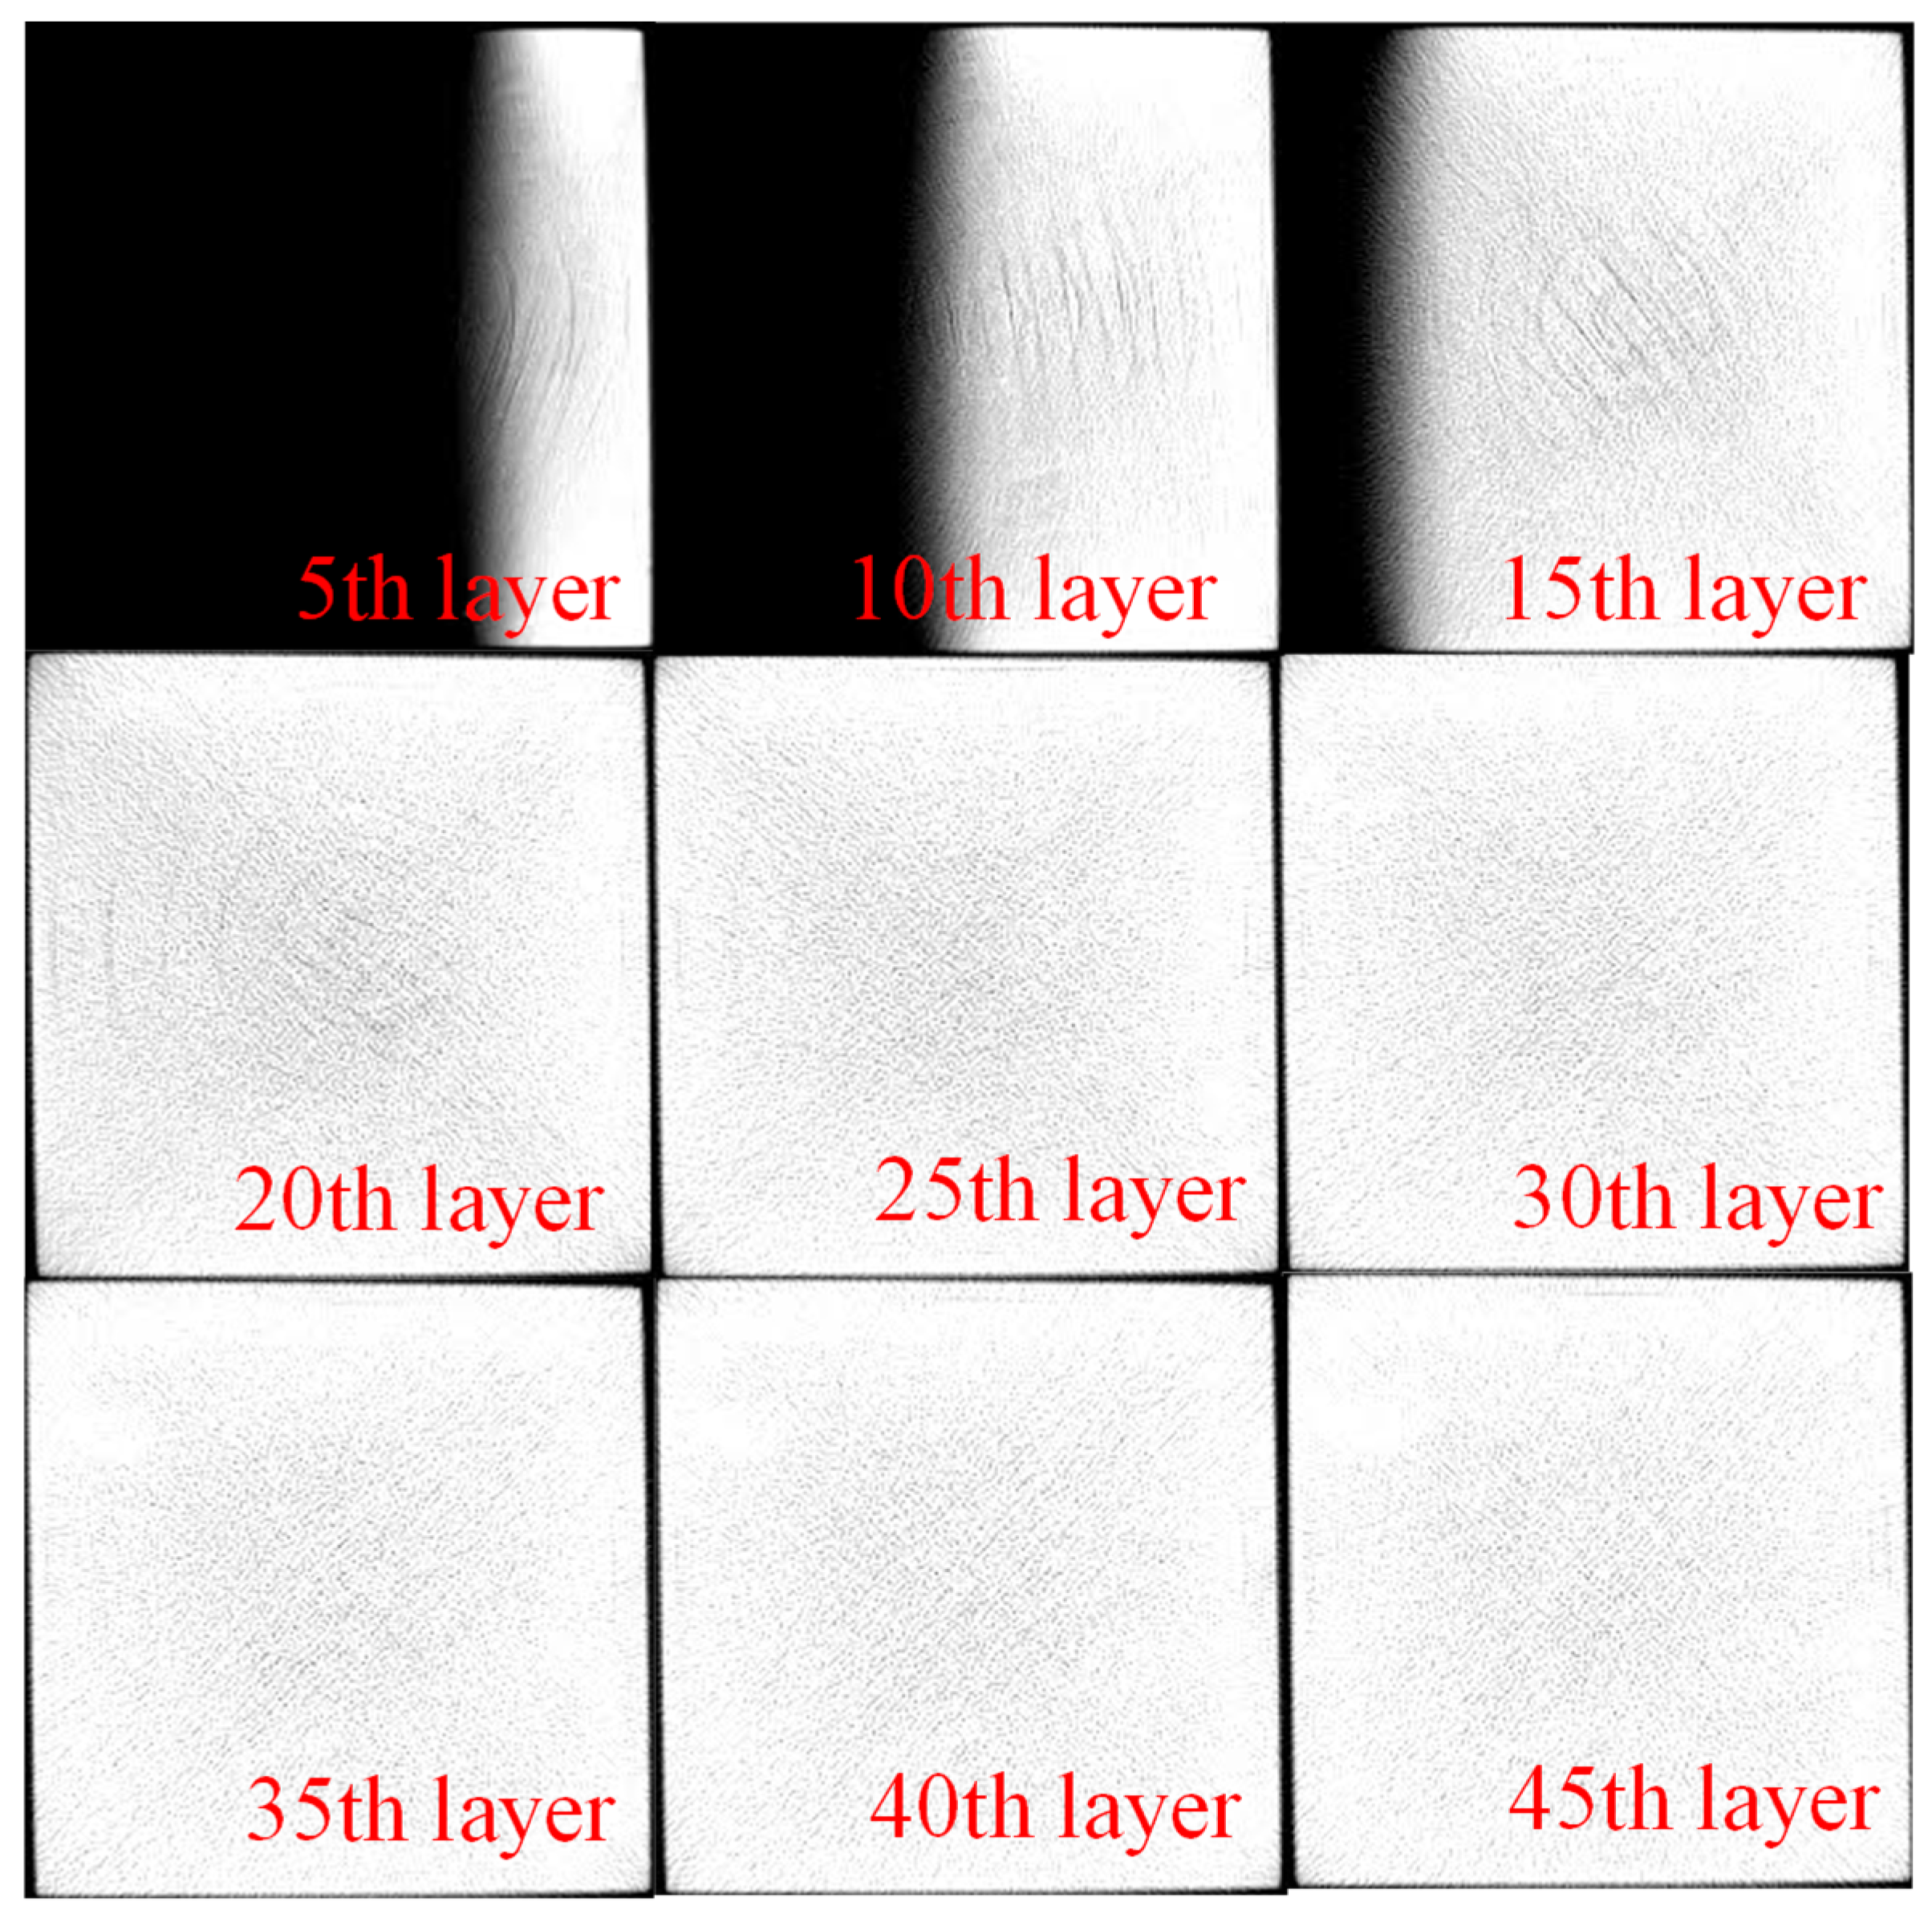
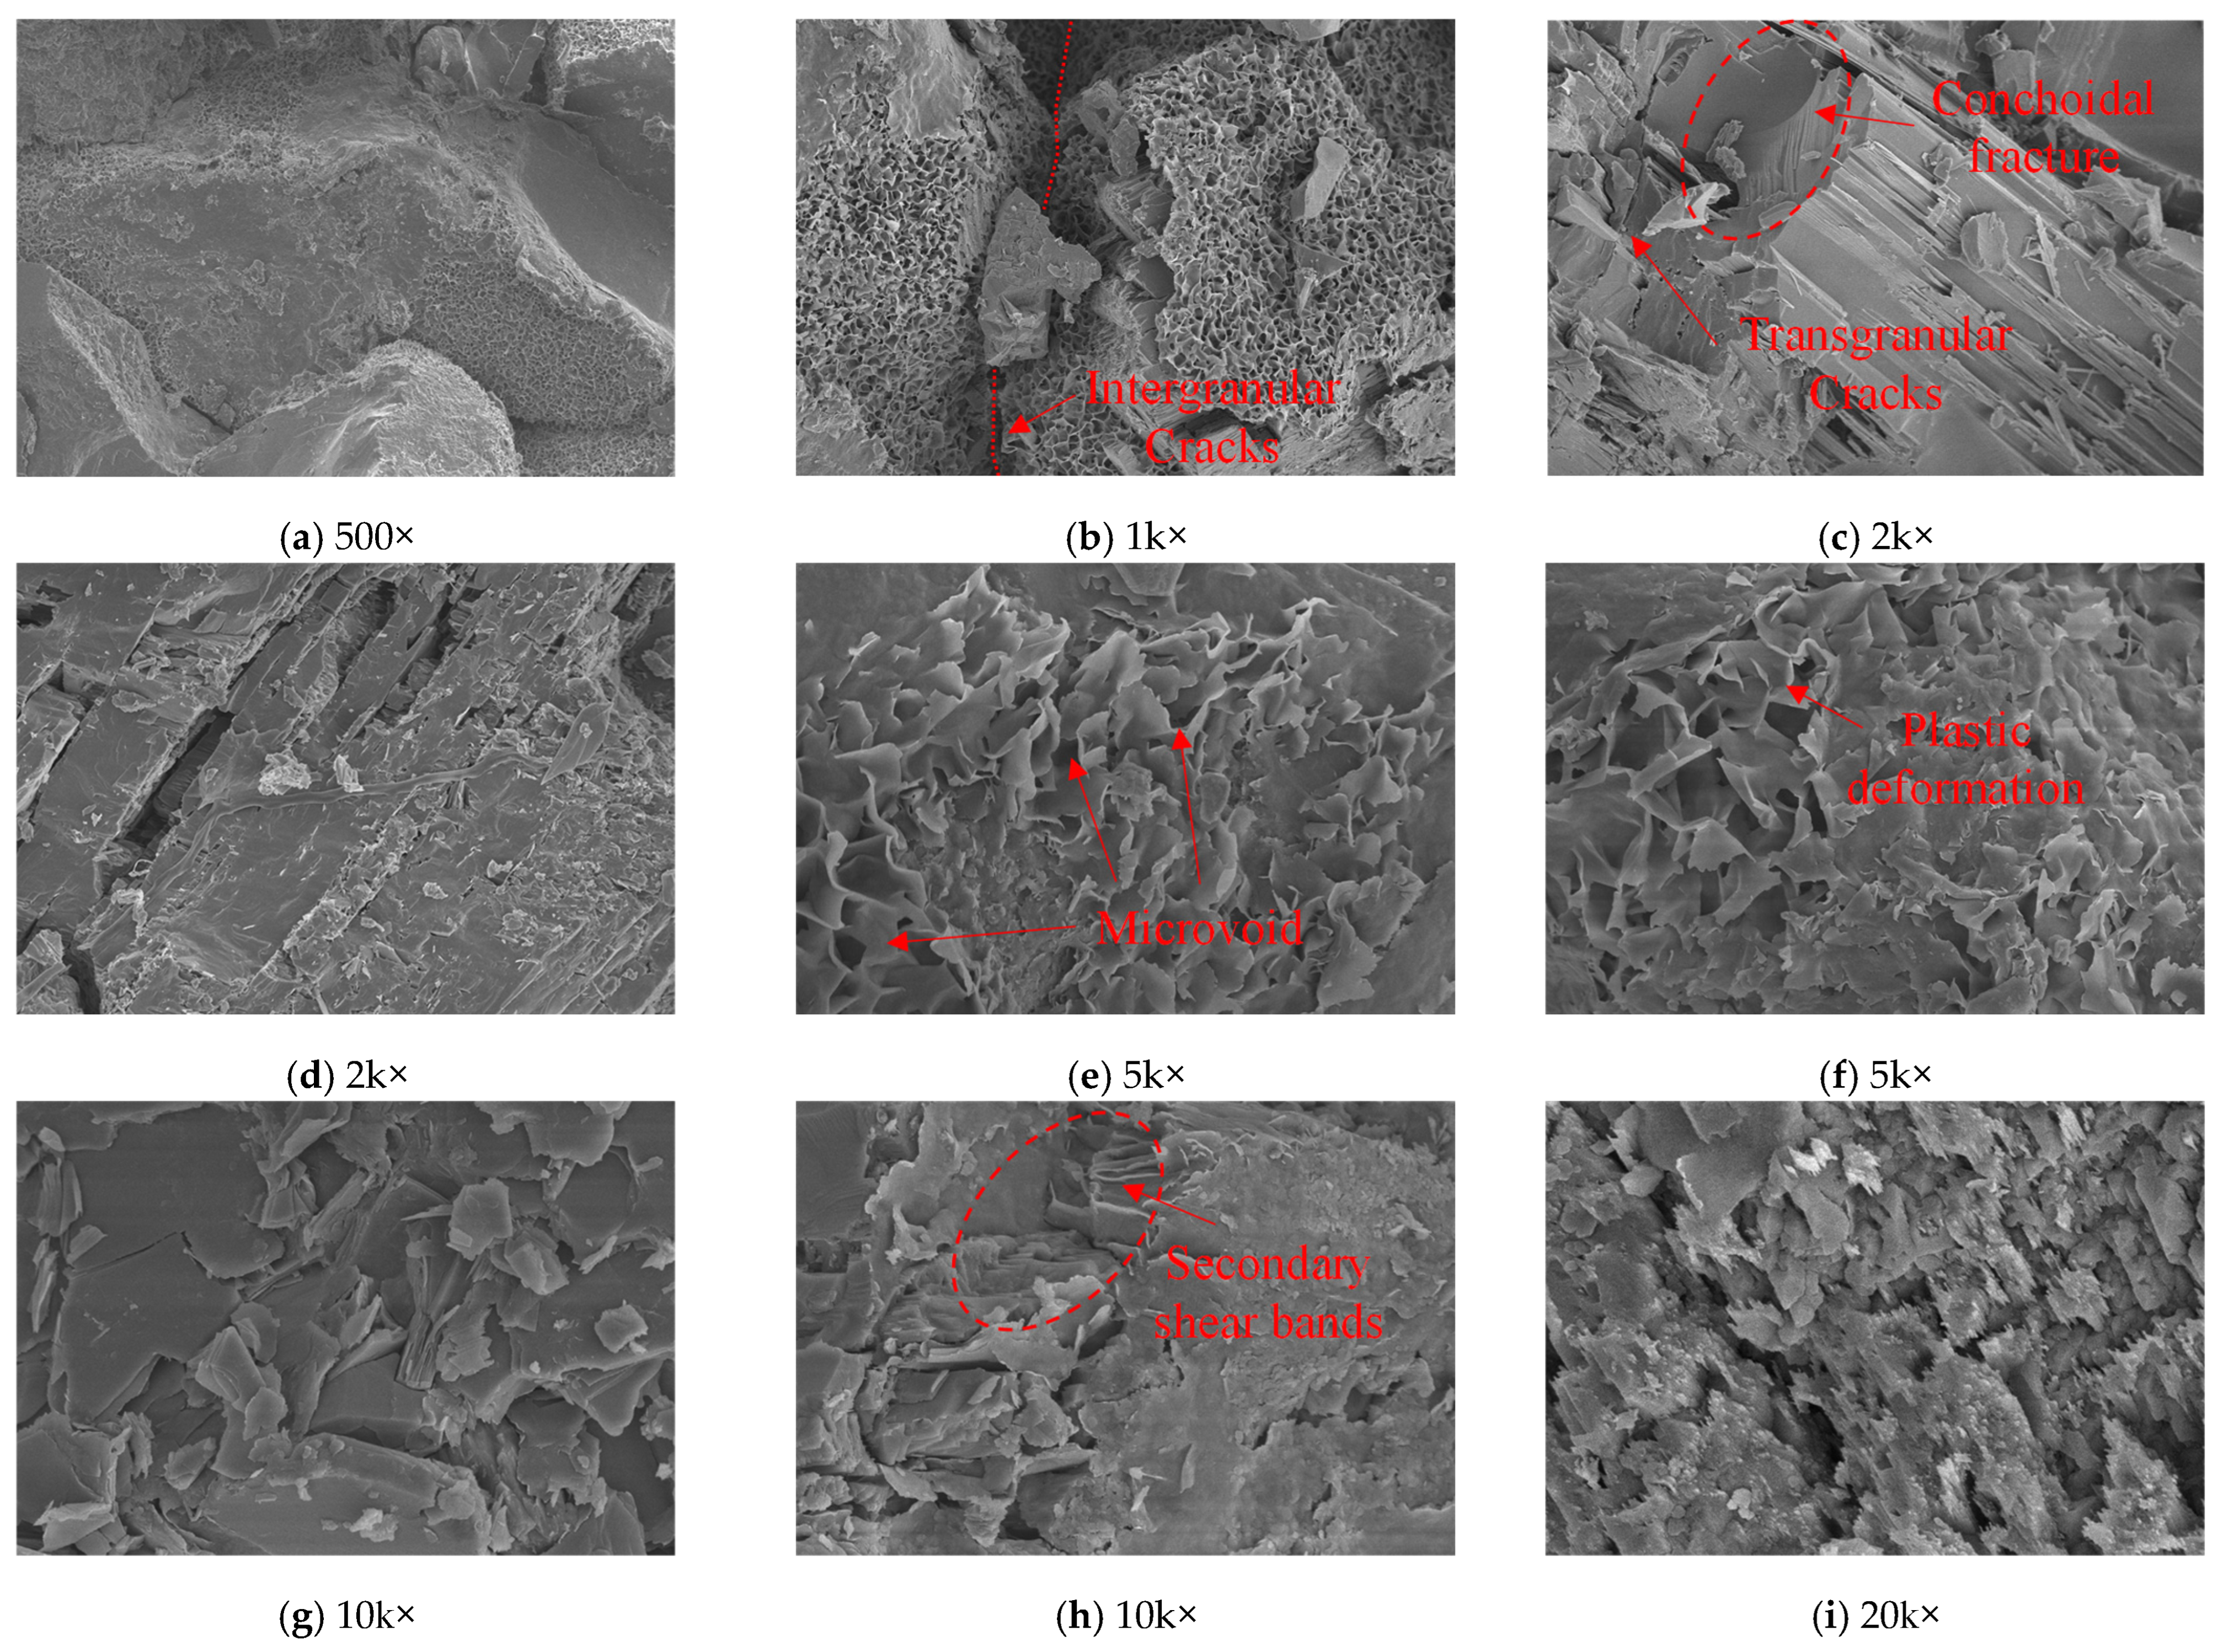
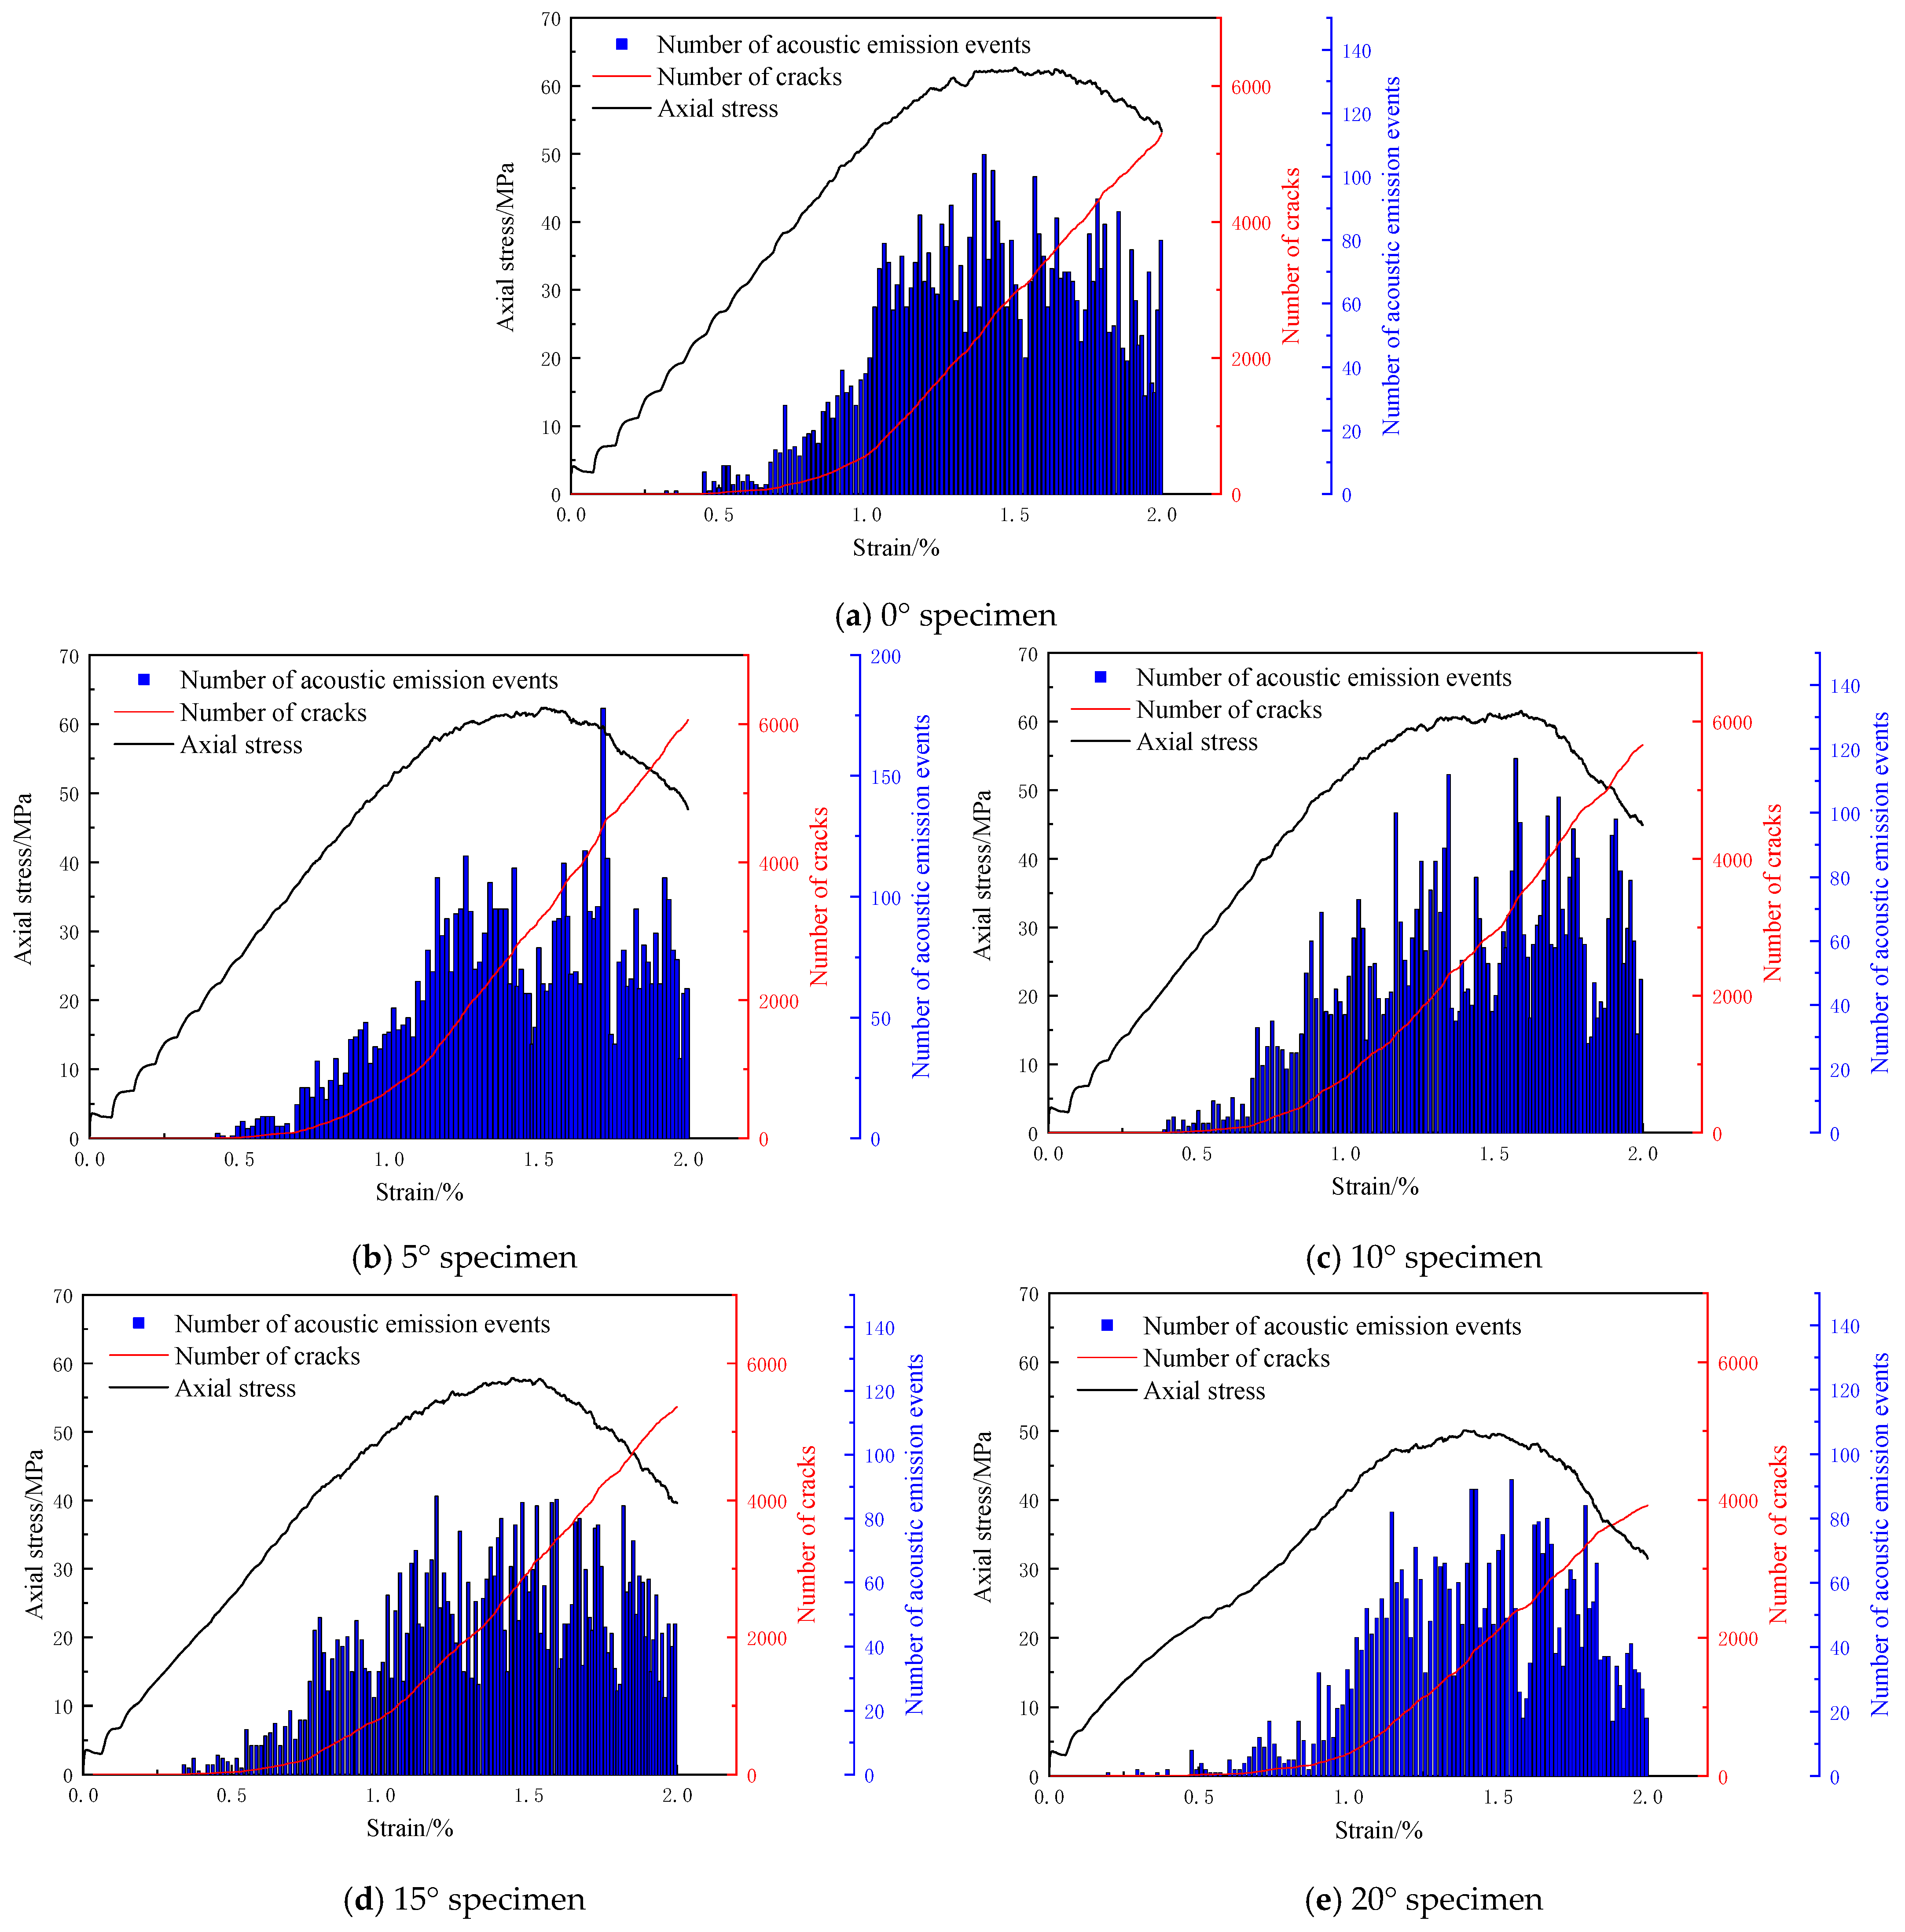
  • Mineralogical heterogeneity (quartz-dominated transgranular fractures) and geometric asymmetry jointly regulate damage evolution. CT scans identify microcrack nucleation in high-stress gradient zones (23.4 MPa/mm) on the right flank, while SEM characterization confirms microvoid initiation (1–5 μm) at weakly cemented grain boundaries. Acoustic emission monitoring demonstrates increased crack network complexity (42% higher microcrack density in 20° specimens versus 0°).
The integrated “experimental–numerical–theoretical” multiscale framework developed in this study provides scientific guidance for stability assessment and differentiated support design of deep asymmetric roadways, advancing sustainable underground engineering practices in high-stress environments.

Author Contributions

Conceptualization, W.Y. and K.L.; methodology, B.P.; software, B.P.; validation, Z.L.; formal analysis, T.H.; investigation, J.Y.; resources, J.Y.; data curation, T.H.; writing—original draft preparation, B.P.; writing—review and editing, Z.L.; visualization, K.L.; supervision, T.H.; project administration, W.Y.; funding acquisition, W.Y. All authors have read and agreed to the published version of the manuscript.

Funding

This research was funded by the National Natural Science Foundation of China, grant number 52174076, 52474096; the Science and Technology Innovation Program of Hunan Province, grant number No. 2024RC1065; the Natural Science Fund of Hunan Province, grant number 2023JJ30261; the Guizhou Provincial Science and Technology Plan, grant number Qiankehejichu-ZK [2022] General 176; and the Open Fund of Work Safety Key Lab on Prevention and Control of Gas and Roof Disasters for Southern Coal Mines, China, grant number E22320.

Data Availability Statement

All data are referenced in the article.

Conflicts of Interest

The authors declare no conflicts of interest.

References

  1. Kang, H.P.; Gao, F.Q.; Xu, G.; Ren, H.W. Mechanical behaviors of coal measures and ground control technologies for China’s deep coal minesA review. J. Rock Mech. Geotech. Eng. 2022, 15, 37–65. [Google Scholar] [CrossRef]
  2. McQuillan, A.; Canbulat, I.; Payne, D.; Oh, J.J. New risk assessment methodology for coal mine excavated slopes. Int. J. Min. Sci. Technol. 2018, 28, 583–592. [Google Scholar] [CrossRef]
  3. Lindberg, T.T.; Bernhardt, E.S.; Bier, R.; Helton, A.M.; Merola, R.B.; Vengosh, A.; Di Giulio, R.T. Cumulative impacts of mountaintop mining on an Appalachian watershed. Proc. Natl. Acad. Sci. USA 2011, 108, 20929–20934. [Google Scholar] [CrossRef]
  4. Wang, G.F.; Xu, Y.X.; Ren, H.W. Intelligent and ecological coal mining as well as clean utilization technology in China: Review and prospects. Int. J. Min. Sci. Technol. 2019, 29, 161–169. [Google Scholar] [CrossRef]
  5. Simpson, G.B.; Badenhorst, J.; Jewitt, G.P.W.; Berchner, M.; Davies, E. Competition for land: The water-energy-food nexus and coal mining in Mpumalanga Province, South Africa. Front. Environ. Sci. 2019, 7, 86. [Google Scholar] [CrossRef]
  6. Hoek, E.; Brown, E. Underground Excavations in Rock; CRC Press: Boca Raton, FL, USA, 1980. [Google Scholar]
  7. Gutierrez-Ch, J.G.; Senent, S.; Graterol, E.P.; Zeng, P.; Jimenez, R. Rock shear creep modelling: DEMRate process theory approach. Int. J. Rock Mech. Min. Sci. 2022, 161, 105295. [Google Scholar] [CrossRef]
  8. Liu, L.A.; Fang, K.; Zhao, T.B.; Meng, Q.Z.; Zhang, C.G. Characterization and influence analysis of constraint stiffness in rock indentation test. Rock Mech. Rock Mech. Rock Eng. 2025, 1–16. [Google Scholar] [CrossRef]
  9. Wu, G.S.; Yu, W.J.; Pan, B.; Liu, Y.Q.; Fang, C.F.; Liu, X. Investigate on the mechanical properties and microscopic three-dimensional morphology of rock failure surfaces under different stress states. Geomech. Geophys. Geo-Energy Geo-Resour. 2024, 10, 125. [Google Scholar] [CrossRef]
  10. Wu, J.N.; Yang, X.B.; Song, Y.M.; Sun, Q.D.; Pei, Y.Y. Study on a new inversion method for non-uniform distribution of rock material parameters. Bull. Eng. Geol. Environ. 2022, 81, 280. [Google Scholar] [CrossRef]
  11. Ai, Z.Y.; Ye, Z.K.; Huang, H.W.; Hu, K.X. Stress analysis of elliptical tunnels in an orthogonally anisotropic elastic full-space under non-uniform in-situ stress. Int. J. Numer. Anal. Methods Geomech. 2024, 48, 517–537. [Google Scholar] [CrossRef]
  12. Yu, W.J.; Pan, B.; Li, K.; Wu, G.S. Investigation on mechanical properties and dilatancy behavior of deeply buried mudstone: A comprehensive study. Constr. Build. Mater. 2025, 466, 140032. [Google Scholar] [CrossRef]
  13. Wang, S.; Xu, K.Z.; Zhao, W.C.; Fu, X.F.; Lu, X.S.; Song, Z.L. A New Model to Predict Mudstone Failure Behavior from Brittle to Ductile Caused by Confining Pressures. Processes 2025, 13, 308. [Google Scholar] [CrossRef]
  14. Liu, Z.L.; Yu, W.J.; Wu, G.S.; Zhang, Z.Z.; Wang, P. Investigate on dynamic mechanical and mesoscopic damage characteristics of high-temperature treated granite based on SPH-FEM coupling algorithm. J. Mater. Res. Technol. 2025, 36, 1891–1911. [Google Scholar]
  15. Wu, G.S.; Yu, W.J.; Pan, B.; Fang, C.F.; Guo, H.X.; Zhang, C. Failure mechanics mechanisms and permeability stage evolution of limestone considering wave velocity and failure surface characteristics. Soils Found. 2025, 65, 101577. [Google Scholar] [CrossRef]
  16. Ju, Y.; Xie, H.P.; Zheng, Z.M.; Lu, J.B.; Mao, L.T.; Lingtao, G.; Gao, F.; Peng, R.D. Visualization of the complex structure and stress field inside rock by means of 3D printing technology. Chin. Sci. Bull. 2014, 59, 5354–5365. [Google Scholar] [CrossRef]
  17. Gomes, G.J.C.; Forero, J.H.; Vargas, E.A., Jr.; Vrugt, J.A. Bayesian inference of rock strength anisotropy: Uncertainty analysis of the Hoek–Brown failure criterion. Int. J. Rock Mech. Min. Sci. 2021, 148, 104952. [Google Scholar] [CrossRef]
  18. Song, Z.Y.; Zhao, Y.; Dang, W.G.; Zhang, M. Mechanical responses of sandstone exposed to triaxial diferential cyclic loading with distinct unloading rates of confning stress: A particle-based numerical investigation. Rock Mech. Rock Eng. 2025, 58, 4159–4184. [Google Scholar] [CrossRef]
  19. Jin, J.; Cao, P.; Zhang, J.; Wang, Y.C.; Miao, C.X.; Li, J.; Bai, X.H. Damage evolution and failure precursor of rock-like material under uniaxial compression based on strain rate field statistics. Appl. Sci. 2025, 15, 686. [Google Scholar] [CrossRef]
  20. Cui, L.; Sheng, Q.; Zheng, J.J.; Luo, S.; Miao, C. Strain-softening model for granite and sandstone based on experimental and discrete element methods. Sci. Reports. 2024, 14, 24308. [Google Scholar] [CrossRef]
  21. Meng, Y.Y.; Yu, L.Y.; Yuan, L.; Hua, X.Z.; Ma, Y.K.; Zhuang, J.T.; Jing, H.W.; Liu, X.W. Effects of bedding angle and confining pressure on the mechanical behavior, energy dissipation and micro damage evolution mechanism of layered rock mass under triaxial compression conditions. J. Mater. Res. Technol. 2025, 36, 1259–1272. [Google Scholar] [CrossRef]
  22. Khazaei, C.; Hazzard, J.; Chalaturnyk, R. Damage quantification of intact rocks using acoustic emission energies recorded during uniaxial compression test and discrete element modeling. Comput. Geotech. 2015, 67, 94–102. [Google Scholar] [CrossRef]
Figure 1. Model of the rock full stress-strain curve and zone of surrounding rock in deep roadway.
Processes 13 01169 g001
Figure 2. Inclined specimen and test system.
Processes 13 01169 g002
Figure 3. Models of inclined specimens.
Processes 13 01169 g003
Figure 4. Inclined specimen CT scan image.
Processes 13 01169 g004
Figure 5. Internal slices of sandstone.
Processes 13 01169 g005
Figure 6. Electron microscopy scanning results.
Processes 13 01169 g006
Figure 7. PFC numerical simulation flowchart.
Processes 13 01169 g007
Figure 8. Sample formation of inclined specimens.
Processes 13 01169 g008
Figure 9. Stress–strain curve of inclined specimen.
Processes 13 01169 g009
Figure 10. Stress distribution nephograms of rock specimens at different dip angles.
Processes 13 01169 g010
Figure 11. Stress evolution law of 20° inclined specimen.
Processes 13 01169 g011
Figure 12. Variation in rock mechanical properties of specimens with different inclination angles.
Processes 13 01169 g012
Figure 13. Evolution law of rock fractures in samples with different inclination angles.
Processes 13 01169 g013
Table 1. The microscopic parameters of the test specimens and the parameters of the experimental results.
Parameter
Contact Modulus/GPaContact Stiffness RatioParallel Bond Modulus/GPaParallel Bond Stiffness RatioNormal Bond Strength/MPaShear Bond Strength/MPaFriction Coefficient
Ball-ball3.81.53.81.590.028.00.60
Facet-ball10.01.5----0.10
Model Mechanical ParametersLaboratory Test Parameters
Elastic Modulus/GPaUniaxial Compressive Strength/MPaElastic Modulus/GPaUniaxial Compressive Strength/MPa
3.8663.983.9463.5
Disclaimer/Publisher’s Note: The statements, opinions and data contained in all publications are solely those of the individual author(s) and contributor(s) and not of MDPI and/or the editor(s). MDPI and/or the editor(s) disclaim responsibility for any injury to people or property resulting from any ideas, methods, instructions or products referred to in the content.

