Abstract
Conventional rock mechanical testing approaches encounter significant limitations when applied to deeply buried fractured formations, constrained by formidable sampling difficulties, prohibitive costs, and intricate specimen preparation demands. This investigation pioneers an innovative nanoindentation-based multiscale methodology (XRD–ED–SEM integration) that revolutionizes the mechanical characterization of dolostone through drill cuttings analysis, effectively bypassing conventional coring requirements. Our integrated approach combines precision surface polishing with advanced indenter calibration protocols, enabling the continuous stiffness method to achieve unprecedented measurement accuracy in determining micromechanical properties—notably an elastic modulus of 119.47 GPa and hardness of 5.88 GPa—while simultaneously resolving complex indentation size effect mechanisms. The methodology reveals three critical advancements: remarkable 92.7% dolomite homogeneity establishes statistically significant elastic modulus–hardness correlations (R2 > 0.89), while residual imprint analysis uncovers a unique brittle–plastic interaction mechanism through predominant rhomboid plasticity (84% occurrence) accompanied by microscale radial cracking (2.1–4.8 μm). Particularly noteworthy is the identification of load-dependent property variations, where surface hardening effects and defect interactions cause 28.7% parameter dispersion below 50 mN loads, progressively stabilizing to <8% variance at higher loading regimes. By developing a micro–macro bridging model that correlates nanoindentation results with triaxial test data within a 12% deviation, this work establishes a groundbreaking protocol for carbonate reservoir evaluation using minimal drill cutting material. The demonstrated methodology not only provides crucial insights for optimizing hydraulic fracture designs and wellbore stability assessments, but it also fundamentally transforms microstructural analysis paradigms in geomechanics through its successful application of nanoindentation technology to complex geological systems.
1. Introduction
With the rapid development of the global economy and substantial investments in infrastructure, the spatial configuration of infrastructure has diversified, expanding from surface environments to underground and subaqueous regions [1,2,3,4,5]. Granite, as a natural construction material and geological medium, exhibits superior mechanical properties such as a dense structure, high strength, weathering resistance, and structural stability. These attributes make it widely encountered in engineering projects, including hydropower stations, underground nuclear waste repositories, subsurface energy storage facilities, and railway tunnels [6,7,8,9]. However, the construction and operation of underground and subaquatic engineering systems encounter a myriad of complex geotechnical challenges, predominantly rooted in rock mechanics phenomena that critically influence project safety and economic viability, demanding urgent scientific and technical solutions. At mesoscopic scales, rocks manifest as heterogeneous mineral aggregates characterized by multiphase compositions and inherent structural discontinuities [10,11,12]. Their macroscopic damage mechanisms are governed by the mesoscopic damage behavior of their constituent minerals. Nevertheless, conventional rock mechanics testing methods fail to quantitatively analyze the mesoscale mechanical properties of mineral grains within rocks. Current approaches predominantly rely on meso-mechanical experiments to investigate rock creep behavior and degradation processes. Furthermore, traditional macroscopic mechanical parameter testing methods—such as laboratory uniaxial or triaxial compression tests—impose stringent requirements on specimen dimensions and integrity [13,14,15]. However, significant technical challenges emerge from the inherent physicochemical instability of rock materials, further exacerbated by ubiquitous bedding planes and pervasive natural fracture networks within in situ geological formations. These structural complexities systematically degrade the core sample integrity during extraction, introducing substantial uncertainties in laboratory-based rock mechanics evaluations while elevating testing protocol requirements [16,17,18,19]. Additionally, conventional mechanical testing methods are costly, time-consuming, and typically limited to localized sampling, resulting in high data scatter, controversial interpretations, and insufficient reliability for engineering design parameterization [20,21,22,23,24,25]. Their practical engineering value remains constrained. Moreover, traditional compression tests are inherently destructive; once rock cores are loaded to failure, they cannot be reused for subsequent mechanical evaluations, thereby diminishing the recyclability of core samples [26]. Consequently, there is an urgent need to develop reliable and efficient testing instruments and analytical methodologies that overcome these limitations while enabling non-destructive, repeatable, and scalable mechanical characterization of heterogeneous rock systems.
In 1968, G.N. Kalei [27] first proposed and utilized nanoindentation technology, which enables mechanical testing at the micro- and nanoscale, making it possible to assess the mechanical properties of small mineral components. Nanoindentation testing is a technique for evaluating the micro- and mesoscale mechanical properties of materials, offering high measurement resolution, short testing times, minimal sample requirements, and low preparation costs [28,29,30,31,32,33]. This technology is primarily designed for small-volume samples, allowing for the rapid and convenient acquisition of mechanical indicators of mineral particles, making it highly suitable for mesoscale mechanical analysis of rocks. In recent years, this technique has been widely applied across various fields, yielding significant research achievements [34,35,36,37,38]. Jiang Junda et al. [23] derived fracture energy from nanoindentation load-displacement curves using an energy decomposition method, analyzing quasi-brittle material fracture through three-phase cracking mechanics. By correlating cracked area with indentation depth during micro-steady-state cracking, they quantified critical energy release rates and fracture toughness. Ji Jingchen [13] established macro–micro mechanical correlations in Dagangshan granite via genetic fuzzy algorithms, revealing quartz’s dominant role over feldspar in governing overall elastic modulus. Mao Weize [12] combined CT-based mineral quantification with nanoindentation-derived mesoscale parameters to develop a discrete element model, demonstrating that tensile strength scales with interfacial bond strength, while cohesion and friction angles depend on mineral–contact property interactions. Luo Tingyi et al. [18] identified quartz as the dominant mechanical phase in shales through X-ray diffraction correlation, showing superior elastic modulus and hardness over plagioclase and clay minerals. Gu Shitan et al. [16] quantified shale heterogeneity via nanoindentation depth variations and fracture toughness differences among mineral constituents. Wang Junwei et al. [17] pioneered a convolution-based upscaling method for deriving macro-mechanical parameters from nanoindentation data, achieving <10% deviation from triaxial test results. Liu et al. [25] optimized fracture toughness assessment through multi-indenter comparative studies, validating Vickers hardness and spherical indenter scratch methods as the most reliable. Yang Chen [20] established mineral-specific nanoindentation protocols for Qinling gneiss, determining an optimal 50 s hold time 20 gf/s rate for quartz/feldspar versus 70 s/10 gf/s for mica, with fracture toughness ranking: quartz > feldspar > mica. Recent advances include Zhang Zehua’s [21] multi-scale numerical framework linking mineral properties to macro-mechanics, and Cai Yidong et al. [22] revealing coal maturation’s dual-phase micromechanical evolution in vitrinite versus inertinite. Xie Xinhui et al. [24] demonstrated micron-to-centimeter parameter transition using Mori–Tanaka homogenization. Methodological refinements feature Wang Qisheng’s [37] finite element modeling of pore/crack-nanoindentation interactions and Zhang Zhaopeng’s [26] conglomerate upscaling through elastic modulus homogenization. Overall, nanoindentation technology has evolved into a critical tool for studying the micromechanical properties of geological materials, facilitating the transition from micro- to macroscale mechanical understanding and providing valuable insights into rock mechanics and material behavior [39,40,41,42].
The scholars mentioned above utilized nanoindentation technology to indent different minerals and tested their micromechanical properties, such as elastic modulus, hardness, and fracture toughness [43,44,45,46]. They also combined EDS and scanning electron microscopy techniques to study the microstructural damage patterns of various minerals. Understanding the mechanical properties of deeply fractured carbonate rocks is crucial for wellbore stability and hydraulic fracturing in exploration and development processes. However, obtaining core samples and preparing standard specimens for traditional mechanical experiments are very challenging, making research on the mechanical properties of deep-fractured formation rocks relatively rare [47]. Nanoindentation technology provides an efficient approach for mesoscale mechanical characterization of deeply fractured formations, bridging microscopic property evaluation with macroscopic failure mechanism elucidation. This investigation employed drilling-derived rock cuttings to fabricate nanoindentation specimens for micromechanical characterization. Nanoindentation experiments on carbonate lithologies were conducted while simultaneously analyzing residual indentation morphologies via scanning electron microscopy, combining nanoindentation with SEM residual imprint analysis to elucidate microstructural damage mechanisms in carbonate rocks. Additionally, EDS was used to detect elemental content at indentation sites to confirm mineral types at those locations. The findings contribute significantly towards understanding key mechanical performance parameters like hardness and elasticity modulus, etc.; they also reveal destruction mechanisms within carbonates when viewed through lenses, both macro (nano) and meso (micro), aiding assessment feasibility/safety mining operations and providing a scientific basis for petroleum exploration development endeavors.
2. Materials and Methods
2.1. Testing Principles
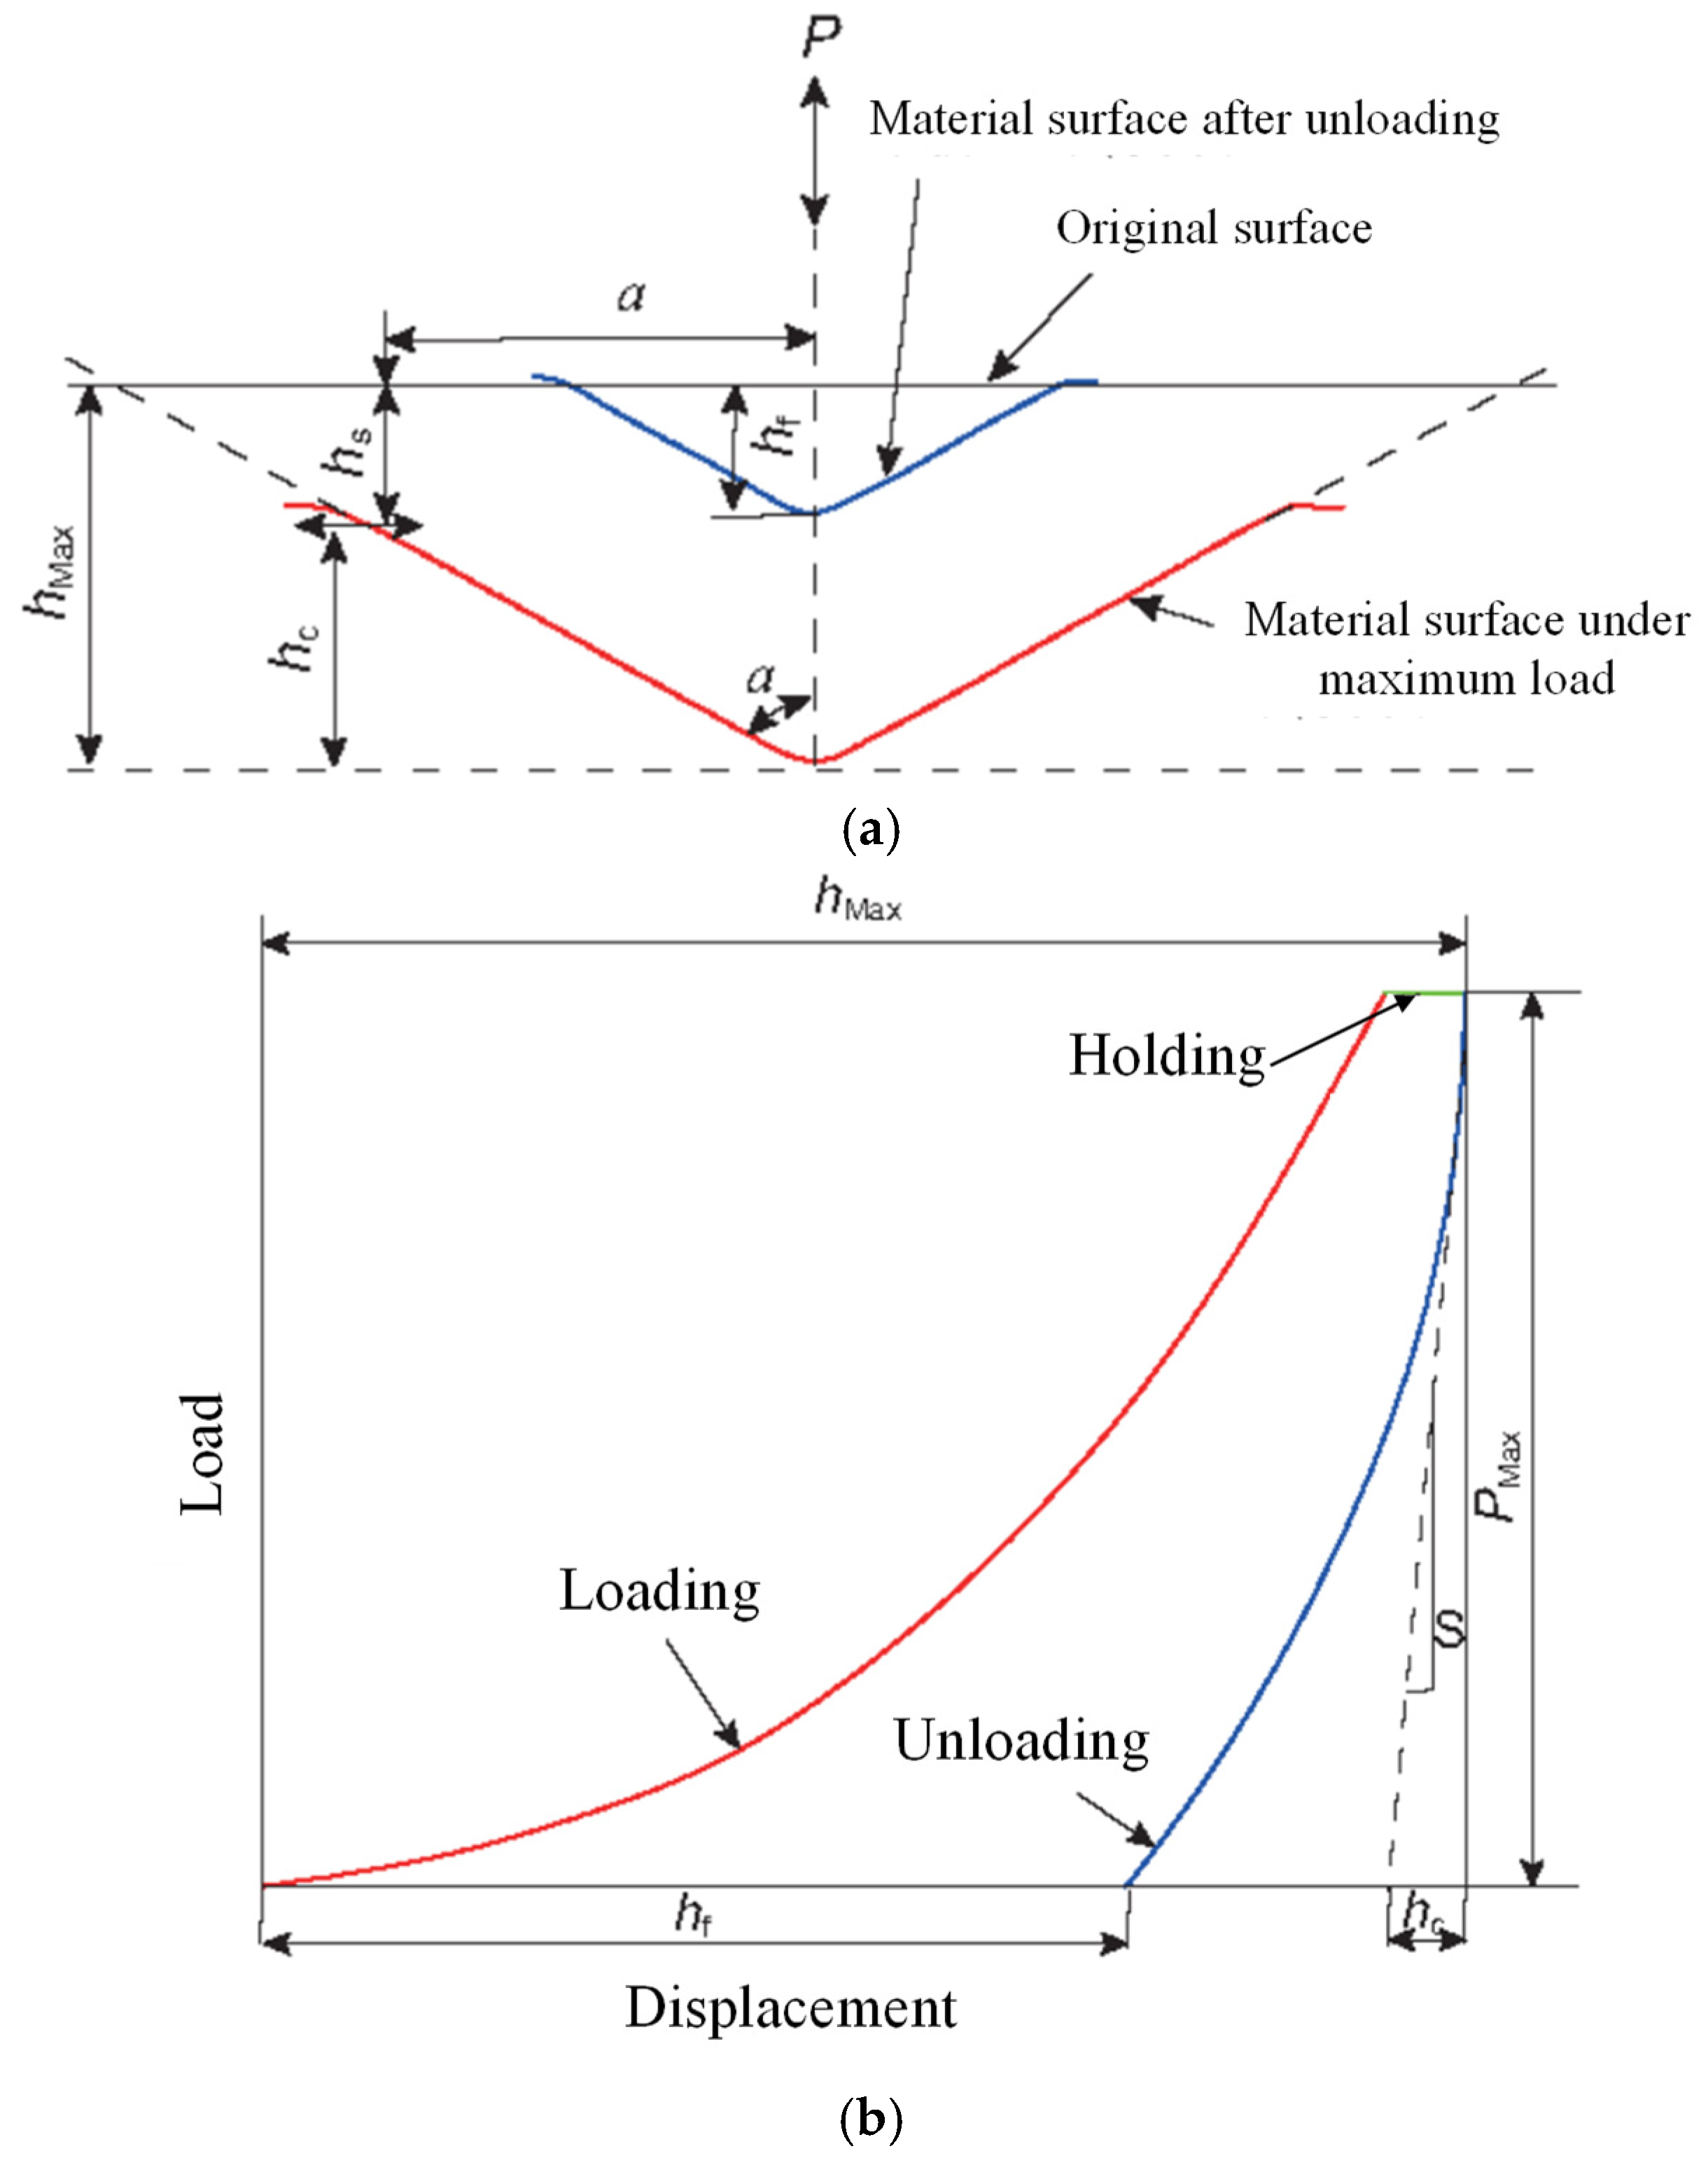
Utilizing the force and displacement data, along with the stiffness, the properties of a specimen can be determined through a variety of analytic models. Nanoindentation operates through nanoscale precision actuators and microsensors that precisely regulate indenter displacement while simultaneously monitoring interaction forces, achieving dynamic synchronous acquisition of load–depth data during material penetration and retraction. This process generates characteristic load-displacement curves, from which fundamental mechanical properties, including elastic modulus and hardness, are extracted through advanced contact mechanics analysis. The technique’s analytical power is illustrated in Figure 1, which shows this operational principle through a representative loading–unloading profile and corresponding instrument schematic, demonstrating the critical relationship between controlled indentation dynamics and the resultant mechanical property derivation. Here, S represents the slope at the upper portion of the unloading curve, which indicates the elastic contact stiffness of the material [4], calculated as shown in Equation (1).
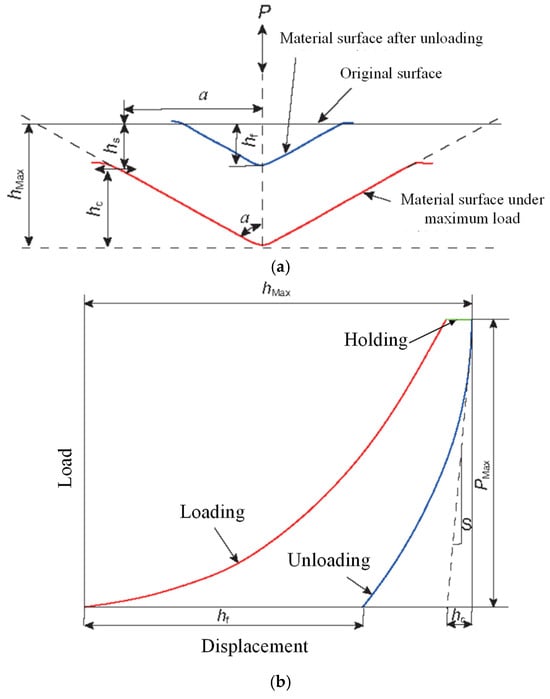
Figure 1.
Schematic diagram of the nanoindentation test principle. (a) Nanoindentation diagram. (b) Typical loading-depth curve.
Typically, the elastic portion of the upper half of the unloading curve is used for fitting analysis. Here, hmax represents the maximum indentation depth, which is the residual indentation depth after complete unloading, and hc is the contact depth of the indentation, with the calculation formula shown in Equation (2) [4]:
In the equation, ε is a constant related to the indenter geometry; for the commonly used Berkovich indenter, ε is 0.75. According to the classical definitions of hardness and elastic modulus in elasto-plastic deformation theory, the indentation hardness and the reduced elastic modulus, also known as the indentation modulus of the tested material at the indentation site, can be obtained from the curve. The specific calculation formulas are given in Equations (3) and (4) [4]:
In the formulas, H represents the indentation hardness (in GPa); Pmax represents the maximum indentation load (in mN); Ac is the projected area of the contact region (in μm2); Er is the reduced elastic modulus (in GPa); β is the indenter correction factor, which is 1.034 for the commonly used regular pyramidal Berkovich indenter; and S is the elastic contact stiffness (in mN/μm). During the experiment, the indenter contact depth, hc, and the projected area of the contact region, Ac, have the following corresponding relationship [4]:
In Equation (5), Cn represents the optimal fitting adjustment coefficient, and the sum of all polynomial terms following the first term reflects the tip blunting phenomenon of the material. Furthermore, for isotropic materials, the relationship between the reduced elastic modulus, Er, and the elastic modulus, E, is given in Equation (6) [4]:
In the equation, v is the Poisson’s ratio of the tested material, Ei is the elastic modulus of the diamond indenter, generally taken as 1140 GPa, and vi is the Poisson’s ratio of the diamond indenter, typically taken as 0.07.
2.2. Sample Preparation
The displacement of the indentation testing system is extremely small, with indentation depths often below the micron scale. Therefore, nanoindentation experiments require the sample surface to be very smooth and flat; otherwise, it is difficult to ensure the self-similarity of the indentation process. Apart from surface flatness, there are no excessive requirements regarding the sample shape. To prevent the test results from being influenced by the sample support, the sample thickness should be at least 10 times the indentation depth.
- First, a granite core is processed on a cutter to produce a sample approximately 15 mm × 15 mm × 5 mm (length × width × height).
- The sample is sequentially ground on a metallographic grinder using sandpapers with grits of 100, 600, 800, 1000, 2000, 3000, 5000, and 7000. Each grit is used for a minimum of 10 min, with the 7000-grit sandpaper used for at least 20 min to ensure that the sample surface is sufficiently smooth and flat.
- The ground sample is then subjected to sequential graded polishing using different polishing pads and corresponding grades of oil-based diamond polishing slurry, with diamond particle sizes of 6 μm, 1 μm, and 250 nm, respectively. Each polishing stage must last for at least 5 min, and the final polishing stage is the most critical, with a duration of no less than 10 min. Due to the high rotation speed of the polishing pads, it is advisable to apply a uniform external force during polishing to avoid secondary damage to the granite surface. After each polishing step, the sample is ultrasonically cleaned in anhydrous ethanol to ensure that the surface is free of any impurities.
- Finally, the sample is placed in an oven at 50 °C and dried for no less than 24 h to ensure it is completely dry.
2.3. Calibration and Experiment
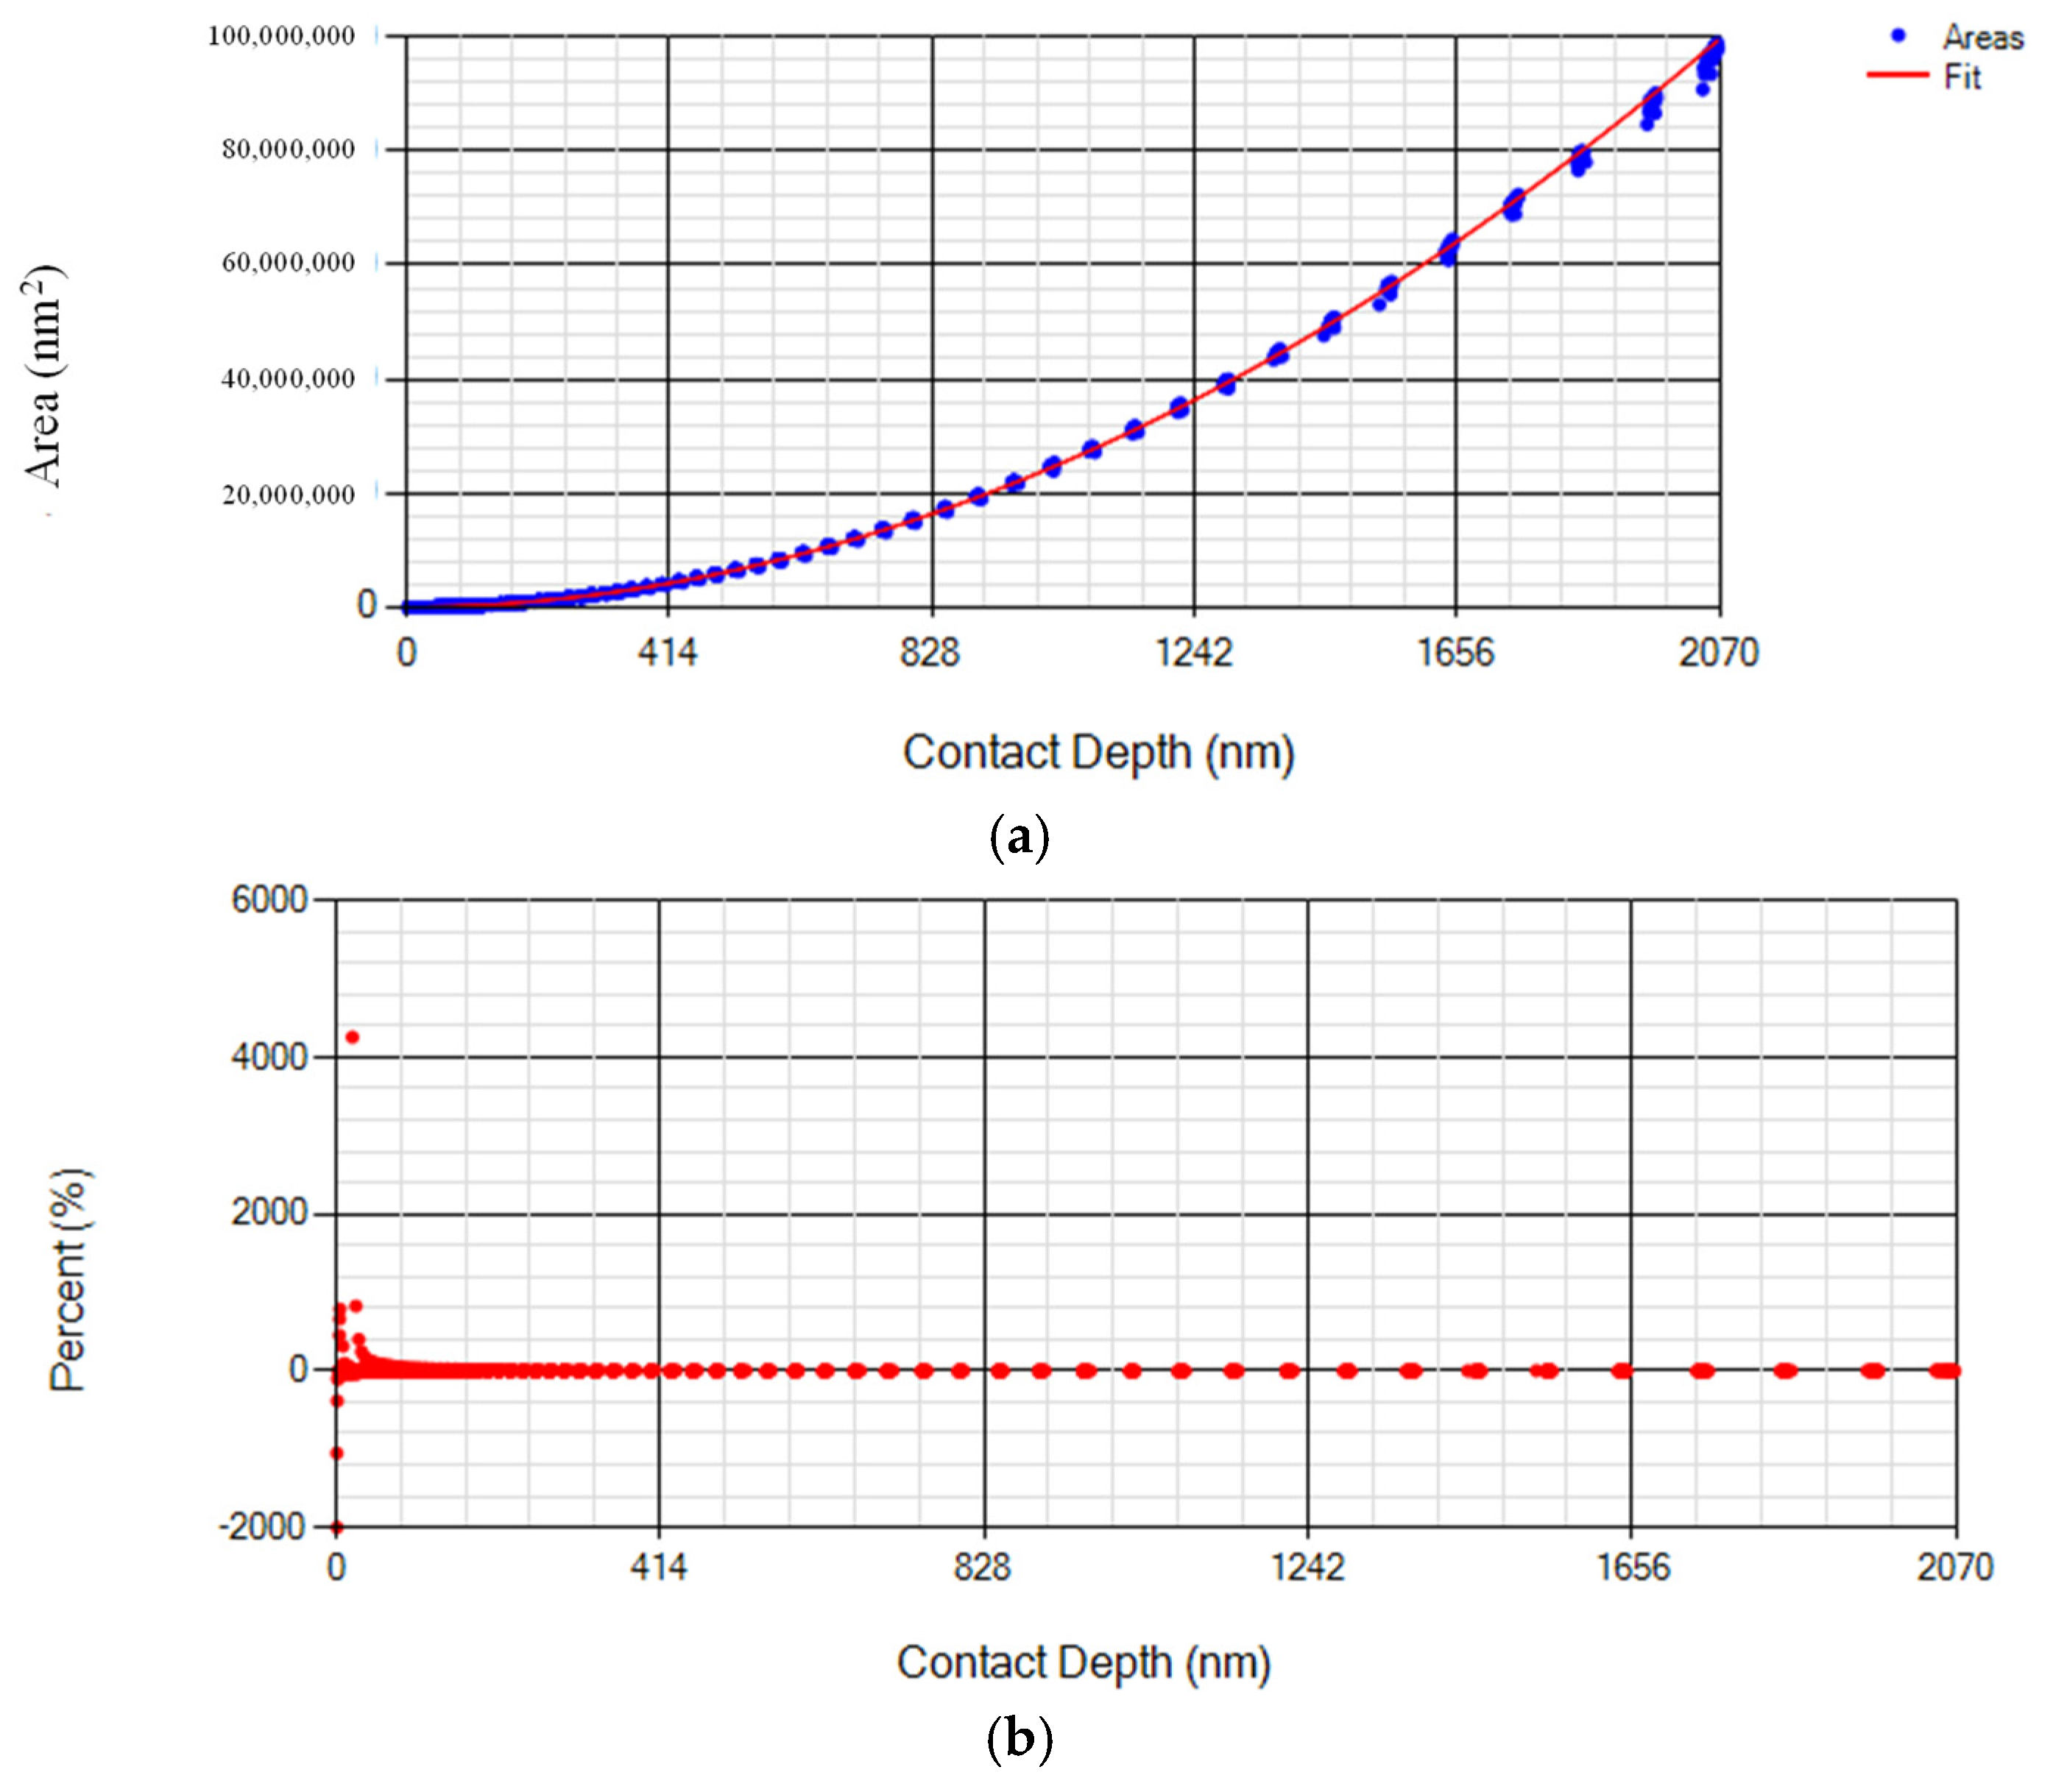
In this study, the device used is the Nano Indenter G200X from KLA at the Chinese Academy of Sciences, made in Milpitas, CA, USA, which applies highly resolved forces and measures sub-nanometer displacements and stiffness. Based on the principles of nanoindentation testing, processing defects and wear during indenter use cause discrepancies between the actual and designed shapes of the indenter. Therefore, accurately establishing the area function is very important for measurement accuracy. To account for the non-ideal geometry of the indenter used in actual experiments, the area function of the indenter must be calibrated. In this study, the built-in fused quartz sample (with a known elastic modulus of 72 GPa and a Poisson’s ratio of 0.188) was used to calibrate the area function of the Berkovich indenter. The resulting area measurement, fitting curve, and area function prediction error are shown in Figure 2.
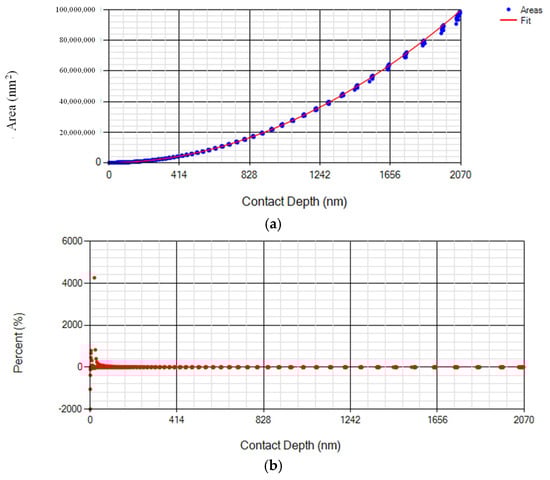
Figure 2.
Berkovich tip area function correction. (a) Tip area function. (b) Residuals.
The fitted parameters for the area function in Equation (5) are summarized in Table 1.

Table 1.
Summary of Area Function Parameters.
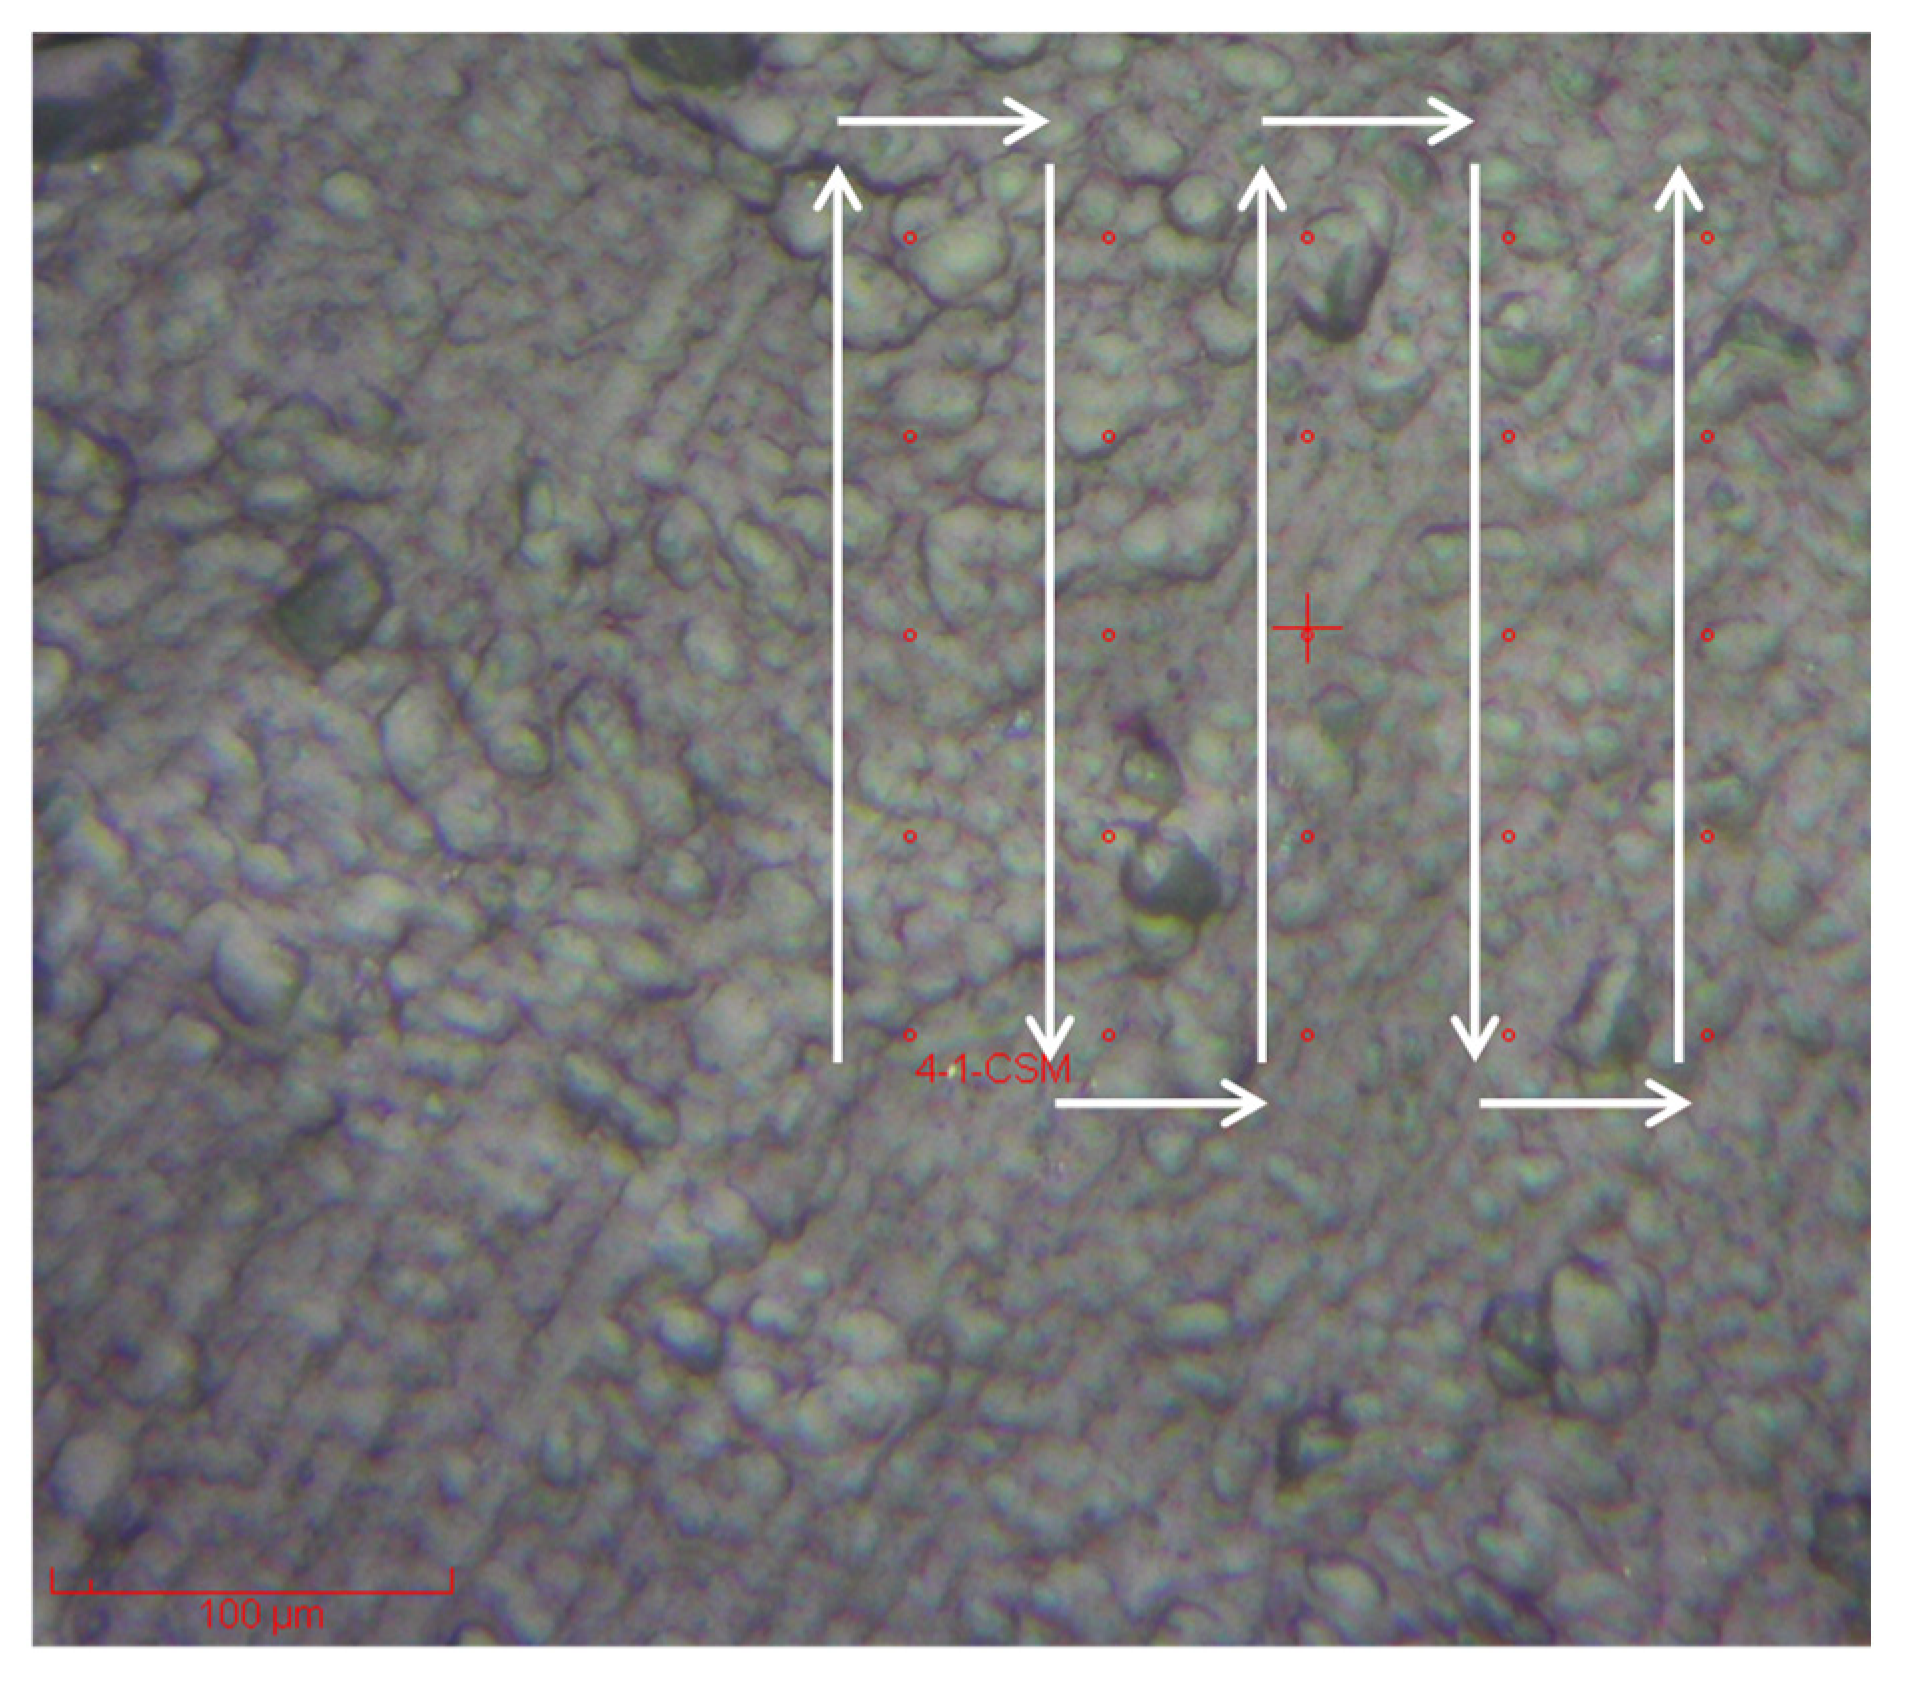
Before conducting the nanoindentation experiments, the mineral composition of the rock samples is first tested. After completing the nanoindentation experiments, scanning electron microscopy (SEM) is used to observe the residual indentation morphology, and energy dispersive spectroscopy (EDS) is employed to analyze the types and contents of elemental components in the material’s micro-regions. In this study, five samples were prepared and sequentially numbered as 1-1, 2-1, 3-1, 4-1, and 5-1. To mitigate viscoelastic relaxation effects during nanoindentation testing, strategic parameter optimization is essential. The maximum indentation depth should be carefully calibrated based on the material properties and surface roughness, while implementing a load step protocol with controlled hold periods ensures creep minimization. Adhering to ISO 14577 standards [48], lateral spacing between test locations must exceed 10 times the maximum indentation depth in both vertical and horizontal directions, with additional consideration given to axial spacing in multi-layer testing configurations. This three-dimensional spatial arrangement prevents stress field interactions between adjacent indentations and ensures test repeatability, which is particularly critical for heterogeneous geological materials. After multiple experiments, the indentation point spacing was finally set to 50 μm, and the maximum loading was set to 300 mN. The testing points were arranged as shown in Figure 3 using a 5 × 5 rectangular array. The point numbering starts from the lower left corner, following the principle of “from left to right, from bottom to top”, arranged in an S-shaped pattern; that is, the point in the lower left corner is numbered 1, and the point in the upper right corner is numbered 25.
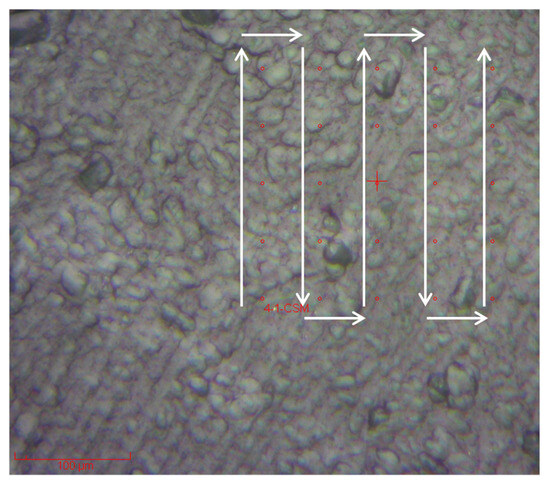
Figure 3.
Location map of the nanoindentation area.
Continuous stiffness measurement (CSM) was used for testing. The CSM method relies on applying high-frequency rapid oscillations to the quasi-static loading signal, thereby allowing a harmonic force to be superimposed on the load. The main advantage of CSM is that it enables direct measurement of the dynamic contact stiffness, S, at any point along the loading curve. Moreover, CSM is insensitive to thermal drift, so the mechanical results are not significantly affected by errors. A hold time of 5 s was set to eliminate the influence of creep effects. In addition, a Rigaku TTR III multifunctional X-ray diffractometer from Japan was used to analyze the rock samples, following the SY/T 5163-2018 X-ray Diffraction Analysis Method for Clay Minerals and Common Non-Clay Minerals in Sedimentary Rocks [49].
3. Results and Analysis
3.1. Mineral Composition
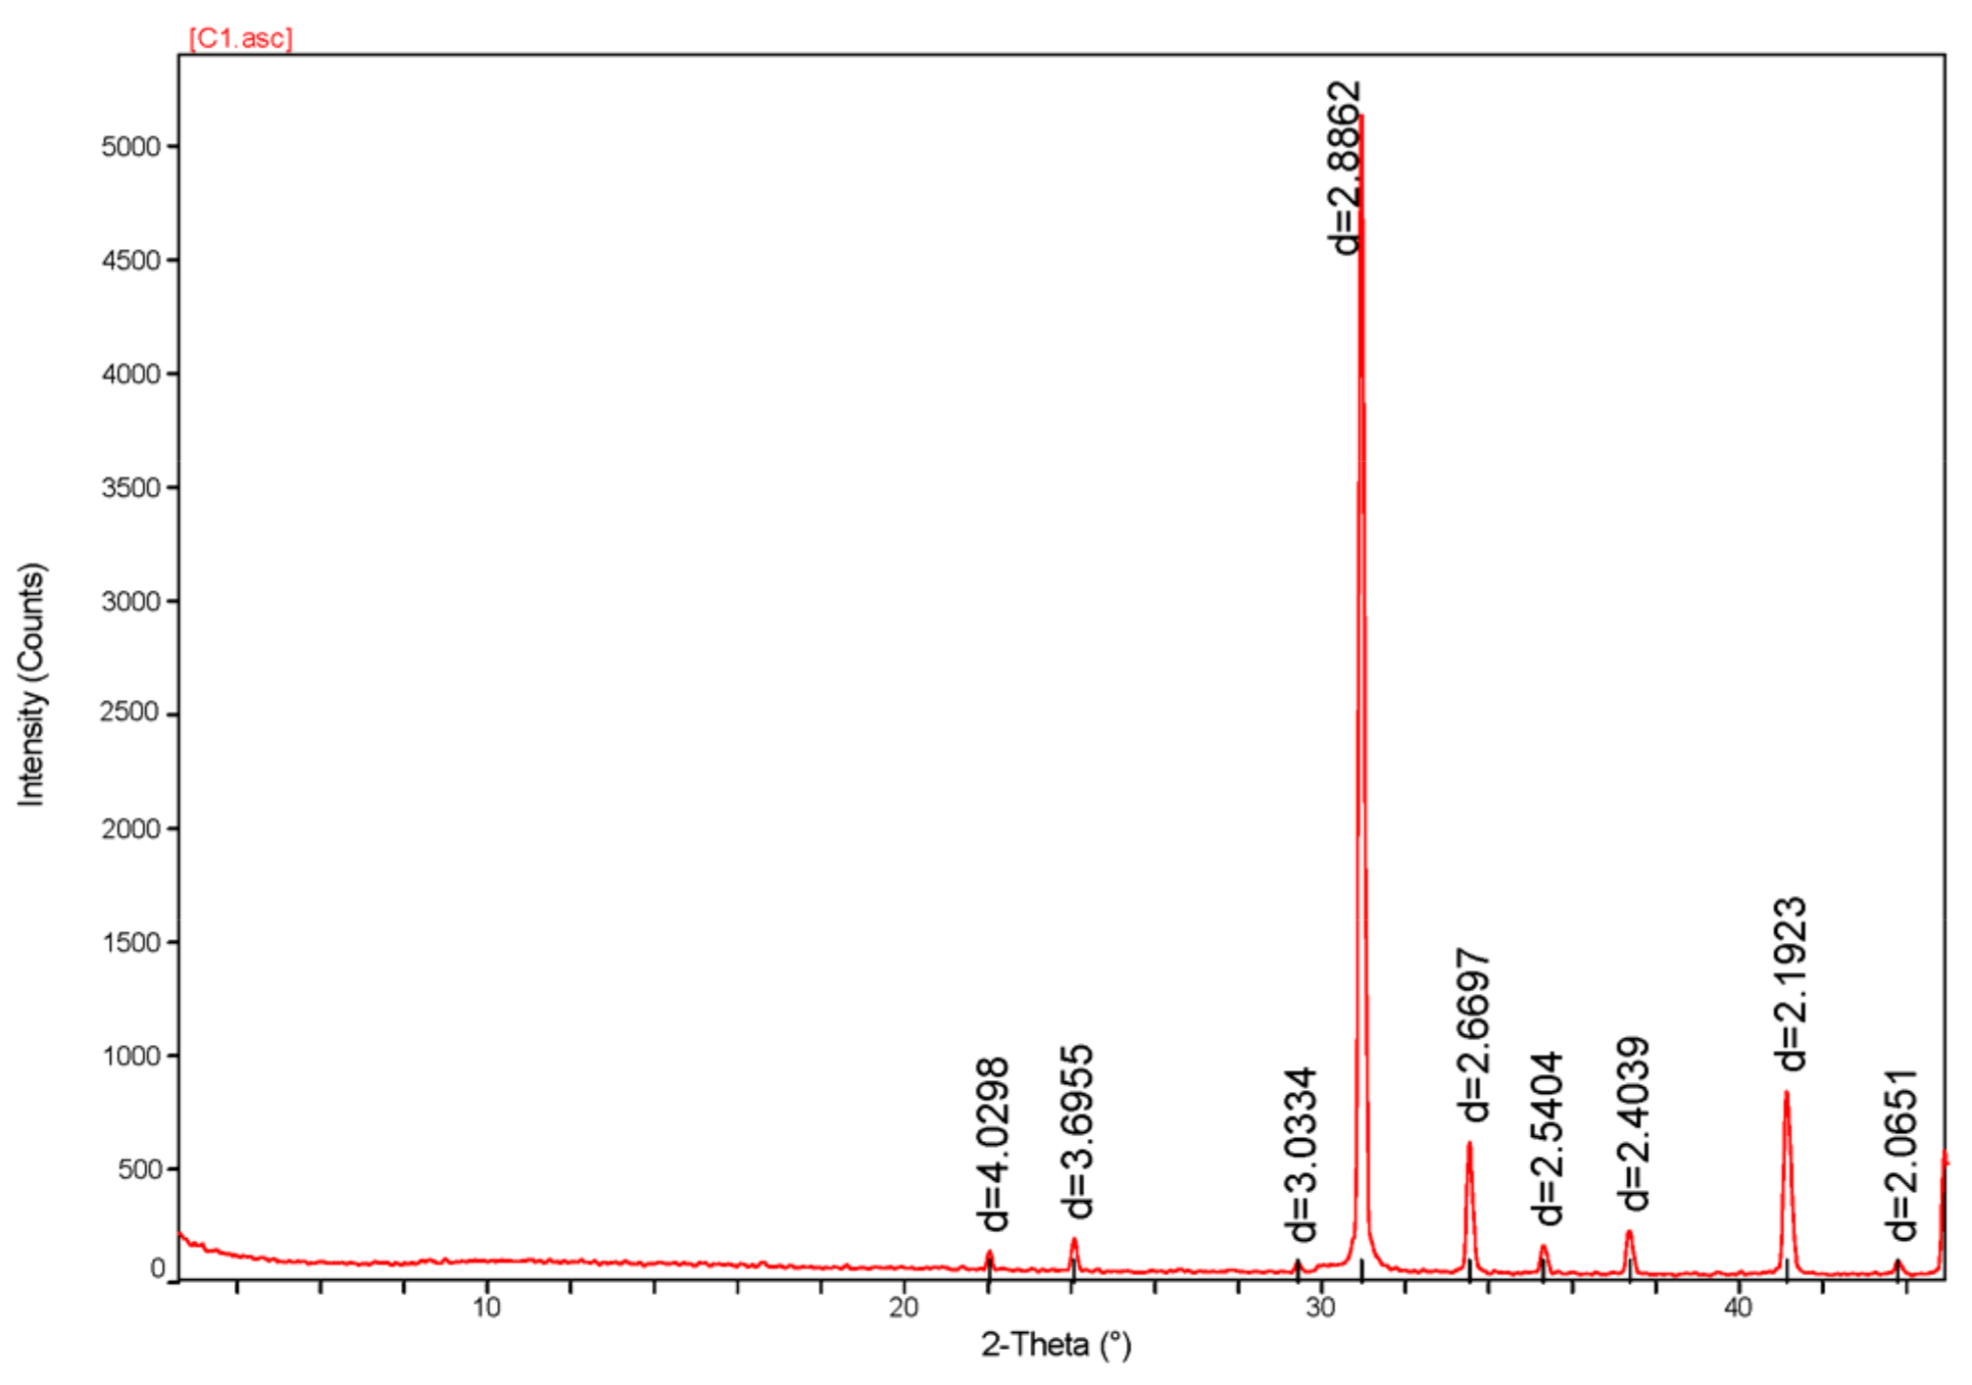
Mineral crystals exhibit specific X-ray diffraction (XRD) patterns, where the intensity of characteristic peaks is positively correlated with the mineral content in the sample. Through experimental methods, a proportional relationship (K-value) can be established between the mineral content and its characteristic diffraction peak intensity. By measuring the characteristic peak intensity of an unknown sample, the mineral content can be determined; this is the fundamental principle of the K-value method in quantitative XRD analysis. The experiment yielded a typical XRD pattern for non-clay minerals, as shown in Figure 4.
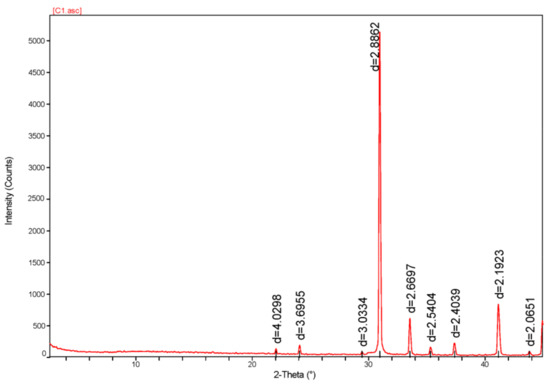
Figure 4.
X-ray diffraction (XRD) patterns of non-clay minerals.
Based on the XRD analysis and JCPDS/ICDD PDF database matching, Table 2 is a structured interpretation of the compounds, space groups, crystallite sizes, and peak labeling recommendations for Figure 4. Multiple phases may coexist due to peak overlaps.
Table 2.
Observed D-Spacings with Reference Compounds from the ICDD Database.
The test results were processed to determine the mineral composition of the rock samples, summarized in Table 3. In Table 3, it can be observed that the primary mineral component of the studied rock samples is dolomite. Across six sampling tests, five samples contained more than 97.9% dolomite, while one sample had a dolomite content of 92.7%. Additionally, some fractures within the dolomite were filled with calcite minerals. This confirms that the mechanical properties obtained from the nanoindentation tests primarily represent the mechanical properties of dolomite. Energy dispersive spectroscopy (EDS) is an element composition analysis technique based on the interaction between an electron beam and matter. It is widely used in materials science, geology, and semiconductor research. To verify the accuracy of the X-ray diffraction (XRD) results for non-clay minerals, EDS was employed to analyze the micro-area element distribution of the rock samples and further identify their mineral composition.
Table 3.
X-ray Diffraction (XRD) Analysis Report on Non-Clay Minerals.
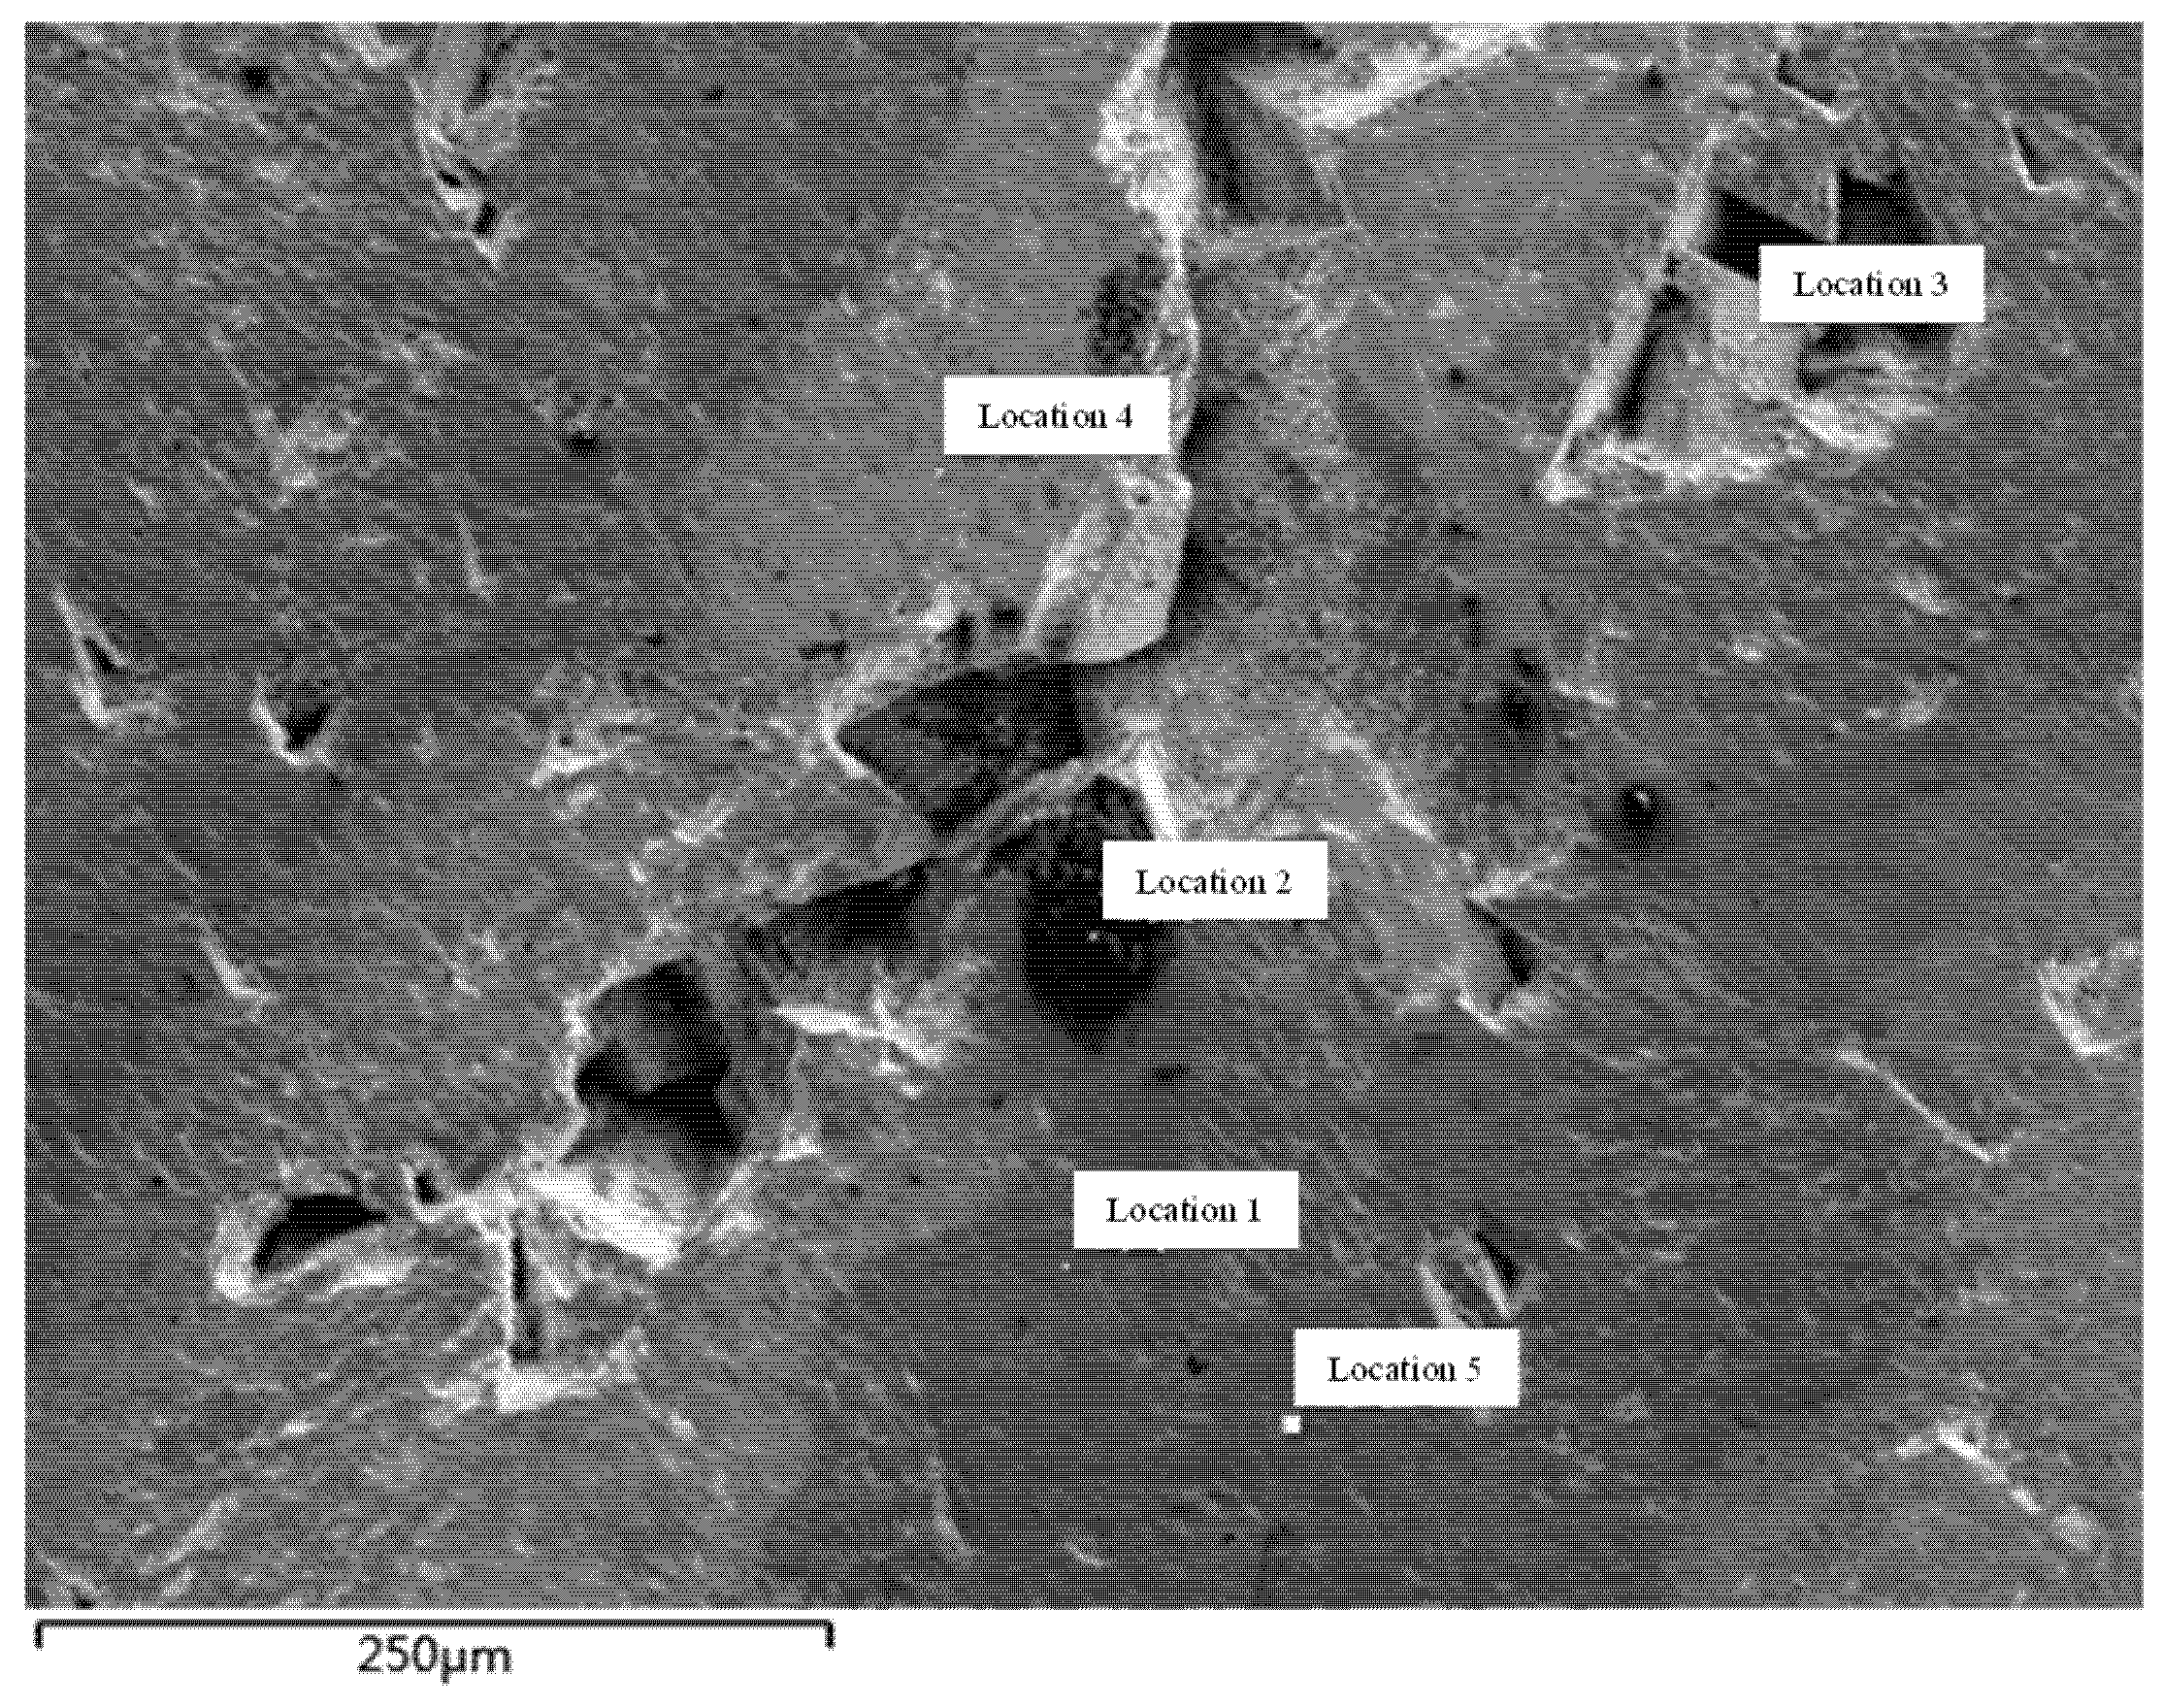
Under the scanning electron microscope (SEM), the microstructure of the tested rock samples and the EDS measurement locations are shown in Figure 5. A total of five locations were selected for elemental analysis, and the typical energy dispersive spectroscopy (EDS) results are presented in Figure 6. The summarized elemental mass percentage results for different locations within the rock samples are shown in Table 4. The analysis reveals that the primary elements present in the tested rock samples are oxygen (O), calcium (Ca), magnesium (Mg), and carbon (C). The high oxygen content likely originates from oxides or carbonates, while Ca and Mg are primarily associated with carbonates such as calcite (CaCO3) or dolomite (CaMg(CO3)2). Assuming Sample 1-1 is composed of dolomite (CaMg(CO3)2), the ideal atomic ratio of Ca:Mg:C:O would be 1:1:2:6. Converting to the atomic percentage, the total atom count sums to 10, giving the expected atomic percentages: Ca (10%), Mg (10%), C (20%), O (60%). From Table 4, the atomic percentage of Sample 1-1 is Ca (10.3%), Mg (13.5%), C (22.1%), and O (54.2%), which deviates from the expected values for pure dolomite. This discrepancy suggests that Sample 1-1 may contain additional components such as excess MgO, CaO, or other mineral impurities.
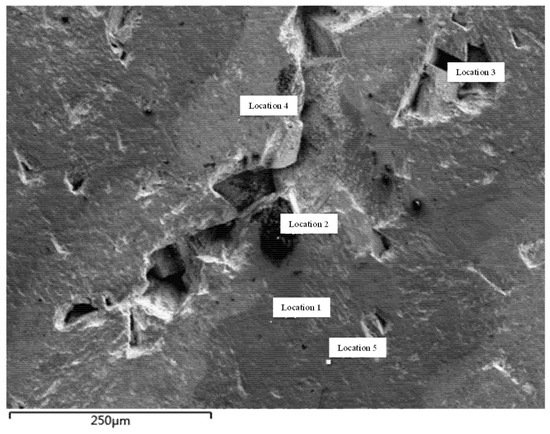
Figure 5.
Energy dispersive spectroscopy (EDS) analysis location in Sample 1-1.
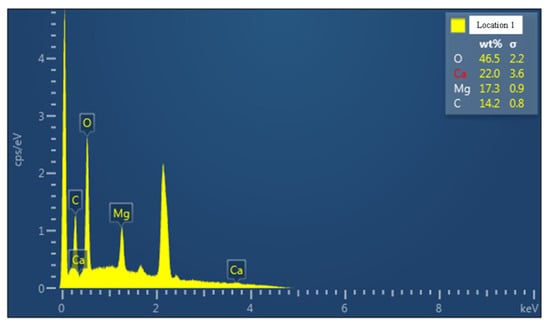
Figure 6.
Energy dispersive spectroscopy (EDS) analysis results for Location 1 in Sample 1-1.
Table 4.
Summary of Elemental Mass Percentage Test Results for Sample 1-1.
Comprehensive Analysis: These samples likely contain varying proportions of carbonates (such as CaCO3, MgCO3, and dolomite) as well as other components such as oxides or organic matter. This confirms that the primary mineral component of the tested rock samples is magnesium dolomite, further validating the accuracy of the X-ray diffraction (XRD) results for non-clay minerals. During the sample preparation process, some decomposition reactions of magnesium dolomite may have occurred, leading to water absorption. This could explain the slightly elevated oxygen content in the analysis.
3.2. Curve Characteristics and Micromechanical Properties Analysis
3.2.1. Curve Characteristics
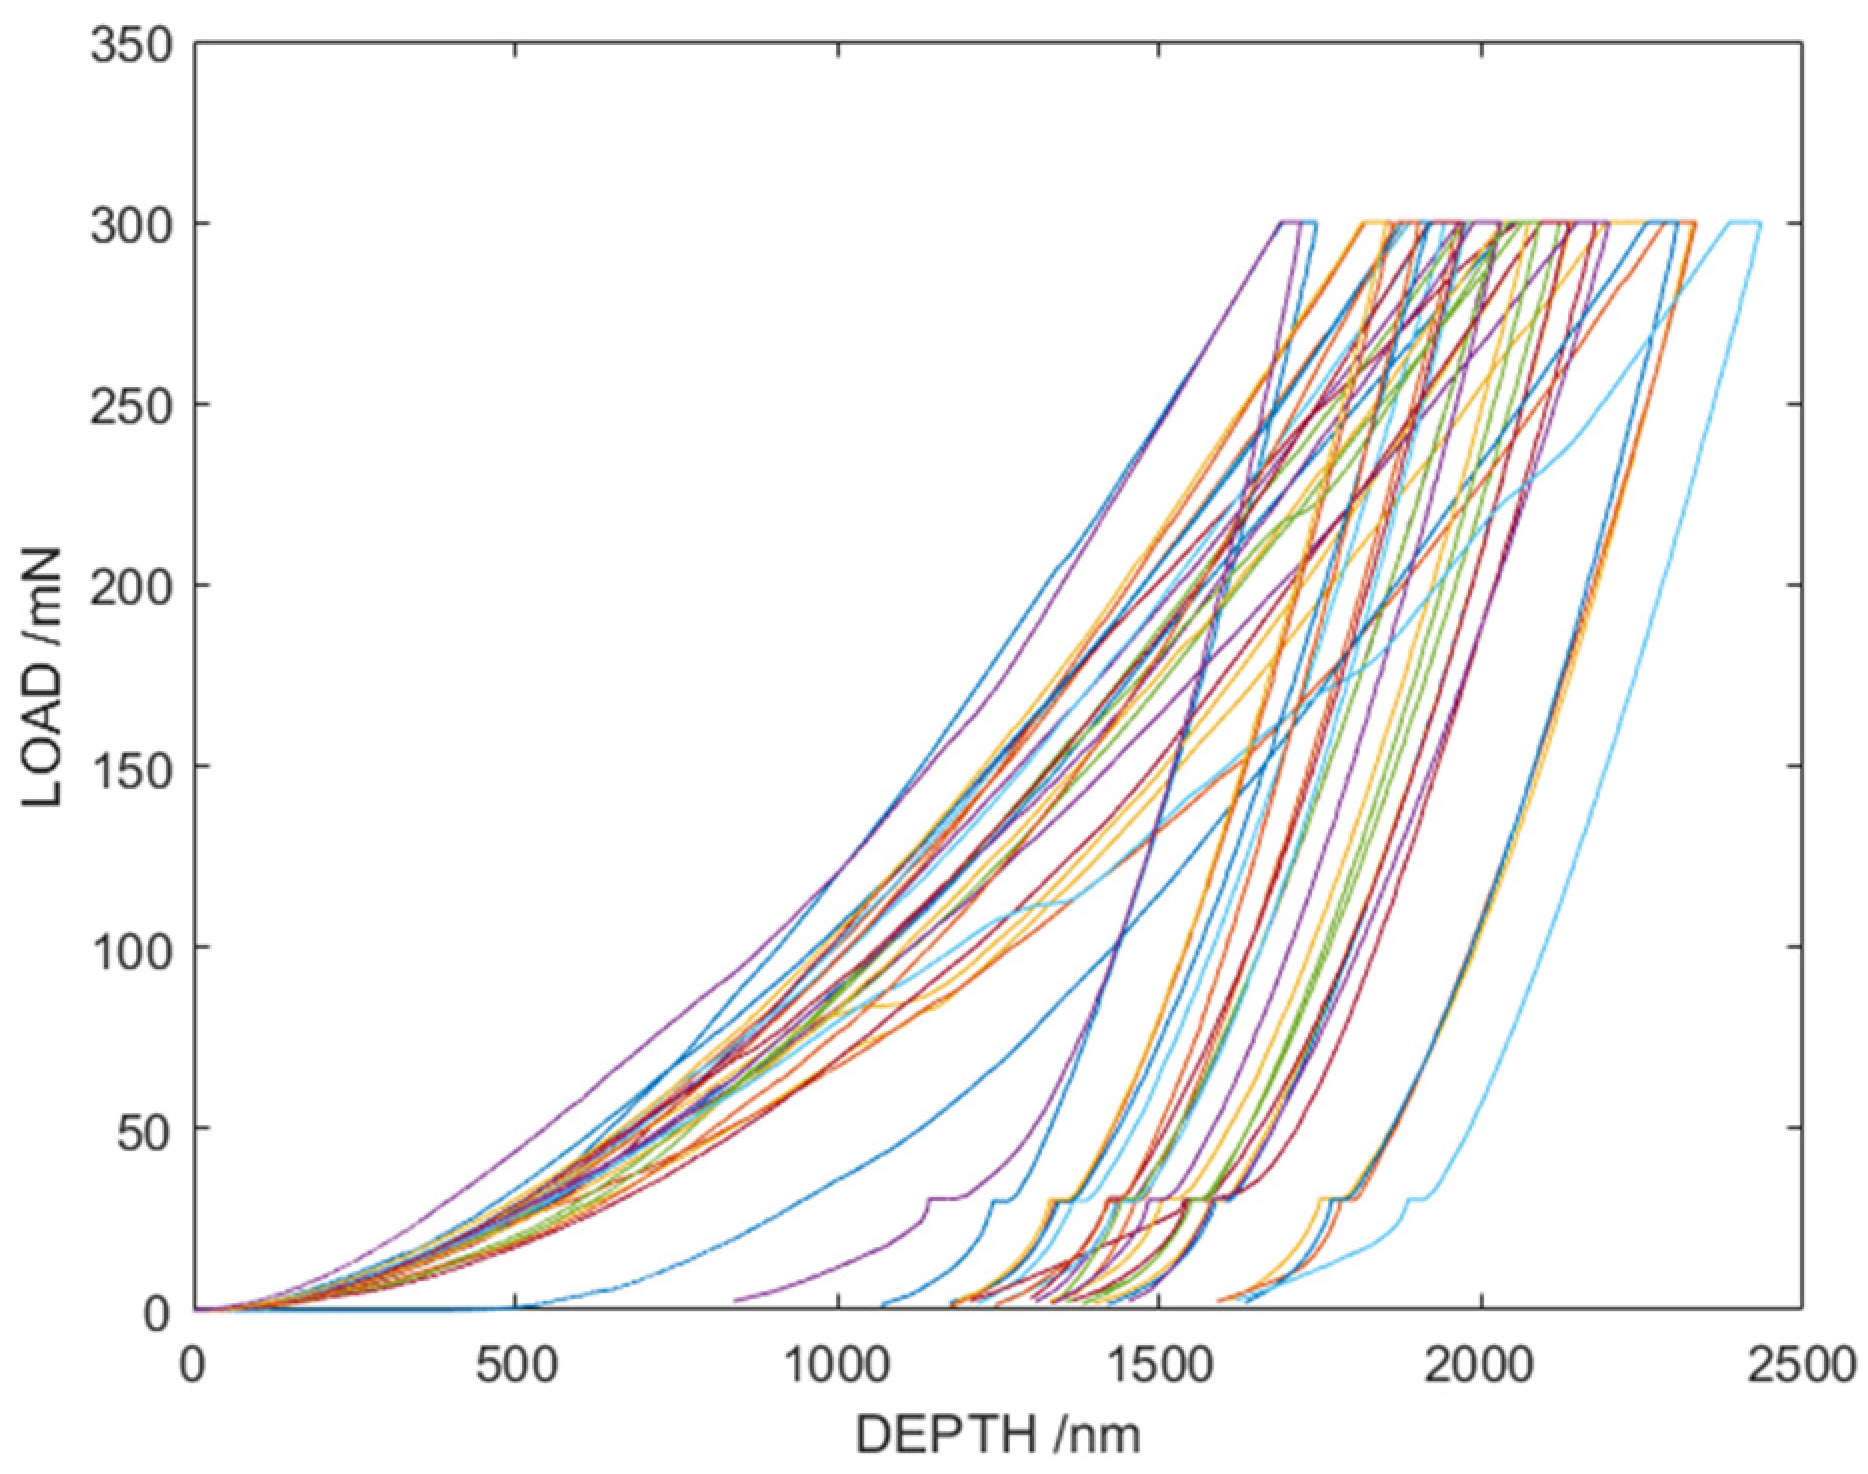
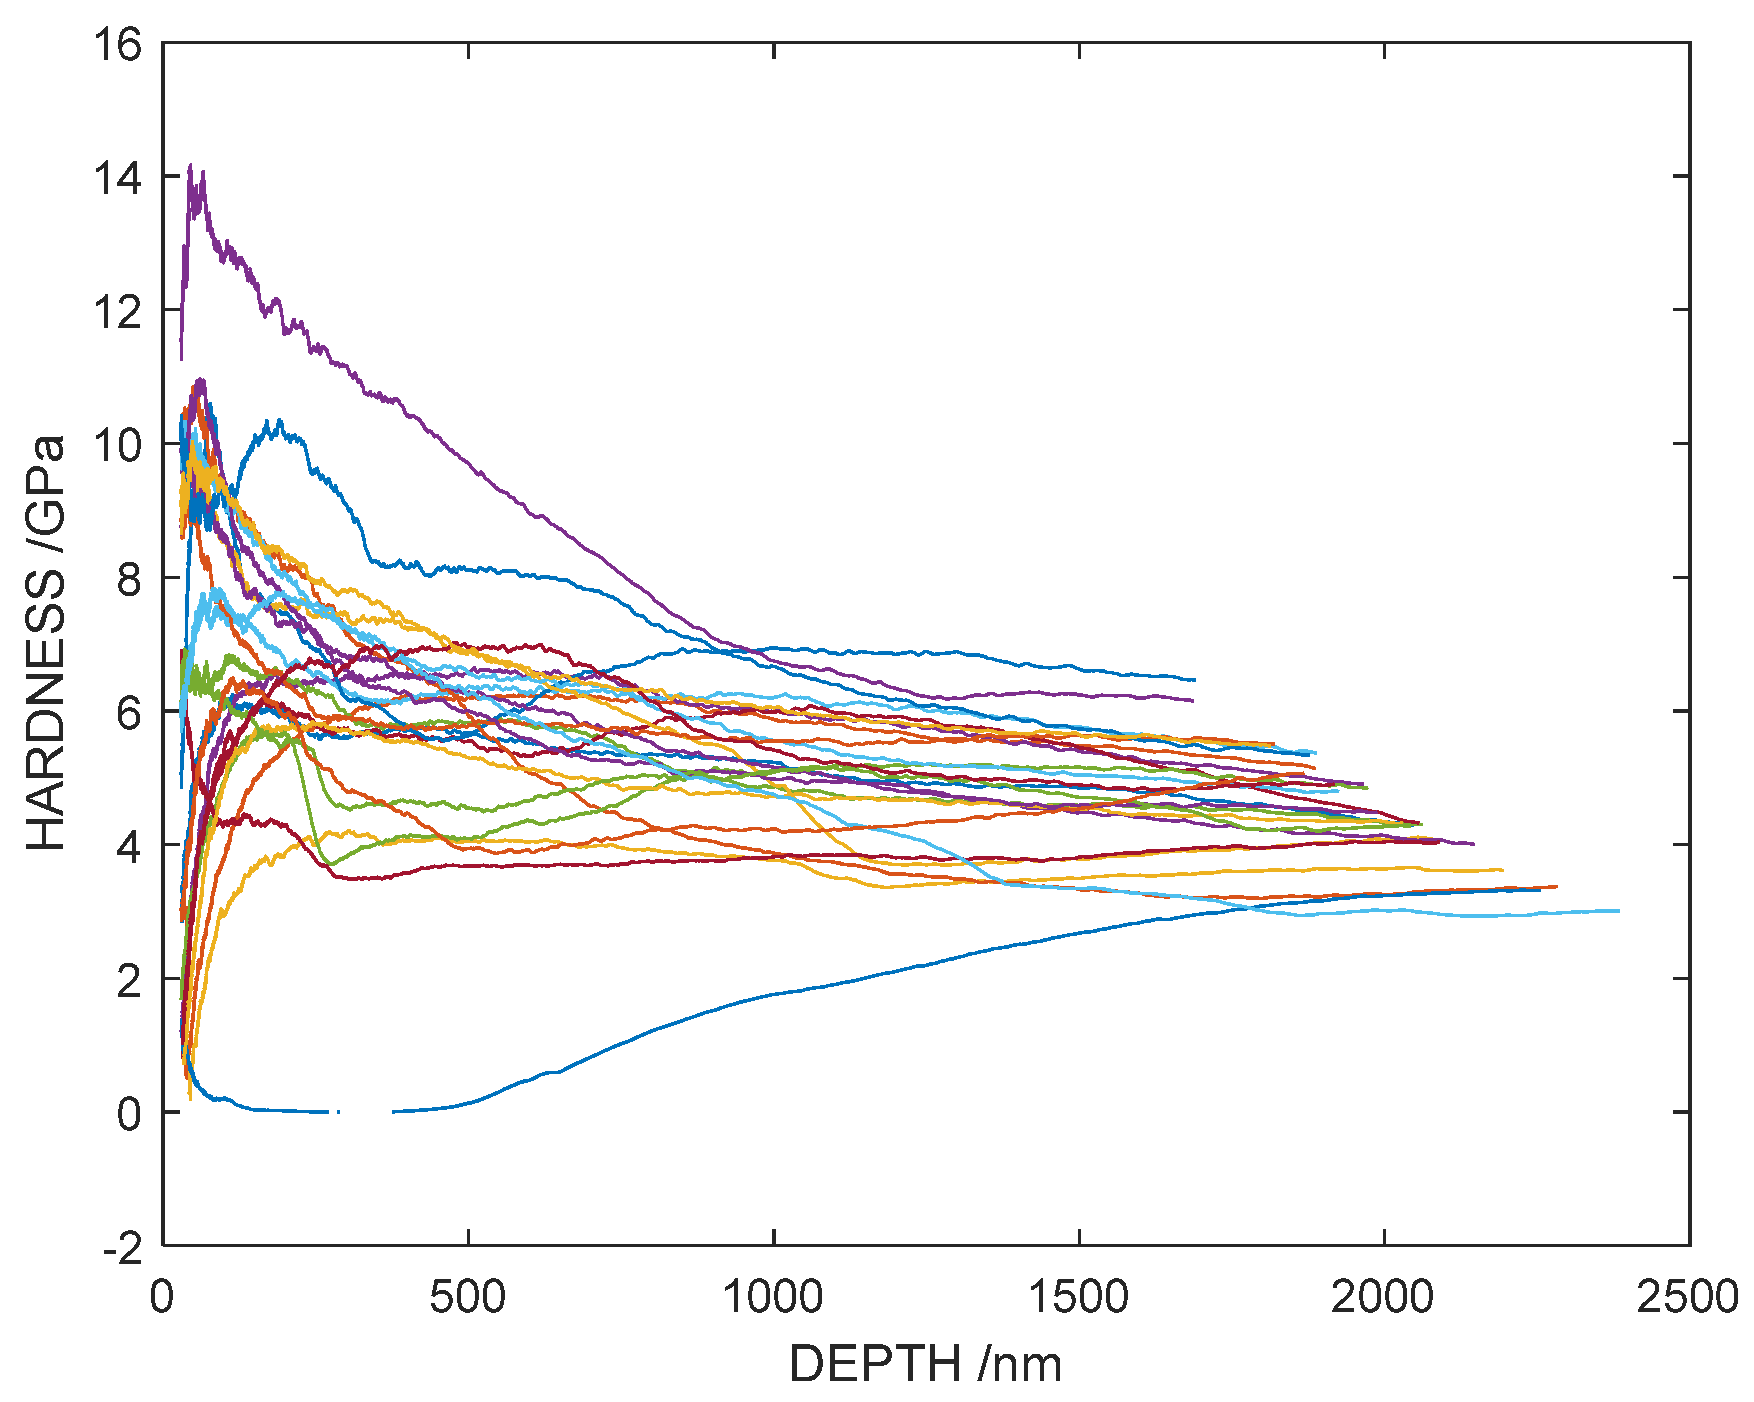
Taking the experimental results of Sample 1-1 as an example, the load–depth unloading curve characteristics of nanoindentation were analyzed. The load–depth unloading curve for Sample 1-1 is shown in Figure 7. In the figure, it can be observed that pop-in phenomena occurred at four locations during the loading process. This may be due to the presence of pores, cracks, or other defects in the rock sample at these positions. Alternatively, the sample may have fractured or developed cracks during indentation, causing a sudden increase in indentation depth, which results in the pop-in effect. When analyzing the data, it may also be necessary to examine whether any abnormal phenomena occurred during the testing process, such as cracks around the indentation or brittle fracture of the material, as these factors can affect the accuracy of the test results. Excluding the abnormal load–depth curves, it can be seen that most residual indentation depths are distributed between 1200 and 1400 nm, indicating that the dolomite mineral exhibits good homogeneity, and the load–depth curves are relatively concentrated.

Figure 7.
The load–depth unloading curve for Sample 1-1.
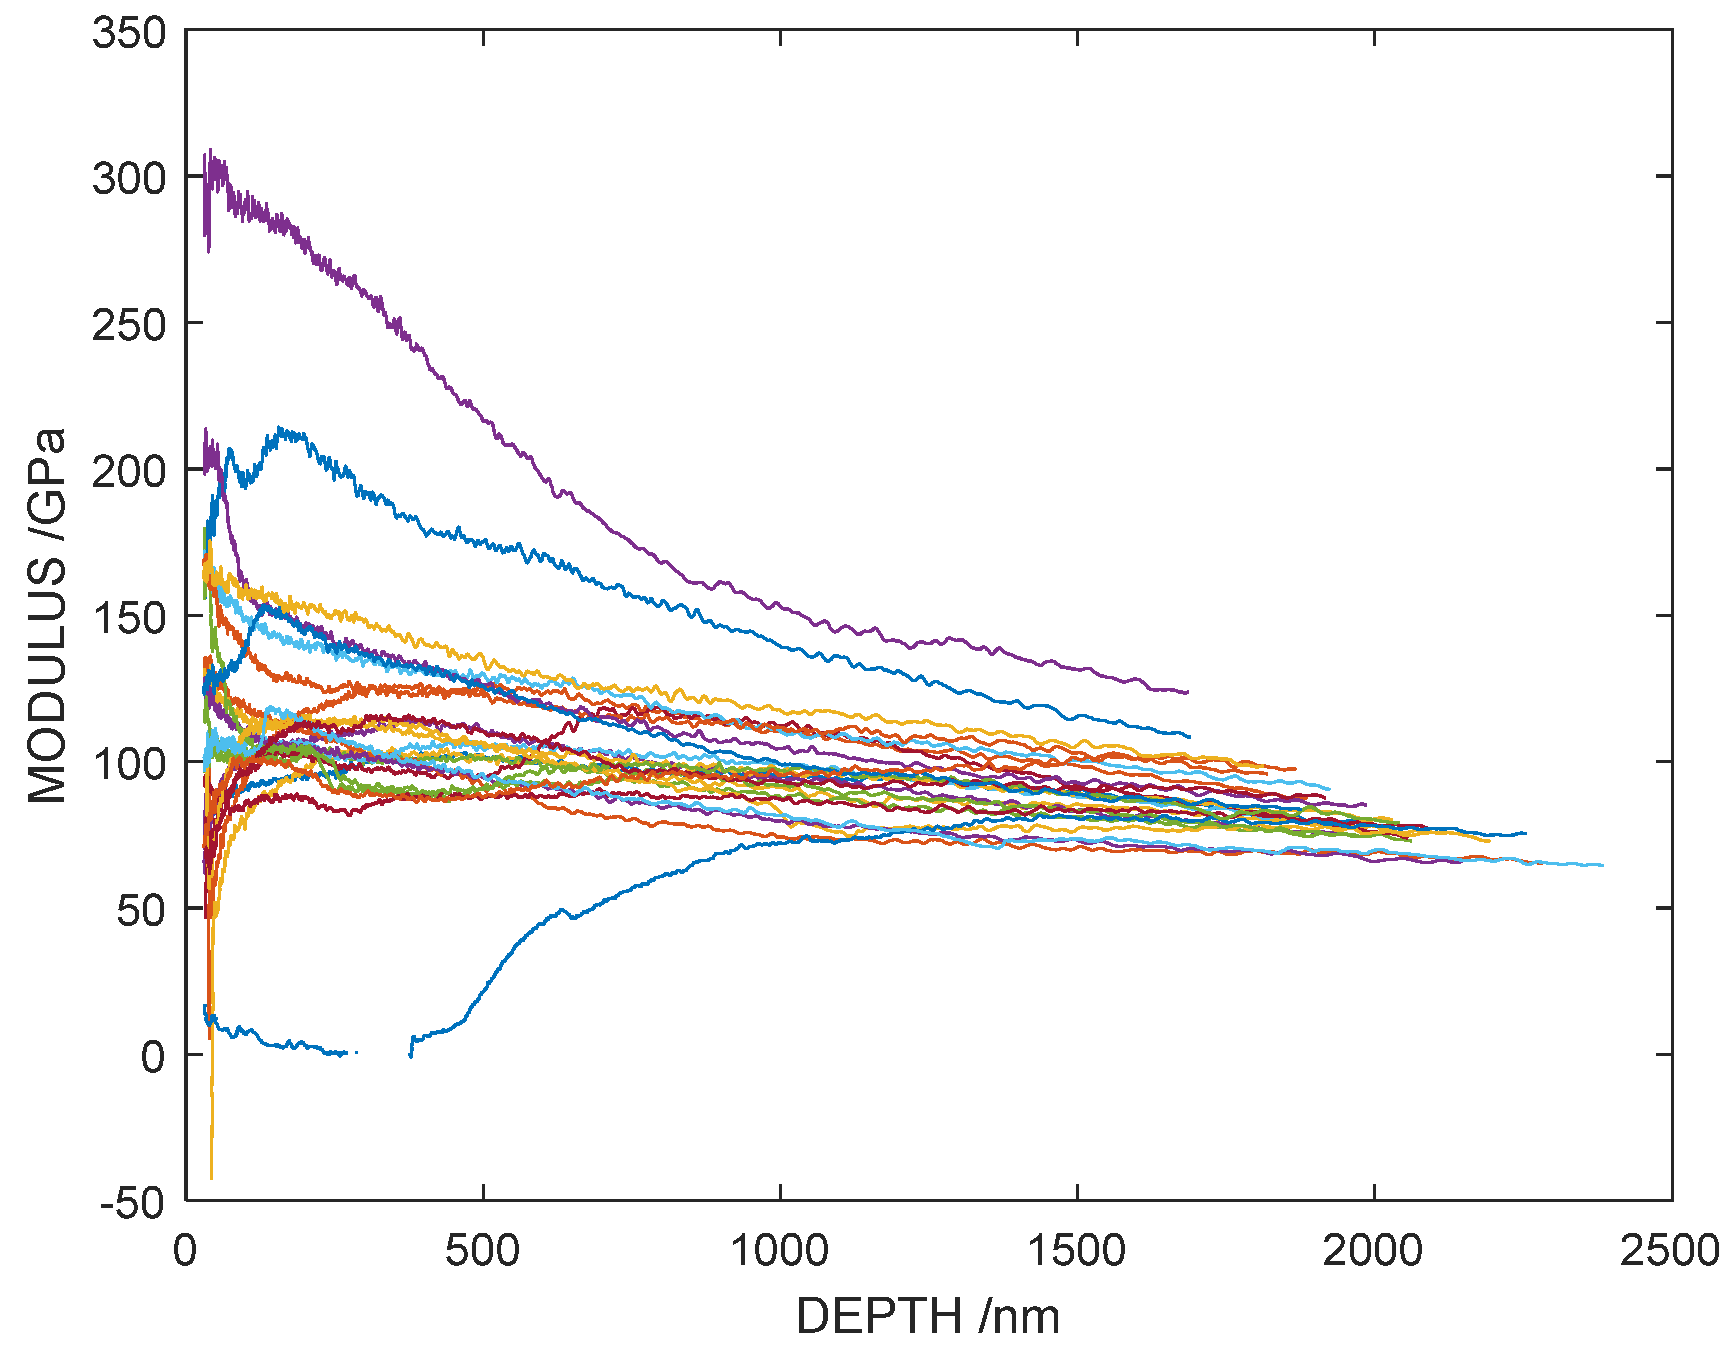
Similarly, the elastic modulus and hardness of Sample 1-1 as a function of indentation depth were plotted in Figure 8 and Figure 9, respectively. These figures show that, for most indentations, the elastic modulus and hardness sharply decrease with increasing depth at first and then remain nearly constant. For a few indentations, the elastic modulus and hardness sharply increase at first and then stabilize.
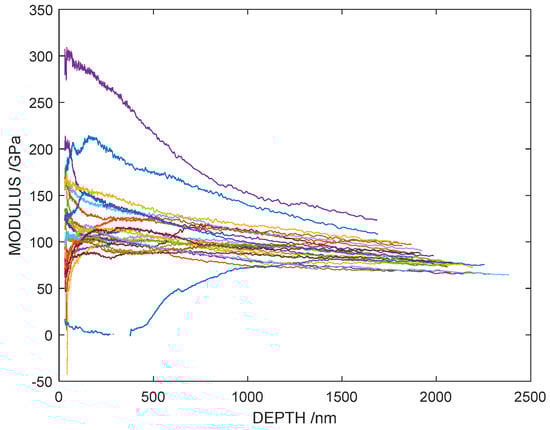
Figure 8.
The elastic modulus of Sample 1-1 as a function of indentation depth.
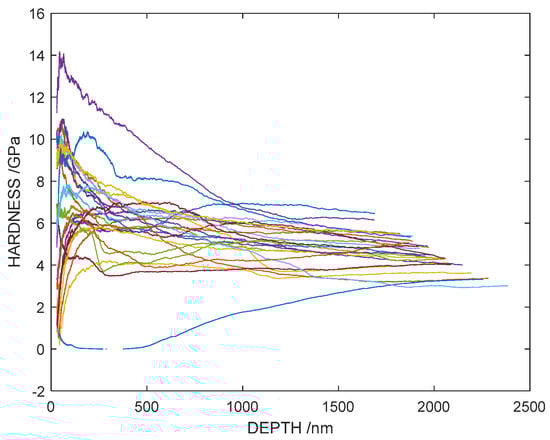
Figure 9.
The hardness of Sample 1-1 as a function of indentation depth.
This indicates the presence of the indentation size effect (ISE) in the experiment. In this case, under small load conditions, the hardness calculation no longer follows Kick’s Law but instead adheres to Meyer’s Law. Several factors may contribute to this phenomenon, and system vibrations in the testing setup have a greater influence at lower loads. Surface hardening occurs due to polishing during the sample preparation. At low loads, dislocation slip between grains occurs, leading to increased deformation as the load increases. When the load reaches a certain threshold, this slip is restricted, causing the elastic modulus and hardness to stabilize as the load continues to increase. Additionally, as depth increases, the elastic modulus and hardness across different indentations become more consistent. However, the elastic modulus shows less dispersion, whereas hardness exhibits slightly greater variability.
3.2.2. Micromechanical Property Analysis
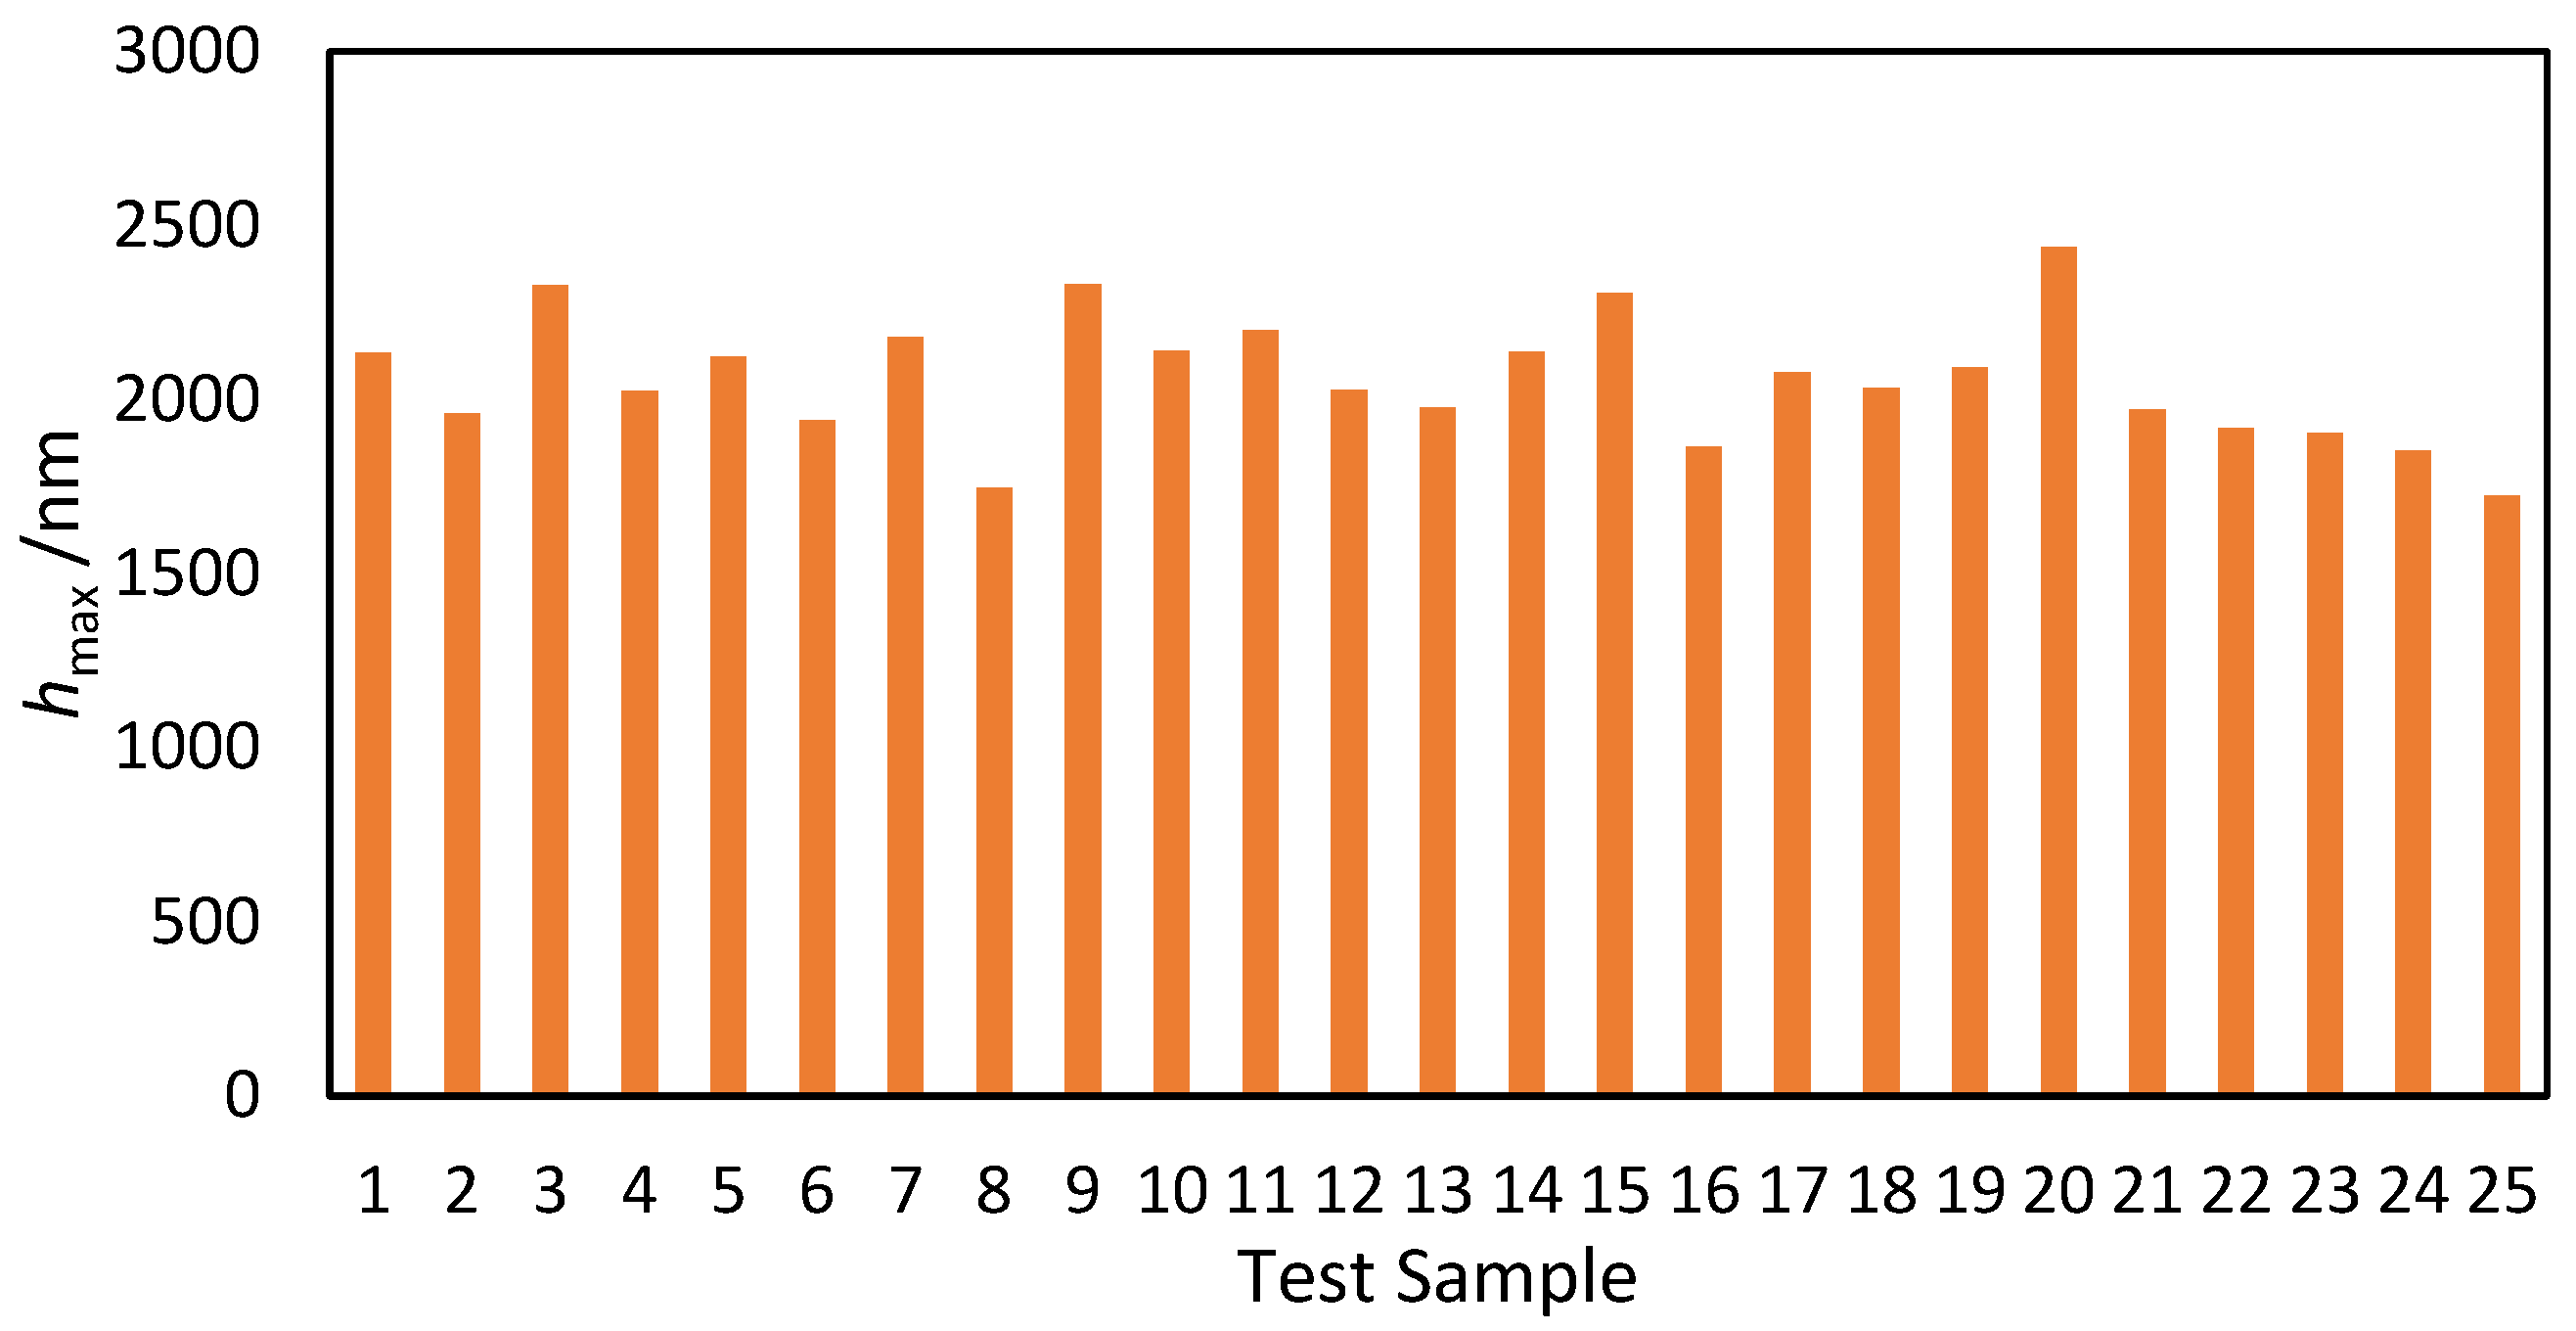
Similarly, taking the experimental results of Sample 1-1 as an example, the micromechanical properties of dolomite were studied. Figure 10 shows the bar chart of the maximum indentation depth for Sample 1-1. When the load reaches 300 mN, the indentation depth is approximately 2000 nm, and the distribution is relatively concentrated. This further confirms the homogeneity of the tested rock sample, indicating that the mineral composition of the rock sample is relatively uniform.
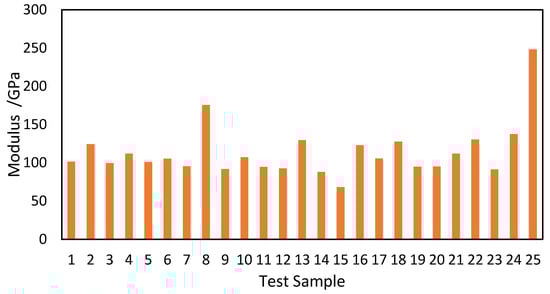
Figure 10.
Bar chart of the elastic modulus test results for Rock Sample 1-1.
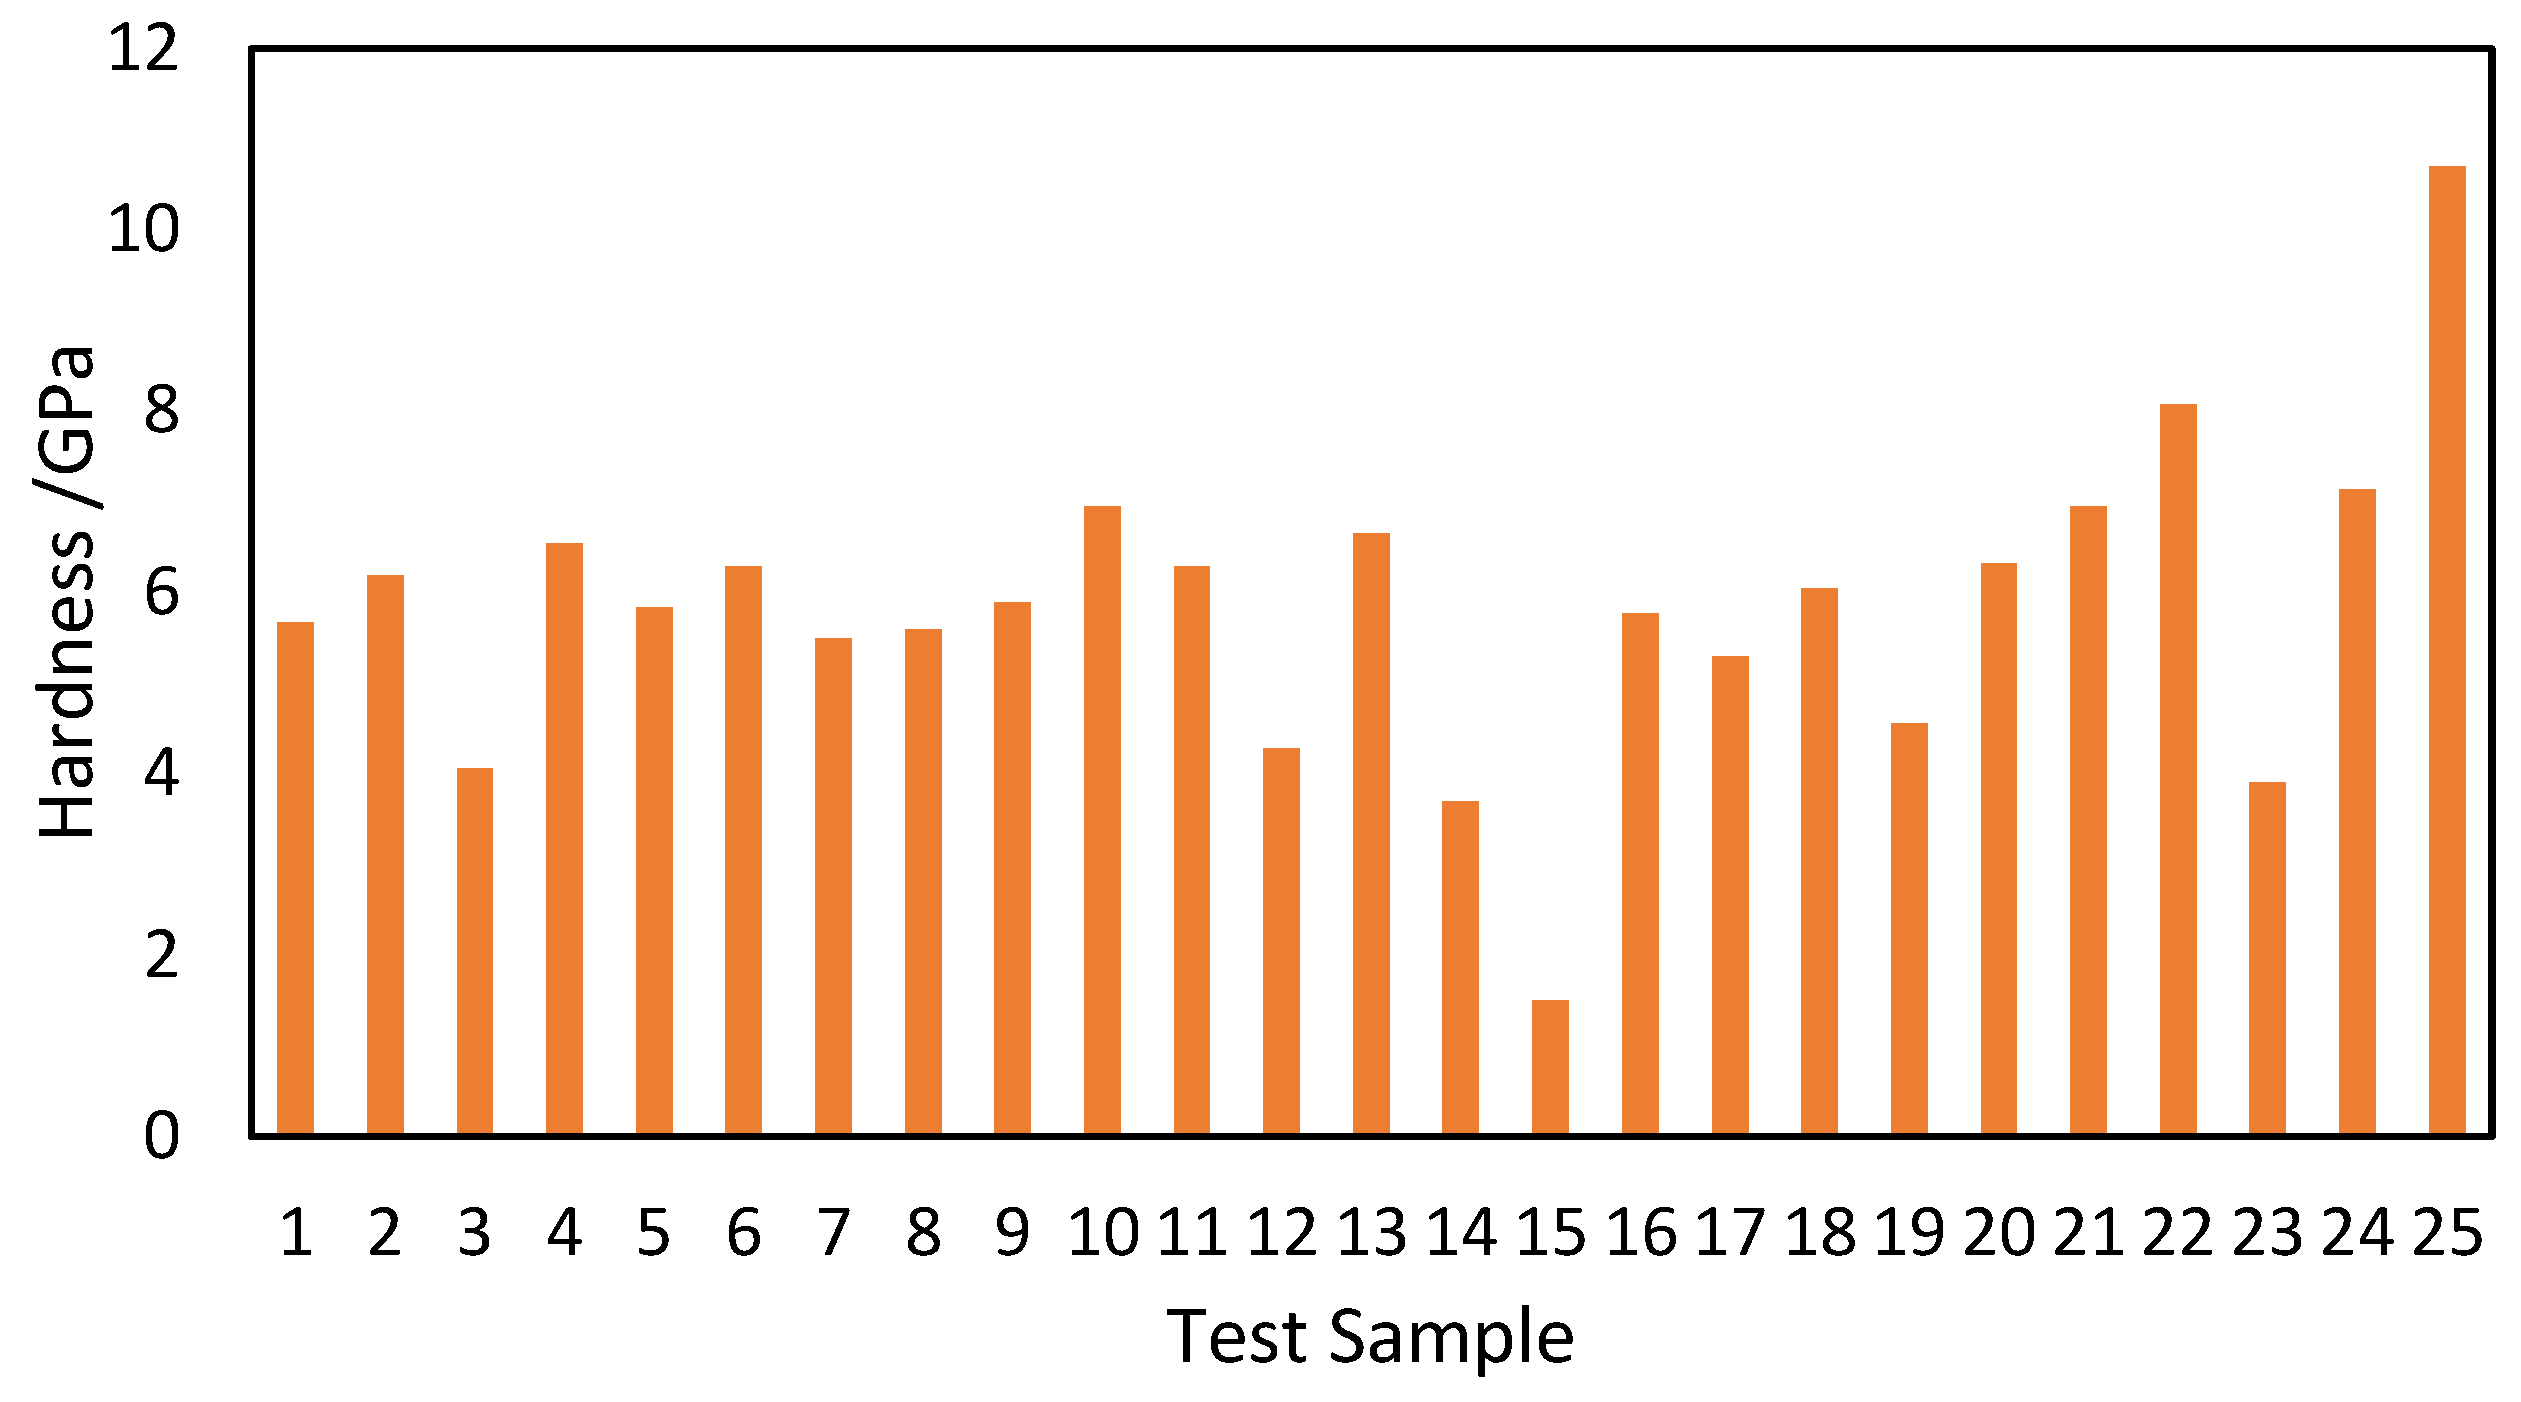
The dolomite hardness test results at different locations of rock sample 1-1 are shown in Figure 11. The hardness test results range from 1.5 to 10.7 GPa, with an average value of 5.82 GPa. The hardness measured at Location 15 is unusually low at 1.5 GPa, while the hardness measured at Location 25 is unusually high at 10.7 GPa. After excluding the anomalous data points, the hardness at most locations is distributed around 6 GPa. The elastic modulus test results are shown in Figure 12. The elastic modulus range is from 68.2 to 248.4 GPa, with the smallest result at Location 15 and the largest result at Location 25. The elastic modulus at Location 8 is also unusually high. After excluding these three anomalous points, the elastic modulus of the dolomite is around 114.12 GPa, showing good homogeneity in the sample. The statistical analysis of the micro-mechanical properties test results for the five samples in this study, including the maximum indentation depth, hardness, and elastic modulus average values, is shown in Table 5.
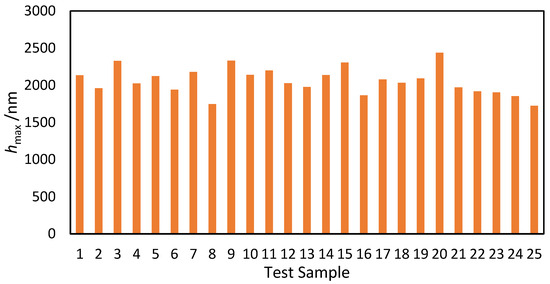
Figure 11.
Maximum indentation depth test results bar chart for Rock Sample 1-1.

Figure 12.
Hardness test results bar chart for Rock Sample 1-1.
Table 5.
Summary of Micro-Mechanical Properties Test Results for Dolomite.
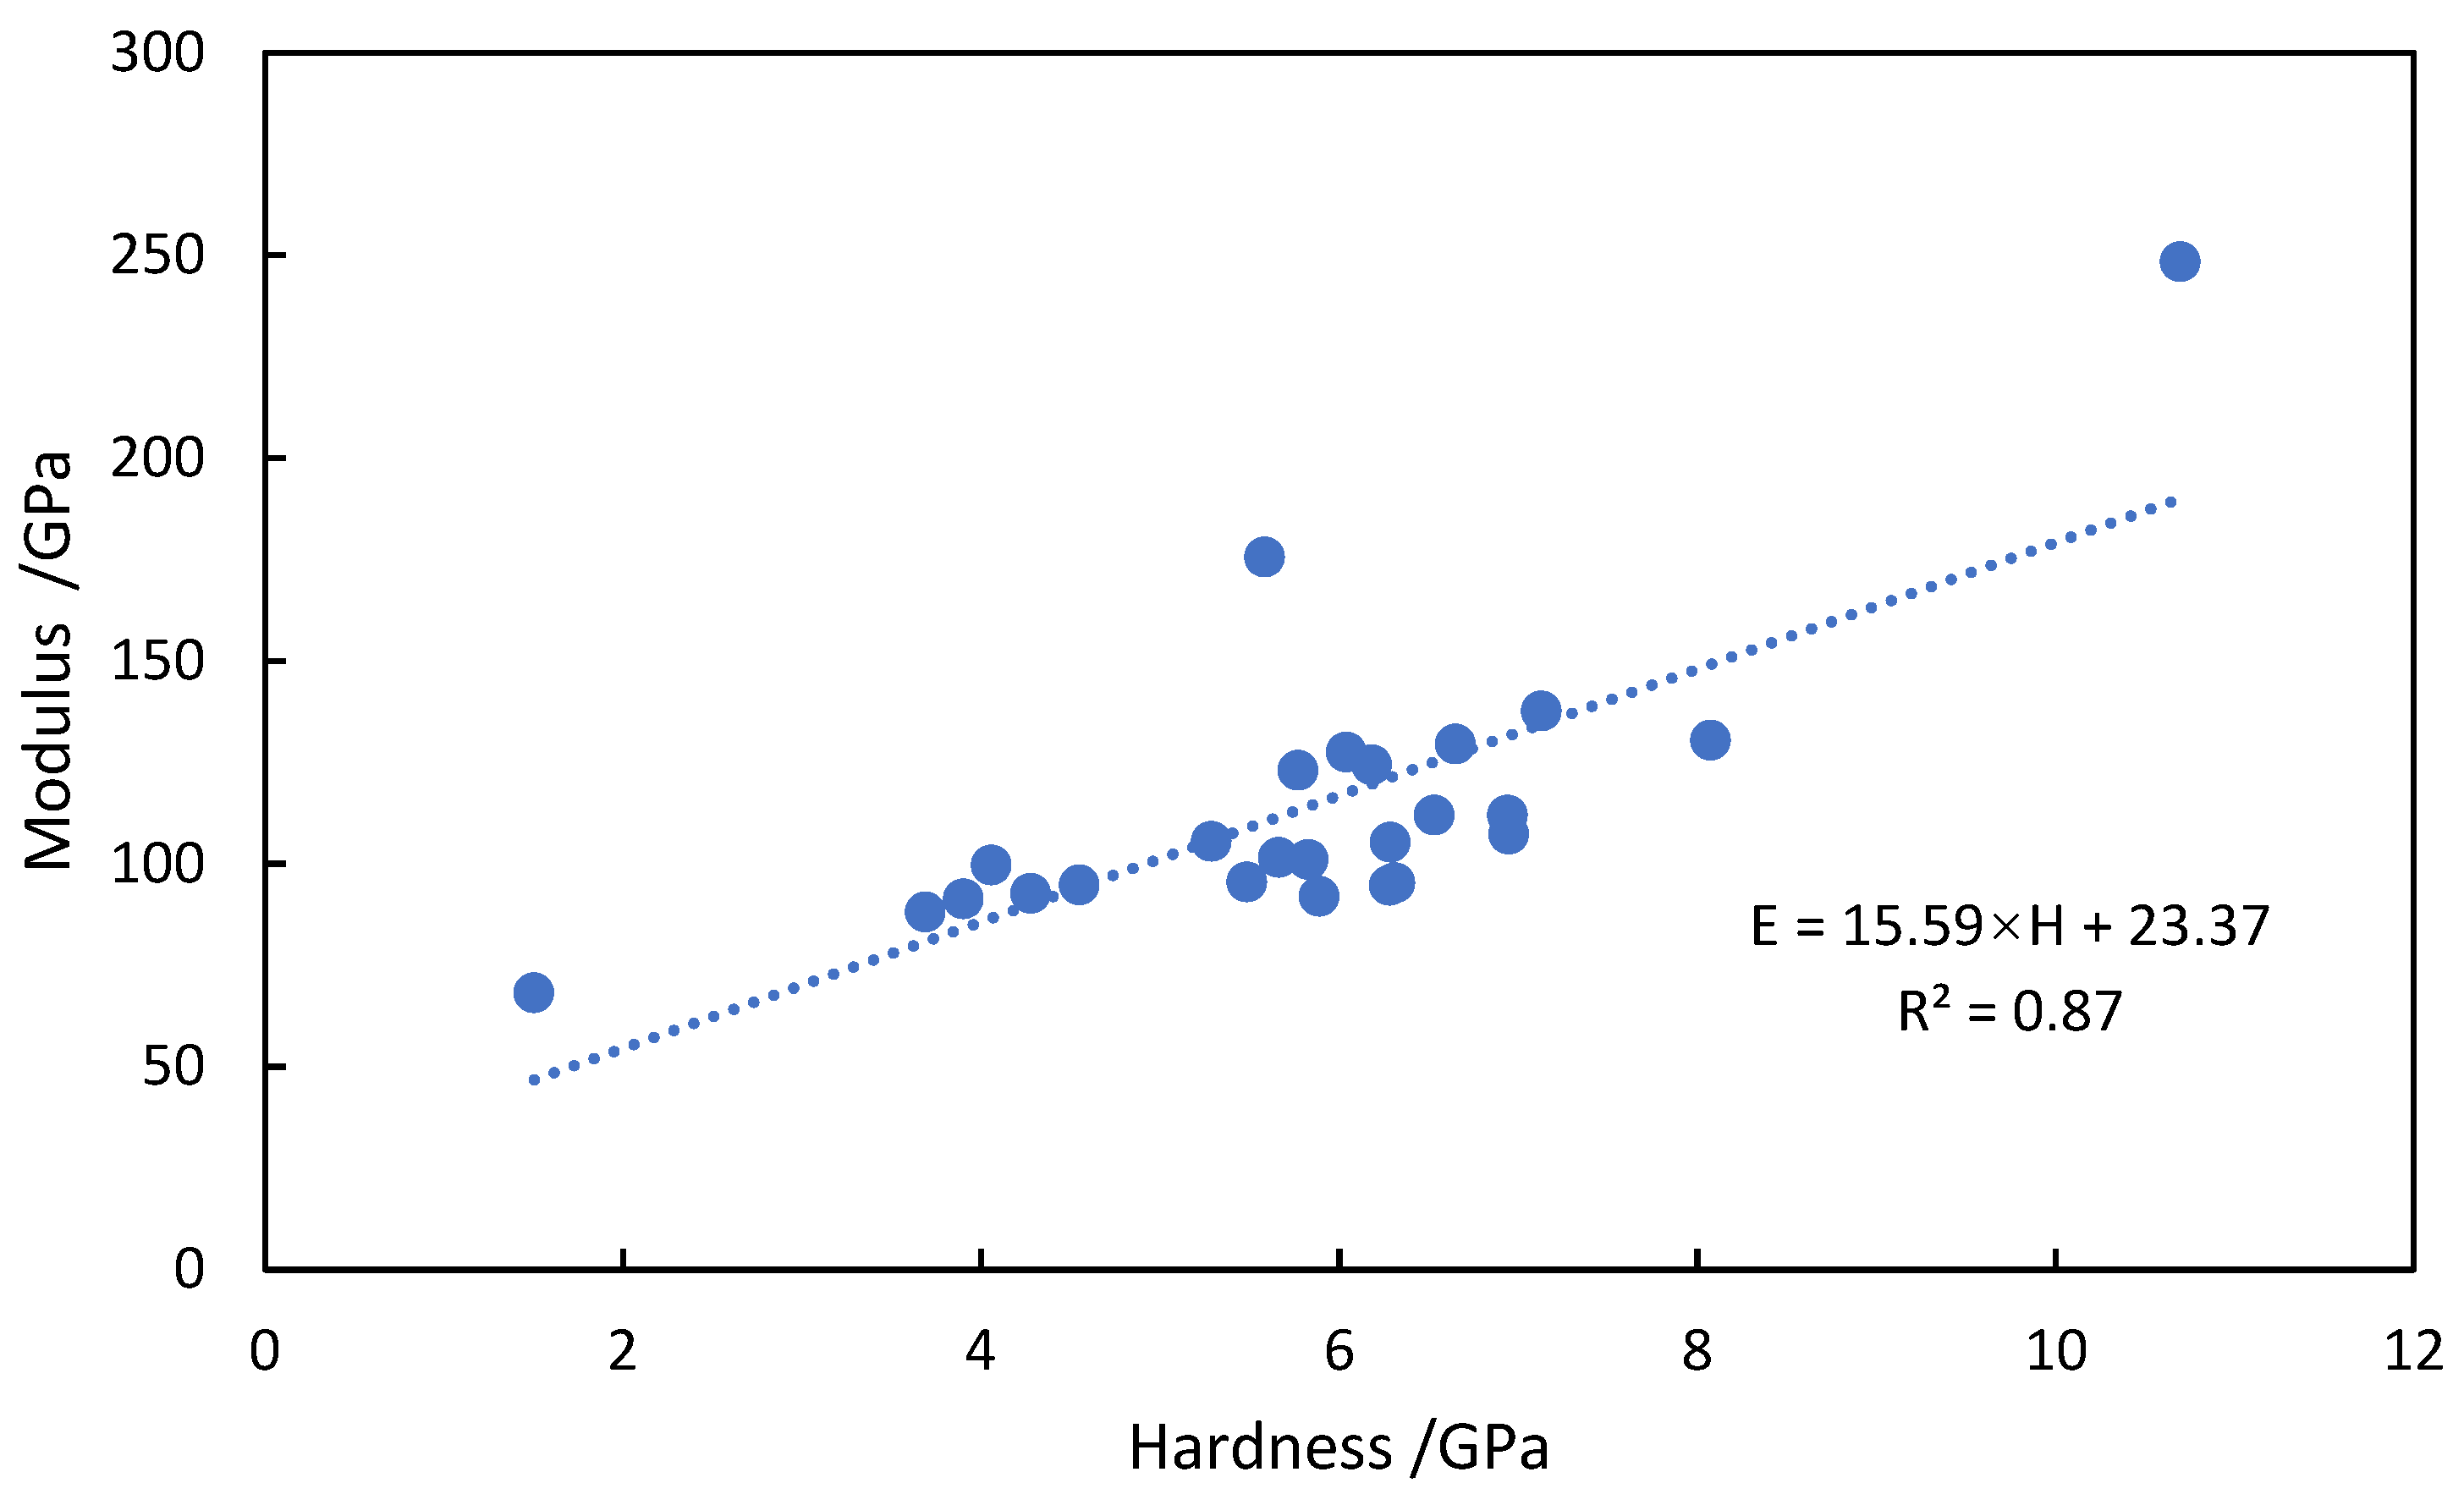
Using the test results of Rock Sample 1-1 as an example, the correlation between the micro-mechanical parameters of dolomite is analyzed. Figure 13 shows the correlation between the elastic modulus and hardness of dolomite. It can be observed that as the hardness increases, the elastic modulus also gradually increases, indicating a strong linear correlation between the two.
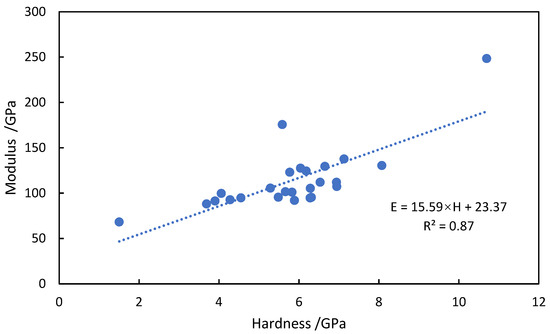
Figure 13.
Correlation analysis between the elastic modulus and hardness of Rock Sample 1-1.
3.3. Analysis of Microstructural Damage Morphology
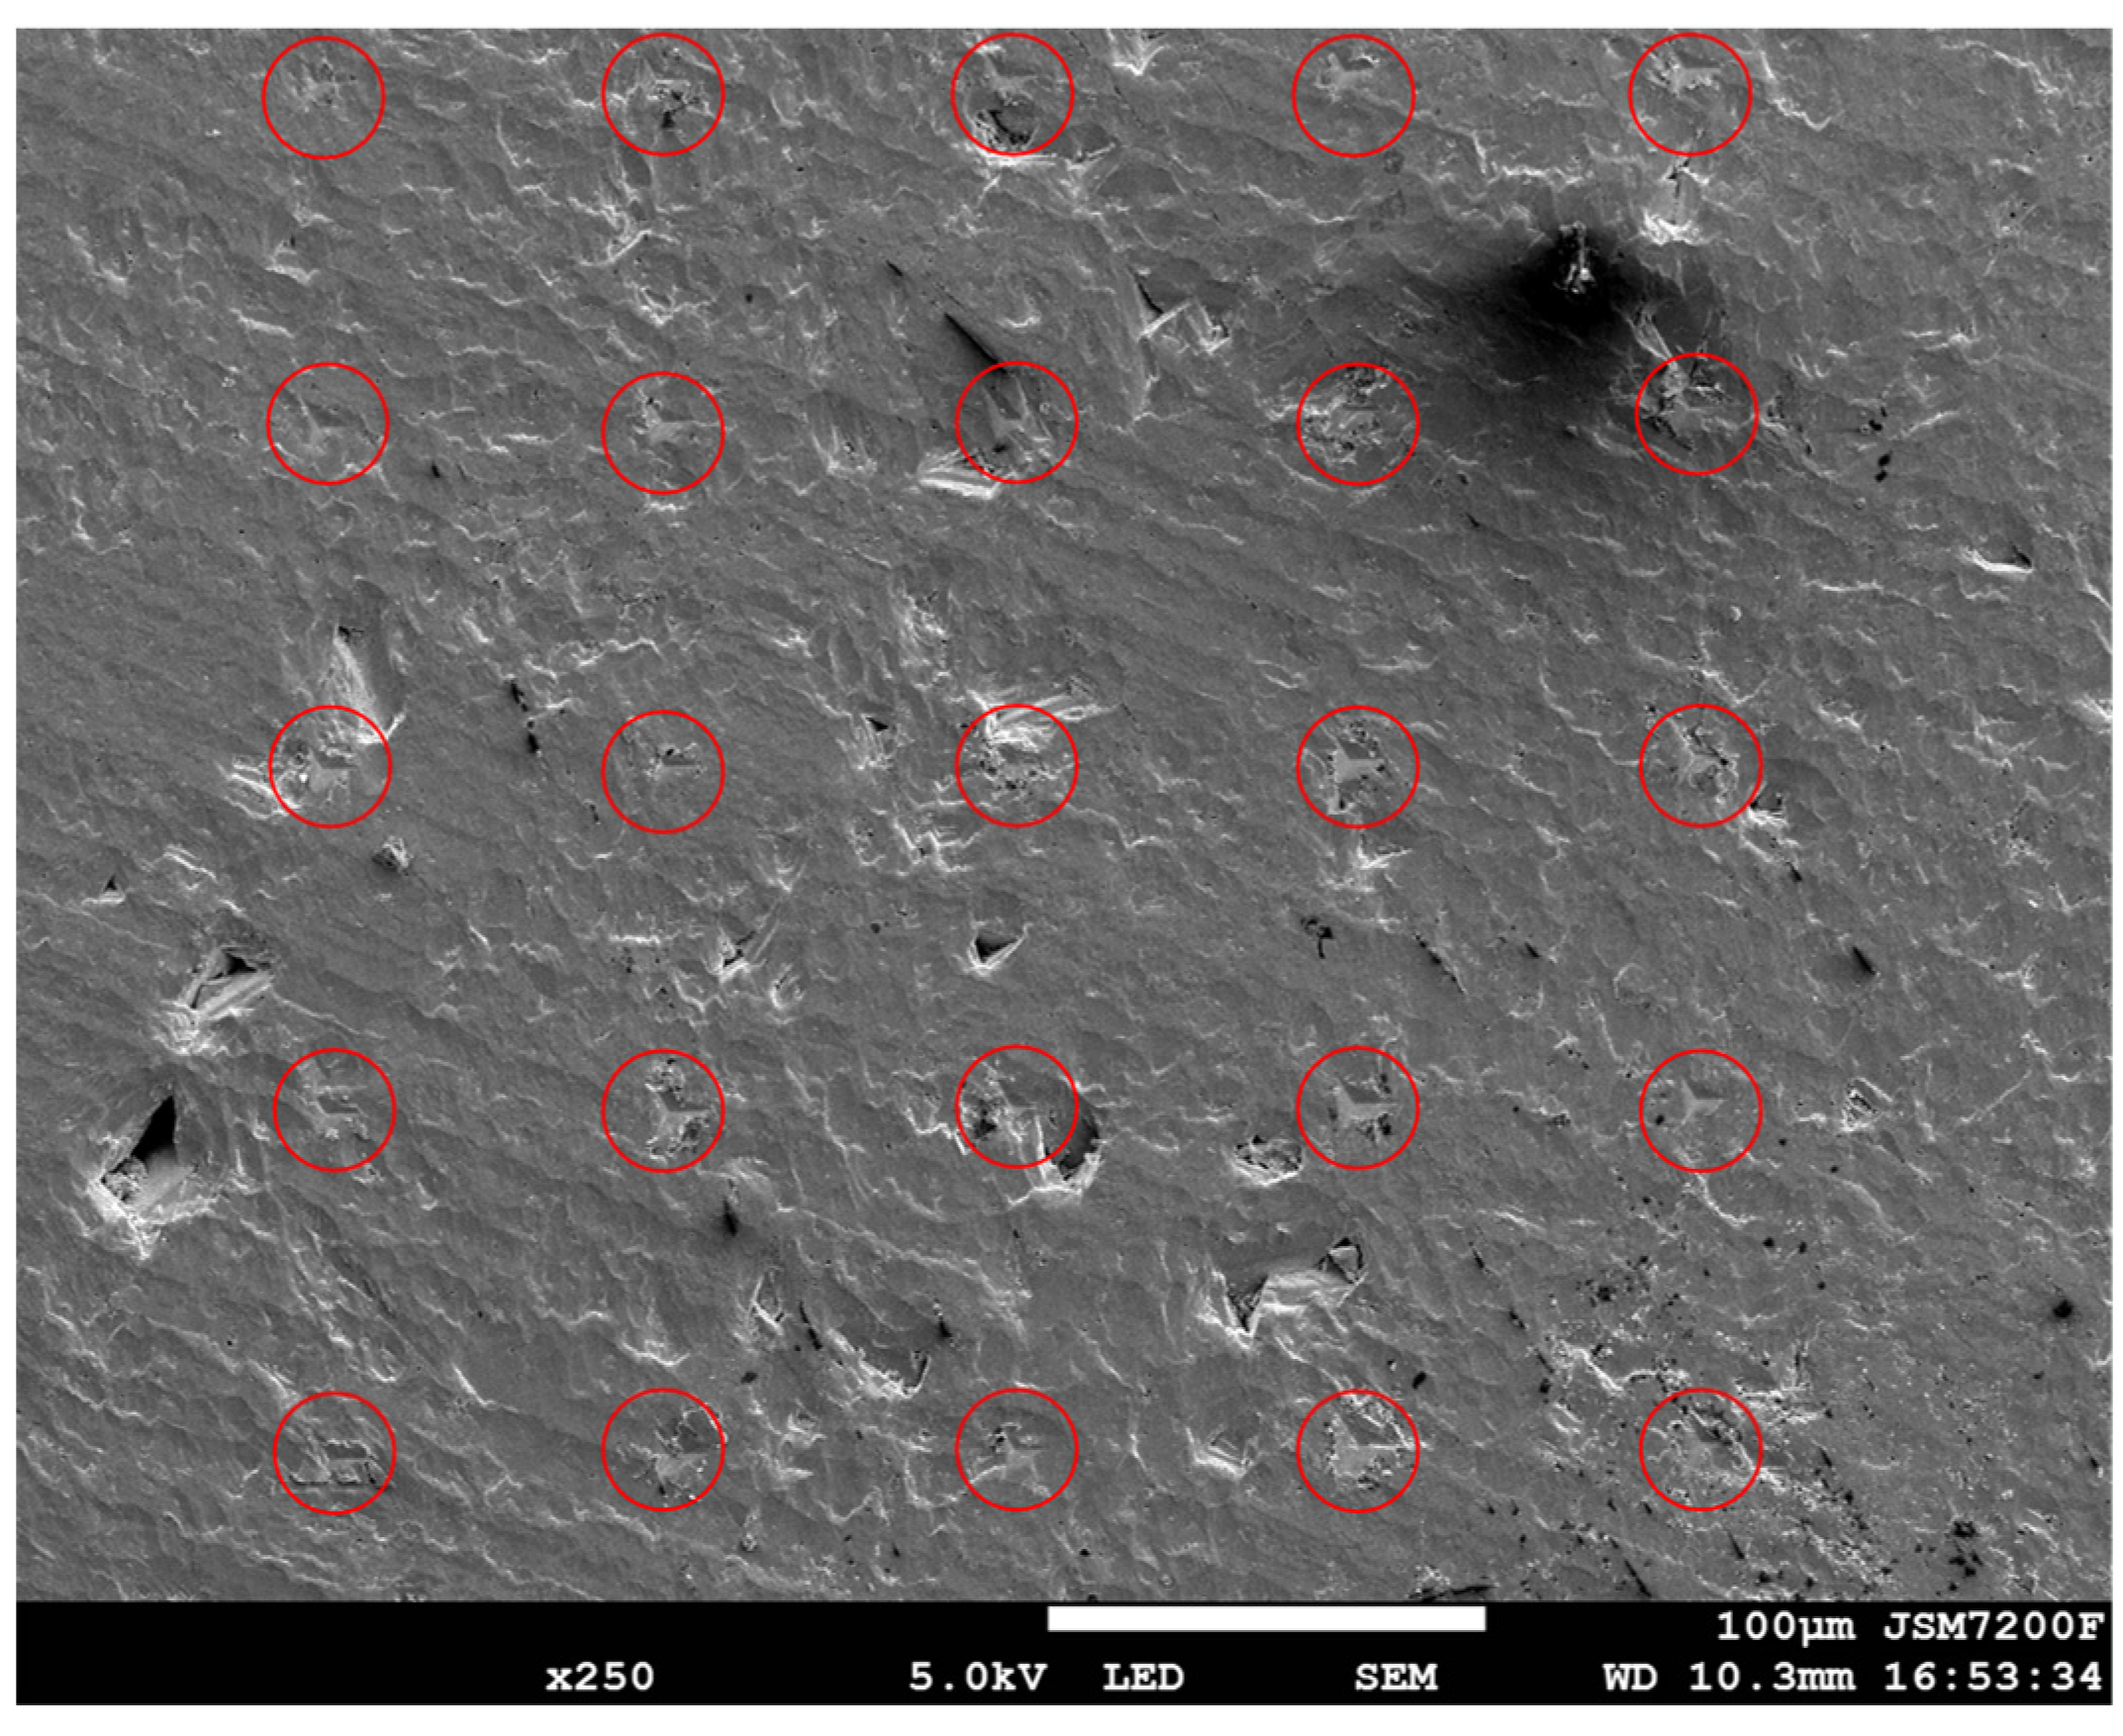
To reveal the reasons behind the load–depth curve characteristics at different indentation positions, it is necessary to observe the crack morphology of the indents at the microstructural level. The residual indentation morphology test array for rock sample 1-1 is shown in Figure 14. Further magnification of the residual indents at different positions, combined with the load–depth loading–unloading curves and micro-mechanical parameter test results, will allow a deeper analysis of the microfracture mechanisms in dolomite. If the indentations have no cracks and exhibit a regular shape, the material may display good plasticity. If cracks are present, the brittle fracture mechanism should be considered.
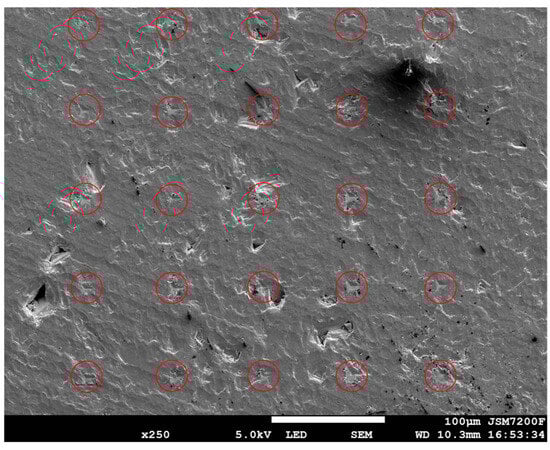
Figure 14.
Microscale fracture morphology of residual indentation in Rock Sample 1-1.
Different types of residual indent microfracture morphologies were analyzed, as shown in Figure 15. Overall, the indentations at different positions exhibit a regular diamond shape, consistent with the typical Berkovich indenter geometry. If the loading rate is too fast or the hold time is insufficient, it may cause non-steady-state deformation; however, the regular diamond shape typically indicates that the test conditions (such as quasi-static loading) are reasonable and also suggests that dolomite exhibits certain plastic characteristics. At Position 3, there are obvious radial cracks along the indentation, indicating tensile failure. At Position 8, multiple sets of cracks appear inside the indentation, indicating shear failure. The measured hardness is relatively low, suggesting that this location has stronger brittleness. Additionally, due to rock failure during loading, the loading depth increases suddenly, causing a pop-in phenomenon. The residual indentation at Position 8 is smaller in size, indicating that the rock at this position mainly undergoes elastic deformation, leading to a larger elastic modulus. At Position 15, significant damage is observed due to the rock’s internal pores and cracks, resulting in much lower hardness and elastic modulus values compared to typical dolomite properties. At Position 20, the residual indentation is larger, and the indentation morphology is regular with no cracks, suggesting that the rock at this location has better plasticity. Position 25 shows the smallest residual indentation, with no radial tensile cracks or shear cracks, indicating that the rock at this location has a significantly higher elastic modulus and hardness compared to other positions. By combining the microfracture morphology of the residual indents, the changes in the load–depth curve characteristics can be clearly revealed, providing insights into the mechanisms of changes in the micro-mechanical parameters.
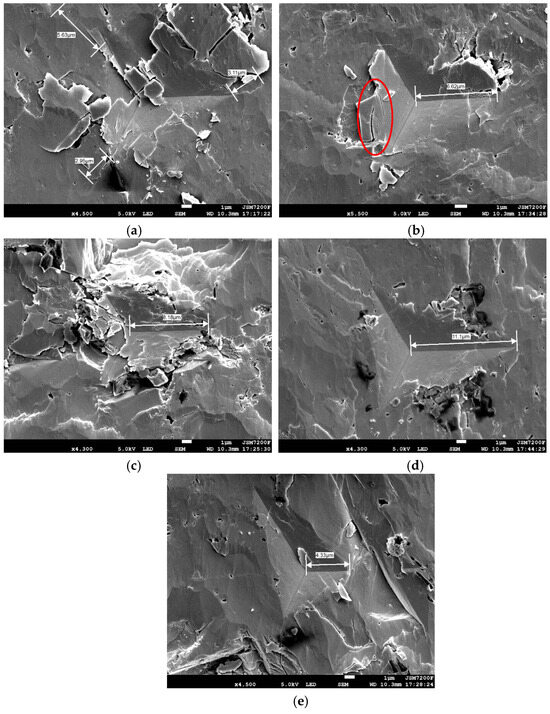
Figure 15.
Microfracture morphology of residual indents at different indentation positions. (a) Location 3. (b) Location 8. (c) Location 15. (d) Location 20. (e) Location 25.
4. Discussion
The experimental results demonstrate the effectiveness of the nanoindentation-based multiscale methodology in characterizing the micromechanical properties of dolostone. This section critically evaluates the advantages and limitations of the adopted approach, discusses potential sources of experimental error, and contextualizes the findings within broader geo-mechanical research.
By utilizing drill cuttings instead of intact cores, the method circumvents the challenges associated with sampling deeply fractured formations. This significantly reduces costs and operational complexity while enabling continuous data acquisition during drilling. The integration of XRD-EDS-SEM with nanoindentation provides a comprehensive understanding of mineral composition, elemental distribution, and localized mechanical behavior. This multi-technique synergy enhances the reliability of micromechanical parameter determination. Furthermore, unlike traditional compression tests, nanoindentation preserves sample integrity for subsequent analyses, improving material recyclability.
However, nanoindentation for rock mechanical characterization presents certain limitations and challenges. The method demands ultra-smooth surfaces for accurate measurements, as even minor polishing artifacts such as residual scratches or subsurface damage can distort load–depth curves. This is evidenced by anomalous hardness (1.5 GPa) and elastic modulus (248.4 GPa) values observed at specific locations (e.g., Positions 15 and 25). The diversity in hardness and elastic modulus at low loads (<50 mN) highlights the influence of surface hardening, dislocation dynamics, and instrument noise. Although the indentation size effect stabilizes at higher loads (>50 mN), careful load range selection remains crucial for reproducible results. Despite the high dolomite homogeneity (92.7%), calcite-filled fractures and microporosity introduced localized anomalies. These heterogeneities complicate the interpretation of micromechanical data, particularly in multi-mineral systems. Additionally, the elastic modulus calculation relies on isotropic material assumptions (Equation (6)), potentially oversimplifying the anisotropic crystal structure of dolomite.
The errors in the test results stem from a combination of factors. Residual surface damage from polishing, including microcracks or uneven topography, directly impacts indentation depth and contact area calculations. For instance, the pop-in phenomena shown in Figure 7 likely originated from subsurface defects introduced during grinding. Imperfections in the Berkovich tip geometry (Figure 2) and slight deviations in the area function fitting (Table 1) may propagate errors into hardness and modulus calculations. While the continuous stiffness method (CSM) mitigates thermal drift and ambient vibrations, these factors could still contribute to data scatter, particularly in low-load regimes. The coexistence of brittle fracture (radial cracks) and plastic flow (rhomboid imprints) complicates the application of elasto-plastic models. Shear cracks observed at Position 8 (Figure 15b), for example, indicate mixed failure modes not fully captured by conventional hardness formulations.
The strong linear correlation between elastic modulus and hardness (R2 > 0.85) suggests that dolomite’s mechanical behavior is governed by intrinsic crystallographic properties such as lattice bonding strength and dislocation mobility. This finding aligns with prior studies on carbonate minerals while extending the understanding to fractured systems. Moreover, the identification of load-dependent property variations provides critical insights for optimizing hydraulic fracturing designs, where subsurface stress regimes vary with depth.
Future research should prioritize adopting focused ion beam (FIB) milling to eliminate polishing-induced defects and improve measurement consistency. Integrating phase-field simulations or discrete element methods could better account for calcite–dolomite interactions and fracture propagation. Exploring strain-rate effects under simulated reservoir conditions would enhance the relevance of the nanoindentation data to field applications. In conclusion, while the nanoindentation-based approach offers a transformative tool for geo-mechanical characterization, its accuracy depends on meticulous sample preparation, robust calibration, and acknowledgment of inherent material heterogeneity. Addressing these challenges will solidify its role in advancing reservoir evaluation research.
5. Conclusions
Nanoindentation technology serves as both a powerful tool for micromechanical characterization and a critical interface bridging microscopic mechanisms to macroscopic engineering phenomena. This investigation systematically examined the micromechanical behavior and failure mechanisms of dolostone through integrated nanoindentation testing, mineralogical analysis, and microstructural characterization, revealing fundamental insights into its mechanical response and engineering applicability. The principal findings are summarized as follows,
1. XRD-EDS analysis confirmed the dolostone’s exceptional mineral purity, with dolomite constituting a ≥92.7% mineral content, creating optimal testing conditions. Nanoindentation yielded average elastic modulus (119.47 GPa) and hardness (5.88 GPa) values demonstrating remarkable consistency, reflecting bulk homogeneity. However, localized anomalies (e.g., 1.5 GPa hardness and 248.4 GPa elastic modulus) were attributed to inherent geological discontinuities, including microporosity, subsurface fractures, and mineral decomposition zones, highlighting the material’s natural heterogeneity despite macroscopic uniformity.
2. A pronounced indentation size effect emerged at low loads (<50 mN), characterized by initial sharp modulus/hardness variations followed by stabilization with increasing depth. This behavior originates from synergistic surface hardening mechanisms, dislocation slip constraints, and instrumental noise. The strong linear correlation between elastic modulus and hardness (R2 > 0.85) suggests dolomite’s elastic recovery and plastic resistance are governed by unified crystallographic mechanisms, likely involving coordinated lattice bonding dynamics and dislocation propagation behaviors.
3. Residual imprints predominantly exhibited geometrically consistent Berkovich rhomboid morphology, while localized regions revealed coexisting brittle–ductile failure modes through radial tensile cracks and internal shear fractures. Correlative analysis of indentation morphologies and load–depth curve features (e.g., pop-in events) established distinct defect–property relationships: pore defects induced abrupt depth increases during loading, whereas densified regions demonstrated enhanced elastic recovery and plastic resistance.
This study presents a novel method for assessing fractured carbonate rock mechanics using drill cuttings analyzed through nanoindentation, offering a cost-effective alternative to core sampling with improved data continuity. Current data variations partially arise from surface damage during sample preparation, highlighting the need for enhanced polishing techniques and focused ion beam (FIB) technology to achieve ideal testing surfaces. While the study focuses on single-mineral systems, future work should address multi-mineral interactions (e.g., calcite-filled fractures) by integrating phase-field models or discrete element methods. This approach will bridge micro-to-macro mechanical predictions through combined experimental and computational modeling.
Author Contributions
Conceptualization, M.Z.; Methodology, M.Z.; Software, M.Z.; Validation, Z.G.; Formal analysis, Z.G.; Investigation, Z.G. and H.D.; Resources, H.D.; Data curation, H.D. and T.M.; Writing—original draft, T.M.; Writing—review and editing, T.M.; Visualization, Y.W.; Supervision, Y.W.; Project administration, Y.W. All authors have read and agreed to the published version of the manuscript.
Funding
This research received no external funding.
Data Availability Statement
The data and materials used in this study are available upon request. Please contact Zhiwen Gu (matlabwen@163.com) to inquire about the availability of data and materials, including any restrictions that may apply due to privacy or confidentiality concerns.
Conflicts of Interest
Authors Majia Zheng, Tinghu Ma and Ya Wu were employed by the company Development Division of Southwest Oil and Gas Field Co., Ltd. The remaining authors declare that the research was conducted in the absence of any commercial or financial relationships that could be construed as a potential conflict of interest. The company had no role in the design of the study; in the collection, analyses, or interpretation of data; in the writing of the manuscript, or in the decision to publish the results.
References
- Parameswaran, V.; Basu, S.; Desai, C.K. Determination of Complex Stress Intensity Factor for a Crack in a Bimaterial Interface Using Digital Image Correlation. Opt. Lasers Eng. 2012, 50, 1487–1495. [Google Scholar] [CrossRef]
- Lothenbach, B.; Winnefeld, F.; Alder, C. Effect of Temperature on the Pore Solution, Microstructure and Hydration Products of Portland Cement Pastes. Cem. Concr. Res. 2007, 37, 483–491. [Google Scholar] [CrossRef]
- Zhu, W.; Bartos, P.J.M. Application of Depth-Sensing Microindentation Testing to Study of Interfacial Transition Zone in Reinforced Concrete. Cem. Concr. Res. 2000, 30, 1299–1304. [Google Scholar] [CrossRef]
- Ollivier, J.P.; Maso, J.C.; Bourdette, B. Interfacial Transition Zone in Concrete. Adv. Cem. Based Mater. 1995, 2, 30–38. [Google Scholar] [CrossRef]
- Griffith, A.A. The Phenomena of Rupture and Flow in Solids. Philos. Trans. R. Soc. Lond. Ser. A 1921, 221, 163–198. [Google Scholar]
- Zhang, M.; Fan, X.; Zhang, Q.; Li, Y.; Liu, J. Parametric Sensitivity Study of Wellbore Stability in Transversely Isotropic Medium Based on Poly-Axial Strength Criteria. J. Pet. Sci. Eng. 2021, 197, 108078. [Google Scholar] [CrossRef]
- Zhang, M.; Li, D.; Liu, J.; Wang, X. The Modification of Mohr-Coulomb Criteria Based on Shape Function and Determination Method of Undetermined Parameters. Mech. Mater. 2023, 185, 104772. [Google Scholar] [CrossRef]
- Dong, Z.; Tian, S.; Xue, H.; Wang, Y. A Novel Method for Automatic Quantification of Different Pore Types in Shale Based on SEM-EDS Calibration. Mar. Pet. Geol. 2025, 173, 107278. [Google Scholar] [CrossRef]
- Wu, W.; Wang, T.; Bai, J.; Liu, J.; Wang, X.; Xu, H.; Feng, G. Failure Characteristics and Cooperative Control Strategies for Gob-Side Entry Driving near an Advancing Working Face: A Case Study. Processes 2024, 12, 1398. [Google Scholar] [CrossRef]
- Ni, H.J.; Guo, X.; Ding, L.; Zhang, Y. Experimental Study on the Effect of Supercritical Carbon Dioxide Immersion on Shale Mechanical Properties. J. China Univ. Pet. (Nat. Sci. Ed.) 2019, 43, 77–84. [Google Scholar]
- Guo, H.Q. Nanoindentation Experimental Study on Granite After High-Temperature Heat Treatment. Master’s Thesis, Hubei University of Technology, Wuhan, China, 2017. [Google Scholar]
- Mao, W.Z. Study on Mesoscopic Mechanisms of Variability in Granite Mechanical Properties. Ph.D. Thesis, Zhejiang University, Hangzhou, China, 2020. [Google Scholar]
- Ji, J.C. Study on Physical-Mechanical Properties and Macro-Micro Mechanical Characteristics of Granite. Master’s Thesis, Anhui University of Science and Technology, Huainan, China, 2019. [Google Scholar]
- Zhang, M.M.; Liang, L.X.; Liu, X.J. Analysis of the Influence of Different Rock Shear Failure Criteria on Wellbore Collapse Pressure. Chin. J. Rock Mech. Eng. 2017, 36, 3485–3491. [Google Scholar]
- Zhang, M.; Fan, X.; Zhang, Q.; Liu, Y. Influence of Multi-Planes of Weakness on Unstable Zones Near Wellbore Wall in a Fractured Formation. J. Nat. Gas Sci. Eng. 2021, 93, 104026. [Google Scholar] [CrossRef]
- Gu, S.T.; Lu, Y.Q.; Li, W.S.; Chen, L. Experimental Study on Meso-Mechanics and Fracture Properties of Coal-Measure Mudstone Based on Nanoindentation. Coal Eng. 2023, 55, 128–133. [Google Scholar]
- Wang, J.W.; Che, M.G.; Song, X.; Li, Z. Evaluation of Rock Mechanical Parameters Using Nanoindentation Technology. J. Shenzhen Univ. (Sci. Technol. Ed.) 2023, 40, 608–614. [Google Scholar]
- Luo, T.Y.; Zhang, Q.S.; Liu, Z.B.; Huang, F. Nanoindentation Experimental Study on Mechanical Characteristics of Red-Bed Mudstone in Hechi, Guangxi. J. Water Resour. Water Eng. 2022, 33, 174–181. [Google Scholar]
- Bai, B. Experimental Study on the Effect of Supercritical Carbon Dioxide on Shale Mechanical Properties. Master’s Thesis, China University of Petroleum (East China), Qingdao, China, 2019. [Google Scholar] [CrossRef]
- Yang, C. Nanoindentation Experimental Study on Physical-Mechanical Parameters of Granite Gneiss. Master’s Thesis, Xi’an University of Technology, Xi’an, China, 2020. [Google Scholar] [CrossRef]
- Zhang, Z.H. Numerical Simulation Study on Granite Nanoindentation Experiments and Mechanical Parameter Upscaling. Ph.D. Thesis, Xi’an University of Technology, Xi’an, China, 2023. [Google Scholar]
- Cai, Y.D.; Jia, D.; Qiu, F.; Wang, L. Analysis of Microscopic Mechanical Characteristics and Influencing Factors of Coal-Rock Based on Nanoindentation. J. China Coal Soc. 2023, 48, 879–890. [Google Scholar]
- Jiang, J.D.; Shen, J.Y.; Hou, D.W. Fracture Toughness Measurement and Calculation Method of Calcium Silicate Hydrate Based on Nanoindentation. J. Chin. Ceram. Soc. 2010, 46, 1067–1073. [Google Scholar]
- Xie, X.H.; Deng, H.C.; Hu, L.X.; Li, Q. Investigating the Influence of Shale Laminae Structure on Micro-Macro Mechanical Behavior Through Nanoindentation and FE-SEM Techniques. Geol. Rev. 2024, 70, 319–322. [Google Scholar]
- Liu, Z.J.; Huang, M.; Cui, M.J.; Zhang, R. Study on Microscopic Mechanical Characteristics of MICP-Cured Shale Soil Using Nanoindentation Technology. J. Disaster Prev. Mitig. Eng. 2022, 42, 1036–1045. [Google Scholar]
- Zhang, Z.P.; Zhang, S.C.; Shi, S.Z.; Liu, H. Evaluation of Multiscale Mechanical Properties of Conglomerate Using Nanoindentation and Homogenization Method: A Case Study of Tight Conglomerate Reservoirs in the South Slope of Mahu Sag. Chin. J. Rock Mech. Eng. 2022, 41, 926–940. [Google Scholar]
- Kalei, G.N. Some results of microhardness test using the depth of impression. Mashinovedenie 1968, 4, 105–107. [Google Scholar]
- Lei, M. Study on Hydrochemistry and Meso-Mechanical Characteristics of Granite Based on Nanoindentation Tests. Ph.D. Thesis, Xi’an University of Technology, Xi’an, China, 2022. [Google Scholar]
- Zhang, Y.H.; Gao, F.; Qiao, J.M.; Wang, T. Analysis of Lunar Rock Mechanical Properties Based on Nanoindentation Tests. J. Huazhong Univ. Sci. Technol. (Nat. Sci. Ed.) 2024, 52, 84–90. [Google Scholar]
- Tang, X.H.; Xu, J.J.; Zhang, Y.H.; Li, J. Analysis of Asteroid Rock Mechanical Parameters Based on Microscopic Rock Mechanical Tests and NWA13618 Meteorite. Rock Soil Mech. 2022, 43, 1157–1163. [Google Scholar]
- Wen, X.Y.; Zhang, M.; Mu, C.G.; Liu, Y. Evaluation of Formation Mechanical Properties Along Horizontal Well Based on Drilling Cuttings: A Case Study of Taiyuan Formation Limestone in Ordos Basin. Drill. Prod. Technol. 2024, 47, 87–93. [Google Scholar]
- Xing, J. Research on Nanomechanical Characteristics and Defect Effects of Typical Rocks. Ph.D. Thesis, Xi’an University of Technology, Xi’an, China, 2023. [Google Scholar]
- Shao, Z.L. Study on the Influence Mechanism of Heating-Liquid Nitrogen Cooling on Physical-Mechanical Properties and Fracture Characteristics of Granite. Ph.D. Thesis, Wuhan University, Wuhan, China, 2021. [Google Scholar]
- Cao, F.; He, J.H.; Cao, H.X.; Wang, S. Quantitative Evaluation of Multiscale Rock Mechanical Parameters and Brittleness in Alkaline Lacustrine Shale Reservoirs. J. Chengdu Univ. Technol. (Nat. Sci. Ed.) 2023, 50, 320–330. [Google Scholar]
- Huang, M.; Liu, H.J.; Hong, C.J.; Zhang, L. Study on Frictional Characteristics of Rock Minerals Considering Indentation Size Effect. Chin. J. Rock Mech. Eng. 2024, 43, 1371–1382. [Google Scholar]
- Shi, X.; Jiang, S.; Lu, S.F.; Liu, H. Study on Mechanical Properties of Bedded Shale Using Nanoindentation Experiments. Pet. Explor. Dev. 2019, 46, 155–164. [Google Scholar]
- Wang, Q.S.; Wang, T.Y.; Zhong, P.J.; Li, Z. Study of the Surface Pore Structure and Micromechanical Properties of the Longmaxi Shale. Pet. Sci. Bull. 2023, 8, 626–636. [Google Scholar] [CrossRef]
- Liu, P.; Zhao, Y.L.; Nie, B.S.; Zhang, R. Nanoindentation Experimental Study on Microscopic Mechanical Characteristics of Coal. J. China Coal Soc. 2024, 49, 3453–3467. [Google Scholar]
- Meng, Y.Q.; Niu, J.X.; Xia, J.K.; Wang, L. Study on Mechanical Properties and Failure Mechanisms of Coal at Nanoscale. Chin. J. Rock Mech. Eng. 2020, 39, 84–92. [Google Scholar]
- He, Z.H.; Ni, Y.Q.; Du, S.G.; Chen, L. Application and Research Progress of Nanoindentation Technology in Rock Materials. Chin. J. Rock Mech. Eng. 2022, 41, 2045–2066. [Google Scholar]
- Liu, M.; Xu, Z.T.; Gao, C.H. Lattice Analysis of Metal Microstructure Mechanical Properties by Nanoindentation. J. Fuzhou Univ. (Nat. Sci. Ed.) 2021, 49, 797–808. [Google Scholar]
- Sun, C.L.; Li, G.C.; Xu, J.H.; Wang, S. Nanoindentation Experimental Study on Rheological Characteristics of Sandstone Mineral Components. Chin. J. Rock Mech. Eng. 2021, 40, 77–87. [Google Scholar]
- Gao, T.Q. Nanoindentation Experimental Study on Mechanical Characteristics of Deep Oil Storage Rocks. Ph.D. Thesis, China University of Petroleum, Beijing, China, 2023. [Google Scholar]
- Rong, H.Y.; Wang, W.; Li, G.C.; Zhang, Y. Micro-Mechanical Characteristics of Hydration-Induced Instability in Rock-Anchorage Agent Structure. Rock Soil Mech. 2023, 44, 783–797. [Google Scholar]
- Chen, X.R. Microscopic Experimental Study on Shale Fracture Toughness. Ph.D. Thesis, China University of Petroleum (Beijing), Beijing, China, 2023. [Google Scholar]
- Jia, P. Quantitative Characterization and Change Mechanisms of Micro-Pore Structure and Mechanical Properties of Liquid Nitrogen Frozen Coal. Ph.D. Thesis, Liaoning Technical University, Fuxin, China, 2022. [Google Scholar]
- Wang, J.; Yang, C.; Guo, Y.; Liu, Y.; Jiang, W.; Luo, Y.; Wu, Y.; Long, Y.; Peng, P.A. Examining the reliability of current micro-and nano-indentation-based rock mechanical upscaling schemes: A comprehensive comparison with uniaxial/triaxial macroscopic mechanical testing. Geomech. Geophys. Geo-Energy Geo-Resour. 2025, 11, 28. [Google Scholar] [CrossRef]
- ISO 14577-1-2015; Metallic Materials-Instrumented Indentation Test for Hardness and Materials Parameters. European Committee for Standardization: Brussels, Belgium, 2015.
- SY/T 5163-2018; X-Ray Diffraction Analysis Method for Clay Minerals and Common Non-Clay Minerals in Sedimentary Rocks. National Energy Administration: Beijing, China, 2018.


Disclaimer/Publisher’s Note: The statements, opinions and data contained in all publications are solely those of the individual author(s) and contributor(s) and not of MDPI and/or the editor(s). MDPI and/or the editor(s) disclaim responsibility for any injury to people or property resulting from any ideas, methods, instructions or products referred to in the content. |
© 2025 by the authors. Licensee MDPI, Basel, Switzerland. This article is an open access article distributed under the terms and conditions of the Creative Commons Attribution (CC BY) license (https://creativecommons.org/licenses/by/4.0/).