Article

Mechanism of Enhanced Control and Technological Application of Surrounding Rock Anchoring in Fully Mechanized Caving Face of Extra-Thick Coal Seams

1
School of Energy & Mining Engineering, China University of Mining & Technology (Beijing), Beijing 100083, China
2
Department of Mining, Industrial, and ICT Engineering, Polytechnic University of Catalonia, 08242 Barcelona, Spain
3
Chongqing Chuandongnan Survey & Design Institute Co., Ltd., Chongqing 400038, China
4
China Coal Research Institute, Beijing 100013, China
*
Author to whom correspondence should be addressed.
Processes 2025, 13(4), 1216; https://doi.org/10.3390/pr13041216
Submission received: 10 March 2025 / Revised: 11 April 2025 / Accepted: 15 April 2025 / Published: 17 April 2025
(This article belongs to the Section Energy Systems)

Abstract

:
With respect to the problem of the anchorage failure of a broken roof in the roadway of extra-thick coal seams by using a traditional unconstrained pushing anchoring agent, a new anchoring agent installation technology with a push–pull device was proposed. Many research methods were adopted to study the mechanism of the efficient control of anchoring agent installation technology with a push–pull device on surrounding rock and the application of the technology. The results indicated that an unconstrained pushing anchoring agent exhibited two main morphological types: bending equilibrium and bending instability. The pushing force for the anchoring agent installed using the integrated push–pull method was calculated to be 13.52 N, which was less than that of the unconstrained pushing anchoring agent. An anchoring agent pushing with the push–pull device was able to smoothly pass through borehole delamination and collapse zones. When the pull-out force reached 160 kN and 180 kN, there was no significant slip or failure in the anchored section of the cable. The support system with the push–pull device for installing the anchoring agent reduced rock deformation by nearly 50%. This demonstrated that this technology significantly enhances the control of surrounding rock deformation.

1. Introduction

Anchor bolts (cables) are widely used in geotechnical deformation control in various geological environments such as chambers, tunnels, and slopes due to their excellent support performance and low cost. This is especially true for the support of surrounding rock in various mining spaces underground in coal mines [1,2,3,4]. However, the complex and diverse geological conditions underground, along with the uneven distribution of surrounding mining-induced stress caused by coal seam extraction, result in significant variations in the properties and degree of fragmentation of the surrounding rock [5,6,7,8]. This introduces numerous challenges in the application of rock bolt (cable) support technology. To ensure the effective application of rock bolt (cable) support technology in various geological environments, many scholars both domestically and internationally have conducted research on the related theories of this support technology. Hyett et al. [9] established a frictional dilation model based on data from anchor cable pull-out tests, concluding that the slight radial expansion caused by bond failure of the anchoring body is the reason for the generation of radial pressure and changes in frictional bond strength at the anchor cable–grout interface. Li et al. [10] developed a constitutive model for rock bolts (cables) to predict the axial full-load displacement characteristics under different confining pressures. Using the continuous yielding method, they simulated the full-load displacement behavior of rock bolts (cables) transitioning from initial elastic behavior to progressive failure. Chen et al. [11] used numerical simulation to estimate the maximum confinement in anchor cables and compared the pull-out performance of the cables before and after improvement through both numerical simulation and field pull-out tests. The results showed that the improved anchor cables could generate more confinement in the constrained medium. Shi et al. [12] conducted indoor tests and numerical simulations on rock bolt pull-out tests, revealing that the expansion between the rock bolt and rock induces cracks and extends the force field along the crack direction, which is the main factor leading to rock bolt pull-out failure. He et al. [13] explored the impact mechanism of anchoring eccentricity through theoretical analysis and laboratory experiments. The results showed that anchoring eccentricity leads to uneven shear stress and displacement distribution at the grout–surrounding rock interface. They developed a grout push-limit device to ensure good centering of the anchor cable after anchoring. Based on the slip-bond failure mode at the grout–surrounding rock interface, Li et al. [14] derived the calculation formulas for the ultimate bearing capacity and interface shear stress of rock bolts during the elastic stage, proposing principles for determining the reasonable anchoring length of rock bolts. Cao et al. [15] conducted pull-out tests on anchor cables to explore changes in bonding performance when additives were mixed into the grout, incorporating steel particles into the resin slurry and allowing it to solidify. The results indicated that adding a small amount of rigid particles can improve the shear resistance of the grout to bond slip. From the above introduction, it is evident that significant research has been conducted on rock bolt and cable support technology, particularly in areas such as anchoring mechanisms, failure mechanisms, and the improvement of anchoring effects. These research achievements have enhanced the effectiveness of rock bolt (cable) support technology and improved its adaptability to various environments. However, there is currently little research on efficient installation technology for anchoring agents. The geological conditions underground in coal mines are complex and diverse, so ensuring the efficient installation of anchoring agents and fully utilizing their anchoring effect is crucial for effectively controlling the surrounding rock with anchor bolts (cables). On-site research on the installation technology of anchoring agents in extra-thick coal seam working faces has found many drawbacks in the existing technology, which seriously restricts the safe and efficient mining of the working face [16]. In the retreat channel of a fully mechanized caving face in an extra-thick coal seam, the roof consists of thick coal. Due to the low strength of the coal, it is prone to delamination and dislocation under the strong mining-induced pressure caused by extraction activities [17,18]. When drilling into the roof, the borehole walls are likely to develop cracks or even collapse, as shown in Figure 1. Currently, the anchoring agent is typically pushed using an unconstrained, one-piece method. However, when installing anchor cables in the roof of the retreat channel using this method, several issues may arise: If the borehole in the roof is not intact and contains cracks, collapses, or delamination, the top of the anchoring agent can become stuck in these collapsed areas. Due to the flexibility of the anchoring agent, continued pushing can cause it to bend and fail to pass through the obstruction. When excessive force is applied, the sharp edges of the rock can puncture the protective outer layer of the anchoring agent, causing it to leak prematurely. This prevents the anchoring agent from reaching the designated anchoring section, rendering it ineffective, as illustrated in Figure 2. Therefore, during the installation process, the unconstrained pushing method may lead to bending, puncturing, and leaking of the anchoring agent, which compromises its effectiveness and can result in the failure of the support structure. This significantly impacts the safety control of the surrounding rock in the roadway.
To ensure that the anchoring agent can smoothly reach the anchoring position and fully exert its anchoring effect, a new integrated push–pull installation technique was proposed for anchoring agents, as shown in Figure 3. This technique is implemented through a push–pull device, which includes a bottom tray and a push–pull clamp. The pushing force from the anchor cable is applied to the bottom tray and is transmitted upward through the push–pull clamp, exerting a dual, coordinated force on the anchoring agent in the same direction. The push–pull clamp has a certain level of rigidity, which helps to clear the borehole and guide the anchoring agent smoothly through delaminated or collapsed areas, ensuring it reaches the bottom of the borehole. Afterward, the anchor cable is driven forward using an anchor cable machine. When the anchor cable pierces through the tray, it also mixes the anchoring agent. This technique is particularly suitable for situations where the anchoring agent is obstructed and leaks within the borehole during the installation process in the roof of the retreat channel. It addresses the challenges of anchoring agent detachment, low efficiency, and failure due to bending or puncturing inside the borehole at the initial installation stage. This method ensures the quality of the anchoring process and establishes an efficient method for the quick and reliable installation of the anchoring agent.
This study investigated the enhanced control mechanism of surrounding rock using the integrated push–pull installation technique for anchoring agents through theoretical analysis, physical similarity simulation experiments, and on-site anchor cable pull-out tests. A mechanical model was established for both the unconstrained pushing of anchoring agents in boreholes and the integrated push–pull installation technique. A comparative analysis was conducted to examine the mechanical mechanisms of these two installation methods. The research includes a mechanical analysis of the integrated push–pull installation under borehole blockage conditions and mechanical testing of different types of push–pull trays. This helped determine the optimal shape and size of the push–pull device’s top cover and bottom tray. The effectiveness of the push–pull anchoring technique was verified through indoor physical similarity simulations of borehole anchoring agent pushing and on-site pull-out tests.

2. Unconstrained Pushing and Integrated Pushing Force Analysis of Anchoring Agent

During the traditional unconstrained pushing process of anchoring agents, the soft anchoring agent can bend and deform under the applied force at both ends. This scenario can be simplified into the mechanical structure model shown in Figure 4 for analysis. In this model, the anchoring agent is considered as an ideal elastic compression rod. When axial forces are applied at both ends, the rod experiences bending deformation [19,20,21].
The approximate differential equation for the deflection curve of a slender compression rod with hinged ends under slight bending is as follows:
w + F z w E I = 0
Given that Fz is the axial force and EI is the flexural rigidity, the general solution to the differential equation is as follows:
w = A sin F z E I x + B cos F z E I x
For a slender rod with hinged ends, the boundary conditions at both ends are as follows:
x = 0 , w = 0 x = L Δ , w = 0
The deflection curve equation of the compression rod can be obtained as follows:
w = δ sin π x L Δ
The deflection at the midpoint of the rod is denoted as δ. The relationship between the axial load Fz and the vertical displacement Δ can be derived as follows:
Δ = L π 2 E I F z
In this state, although the anchoring agent undergoes slight bending deformation, the micro-bent state can return to a straight state if the axial load is reduced. At this time, the anchoring agent can be considered to be in a bending equilibrium state. Taking three anchoring agents as an example, the anchoring agent is inclined in the borehole, connecting end to end in an “S” shape. The force analysis of anchoring agent A is shown in Figure 5A.
The following results can be obtained through calculations using Equations (6)–(10):
T 1 ( L A Δ A ) cos β A G A ( L A Δ A ) 2 sin β A f 1 ( L A Δ A ) sin β A = 0
T 1 T 2 = 0
F B f 1 f 2 G A = 0
T 1 μ = f 1
T 2 μ = f 2
f 1 = f 2 = G A 2 ( cot β A μ 1 )
F B = G A 1 μ tan β A
F z A = T 1 sin β A + f 1 cos β A
f represents the friction force between the anchoring agent and the borehole. The Euler formula for a slender compression rod with hinged ends, which is also the formula for calculating the critical buckling load, is as follows:
F c r = π 2 E I L 2
If it is assumed that the length of a single anchoring agent L is 500 mm, its weight is 4.3 N, the borehole diameter d is 30 mm, the coefficient of friction μ between the anchoring agent and the borehole is 0.8, and the flexural rigidity EI is 0.02 N·m2, then by substituting these values into the equations, the results can be calculated as follows:
F z A > F c r
The axial force on anchoring agent A within the borehole is greater than the critical buckling load, indicating that anchoring agent A is in a curved equilibrium state. This proves the accuracy of the aforementioned assumption.
Using the above principles and steps of mechanical analysis to compute the force of anchoring agent B in Figure 5B, we obtain the following:
f 3 = f 4 = G B + 2 F B 2 ( cot β B μ 1 )
F C = G B + F B ( 1 + μ tan β B ) 1 u tan β B
F z B = T 3 sin β B + f 3 cos β B + F B cos β B
By substituting the values into the equations, the following results can be obtained:
F z B > F c r
The axial force on anchoring agent B within the borehole is greater than the critical buckling load, indicating that anchoring agent B is in a curved equilibrium state.
Using the above principles and steps of mechanical analysis to compute the force of anchoring agent C in Figure 5C, we obtain the following:
f 5 = f 6 = G C + 2 F C 2 ( cot β C μ 1 )
F T = G C + F C ( 1 + μ tan β C ) 1 μ tan β C
F z C = T 5 sin β C + f 5 cos β C + F C cos β C
By substituting the values into the equations, the following results can be obtained:
F z C > F c r
The axial force on anchoring agent C within the borehole is greater than the critical buckling load, indicating that anchoring agent C is in a curved equilibrium state.
In summary, using Equations (12), (17) and (21), the following results can be obtained:
F T = G A ( 1 + μ tan β B ) ( 1 + μ tan β C ) + G B ( 1 μ tan β A ) ( 1 + μ tan β C ) + G C ( 1 μ tan β A ) ( 1 μ tan β B ) ( 1 μ tan β A ) ( 1 μ tan β B ) ( 1 μ tan β C )
In the equations, GA, GB, and GC represent the weights of the three anchoring agents, while αA, αB, and αC denote the angles between the lines connecting the ends of the bent anchoring agents and the borehole wall. Since the borehole diameter is much smaller compared to the length of the anchoring agents, and the difference between the borehole diameter and the anchoring agent diameter is even smaller relative to the length of the anchoring agents, it can be assumed that the angles between the lines connecting the ends of the three anchoring agents and the borehole wall are equal.
Assuming αA = αB = αC, and substituting the values into the equations, the pushing force of the anchoring agents can be calculated as follows:
F T = 15.01 N
If the pushing force is too large, the axial force exerted on the anchoring agent can become excessive, leading to bending and subsequent instability of the anchoring agent. Due to the cumulative effect of the forces transmitted downward from the overlying anchoring agents, the lowest anchoring agent is most susceptible to instability. After bending, the upper part of the anchoring agent will align with the borehole wall surface, and the lower end of the anchoring agent will form a new, shorter compression member. Based on the number of bent anchoring agents, the bending instability of the anchoring agents can be classified into three types: 1. Bending instability of lower anchoring agent. 2. Bending instability of middle-lower anchoring agent. 3. Bending instability of upper-middle-lower anchoring agent.
As shown in Figure 6a, when the anchoring agent is pushed into the borehole, the lower anchoring agent bends. Anchoring agents A and B can still be analyzed using the previously derived formulas, and the following is an analysis of the forces acting on anchoring agent C:
q T 5 L 1 ( L 2 cos β C + L 1 2 ) ( L 2 L 1 + L 2 ) G C L 2 2 sin β C f 5 + F c + ( L 1 L 1 + L 2 ) G C L 2 sin β C = 0
q T 5 L 1 T 6 = 0
q T 5 L 1 μ = f 5
T 6 μ = f 6
By using Equations (38)–(41), the following results can be obtained:
f 5 = f 6 = ( L 2 2 + 2 L 1 L 2 ) μ sin β C G c + F c ( 2 L 1 L 2 + 2 L 2 2 ) μ sin β C ( 2 cos β C 2 μ sin β C ) ( L 1 L 2 + L 2 2 ) + L 1 2 + L 2 L 1 = 0.89 N
Assuming L1 = L2, performing a comprehensive force balance analysis for the three anchoring agents and substituting the values into the calculations yields the following results:
F T = G A + G B + G C + 2 f 1 + 2 f 3 + 2 f 5 = 15.58 N
As shown in Figure 6b, when the anchoring agent is pushed into the borehole, the middle and lower anchoring agents bend. The following is an analysis of the forces acting on anchoring agent B by using the above principles and steps of mechanical analysis:
f 3 = f 4 = ( L 2 2 + 2 L 1 L 2 ) μ sin β B G B + F B ( 2 L 1 L 2 + 2 L 2 2 ) μ sin β B ( 2 cos β B 2 μ sin β B ) ( L 1 L 2 + L 2 2 ) + L 1 2 + L 2 L 1 = 0.54 N
F C = 2 f 3 + G B + F B = 9.9 N
The force analysis and calculations for anchoring agent C yield the following results:
f 5 = f 6 = ( L 2 2 + 2 L 1 L 2 ) μ sin β C G c + F c ( 2 L 1 L 2 + 2 L 2 2 ) μ sin β C ( 2 cos β C 2 μ sin β C ) ( L 1 L 2 + L 2 2 ) + L 1 2 + L 2 L 1 = 0.91 N
The following is a comprehensive force balance analysis of the three anchoring agents:
F T = G A + G B + G C + 2 f 1 + 2 f 3 + 2 f 5 = 16.02 N
As shown in Figure 6c, when the anchoring agent is pushed into the borehole, the upper, middle, and lower anchoring agents experience bending. The following is an analysis of the forces acting on anchoring agent A by using the above principles and steps of mechanical analysis:
f 1 = f 2 = ( L 2 2 + 2 L 1 L 2 ) μ sin β A G A ( 2 cos β A 2 μ sin β A ) ( L 1 L 2 + L 2 2 ) + L 1 2 + L 2 L 1 = 0.23 N
F B = 2 f 1 + G A = 4.76 N
The force analysis and calculations for anchoring agent B yield the following results:
f 3 = f 4 = ( L 2 2 + 2 L 1 L 2 ) μ sin β B G B + F B ( 2 L 1 L 2 + 2 L 2 2 ) μ sin β B ( 2 cos β B 2 μ sin β B ) ( L 1 L 2 + L 2 2 ) + L 1 2 + L 2 L 1 = 0.55 N
F C = 2 f 3 + G B + F B = 10.16 N
The force analysis and calculations for anchoring agent C yield the following results:
f 5 = f 6 = ( L 2 2 + 2 L 1 L 2 ) μ sin β C G c + F c ( 2 L 1 L 2 + 2 L 2 2 ) μ sin β C ( 2 cos β C 2 μ sin β C ) ( L 1 L 2 + L 2 2 ) + L 1 2 + L 2 L 1 = 0.93 N
The following is a comprehensive force balance analysis of the three anchoring agents:
F T = G A + G B + G C + 2 f 1 + 2 f 3 + 2 f 5 = 16.32 N
When using a unified push–pull device to install anchoring agents, the anchoring agents are constrained as a single unit and slide upward along the borehole wall at an angle under the clamping force of the device. The force distribution for the unified anchoring agent push is illustrated in Figure 7.
The force analysis and calculations for anchoring agents yield the following results:
T 7 ( L A + L B + L C ) cos β D G L A + L B + L C 2 sin β D f 7 ( L A + L B + L C ) sin β D = 0
T 7 T 8 = 0
F T f 7 f 8 G = 0
T 7 μ = f 7
T 8 μ = f 8
By using Equations (65)–(69), the following results can be obtained:
f 7 = f 8 = G 2 ( cot β D μ 1 ) = 0.01 N
In the equations, G is the total weight, including the push–pull device and the anchoring agent, with a value of 13.5 N. f7 and f8 are the friction forces between the clamping device and the borehole wall during the pushing process. μ′ is the coefficient of friction between the clamping device and the borehole wall, with a value of 0.1. βD is the angle between the push–pull device and the borehole wall. By substituting these values into the equations, the calculations yield the following results:
F 1 = G + 2 f 7 = 13.52 N
From the analysis of the mechanical calculation results, it can be observed that the friction force between the push–pull device and the borehole wall is very small in the unified anchoring agent pushing method. The pushing force required is approximately equal to the weight of the push–pull device and anchoring agents. The pushing force is less than the force required when there is no constraint. These findings indicate that using the unified push–pull method for installing anchoring agents can significantly reduce manual labor and improve the efficiency of the anchoring installation.

3. Development of the Push–Pull Device

3.1. Top Cover Design

During the process of pushing the anchoring agent, if there are protruding rock blocks inside the borehole, these can obstruct the movement of the anchoring agent. If the base of the rock is particularly sharp, it can easily tear the outer layer of the anchoring agent, leading to leaks. To address this issue, designing a guide cover at the top of the push–pull device could be beneficial. This guide cover would allow the anchoring agent to slide smoothly over sharp rocks during the pushing process, enabling the agent to pass through the borehole without being obstructed. Additionally, the cover would protect the anchoring agent below it, preventing damage and potential leaks. This design would enhance the reliability and effectiveness of the anchoring installation process.
The guide cover must be designed to ensure that it can overcome the frictional resistance between it and any sharp protruding rocks during the pushing process. To achieve this, the shape of the cover needs to be carefully considered. A preliminary design suggests that the cross-sectional shape of the cover should be elliptical at the top and rectangular at the bottom, forming a bullet-like shape. This design allows the cover to smoothly deflect upward when encountering obstacles, minimizing the risk of becoming stuck or causing damage to the anchoring agent. Figure 8 illustrates the situation where the guide cover encounters a protruding rock in the borehole, leading to an obstruction during the pushing process. The diagram also provides a schematic view of the designed shape of the cover.
Given an ellipse with its center at the origin of a coordinate system, the equation of the ellipse and the expression for tanθ can be described as follows:
y 2 a 2 + x 2 b 2 = 1 tan θ = b a
The equation of the tangent line to the ellipse at any point (x0, y0) on the ellipse is given by the following:
y y 0 = a 2 x 0 b 2 y 0 ( x x 0 )
The slope of the tangent line to the ellipse at any point (x0, y0) on the ellipse can be expressed as follows:
tan β = a 2 x 0 b 2 y 0
Assuming that the anchoring agent, while clamped by the push–pull device, remains in a vertical position and is pushed upward at a constant speed, the vertical force balance can be expressed as follows:
F G = F 1 cos α
F is the pushing force exerted by the push–pull device’s base on the anchoring agent. G is the weight of the anchoring agent. F1 is the force exerted by the protruding rock on the guide cover. α is the angle between F1 and the vertical direction.
F1 can be decomposed into the tangential force Fq along the top cover and the normal force Fc perpendicular to the tangential direction. The effect of the force decomposition is shown in Figure 8. From the figure, the following can be seen:
F c = F 1 sin γ F q = F 1 cos γ γ = β + 90 α
The frictional force generated by F1 acting on the top cover can be expressed as follows:
f = μ F c
In the formula, μ is the coefficient of kinetic friction between the rock and the top cover. To ensure that the top cover slides upward along the protruding rock, the following condition must be met:
F q f
By combining Equations (53)–(55), the following equation can be obtained:
tan ( β + 90 α ) = tan β + tan ( 90 α ) 1 tan β tan ( 90 α ) = 1 μ
By combining Equations (49)–(56), the following equation can be obtained:
x + cos α tan 2 θ a 2 x 2 tan 2 θ x cos α tan 2 θ a 2 x 2 tan 2 θ = 1 μ
As the top cover gradually slides along the protruding rock, the angle β increases, Fq gradually decreases, Fc gradually increases, and the frictional force at the interface gradually increases. Therefore, when F1 is at the far-left edge of the top cover, Fc is at its minimum, and f is at its maximum. Thus, the far-left position is taken as the critical point. At this position, Fq = f will satisfy the sliding requirement. Taking x = −10 mm and μ = 0.5 and substituting them into the formula yields the following:
cos α = 0.01 2 tan 2 θ a 2 0.01 2 tan 2 θ 0.02 + tan 2 θ a 2 0.01 2 tan 2 θ
Figure 9 shows the αθ curves for different values of a (30°, 40°, 50°, and 60°). It can be observed that, as α gradually increases, the θ value also gradually increases. When α is in the range of approximately 60° to 90°, it is clear that, if α is less than 60°, the top cover will not be able to pass through regardless of the θ value, and the only option would be to clear the hole again with a drill. As the value of a increases, the α value does not change significantly, indicating that an increasing a does not improve the top cover’s ability to pass through rocks at various applied force angles. Therefore, to save materials and simplify manufacturing, this paper selects a = 30 mm for the development of the top cover. Analysis of the formula shows that, as θ gradually decreases, the minimum angle of force α that can pass through the rock also decreases. This indicates that the smaller the value of θ, the larger the range of force angles through which the top cover can pass; hence, θ is selected as 19°.
During the pushing process of the anchoring agent using the push–pull device, if there are fallen rock blocks in the drilled hole (i.e., rock blocks that have collapsed from above the hole and fallen onto the top cover), and the diameter of these rock blocks is larger than the gap between the anchoring agent and the hole, the rock blocks will obstruct the smooth pushing of the anchoring agent. In this case, the top cover will push the rock blocks upward, causing friction between the rock blocks and the hole wall. To satisfy the pushing conditions, the applied pushing force must overcome the frictional force between the rock blocks and the hole wall. The following analysis will consider the pushing forces under two scenarios: when rock blocks are present on one side and when rock blocks are present on both sides. For simplicity, the fallen rock blocks are modeled as spheres with a radius R to establish the mechanical model.
When there are fallen rock blocks on one side above the top cover inside the borehole, the schematic diagram and force analysis are shown in Figure 10. Taking the left-side scenario as an example, the contact point between the rock block and the top cover is denoted as X. The horizontal coordinate of point X is −(D/2 + eRRsinβ1,), and e is the distance between the edge of the anchoring agent and the wall of the hole when the anchoring agent is positioned at the center of the drilled hole. Through geometric analysis, the following can be obtained:
tan β 1 = a ( D 2 + e R R sin β 1 ) b 2 1 ( D 2 + e R R sin β 1 ) 2 b 2
sin β 1 = tan β 1 1 + tan 2 β 1
By combining the above equations and setting D = 30 mm, e = 5 mm, a = 30 mm, and b = 10 mm, the relationship curve between tanβ1 and R can be obtained, as shown in Figure 11a.
The expression for the fitted curve is as follows:
tan β 1 = 3.4 × 10 11 R 5
F m = F 2 sin β 1 F n = F 2 cos β 1
The frictional force generated by F2 acting on the top cover can be expressed as follows:
f m = μ 2 F m
μ2 is the coefficient of kinetic friction between the rock block and the hole wall, which is set at 0.2. To ensure that the top cover slides upward along the protruding rock block, the following condition must be met:
F n = f m + G 2 G 2 = 4 3 π R 3 ρ g
From the overall force analysis, the following is known:
F T = F 2 cos β 1 + F 2 sin β 1 μ 1 + G
μ1 is the coefficient of friction between the top cover and the hole wall, with a value of 0.5. By combining Equations (59)–(65), the following results can be obtained:
F T = 4 3 π R 3 ρ g 1 + μ 1 tan β 1 1 μ 2 tan β 1 + G
From the analysis of Figure 11b, it can be seen that, as the radius of the rock block increases, the pushing force first decreases and then increases. When the radius is small, the upward transmitted pushing force mainly overcomes the sliding friction between the rock block and the hole wall as well as the friction between the top cover and the hole wall. As the radius increases, the sliding friction between the rock block and the hole decreases, leading to a decreasing trend in the pushing force. However, as the radius of the rock block increases, its weight also increases, so the pushing force later mainly overcomes the weight of the rock block, resulting in an increasing trend in the pushing force. From the figure, it is evident that the maximum pushing force when a rock block is present on one side is 14.79 N.
The schematic diagram and force analysis of fallen rock blocks on both sides above the top cover inside the borehole are shown in Figure 12. A mechanical model is established by considering the rock blocks as two spheres with a radius of R each. The contact point between the rock block on the left side and the roof is X, and the horizontal coordinate of point X is −(D/2 − RRsinβ2).
tan β 2 = a ( D 2 R R sin β 2 ) b 2 1 ( D 2 R R sin β 2 ) 2 b 2
sin β 2 = tan β 2 1 + tan 2 β 2
Let D = 30 mm, a = 30 mm, and b = 10 mm. The relationship curve between tanβ2 and R is shown in Figure 13a. The fitted curve expression is as follows:
tan β 2 = 1.8 × 10 11 R 4.6
F m 1 = F 3 sin β 2 F n 1 = F 3 cos β 2
The frictional force generated by F3 acting on the top cover can be expressed as follows:
f m 1 = μ 2 F m 1
μ2 is the coefficient of kinetic friction between the rock block and the top cover. For the top cover to slide upward along the protruding rock block, the following equation must be satisfied:
F n 1 = f m 1 + G 2 G 2 = 4 3 π R 3 ρ g
From the overall force analysis, the following can be concluded:
F T = 2 G 2 + 2 F 3 sin β 2 μ 2 + G
By simultaneously solving Equations (67)–(73), the resulting expression can be obtained as follows:
F T = 8 3 π R 3 ρ g + 8 π R 3 ρ g μ 2 tan β 2 3 3 μ 2 tan β 2 + G
From the analysis of Figure 13b, it can be concluded that the relationship curve between the radius and pushing force exhibits the same characteristics whether there are rock blocks on both sides or only on one side. As the borehole radius increases, the pushing force first decreases and then increases. The figure shows that, when rock blocks fall on both sides simultaneously, the maximum pushing force is 13.61 N. This study shows that, when there are fixed or slipping rock blocks inside the borehole, the anchoring agent can still effectively pass through under the protection of the cover, with an increased push force. This theoretically confirms the rationality of the cover design.

3.2. Bottom Tray Design

The bottom tray must have sufficient load-bearing capacity during the push of the anchoring agent, but it also needs to be eventually pierced by the anchor cable. The mechanical performance of the bottom tray is crucial for the implementation of the push anchoring technique. To meet these requirements, mechanical performance tests need to be conducted on the tray. The bottom tray is made of brittle, easily breakable plastic, and the load-bearing capacity is weakened by drilling holes at the top of the tray. To meet operational needs, the roof of the tray must be designed with a reasonable thickness and number of holes. Therefore, mechanical loading tests were conducted on bottom trays with different roof thicknesses (0.3 mm, 0.5 mm, and 0.7 mm) and numbers of holes. The different tray types with varying numbers of roof holes (1 to 5) and the mechanical testing process is shown in Figure 14.
The curves after tray loading are shown in Figure 15. The time–load curves for trays with different roof thicknesses and hole counts exhibit a trend of first increasing and then decreasing, with a maximum value observed. The trays undergo a process of compression deformation until the roof fails. The maximum load that different types of trays can withstand is shown in Table 1.
The measured total weight of the push device and anchoring agent is 13.5 N. Considering factors such as resistance during the push process and irregularities at the anchor cable’s end, the load-bearing capacity of the tray should not be less than 150 N. To ensure that the tray can eventually be pierced by the anchor cable, the load-bearing capacity of the tray should not be too high either. Therefore, the optimal thickness of the roof for the push tray was determined to be 0.3 mm, with five holes drilled at the roof. The dimensions of the push–pull device are shown in Figure 16.

4. Similar Simulation Test for Anchoring Agent Pushing in Borehole

To verify the applicability of the push device, a visual simulation study was conducted on the entire push process of the push–pull device in the borehole. This was completed by simulating various conditions inside the borehole during on-site construction on an indoor test bench. The materials required for the indoor simulation experiment include the push–pull device, acrylic tubes, black foam board, anchoring agent, anchor cable, and coal blocks, as shown in Figure 17. The transparent acrylic tubes consist of a complete tube, a double-sided slant-cut tube, and an end-surface slant-cut serrated tube, which is used to simulate a complete borehole, a double-sided collapsed borehole, and delamination, respectively. The black foam board simulates the surrounding coal body. The transparent acrylic tube and black foam board are vertically fixed to the experiment frame using tape and steel wire. The inner diameter of the transparent acrylic tube is 30 mm, the diameter of the anchoring agent is 21 mm, and the length is 500 mm. The diameter of the anchor cable is 17.8 mm.

4.1. Push-Through Capability Test for Anchoring Agent in Borehole Delamination and Collapse Zones

To simulate the delamination in a borehole, two transparent acrylic tubes with slant-cut serrated ends were vertically fixed onto the test stand, positioned 100 mm apart from each other. These tubes were connected at the top and bottom with 500 mm long complete transparent acrylic tubes, collectively representing the full structure of a borehole with delamination. During the test, three anchoring agents were gradually pushed upward from the bottom of the acrylic tubes using an anchor cable. The anchoring agents successfully passed through the intact sections of the borehole and reached the lower end of the delamination zone, as shown in Figure 18. However, due to the gap between the anchoring agents and the borehole wall, the agents did not move straight upward; instead, they slid upward at an angle along one side of the borehole wall. Upon reaching the delamination zone, the lack of support caused by the missing wall in the delaminated section led the anchoring agents to tilt further outward. As the pushing continued, the anchoring agents became stuck at the upper edge of the delamination zone and could not pass through smoothly. A push-through capability test was conducted using a push–pull device to push the anchoring agent through a delamination zone simulated to have a 300 mm gap. Under the clamping of the push device, the anchoring agent exhibited only a slight inclination toward the borehole wall and maintained a nearly vertical orientation. Due to the constraints of the clamping mechanism in the delamination zone, the anchoring agent did not experience significant tilting and was able to successfully reach the upper part of the delamination zone.
To simulate a borehole collapse, two transparent acrylic tubes with slant-cut ends were vertically fixed on the test stand. The anchoring agent was gradually pushed upward using an anchor cable. The agent was able to pass through the intact sections of the borehole and reach the collapse zone. However, due to the lack of support from the missing borehole walls in the collapse zone, the anchoring agent tilted further outward. As pushing continued, the agent moved into the collapse space outside the borehole. The presence of the collapse zone obstructed the push of the unconstrained anchoring agent. When the push device pushes the anchoring agent upward and encounters a borehole collapse, the clamping effect of the steel wire enhances stability. Despite the collapse, the anchoring agent can maintain an almost vertical orientation. As it encounters the collapse zone, the agent continues to be pushed upward along the center of the borehole and can successfully pass through the collapsed area.

4.2. Push-Through Capability Test for Anchoring Agent with Push–Pull Device in Clogged Borehole

The internal wall of the borehole is incomplete with sharp protruding rock blocks, or the loose wall of the borehole causes the rock blocks to fall off, leading to borehole blockage and hindering the pushing of anchoring agents. In order to verify the pushing ability of the push–pull device under borehole blockage, a similar simulation test was conducted.
The push-through capability of the anchoring agent was tested in a borehole with fixed coal blocks of approximately 10 mm in diameter, without the protection of a cover. Figure 19 shows the condition of the anchoring agent when encountering a protruding coal block. As observed, the protruding coal block presses against the top of the anchoring agent, obstructing its push. If pushing continues, it could puncture the anchoring agent’s packaging, leading to leakage of the anchoring agent. A cover was installed above the push device to simulate the ability of the anchoring agent to pass through a fixed rock block with cover protection. As shown in Figure 19, the anchoring agent, held by the push–pull device, is pushed upward along the central axis of the borehole. When encountering a protruding coal block, the agent generates a horizontal force directed to the right. As pushing continues, the cover gradually shifts toward the coal wall. Ultimately, the cover moves past the coal block and closely adheres to the right-side coal wall, allowing the anchoring agent to pass through smoothly.
Without the protection of a cover, freely falling coal blocks that land on top of the anchoring agent can cause issues. If the friction between the coal block and the borehole wall is high, the coal block will not slide and will instead puncture the anchoring agent’s packaging as the agent is pushed, leading to leakage. When a cover is installed above the anchoring agent, the fallen coal blocks are pushed upward along with the agent. They slide along the borehole wall until reaching a collapse zone, where they are pushed into the collapse area. The presence of the cover effectively protects the anchoring agent during the push process, preventing obstruction from falling coal blocks and avoiding the risk of the agent being pierced.

5. Field Application

The field practice of installing an anchoring agent was conducted in the retreat channel of the 8102 working face at Madatao Coal Mine. The support design for the retreat channel of the Madaotou Coal Mine is shown in Figure 20. The installation of anchor cables was carried out using a push-guide device.
To evaluate the anchoring effect of the integrated push–pull device installation, a field anchor pull-out test was conducted at a support location on the roof of the retreat channel. The test compared two anchor cables installed using the unconstrained push method with two anchor cables installed using the integrated push–pull device. As shown in Figure 21, the anchor cable inside the borehole can be divided into the bonded segment and the free segment. Under tensile stress conditions, if the total elongation of the anchor cable exceeds the elongation of the free segment, it indicates that the bonding stress of the bonded segment has transferred deeper into the borehole. Consequently, the equivalent length of the bonded segment decreases, suggesting a partial failure of the bonded segment [22,23,24]. The anchoring agent installation process and test results are shown in Figure 22.
Analysis of Test Results: When the anchor cable pull-out force was 120 kN, the average actual elongation of anchor cables installed with integrated push–pull technology was 4.3 mm, while the average actual elongation of anchor cables installed with unconstrained technology was 4.55 mm, and the actual elongation of the anchor cables installed using both methods (unconstrained push and integrated push–pull device) was nearly identical to the theoretical elongation (4.5 mm), with only minor variations. This indicates that, under a pull-out force of less than 120 kN, the anchoring effectiveness of both installation methods is comparable. However, at a pull-out force of 160 kN, the average actual elongation of anchor cables installed with integrated push–pull technology was 15.2 mm, while the average actual elongation of anchor cables installed with unconstrained technology was 17.75 mm. The anchor cables installed using the integrated push–pull device method showed actual elongation closely matching the theoretical elongation (15 mm). At a pull-out force of 180 kN, the average actual elongation of anchor cables installed with integrated push–pull technology was 25.75 mm, while the average actual elongation of anchor cables installed with unconstrained technology was 28.9 mm. The anchor cables installed using the integrated push–pull device method showed actual elongation closely matching the theoretical elongation (25.5 mm). When the pull-out force exceeded 160 kN for anchor cables installed using the unconstrained push method, the actual elongation was significantly greater than the theoretical elongation. This discrepancy is attributed to premature leakage of the anchoring agent in the unconstrained installation method, which failed to reach the intended anchoring position. Consequently, this led to partial failure of the anchoring segment, causing the anchor cable to slip along the anchoring agent and resulting in greater actual elongation compared to theoretical expectations. The field anchor pull-out test results demonstrate that the anchoring effectiveness of the integrated push–pull device method is superior to that of the unconstrained push method.
After installing anchor cables using the push–pull device, a cross-point layout method was used to monitor the displacement of the roof and coal wall within the retreat channel to evaluate the effectiveness of the support system in controlling the surrounding rock. Displacement monitoring was conducted for both the 8101 working face retreat channel (where the anchor cables were installed using an unconstrained push method) and the 8102 working face retreat channel (where the anchor cables were installed using an integrated push–pull method). The layout of the monitoring points and the results are shown in Figure 23. Within 10 days of monitoring the section layout, the displacement of the coal wall in the retreat channel continued to increase, but the growth rate gradually slowed down. After 10 days, the growth in coal wall displacement slowed further and stabilized. At the beginning of monitoring, the roof displacement increased significantly but quickly stabilized due to the support from the hydraulic support system. After 8 days, the growth in roof displacement also gradually slowed down. The final roof deformation in the 8101 working face retreat channel was 311 mm, with the coal wall deformation at 242 mm. In the 8102 working face retreat channel, the final roof deformation was 150 mm, and the coal wall deformation was 127 mm. The deformation was reduced by nearly 50%, proving that the push–pull device installation method for anchor cables significantly enhances the control of the surrounding rock.

6. Conclusions

(1)
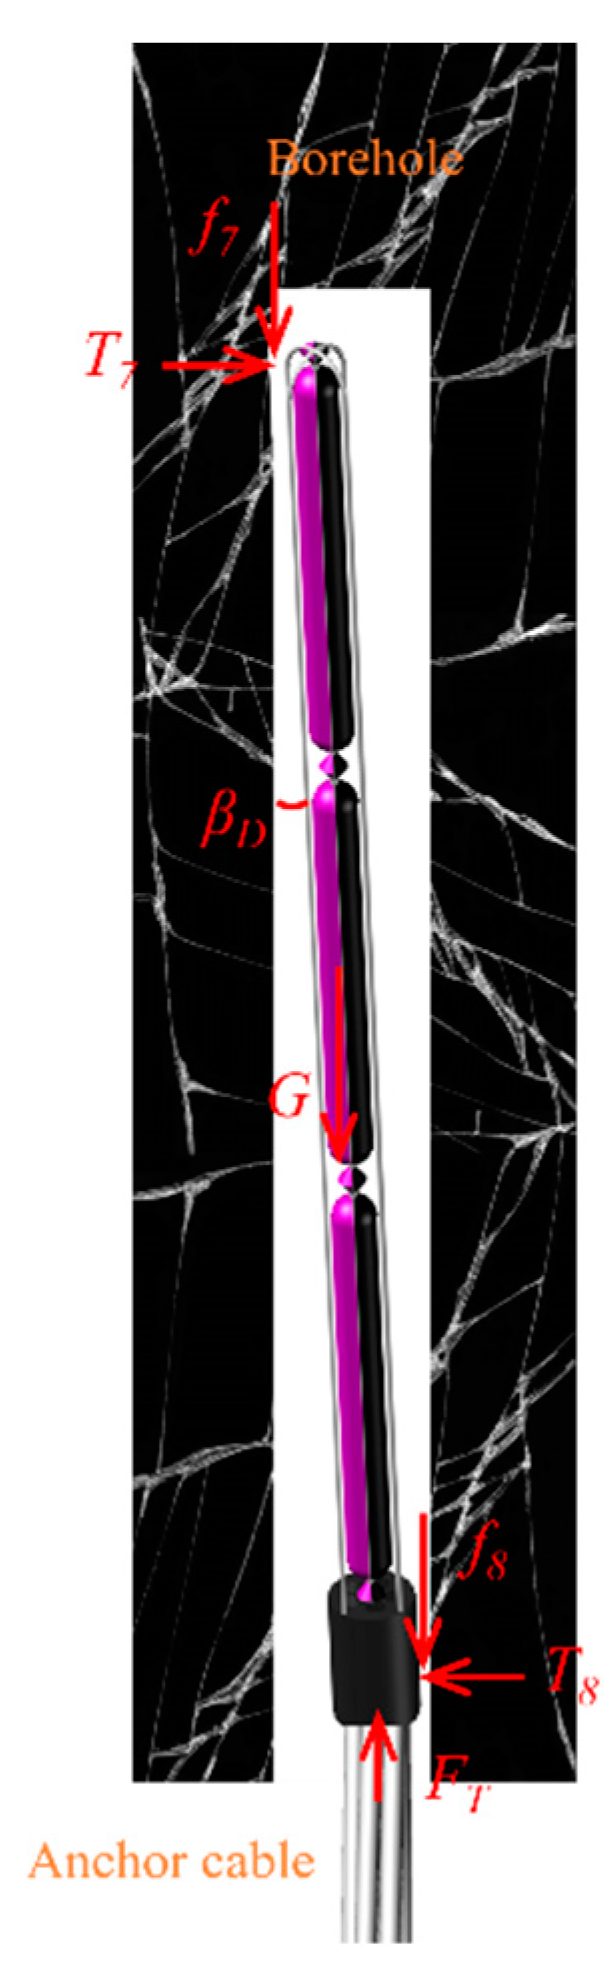
An ideal elastic compression rod model for the anchoring agent was established. The state of the anchoring agent inside the borehole during unrestrained pushing was categorized into two types: bending equilibrium and bending instability. The pushing force for the anchoring agent in the bending equilibrium state was 15.01 N. The bending instability of the anchoring agent was categorized into three types: the bending instability of the lower anchoring agent, the bending instability of the middle-lower anchoring agent, and the bending instability of the upper-middle-lower anchoring agent. The pushing force for these three instability types was 15.58 N, 16.02 N, and 16.32 N, respectively. The pushing force for the anchoring agent installed using the integrated push–pull method was calculated to be 13.52 N.
(2)
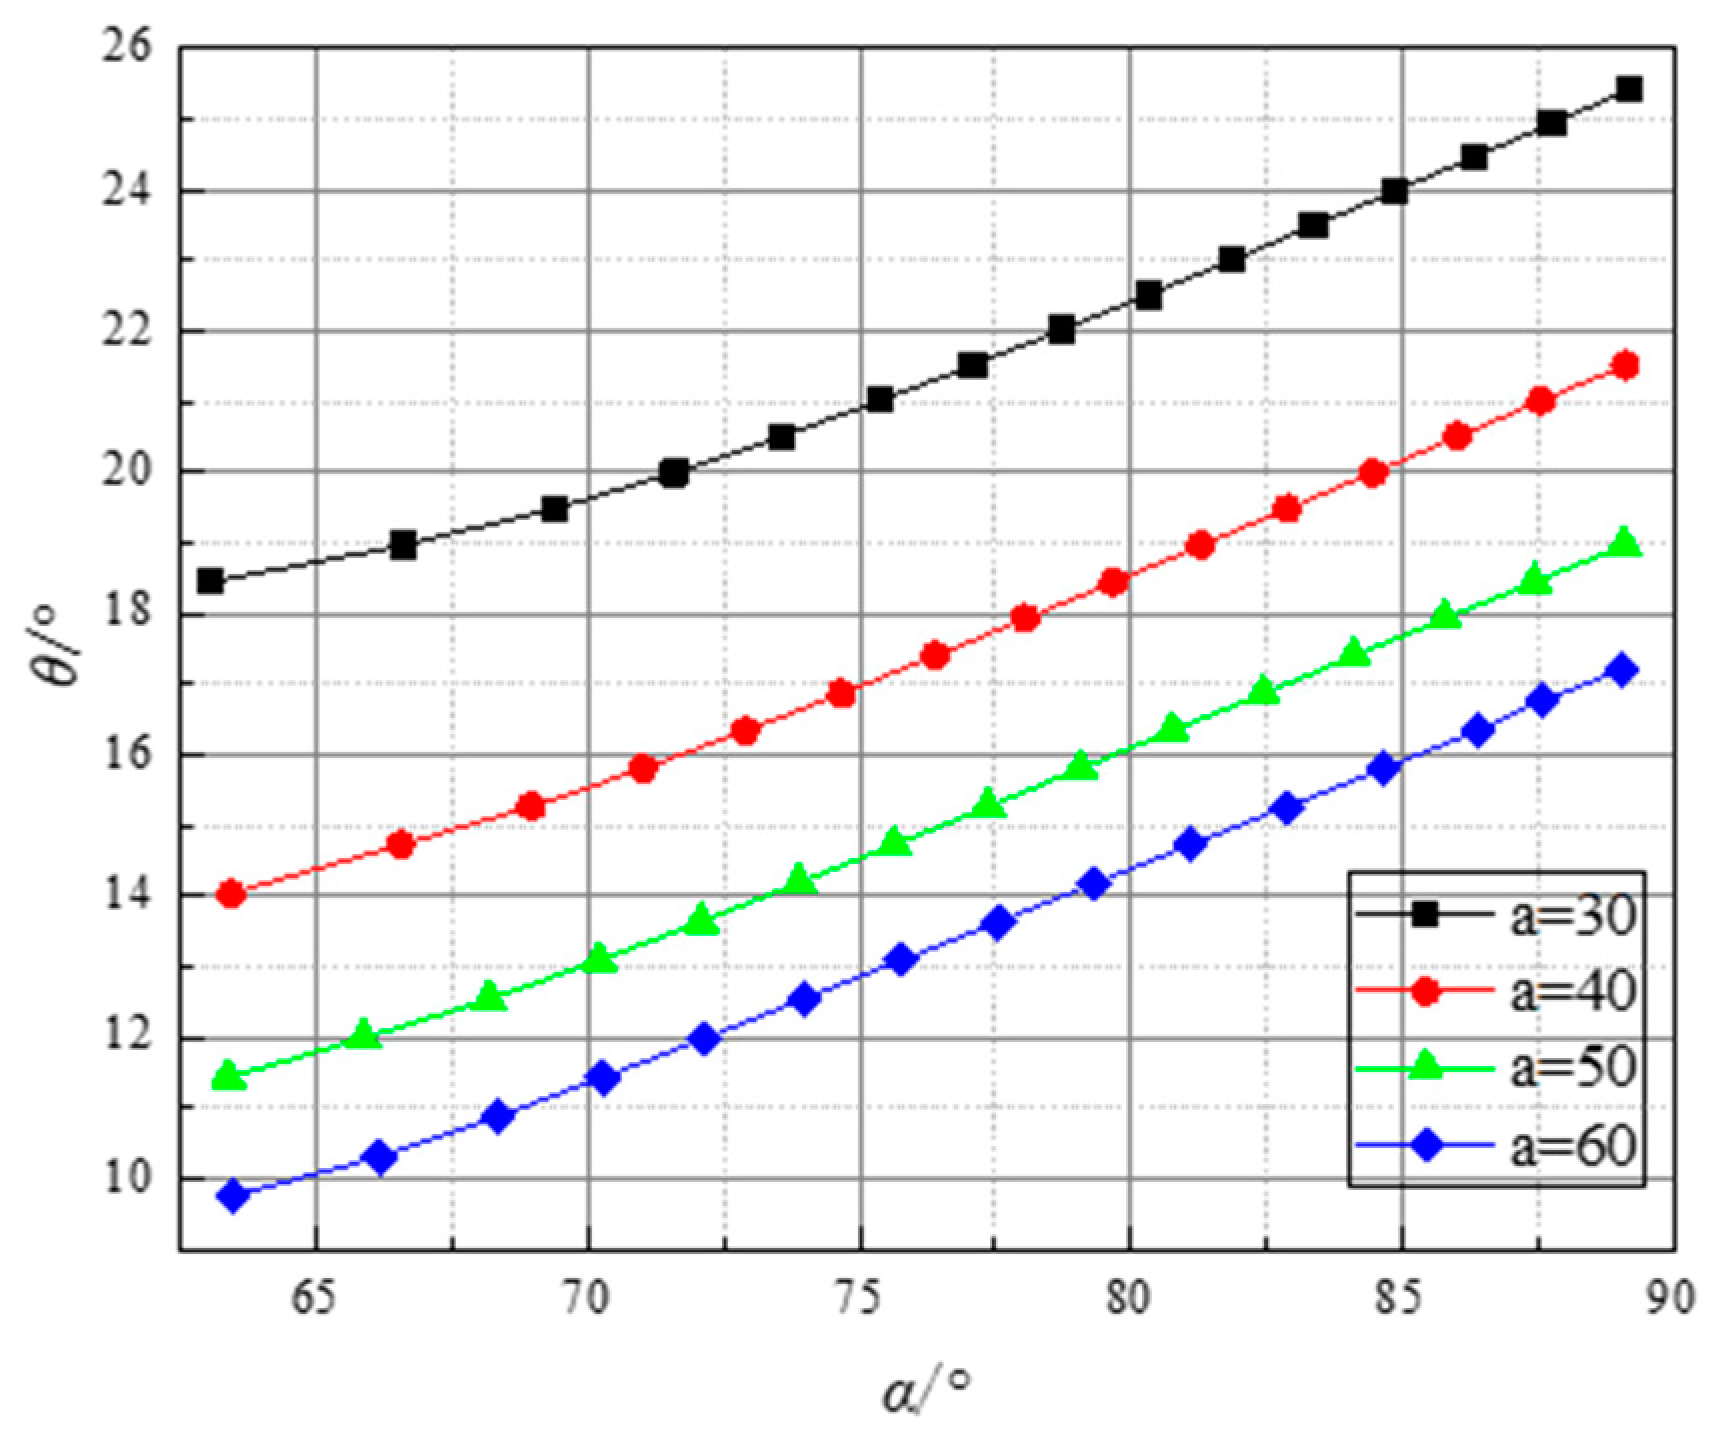
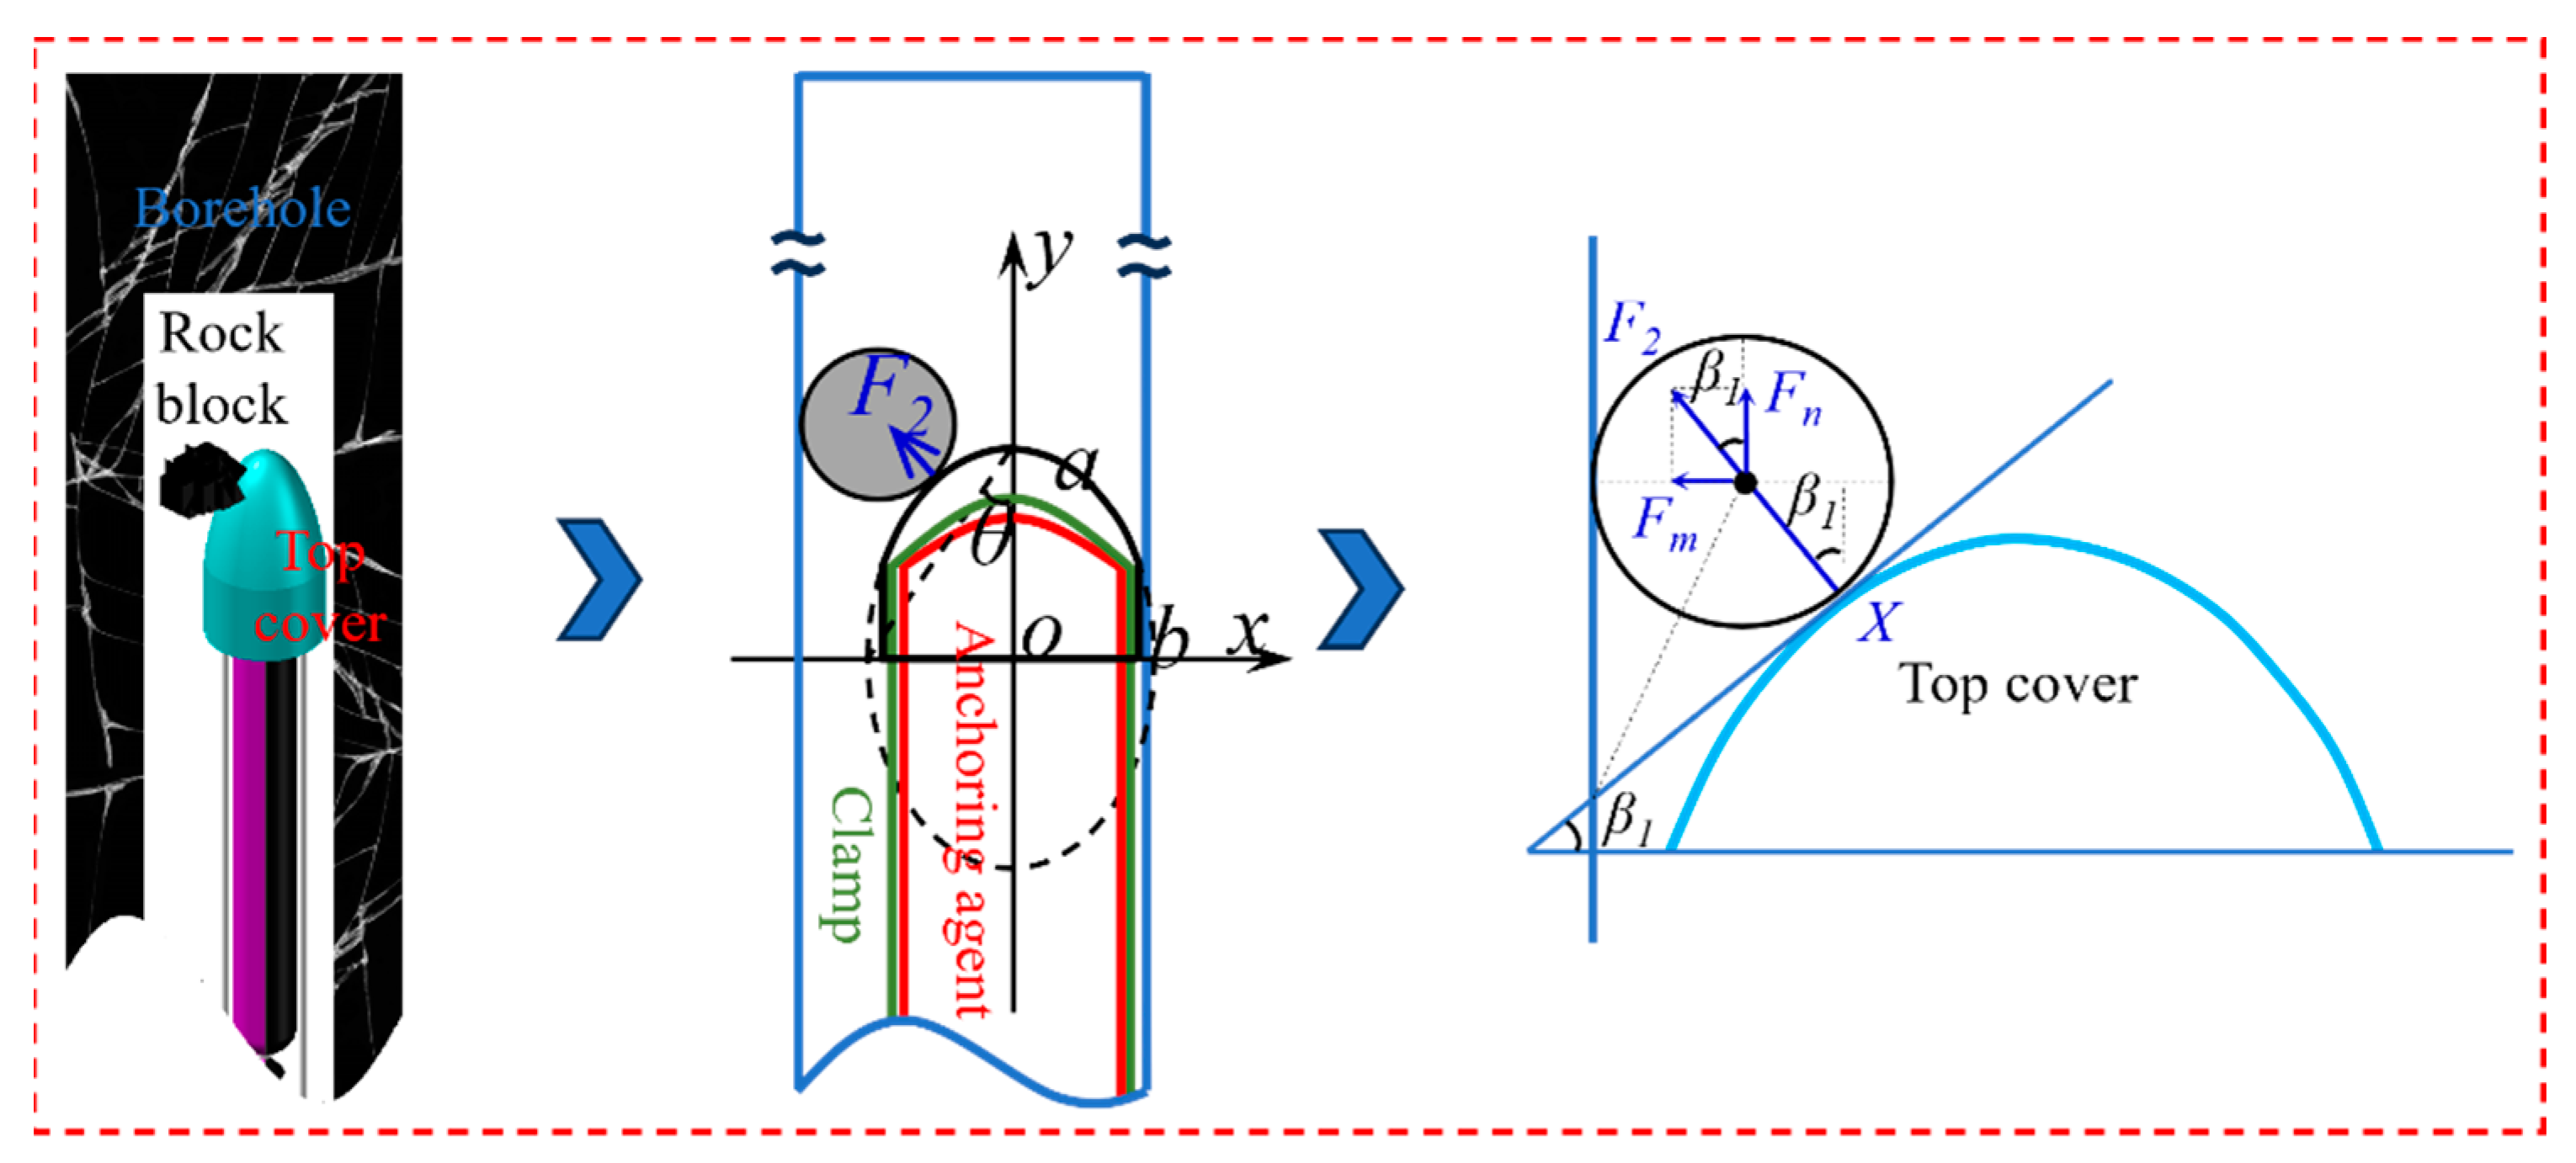
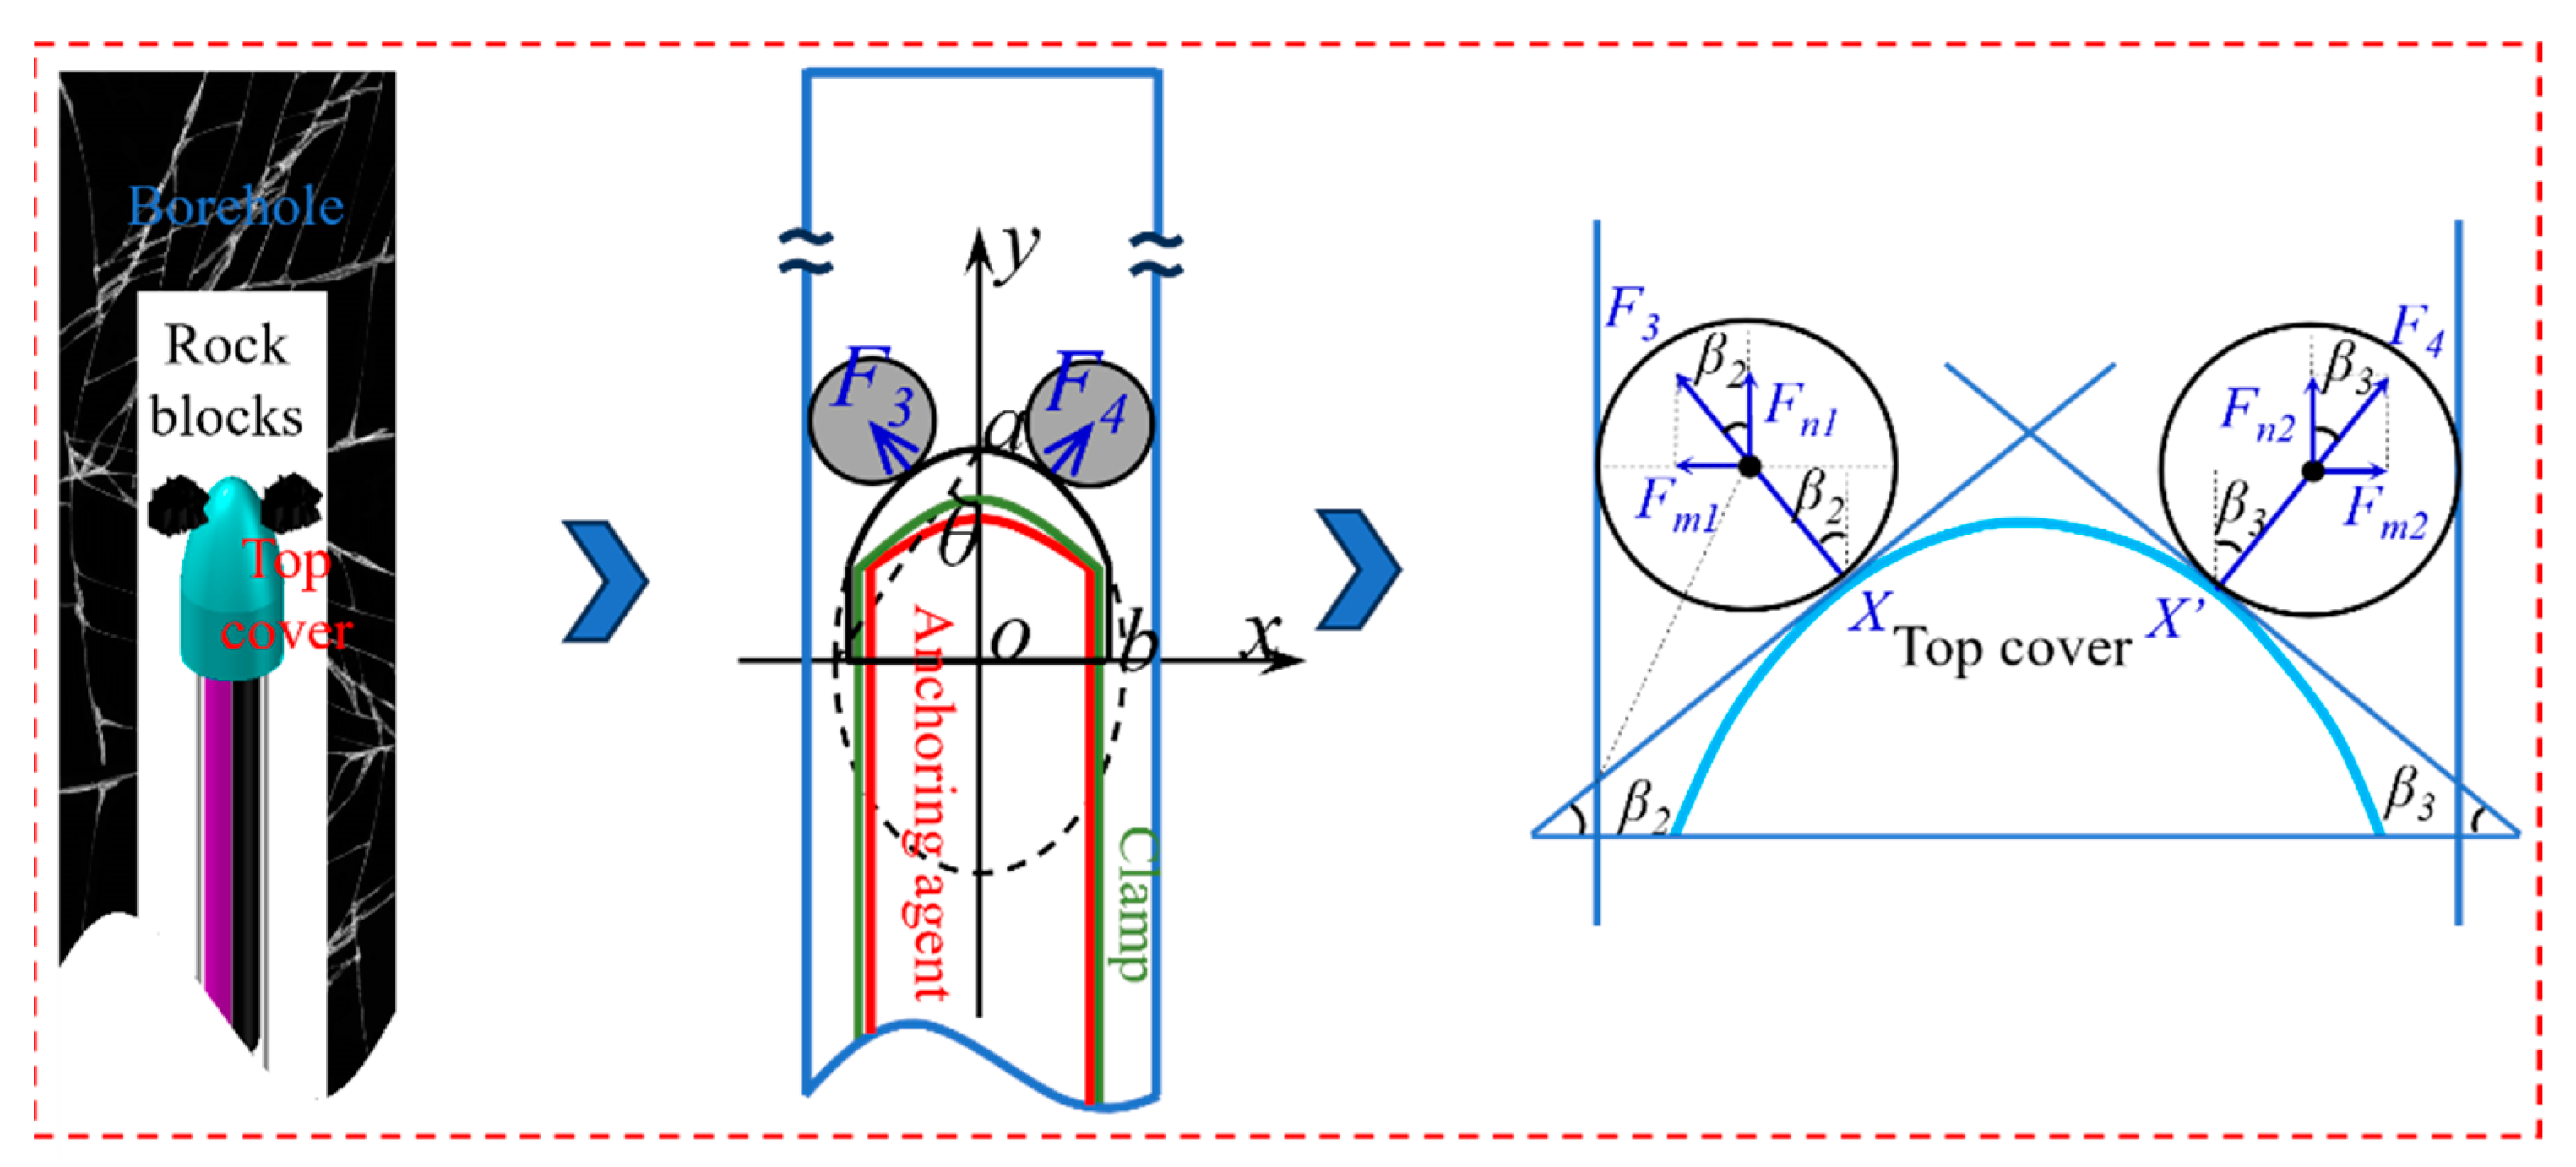
Borehole blockages were classified into three types: protruding rock blocks on one side of the borehole, fallen rock blocks on one side of the borehole, and fallen rock blocks on both sides of the borehole. Through force analysis, the optimal value of the angle θ on the elliptical cross-section of the top cover was determined to be 19°. When fallen rock blocks are present on one side of the borehole, the maximum pushing force is 14.79 N. When fallen rock blocks are present on both sides, the maximum pushing force is 13.61 N.
(3)
Mechanical loading tests were conducted on different types of bottom trays, and it was determined that the optimal thickness of the roof is 0.3 mm. Additionally, indoor physical simulation tests were performed to model the pushing of anchoring agents through the borehole. The results indicated that unrestrained pushing could not smoothly pass through borehole delamination and collapse zones, while pushing with the push–pull device was able to smoothly pass through these areas. When using a push–pull device without a top cover, it could not successfully pass through the borehole if protruding or fallen coal blocks were present. However, it was able to pass through the borehole smoothly with a top cover on the push–pull device.
(4)
The results of on-site anchor cable pull-out tests showed that, when the pull-out force reached 160 kN and 180 kN, the actual elongation of the anchor cables installed using the integrated push–pull technology was almost identical to the theoretical elongation. No significant slip or failure was observed in the anchored section of the cable. Monitoring of the surrounding rock deformation in the retreat channel indicated that the support system with the push–pull device for installing the anchoring agent reduced rock deformation by nearly 50%. This demonstrated that the technology significantly enhances the control of surrounding rock deformation.

7. Prospect

The mechanical analysis of the integrated push–pull installation technique of anchoring agents and the exploration of the anchoring enhanced mechanism in this article are based on the vertical installation conditions of the roof anchor cable. Further research is needed to determine whether this technology can still achieve enhanced control under the conditions of inclined drilling holes on a roof and horizontal drilling holes on two sides.

Author Contributions

D.W.: Conceptualization, Data curation, Investigation, Methodology, Visualization, Writing original draft. F.H.: Funding acquisition, Project administration, Writing review and editing. D.C.: Formal analysis, Investigation, Writing review and editing. M.B.: Supervision, Writing review and editing. X.W.: Investigation, Writing review and editing. C.X.: Writing review and editing. B.L.: Investigation, Writing review and editing. W.T.: Writing review and editing. All authors have read and agreed to the published version of the manuscript.

Funding

This work was supported by the National Natural Science Foundation of China (No. 52374149) and the China Scholarship Council (202306430072).

Data Availability Statement

The datasets generated or analyzed during the current study are available from the corresponding author upon reasonable request.

Conflicts of Interest

Author Xiao Wang was employed by the company Chongqing Chuandongnan Survey & Design Institute Co., Ltd. Author Bingquan Liu was employed by the company China Coal Research Institute. The remaining authors declare that the research was conducted in the absence of any commercial or financial relationships that could be construed as a potential conflict of interest.

References

  1. He, M.C.; Guo, A.P.; Meng, Z.G.; Pan, Y.F.; Tao, Z.G. Impact and explosion resistance of NPR anchor cable: Field test and numerical simulation. Undergr. Space 2023, 10, 76–90. [Google Scholar] [CrossRef]
  2. Zhou, C.; Huang, C.; Chen, Y.D.; Dong, Q.H.; Sui, W.H. Development of a novel resilient anchor cable and its large shear deformation performance. Int. J. Rock Mech. Min. Sci. 2023, 163, 105293. [Google Scholar] [CrossRef]
  3. Li, G.; Zhu, C.; Hongliang, L.; Tang, S.B.; Du, K.; Wu, C.Z. Energy balance support method in soft rock tunnel with energy absorbing anchor cable. Tunn. Undergr. Space Technol. 2023, 141, 105380. [Google Scholar] [CrossRef]
  4. Chen, D.D.; Jiang, Z.S.; Xie, S.R. Mechanism and key parameters of stress load-off by innovative asymmetric hole-constructing on the two sides of deep roadway. Int. J. Coal Sci. Technol. 2023, 10, 82. [Google Scholar] [CrossRef]
  5. Luo, J.W.; Zhang, D.L.; Sun, Z.Y.; Fang, Q.; Liu, D.P.; Xu, T.; Li, R. Numerical modelling and field monitoring study on large-span tunnelling using pretensioned bolt–cable combined support system. Tunn. Undergr. Space Technol. 2023, 132, 104911. [Google Scholar] [CrossRef]
  6. Wang, D.Q.; He, F.L.; Wu, Y.H.; Lv, K.; Zhang, J.L.; Shi, S.H.; Guo, J.; Xu, X.H.; Tao, K.; Zhang, Y.J.; et al. Study on stability and control of surrounding rock in the large section stopping space with extra-thick coal seam. Alexandria Eng. J. 2025, 117, 205–220. [Google Scholar] [CrossRef]
  7. Zheng, S.N.; Chen, H.X.; Xiao, Y.; Liu, Y.M.; Kuang, D.L.; Wu, Y.C.; Qiu, H.P. Influence mechanism of mineral composition ratios on the early anchorage properties for cement anchoring agents. Constr. Build Mater. 2024, 414, 135031. [Google Scholar] [CrossRef]
  8. Chen, D.D.; Jiang, Z.S.; Ma, X.; Xie, S.R.; Wang, E.; Li, H. Evolution law and engineering application on main stress difference for a novel stress relief technology in two ribs on deep coal roadway. J. Cent. South. Univ. 2023, 30, 2266–2283. [Google Scholar] [CrossRef]
  9. Hyett, A.J.; Bawden, W.F.; Macsporran, G.R.; Moosavi, M. A constitutive law for bond failure of fully-grouted cable bolts using a modified hoek cell. Int. J. Rock Mech. Min. Sci. 1995, 32, 11–36. [Google Scholar] [CrossRef]
  10. Li, D.L.; Masoumi, H.; Saydam, S.; Hagan, P.C. A constitutive model for load-displacement performance of modified cable bolts. Tunn. Undergr. Space Technol. 2017, 68, 95–105. [Google Scholar] [CrossRef]
  11. Chen, J.H.; Zeng, B.Q.; Liu, L.; Tao, K.M.; Zhao, H.B.; Zhang, C.; Zhang, J.W.; Li, D.Q. Investigating the anchorage performance of full-grouted anchor bolts with a modified numerical simulation method. Eng. Failure Anal. 2022, 141, 106640. [Google Scholar] [CrossRef]
  12. Shi, H.; Song, L.; Zhang, H.Q.; Chen, W.L.; Lin, H.S.; Li, D.Q.; Wang, G.Z.; Zhao, H.Y. Experimental and numerical studies on progressive debonding of grouted rock bolts. Int J Min. Sci. Technol. 2022, 32, 63–74. [Google Scholar] [CrossRef]
  13. He, D.Y.; Liu, S.W.; Jia, H.S.; Fu, M.W.; Jia, L.X.; Zhang, Y. Analysis of eccentric resin anchoring characteristics for cable bolts and the design of pushing and limiting device for resin cartridges. China J. Rock Mech. Eng. 2023, 42, 708–723. [Google Scholar] [CrossRef]
  14. Li, H.Z.; Li, X.H.; Zhong, Z.H.; Long, J.K. Experimental research on slippage mode and analysis on mechanical properties of coal rock anchorage system. J. Min. Saf. Eng. 2017, 34, 1088–1093. [Google Scholar] [CrossRef]
  15. Cao, C.; Ren, T.; Zhang, Y.D.; Zhang, L.; Wang, F.T. Experimental investigation of the effect of grout with additive in improving ground support. Int. J. Rock Mech. Min. Sci. 2016, 85, 52–59. [Google Scholar] [CrossRef]
  16. Zhang, M.; Han, J.; Cao, C.; Ma, S.W. Experimental study on anchorage performance of rockbolts by adding steel aggregates into resin anchoring agents. PLoS ONE 2021, 16, e0255046. [Google Scholar] [CrossRef]
  17. Chen, D.D.; Wu, Y.Y.; Xie, S.R.; Guo, F.F.; He, F.L.; Liu, R.P. Reasonable location of stopping line in close-distance underlying coal seam and partition support of large cross-section roadway. Int. J. Coal Sci. Technol. 2022, 9, 55. [Google Scholar] [CrossRef]
  18. Song, W.H.; Yu, S.Q.; Rong, H.; Jiao, H.C.; Xu, X.T. Study on the characteristic of overburden rock structure and support system of the retraction channel in layered fully mechanized caving face. Sci. Rep. 2024, 14, 1360. [Google Scholar] [CrossRef] [PubMed]
  19. O’Reilly, O.M.; Peters, D.M. On stability analyses of three classical buckling problems for the elastic strut. J. Elast. 2011, 105, 117–136. [Google Scholar] [CrossRef]
  20. Murphy, J.G. The stability of thin, stretched and twisted elastic rods. Int. J. Non-Lin. Mech. 2015, 68, 96–100. [Google Scholar] [CrossRef]
  21. Patel, A.; Basu, S. Numerical study of the compression of tightly constrained slender rods. Int. J. Solids Struct. 2023, 265, 112107. [Google Scholar] [CrossRef]
  22. Feng, C.; Liu, S.W.; Fu, M.X.; Yao, B.G.; Jia, H.S.; He, D.Y. Failure mechanism and strengthening countermeasures of end-anchored cable free section under combined tension and shear. Eng. Failure Anal. 2024, 157, 107949. [Google Scholar] [CrossRef]
  23. Dong, Z.Z.; Peng, H.D.; Liu, T.; Wang, K.; Zheng, J.G.; Li, H.F.; Qiu, X.Y. Study on the mechanism of prestress loss caused by friction in the free segment of anchor cables. Constr. Build Mater. 2024, 413, 134927. [Google Scholar] [CrossRef]
  24. Guo, F.X.; Tu, M.; Dang, J.X. Analysis and Design of Protection Device for Anchor Cable Pull-Out in High-Stress Roadways. Appl. Sci. 2023, 13, 12023. [Google Scholar] [CrossRef]
Figure 1. Roof drilling observation.
Processes 13 01216 g001
Figure 2. Disadvantages of traditional unconstrained anchoring agent installation technique.
Processes 13 01216 g002
Figure 3. Integrated push–pull installation technique.
Processes 13 01216 g003
Figure 4. Anchor agent compression rod model.
Processes 13 01216 g004
Figure 5. Force analysis of unconstrained pushing anchoring agent. ((A) Upper anchoring agent; (B) Middle anchoring agent; (C) Lower anchoring agent).
Processes 13 01216 g005
Figure 6. The instability types of the anchoring agents.
Processes 13 01216 g006
Figure 7. Force analysis of anchoring agent with push–pull device.
Processes 13 01216 g007
Figure 8. Anchorage agent encountered a protruding rock block.
Processes 13 01216 g008
Figure 9. α and θ relation curve.
Processes 13 01216 g009
Figure 10. Fallen rock blocks on one side above the top cover inside the borehole.
Processes 13 01216 g010
Figure 11. Tanβ1, FT, and R relation curves.
Processes 13 01216 g011
Figure 12. Fallen rock blocks on two sides above the top cover inside the borehole.
Processes 13 01216 g012
Figure 13. Tanβ2, FT, and R relation curves.
Processes 13 01216 g013
Figure 14. Mechanical loading test of the bottom tray.
Processes 13 01216 g014
Figure 15. Experimental loading curves.
Processes 13 01216 g015
Figure 16. The dimensions of the push–pull device.
Processes 13 01216 g016
Figure 17. Test materials and devices.
Processes 13 01216 g017
Figure 18. The anchoring agent form when the anchoring agent meets the delamination and collapse zones in borehole.
Processes 13 01216 g018
Figure 19. The anchoring agent form with push–pull device in clogged borehole.
Processes 13 01216 g019
Figure 20. Anchor bolt (cable) support design for the retreat channel.
Processes 13 01216 g020
Figure 21. Interior section division of anchor cable.
Processes 13 01216 g021
Figure 22. The relationship between the actual elongation and the theoretical elongation of cables.
Processes 13 01216 g022
Figure 23. Layout of measurement points and monitoring results.
Processes 13 01216 g023
Table 1. The maximum load that different types of trays.
Thickness of Tray RoofOne HoleTwo HolesThree HolesFour HolesFive Holes
0.3 mm781 N734 N639 N268 N241 N
0.5 mm858 N775 N734 N451 N412 N
0.7 mm1338 N1317 N12,111 N1013 N418 N
Disclaimer/Publisher’s Note: The statements, opinions and data contained in all publications are solely those of the individual author(s) and contributor(s) and not of MDPI and/or the editor(s). MDPI and/or the editor(s) disclaim responsibility for any injury to people or property resulting from any ideas, methods, instructions or products referred to in the content.

