Article

Synergistic Removal of Hazardous Dyes Using a Clay/Carbon Composite Derived from Spent Bleaching Earth: Optimization Using Response Surface Methodology

1
School of Environmental Engineering, Henan University of Technology, Zhengzhou 450001, China
2
Department of Water Resources Engineering, Bulawayo Polytechnic, Bulawayo P.O. Box 1392, Zimbabwe
3
Zhengzhou Key Laboratory of Water Safety and Water Ecology Technology, Zhengzhou 450001, China
4
Water Utilization and Environmental Engineering Division, Department of Chemical Engineering, University of Pretoria, Pretoria 0002, South Africa
5
Department of Crop and Soil Sciences, Faculty of Agriculture Sciences, Lupane State University, Lupane P.O. Box 170, Zimbabwe
*
Author to whom correspondence should be addressed.
Processes 2025, 13(4), 1217; https://doi.org/10.3390/pr13041217
Submission received: 19 March 2025 / Revised: 9 April 2025 / Accepted: 11 April 2025 / Published: 17 April 2025
(This article belongs to the Special Issue Advanced Wastewater Treatment Processes and Technologies)

Abstract

:
Industrial wastewater contains complex pollutants, including toxic dyes, necessitating effective and sustainable remediation strategies. Conventional treatment methods often struggle to remove multiple dyes simultaneously, underscoring the need for innovative adsorbents. This study investigated a clay/carbon composite (SBE/C (500 °C)) derived from spent bleaching earth (SBE) via pyrolysis for the simultaneous removal of methylene blue (MB) and malachite green (MG) dyes. The pyrolysis process significantly enhanced the specific surface area of SBE, improving its adsorption capacity. Using the Box–Behnken design (BBD) and response surface methodology (RSM), we optimized key parameters (pH, contact time, and dosage) at 45 °C and an initial dye concentration of 20 mg/L. The developed quadratic model demonstrated high predictive accuracy, with experimental results closely aligning with predictions (R2 = 0.9983 for MB, 0.9955 for MG), along with strong adjusted (R2 = 0.9962 for MB, 0.9896 for MG) and predicted (R2 = 0.9811 for MB, 0.9275 for MG) values. Under optimal conditions, the maximum adsorption capacities reached 27.77 mg/g for MB and 27.38 mg/g for MG. These findings highlight the potential of SBE/C (500 °C) as a sustainable and cost-effective adsorbent for the simultaneous removal of MB and MG from wastewater, offering a promising solution for environmental remediation.

1. Introduction

Methylene blue (MB) and malachite green (MG) are widely utilized in the textile industry, where they are subsequently discharged into textile wastewater [1]. MB and MG belong to the classes of phenothiazine and triphenylmethane dyes, respectively, and are both positively charged cationic synthetic dyes that are water-soluble [2]. Due to their complex molecular structures and xenobiotic nature, the removal of these pollutants from environmental wastewater is particularly challenging [3]. These dyes pose significant environmental and health risks due to their mutagenic properties, low biodegradability, resistance to degradation, carcinogenic potential, and intense color, which together contribute to serious ecological and human health concerns [3,4]. Prolonged exposure to MB and MG can have adverse effects on human health, including increased heart rate, jaundice, vomiting, immune system suppression, and impaired reproductive function [5]. Consequently, effective dye removal is crucial to mitigating potential risks to human health and ecosystems.
Various methods for dye removal, including membrane separation [6], ion exchange [7], coagulation [8], microbial degradation [9], and adsorption [10], have been widely explored for treating wastewater containing high levels of organic pollutants. Among these, adsorption has emerged as a particularly effective technology, due to its simplicity, cost-effectiveness, and high removal efficiency [11]. Activated carbon is a well-known adsorbent that has demonstrated superior performance in adsorbing gases and liquids due to its high specific surface area, significant micropore volume, optimal pore size distribution, rapid adsorption kinetics, and thermal stability [12]. However, the high production costs of commercial activated carbon restrict its widespread utilization, particularly in developing countries [13].
In response to this challenge, numerous studies have explored the use of various low-cost carbon materials for dye removal [14,15,16,17]. Among these materials, clay/carbon composites derived from spent bleaching earth (SBE) have shown great promise as effective adsorbents for dye removal from wastewater [8]. SBE is primarily composed of clay minerals, particularly aluminosilicate, and consists of 60–80% Al2O3 and SiO2. Additionally, SBE contains approximately 20–40% oil residue by weight, along with various metal impurities [18]. After the oil bleaching process, SBE remains as a byproduct [19]. Improper disposal of SBE poses significant environmental risks, including spontaneous combustion, the release of unpleasant odors, and secondary pollution. The calcination of SBE to produce clay/carbon composites has been shown to enhance adsorption performance significantly, making it a viable option for wastewater treatment [8,20,21].
Generally, the effectiveness of the adsorption process is highly dependent on the operating conditions. To optimize its performance, it is essential to investigate the influence of various factors on the adsorption process and to determine the optimum conditions through experimental design. Modern research increasingly relies on computer-aided methods and experiments to explore how selected variables affect a process’s response [22]. Among the statistical techniques available, response surface methodology (RSM) has proven to be a powerful tool for optimizing adsorption processes, including dye removal [23,24]. The Box–Behnken design (BBD) and central composite design (CCD) are two of the most widely used RSMs for process optimization. Among these, BBD has been shown to be slightly more effective than CCD and other RSM approaches in terms of efficiency and practical applicability [25]. Additionally, one of the key advantages of using the BBD for optimization is its ability to avoid experimental runs at extreme combinations of variable levels, which can be impractical or less relevant in real-world applications. In contrast, the CCD investigates a broader range of variable levels, including extreme high and low points, which may not always be necessary or relevant for the intended application. Therefore, BBD offers a more practical and resource-efficient approach, especially when the focus is on optimizing processes within a moderate and operationally feasible range [26].
In this study, the effects of three parameters, pH (4–9), contact time (120–300 min), and adsorbent dosage (0.6–1.2 g/L), were examined using the RSM, specifically the Design Expert software (version 13), to identify the optimum conditions for the simultaneous removal of both MB and MG from wastewater using SBE/C (500 °C). These variables were selected based on comprehensive insights from relevant literature and supported by preliminary experimental findings, recognizing their critical roles in adsorption processes [27,28,29,30]. Analysis of variance (ANOVA) was employed to assess the suitability of the model for predicting the dye removal capacities. The interactions between the parameters were visualized using three-dimensional (3D) response surface plots, and diagnostic plots were used to compare the predicted and experimental values, thus allowing for a deeper understanding of the residual errors.
The significance of this study lies in its (i) novel application of SBE/C (500 °C) for the competitive removal of MB and MG from wastewater, an important advancement given that most previous studies have primarily focused on single-dye systems or employed conventional adsorbents such as activated carbon, and agricultural waste materials [31,32], and (ii) the use of advanced experimental design techniques to systematically investigate the effects and interactions of multiple variables. This methodological approach not only enhances the depth of analysis but also allows for process optimization with fewer experimental runs, saving both time and resources compared with the traditional method of varying one factor at a time. To the best of our knowledge, this study is the first to apply SBE/C (500 °C) for the simultaneous removal of MB and MG from wastewater via RSM.

2. Materials and Methods

2.1. Chemicals

MB (C16H18CIN3S), MG (C23H25CIN2), NaOH, and HCl were purchased from Kermel Reagent (Tianjin, China). All chemicals were used as received without further purification. A stock solution of MB and MG was prepared by dissolving both MG and MB in a single flask (1000 mg/L) with distilled water. The stock solution was then diluted with distilled water to achieve the desired final concentrations. NaOH and HCl (0.1 mol/L) were used to adjust the pH to the required levels.

2.2. Synthesis of the Adsorbent

SBE was provided free of charge by United Refineries Limited in Bulawayo, Zimbabwe. The SBE was first dried at 105 °C for 12 h and then pulverized into a fine powder. To ensure uniformity in particle size, the powder was sieved through a 100-mesh screen (maximum particle size of 150 μm). The sieved SBE powder was pyrolyzed in a tube furnace (01200-IC, Kejia, Zhengzhou, China) under controlled conditions. The heating rate was gradually increased at 8 °C/min until the temperature reached 500 °C. The temperature was maintained constant for 2 h, while a continuous flow of nitrogen gas (150 mL/min) was supplied during the pyrolysis, and the organic components (oil residue) within the SBE were converted into carbonaceous species leading to the formation of a clay/carbon composite. The resulting clay/carbon composite was denoted as SBE/C (500 °C).

2.3. Adsorption Experiments

All adsorption experiments were performed by mixing the prepared SBE/C (500 °C) with 200 mL of a 20 mg/L (MB and MG) mixture at 45 °C and 150 rpm. The experiments were conducted under varying conditions of pH, adsorbent dose (g/L), and contact time (min). The adsorption capacities for MB and MG (qe (mg/g)) under different experimental conditions were calculated using Equation (1):
q t = ( C 0 C t ) V / m
where C0 and Ct (mg/L) are the initial and equilibrium concentrations of MB and MG at time t (min), respectively; V (L) is the volume of the solution; and m (g) is the mass of the adsorbent.

2.4. Analysis Methods

To ensure the reliability of the results, all experiments were conducted in triplicate. MB and MG samples were analyzed using a UV-visible spectrophotometer (TU-1900, Pgeneral, Beijing, China) at 664 nm for MB [27] and 618 nm for MG [33], respectively. After the adsorption experiments, the SBE/C (500 °C) was separated from the solution by filtration through a 0.45 μm membrane (Shanghai Xin Ya Purification Equipment Co., Ltd. Shanghai, China). Scanning electron microscopy (SEM) imaging was conducted using a ZEISS GeminiSEM 300 instrument (Oberkochen, Germany). The specific surface area and other physical properties of the materials were determined using the Brunauer–Emmett–Teller (BET) method with a Micrometrics ASAP 2460 instrument (Norcross, GA, USA). Fourier transform infrared (FTIR) spectra were analyzed using a Nexus 670 spectrometer (Madison, WI, USA) in the range of 4000–400 cm−1.

2.5. Experimental Design and Optimization Using RSM

Experimental optimization was performed using Design Expert Software (version 13). The BBD was employed to evaluate the combined effects of three independent variables: pH (4–9) (A), contact time (120–300 min) (B), and adsorbent dosage (0.6–1.2 g/L) (C) on the removal capacity of MB and MG dyes [34]. The pH (4–9) was selected to evaluate the adsorption behavior of MB and MG on the SBE/C (500 °C) under both acidic and alkaline conditions, while avoiding extreme pH levels that could compromise data interpretation. This range also considered the pH sensitivity of MG, which undergoes structural changes near its pKa (10.3) [35]; pH 9 was specifically included to assess adsorption in its deprotonated state. The selected dosage range (0.6–1.2 g/L) and contact time range (120–300 min) were guided by values commonly reported in the literature and preliminary investigations, ensuring relevance and comparability with previous studies [27,36,37,38]. These ranges were chosen to capture both lower and higher operational limits, allowing for a comprehensive evaluation of adsorption performance under conditions reflective of practical applications.
The optimization aimed to identify the conditions that would maximize the adsorption capacities for both dyes. Table 1 presents the minimum −1 (low), 0 (center), and maximum +1 (high) levels for each parameter. A total of 17 experimental runs were performed under different operating conditions as determined by the design. The experimental data were analyzed to develop a regression model based on an empirical polynomial equation, with statistical significance evaluated using ANOVA. The interactions between the parameters were visualized using 3D surface plots, generated with Design Expert Software (version 13) to provide a comprehensive understanding of the adsorption process.

3. Results and Discussion

3.1. Characterization

3.1.1. Morphology of SBE and SBE/C (500 °C)

The Supplementary Material (Table S1) presents the structural properties of SBE and SBE/C (500 °C), as determined by BET analysis. The specific surface area of SBE exhibited a significant increase after pyrolysis at 500 °C, which was approximately 401.65 times greater than its original value (0.17 m2/g to 68.28 m2/g). Additionally, calcination at 500 °C led to an increase in the mesopore volume and average pore diameter of SBE, increasing from 5.82 × 10⁻⁴ to 3.4 × 10⁻¹ cm3/g and from 13.83 to 19.93 nm, respectively. The significant improvement in the simultaneous adsorption of MB and MG onto SBE/C (500 °C) could be attributed to the removal of oils and volatile organic compounds during high-temperature pyrolysis. These findings aligned with a previous study on the pyrolysis of SBE, which reported a comparable increase in the specific surface area (up to 68.98 m2/g) after pyrolysis and an approximately 1.49-fold increase in pore diameter (from 10.67 to 15.86 nm) [21].
Figure 1 presents digital photographs and SEM images of the SBE and SBE/C (500 °C), illustrating the morphological transformations resulting from pyrolysis. The digital photographs reveal a distinct color change from light yellowish to black after pyrolysis at 500 °C, primarily due to the thermal decomposition and calcination of oil within the SBE at elevated temperatures (500 °C). The SEM images (Figure 1a) indicate that SBE possessed a rough and compact surface, whereas SBE/C (500 °C) (Figure 1b) exhibited a highly porous and sheet-like structure. This structural evolution significantly contributed to the enhanced adsorption capacity for MB and MG dyes, further demonstrating the effectiveness of pyrolysis in improving the material’s adsorption performance.

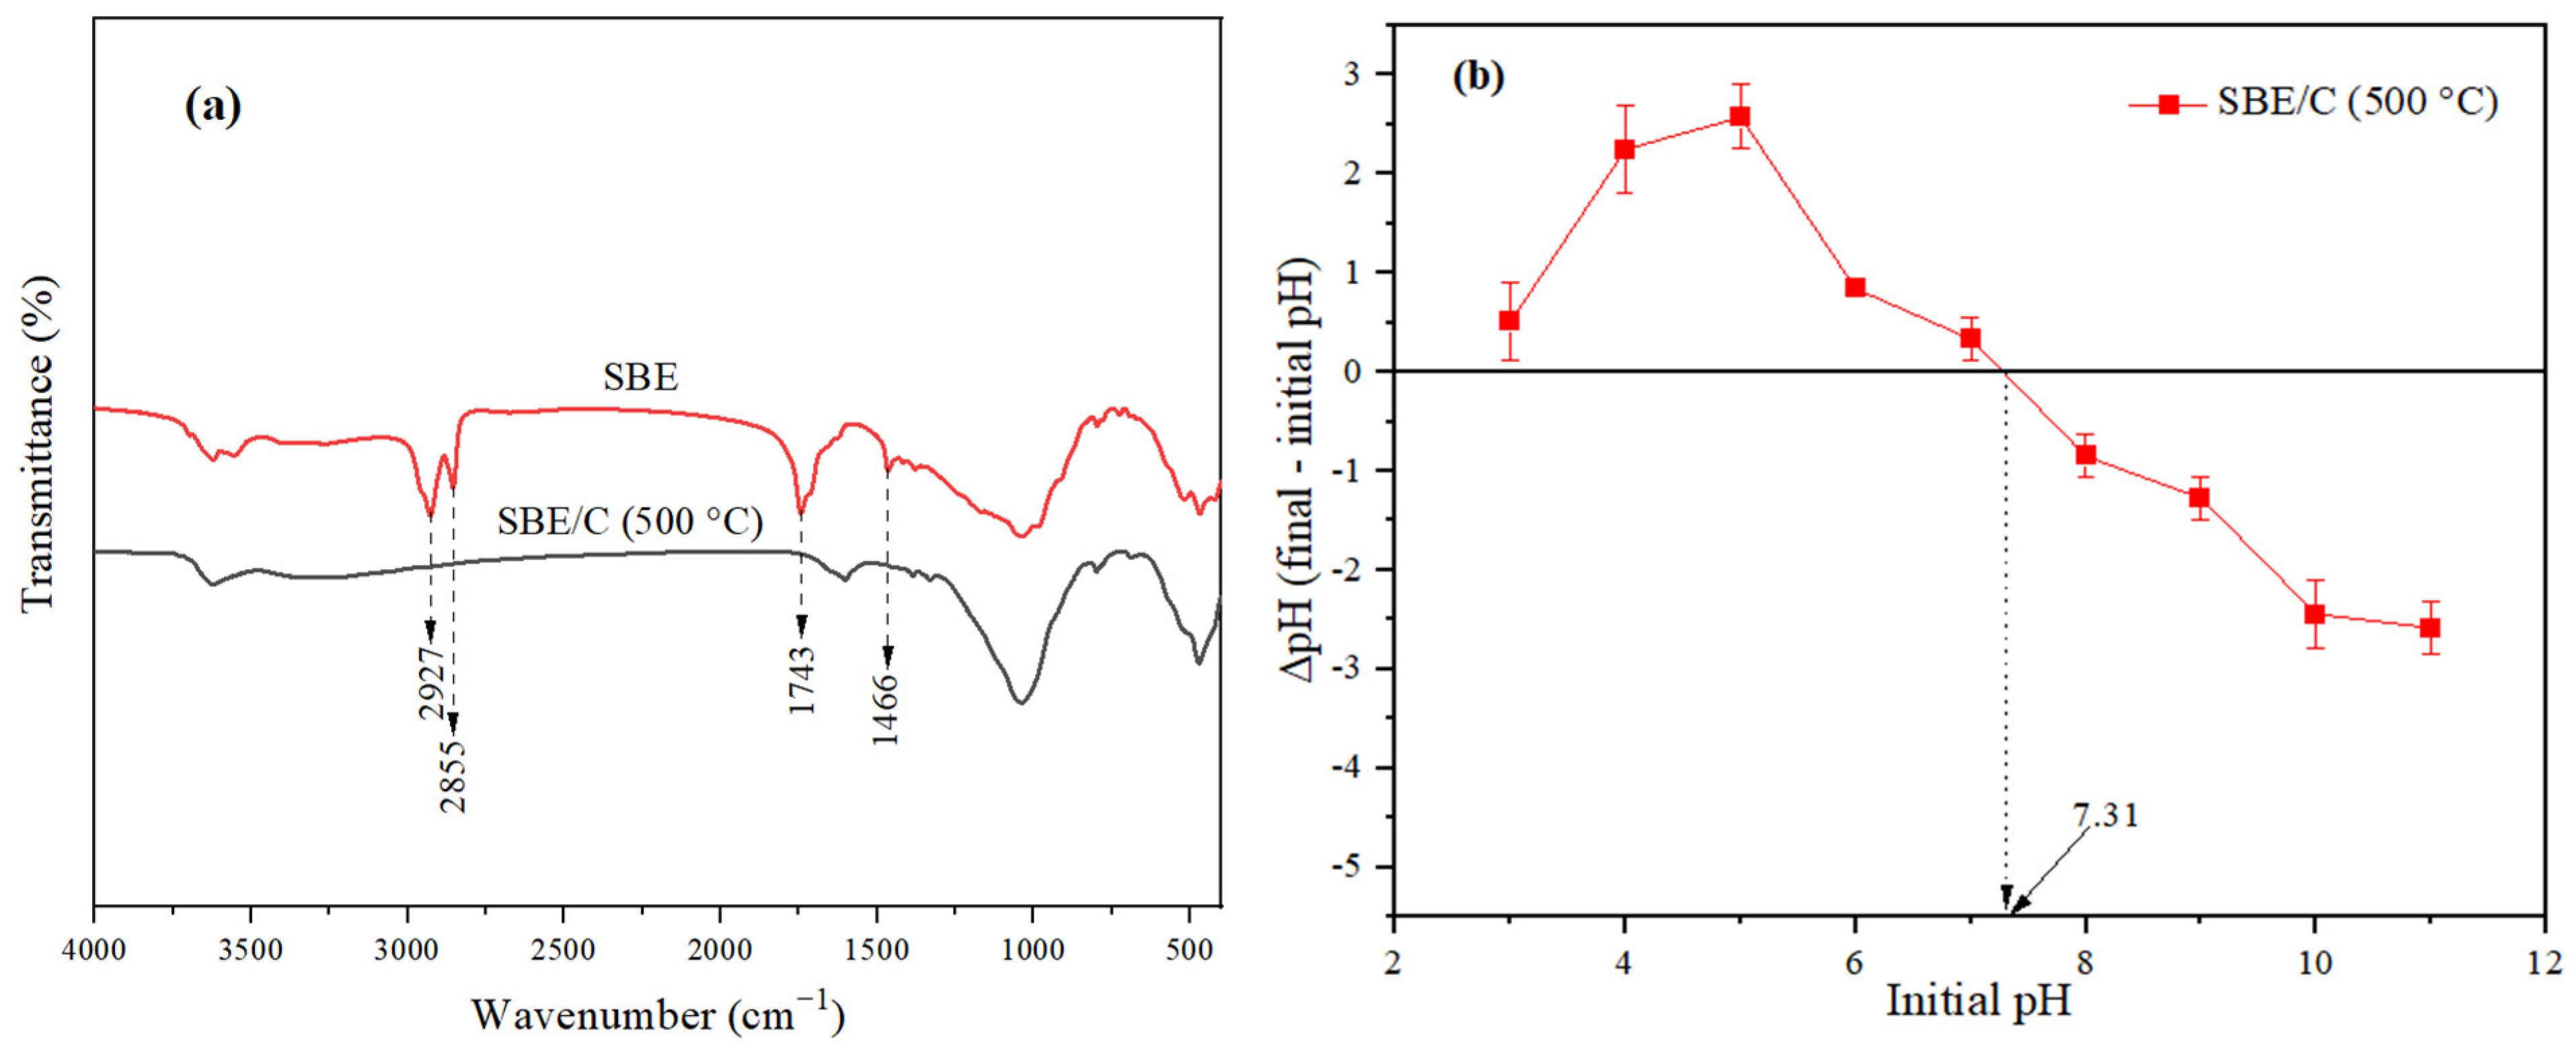
3.1.2. Fourier Transform Infrared Spectroscopy (FTIR) Analysis

Figure 2a shows a comparison of the FTIR spectra of SBE and SBE/C (500 °C). In SBE, characteristic absorption bands associated with organic matter were observed at 2927, 2855, and 1466 cm−1. Only SBE exhibited these specific bands, demonstrating that pyrolysis at 500 °C completely carbonized the organic components of SBE. Additionally, the peak at 1743 cm−1 associated with the C=O stretching vibration of the carboxyl group [39] was present in SBE but absent in SBE/C (500 °C) indicating that the pyrolysis process significantly reduced the organic matter content in SBE. FTIR analysis further confirmed the presence of –COOH, –COOR, and –OH groups in both SBE and SBE/C (500 °C).

3.1.3. pHpzc of SBE/C (500 °C)

The surface charge of the material surface, as indicated by the zero-point charge (pHpzc), significantly affected the adsorption performance by influencing the nature of the active sites. The pHpzc was determined by identifying the pH value at which the final pH of the solution remained unchanged and was equal to the initial pH, showing a neutral charge at that specific pH value. The pHpzc of SBE/C (500 °C) was 7.31, as shown in Figure 2b, indicating that the surface charge of SBE/C (500 °C) was pH-dependent, becoming positive at pH < 7.31 and negative at pH > 7.31. The pHpzc values of SBE/C (500 °C) reported in previous studies (7.40 [8] and 8.05 [21]) were consistent with the pHpzc value (7.31) obtained in this study.

3.2. Response Surface Methodology

To investigate the combined effects of various parameters on the efficiency of MB and MG removal by SBE/C (500 °C), a statistical experimental design based on RSM was employed using Design Expert Software (Version 13). Table 2 presents the experimental design matrix, including the corresponding response values, as well as the experimental and predicted values.
The results presented in Table 2 show that the removal capacities for both the cationic dyes MB and MG by SBE/C (500 °C) varied between 8.43 and 25.39 mg/g for MB and between 7.18 and 24.05 mg/g for MG. The highest removal capacity for MB (25.39 mg/g) was achieved under optimal operating conditions: pH (A) 6.5, contact time (B) 300 min, and adsorbent dosage (C) 0.6 g/L. Similarly, the highest adsorption capacity for MG (24.05 mg/g) was obtained at pH (A) 9, a contact time of (B) 210 min, and an adsorbent dosage of (C) 0.6 g/L.
To determine the relationship between the independent variables and the corresponding response, different models were evaluated, including two-factor interaction (2FI), quadratic, linear, and cubic models. Among these the quadratic model proved to be the most suitable based on the R2 value. The results of the model summary statistic for the MB and MG dye removal capacities for the examined models are shown in Table 3. Based on the obtained results, the cubic model was aliased and therefore unsuitable for further modeling of the experimental data. The software recommended a quadratic model for both MB and MG removal capacities, with strong R2 values of 0.9983 and 0.9955, respectively, and corresponding adjusted R2 values of 0.9962 and 0.9896, respectively. Therefore, further analyses were conducted using the quadratic model [40]. Furthermore, previous studies on optimizing the adsorption of cationic and anionic dyes using BBD [41], as well as the biosorption of MG with Spirulina Platensis mass [42], have employed the quadratic model of RSM as it demonstrated the highest R2 value compared with the linear, 2FI, and cubic models.
An empirical polynomial regression model was used to analyze the interactions of different parameters on MB and MG adsorption onto SBE/C (500 °C). The regression Equations (2) and (3) provide a mathematical presentation of the adsorption for MB and MG in terms of the coded factors [43,44]:
MB = 14.23 + 3.95   A + 1.33   B     3.45   C + 0.73   AB     0.17   AC     1.11   BC     2.29   A 2 + 1.65   B 2 + 3.45   C 2
MG = 13.30 + 5.32   A + 0.65   B     2.78   C + 1.14   AB     1.79   AC     0.23   BC     2.36   A 2 + 1.44   B 2 + 3.09   C 2
Positive coefficients corresponded to indicate an increase effect of a variable on adsorption capacity, whereas negative coefficients denoted an inhibitory effect.

3.3. ANOVA Analysis

The statistical significance of the developed models, main interactions, and quadratic effects were evaluated using F-test ANOVA, whereas p values were used to determine the significance and interactions of the experimental parameters, as presented in Table 4 and Table 5. If the p-value was <0.05 (95%), the terms in the model were deemed statistically significant, suggesting a strong connection between those terms and the result [45]. Conversely, p-values above 0.10 suggested statistical insignificance, implying a negligible or non-existent relationship between the terms and the result [46].
Based on the findings presented in Table 4 and Table 5, the quadratic model exhibited a high level of statistical significance, as indicated by a p-value < 0.0001. This low p-value strongly suggests that the quadratic model effectively captured the relationship between the variables under investigation [47].
Table 4 and Table 5 show that the pH, contact time (min), and adsorbent dosage (g/L) had a significant effect (p < 0.05) on the MB and MG removal capacity using SBE/C (500 °C). Furthermore, as presented in Table 4, for the quadratic effects and interactions, only the interaction effect between MB (pH and adsorbent dosage (g/L)) had an insignificant effect. The model F-value of MB (467.56) indicated that the model was significant (p < 0.05) [47]. Conversely, as shown in Table 5, for the interaction and quadratic effects of MG removal by SBE/C (500 °C), only the interaction effect between MG (contact time (min) and adsorbent dosage (g/L)) had a non-significant effect. Furthermore, the model F value of 170.94 for MG indicated that the model was significant (p < 0.05) [47]. Therefore, the suitability of the model for accurately representing experimental data was confirmed. The Pre-R2 values (0.9811 for MB and 0.9275 for MG dyes) aligned reasonably well with their Adj-R2 values (0.9962 for MB and 0.9896 for MG dyes), as did the coefficients of determination (R2) values (0.9983 for MB and 0.9955 for MG dyes). The adequate precision values of 80.370 and 45.540 for the MB and MG, respectively, confirmed the model’s provided signal-to-noise ratio (>4), making them reliable for optimization purposes [48].

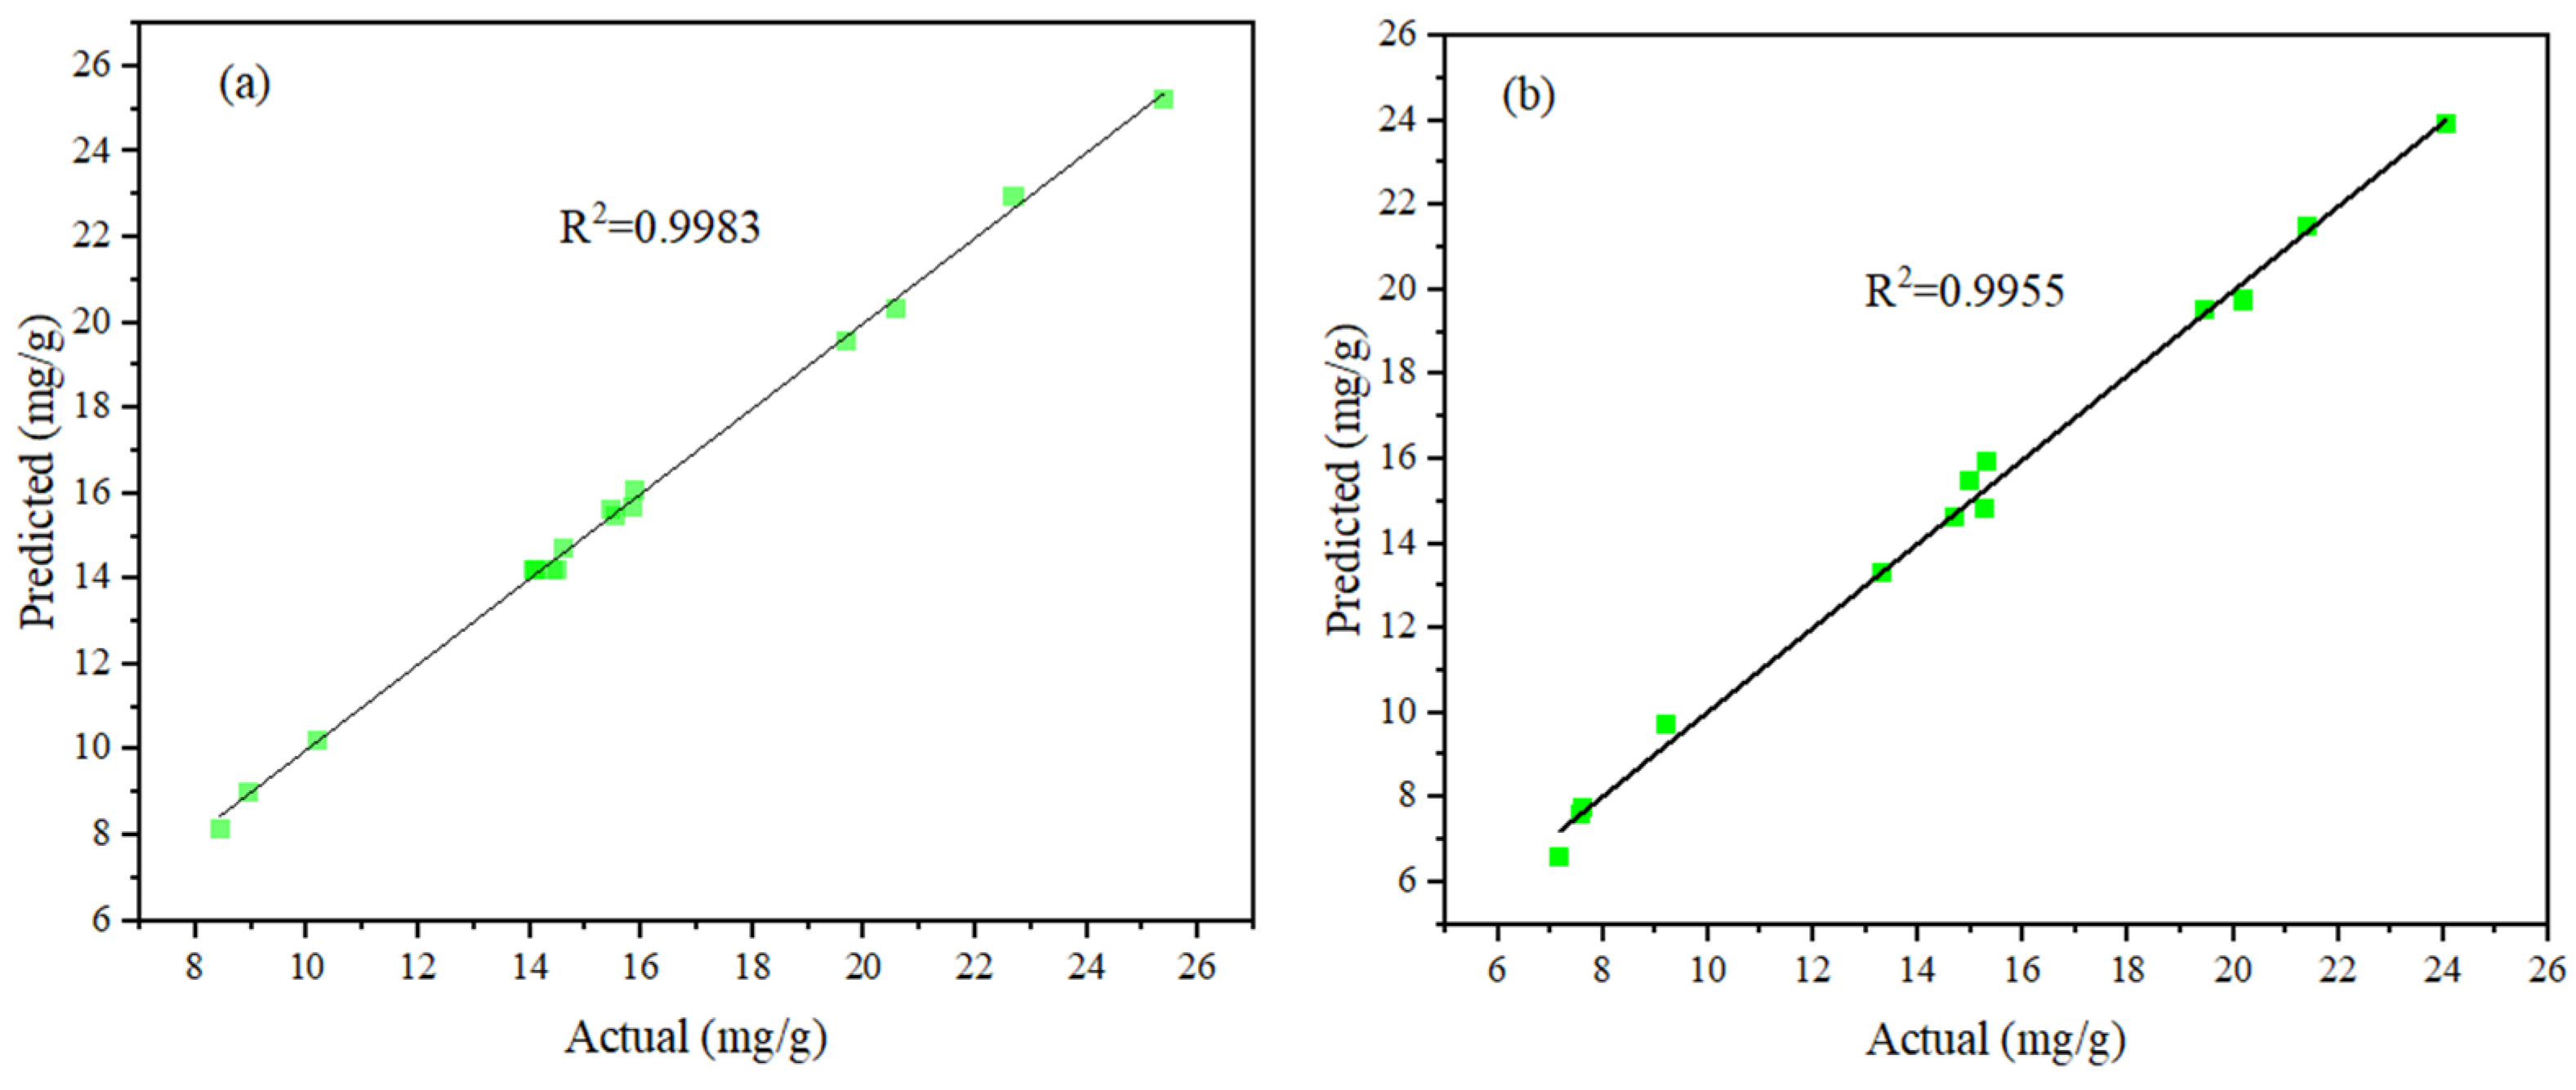
3.4. Statistical Analysis

Figure 3a,b show the correlation between the actual and predicted adsorption capacities data for the cationic dyes, MB, and MG onto SBE/C (500 °C). The residuals were randomly scattered near the straight line, indicating that the developed quadratic model effectively predicted the MB and MG removal capacity responses within the investigated parameter range [47]. Table 3 shows strong correlations for MB and MG, with R2 values of 0.9983 and 0.9955, respectively, suggesting that approximately 0.17% (MB) and 0.45% (MG) of the total variance were not adequately accounted for by the model [49]. Hence, the findings indicated that the quadratic model was effective in predicting the response variables for the experimental data related to the removal capacity of both MB and MG dyes onto SBE/C (500 °C) [50].

3.5. Interaction Effects of Factors

This RSM was used to explore the influence of various factors on the adsorption capacities of SBE/C (500 °C) for MB and MG. This involved creating 3-D plots to visualize the interactions. The ANOVA results, presented in Table 4 and Table 5, revealed that the interaction between AB (pH and contact time (min)) for both MB and MG had a significant effect on the adsorption process. Conversely, the interaction between BC (contact time (min) and adsorbent dosage (g/L)) and MB had a significant influence, whereas the interaction between AC (pH and adsorbent dosage (g/L)) and MG had a significant influence. The conclusions drawn from the analysis are as follows.

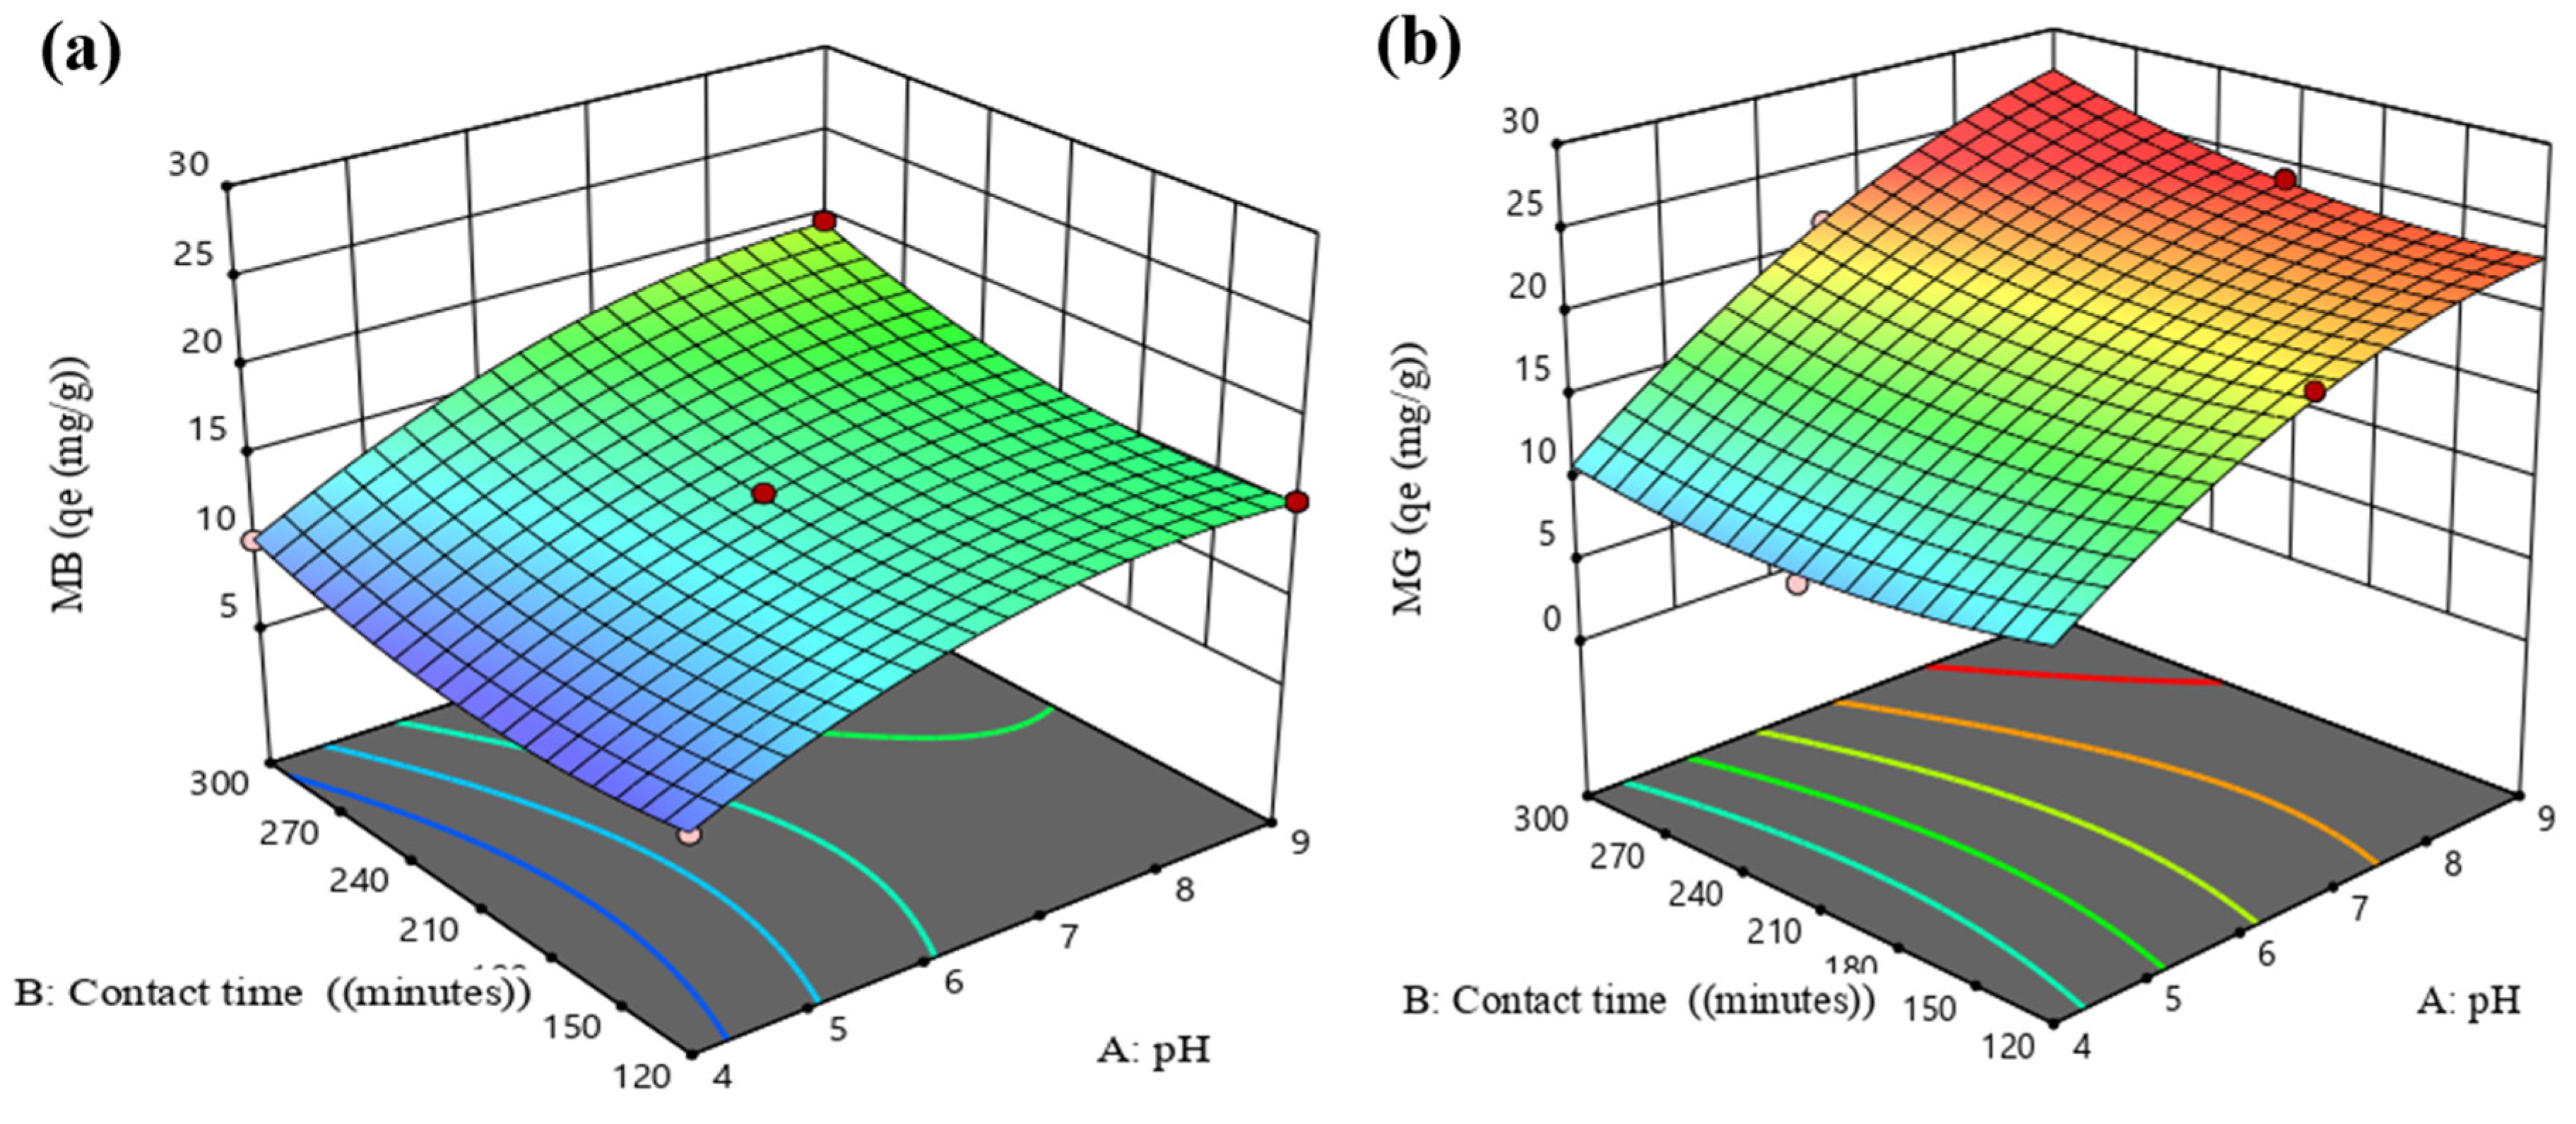
3.5.1. Interaction Effect of MB and MG AB (pH and Contact Time (min))

Figure 4a,b illustrate the interactive effects of pH and contact time (min) on the adsorption capacity of both MB and MG dyes onto SBE/C (500 °C) at a constant temperature (45 °C), Co (20 mg/L), and dosage (0.6 g/L). For both cationic dyes, the adsorption capacity increased as the pH increased from 4 to 9. The lower removal capacity observed at low pH values indicated that excess H+ ions competed with MB and MG cations for the available binding sites on the material.
The negative surface charge of SBE/C (500 °C) (pHpzc = 7.31) in the pH range of 7 to 9 (Figure 2b) promoted strong electrostatic attraction toward the cationic MB and MG dyes, leading to enhanced adsorption [51]. Similar trends were reported in studies involving MB adsorption onto ZnO nanoparticles [52] and MG adsorption onto Spiriluna platensis mass [42], which also reported an increase in the MB removal capacity with increasing pH. Notably, compared with MB, the removal capacity of MG was more significantly influenced by the interactive effects of pH and contact time.

3.5.2. Interaction Effects of MB and MG BC (Contact Time (min) and Adsorbent Dosage (g/L))

Figure 5a,b illustrate the combined effects of the contact time (min) and dosage (g/L) on MB and MG adsorption at temperature (45 °C), Co (20 mg/L), and pH (6.5) for MB and pH (9) for MG. As observed in Figure 5a, the highest adsorption capacity of MB (25.39 mg/g) was achieved after 300 min of contact with an adsorbent dosage of 0.6 g/L. Similarly, as illustrated in Figure 5b, for MG, the maximum adsorption capacity (24.05 mg/g) was obtained at a contact time of 210 min. Notably, the interaction effect of contact time and adsorbent dosage demonstrated a decreasing trend in removal capacity as the adsorbent dosage increased for both cationic dyes. This behavior could be attributed to the surplus of adsorption sites created by the higher adsorbent dosage, which surpassed the saturation point. Consequently, only a fraction of the active sites was effectively occupied by MB and MG molecules [53]. Previous research on the adsorption of MG using Manihot esculenta crantz waste via the BBD [54] aligned with the current findings, demonstrating that increasing the contact time enhanced the adsorption capacity, while increasing the adsorbent dosage led to a reduction in the adsorption capacity.

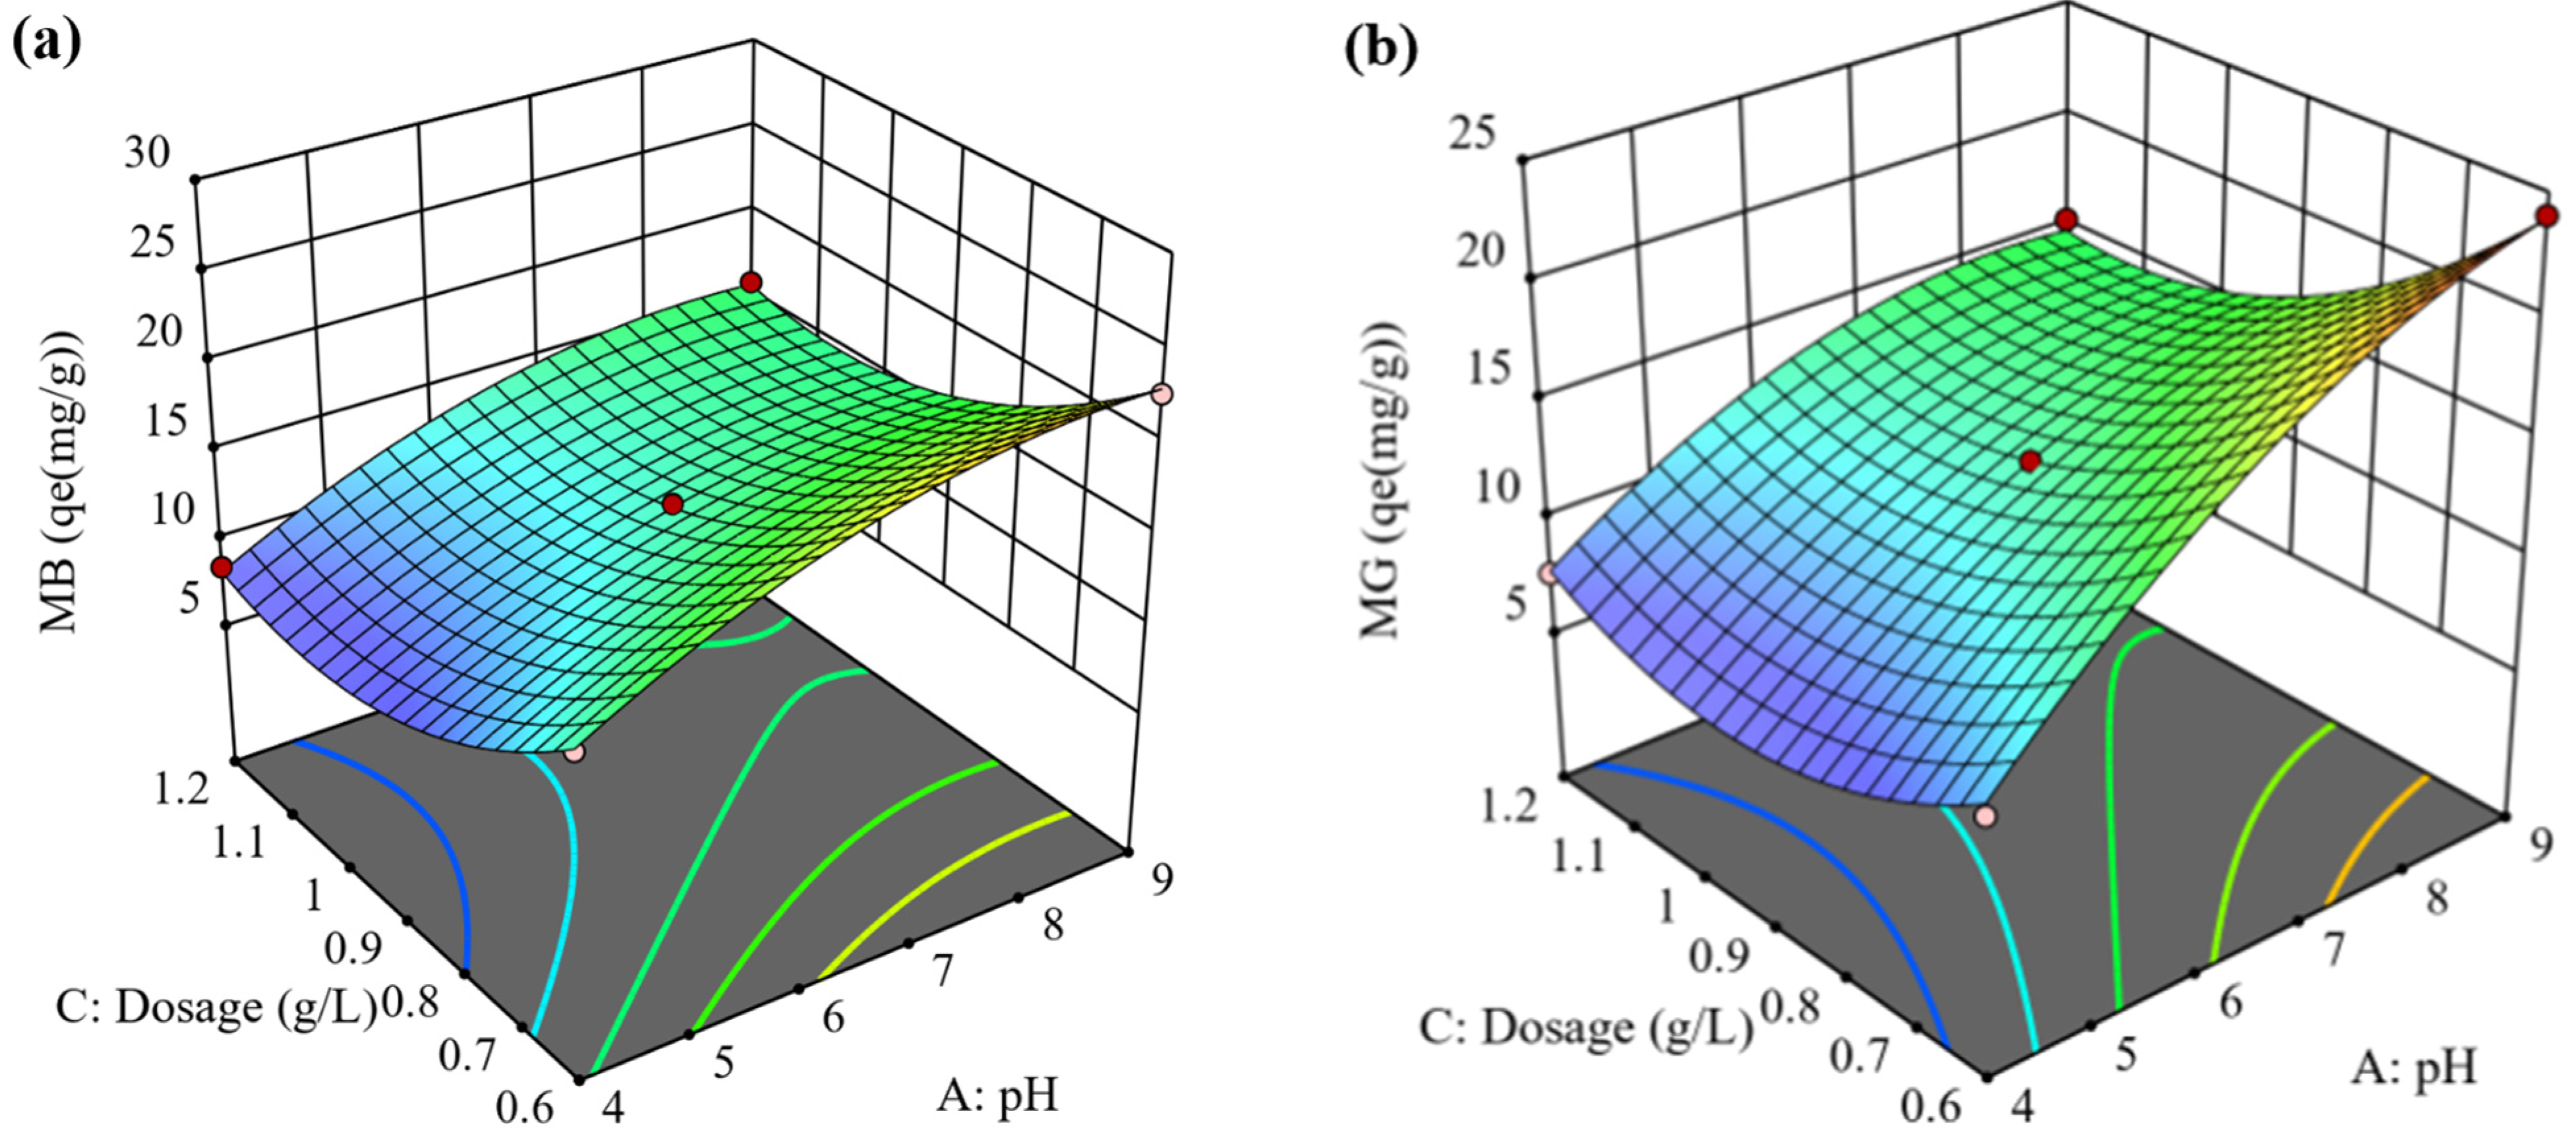
3.5.3. Interaction Effects of MB and MG AC (pH and Adsorbent Dosage)

Figure 6a,b illustrate the combined effect of pH and adsorbent dosage (g/L) on MB and MG adsorption onto SBE/C (500 °C) at Co (20 mg/L), temperature (45 °C), and 210 min and 300 min for MB and MG, respectively. The adsorption capacity increased with pH (4 to 9) from 8.433 to 25.3922 mg/g for MB and from 7.177 to 24.0452 mg/g for MG. However, despite increasing the adsorbent dosage, the ability to remove the dyes decreased in terms of the adsorption capacity.

3.6. Process Optimization

One of the primary objectives of this study was to identify the optimal process conditions for maximizing the adsorption capacity of MB and MG cationic dyes onto SBE/C (500 °C). To achieve this, a quadratic model was optimized using RSM. The optimal values of pH, contact time (min), and adsorbent dosage (g/L) at Co (20 mg/L) and temperature (45 °C) were determined to be 9, 300 min, and 0.6 g/L, at an initial dye concentration of 20 mg/L (Co) and a temperature of 45°, resulting in a desirability index of 0.50 out of 65 possible solution sets, as summarized in Table 6.
Model validation experiments confirmed that under these conditions, the highest removal capacities for MB and MG by SBE/C (500 °C) were 27.769 and 27.379 mg/g, respectively (Table 6). These predicted values were slightly higher than the maximum adsorption capacities observed experimentally, which were 25.39 mg/g for MB and 24.05 mg/g for MG, as presented in Table 1. SBE/C (500 °C) exhibited satisfactory MB and MG adsorption capacities in comparison with other low-cost adsorbents, as reported in the literature [55,56,57,58] (Supplementary Table S2).

4. Conclusions

The findings demonstrated that SBE/C (500 °C) effectively removed MB and MG in a competitive adsorption environment. The optimization of the adsorption process was performed using RSM with the BBD, aiming to identify the optimum experimental conditions for maximizing removal capacity. The results revealed a strong correlation between the experimental data and the predictive models, with high R2 values of 0.9983 for MB and 0.9955 for MG, further validating the accuracy and reliability of the model in representing the adsorption behavior. Analysis of variance (ANOVA) indicated that the pH and the adsorbent dosage were the most significant factors influencing the removal capacity for both dyes, while the contact time had a comparatively lesser impact. The optimum conditions for the simultaneous removal of MB and MG were found to be a pH of 9, a contact time of 300 min, and an adsorbent dosage of 0.6 g/L, under a controlled temperature of 45 °C and an initial dye concentration of 20 mg/L. Under these conditions, the maximum removal capacities for MB and MG by SBE/C (500 °C) were 27.77 mg/g and 27.38 mg/g, respectively. The competitive adsorption study further revealed that SBE/C (500 °C) demonstrated a stronger affinity for MB molecules compared with MG molecules. In conclusion, this study demonstrated that SBE/C (500 °C) is a promising adsorbent for the simultaneous removal of MB and MG dyes from wastewater. Its high efficiency, low cost, and sustainable nature make it a viable alternative to commercial activated carbon. Implementing this approach in wastewater treatment could significantly reduce dye pollution, contributing to cleaner water resources and a healthier environment.

Supplementary Materials

The following supporting information can be downloaded at https://www.mdpi.com/article/10.3390/pr13041217/s1, Table S1: BET analysis results for SBE and SBE/C (500 °C); Table S2: Comparison of maximum MB and MG dye removal capacities using different low-cost adsorbents. References [55,56,57,58] are cited in the supplementary materials.

Author Contributions

Conceptualization, F.M., Z.W., Y.S. and D.W; methodology, F.M., Z.W., Y.S., B.Z. and D.W.; software, F.M., Y.W., B.C., B.Z. and D.G.; formal analysis, F.M., Z.W., Y.S., D.G., D.W. and S.T.; investigation, F.M., Z.W., Y.S., D.W., S.T. and Y.W.; data curation, F.M., Y.W. and D.G.; writing—original draft preparation, F.M.; writing—review and editing, F.M., Z.W., Y.S., B.C., D.G. and D.W.; supervision, Z.W., Y.S., D.W. and S.T.; project administration, Z.W., Y.S. and D.W.; funding acquisition, D.W., Y.S. and Z.W. All authors have read and agreed to the published version of the manuscript.

Funding

This research was supported by the National Natural Science Foundation of China (No. 52070073 and 52200013), the Science & Technology Innovation Talents in Universities of Henan Province (No. 22HASTIT009), the Key Projects of Scientific and Technological Collaborative Innovation of Zhengzhou City (No. 21ZZXTCX05), and the Innovative Funds Plan of Henan University of Technology (No. 2021ZKCJ09).

Data Availability Statement

The data presented in this study are available on request from the corresponding author.

Conflicts of Interest

The authors declare no conflicts of interest.

References

  1. Ali, S.; Ijaz, H.; Ahmad, M.U.; Rukhma; Ullah, N.; Sarwar, A.; Khan, M.J.; Aziz, T.; Shami, A.; Al-Asmari, F. Photocatalytic Removal of Textile Wastewater-Originated Methylene Blue and Malachite Green Dyes Using Spent Black Tea Extract-Coated Silver Nanoparticles. Sci. Rep. 2025, 15, 1851. [Google Scholar] [CrossRef] [PubMed]
  2. Abbasi, A.; Ahmad, I.; Abd El-Gawad, H.H.; Alshahrani, W.A.; Alqarni, N.D.; El-Bahy, Z.M.; Ikram, S. Appraisal of the Adsorption Potential of Novel Modified Gellan Gum Nanocomposite for the Confiscation of Methylene Blue and Malachite Green. Int. J. Biol. Macromol. 2024, 259, 129221. [Google Scholar] [CrossRef]
  3. Sharma, J.; Sharma, S.; Soni, V. Toxicity of Malachite Green on Plants and Its Phytoremediation: A Review. Reg. Stud. Mar. Sci. 2023, 62, 102911. [Google Scholar] [CrossRef]
  4. Liu, X.; Han, B.; He, P.; Wang, Q.; Chen, Z. Modeling Competitive Biosorption for Methylene Blue Removal on Rape Straw Powders Using Response Surface Methodology in a Ternary Dye Aqueous Solution. Int. J. Phytoremediation 2024, 26, 1453–1464. [Google Scholar] [CrossRef] [PubMed]
  5. Alharby, N.F.; Almutairi, R.S.; Mohamed, N.A. Adsorption Behavior of Methylene Blue Dye by Novel CrossLinked O-CM-Chitosan Hydrogel in Aqueous Solution: Kinetics, Isotherm and Thermodynamics. Polymers 2021, 13, 3659. [Google Scholar] [CrossRef]
  6. Moradihamedani, P. Recent Advances in Dye Removal from Wastewater by Membrane Technology: A Review. Polym. Bull. 2022, 79, 2603–2631. [Google Scholar] [CrossRef]
  7. Elgarahy, A.M.; Elwakeel, K.Z.; Mohammad, S.H.; Elshoubaky, G.A. A Critical Review of Biosorption of Dyes, Heavy Metals and Metalloids from Wastewater as an Efficient and Green Process. Clean. Eng. Technol. 2021, 4, 100209. [Google Scholar] [CrossRef]
  8. Liu, Y.; Chen, Y.; Shi, Y.; Wan, D.; Chen, J.; Xiao, S. Adsorption of Toxic Dye Eosin Y from Aqueous Solution by Clay/Carbon Composite Derived from Spent Bleaching Earth. Water Environ. Res. 2021, 93, 159–169. [Google Scholar] [CrossRef]
  9. Muhamad Ng, S.N.; Idrus, S.; Ahsan, A.; Tuan Mohd Marzuki, T.N.; Mahat, S.B. Treatment of Wastewater from a Food and Beverage Industry Using Conventional Wastewater Treatment Integrated with Membrane Bioreactor System: A Pilot-Scale Case Study. Membranes 2021, 11, 456. [Google Scholar] [CrossRef]
  10. Ramutshatsha-Makhwedzha, D.; Munyengabe, A.; Mavhungu, M.L.; Mbaya, R.; Baloyi, J. Breakthrough Studies for the Sorption of Methylene Blue Dye from Wastewater Samples Using Activated Carbon Derived from Waste Banana Peels. Biomass Convers. Biorefinery 2024, 14, 21757–21769. [Google Scholar] [CrossRef]
  11. Guo, X.; Wu, Z.; Lu, Z.; Wang, Z.; Li, S.; Madhau, F.; Guo, T.; Huo, R. Preparation and Characterization of Chitosan-Modified Bentonite Hydrogels and Application for Tetracycline Adsorption from Aqueous Solution. Gels 2024, 10, 503. [Google Scholar] [CrossRef] [PubMed]
  12. Futalan, C.M.; Kan, C.C.; Dalida, M.L.; Hsien, K.J.; Pascua, C.; Wan, M.W. Comparative and Competitive Adsorption of Copper, Lead, and Nickel Using Chitosan Immobilized on Bentonite. Carbohydr. Polym. 2011, 83, 528–536. [Google Scholar] [CrossRef]
  13. Hasanpour, M.; Hatami, M. Application of Three Dimensional Porous Aerogels as Adsorbent for Removal of Heavy Metal Ions from Water/Wastewater: A Review Study. Adv. Colloid Interface Sci. 2020, 284, 102247. [Google Scholar] [CrossRef]
  14. Ramutshatsha-Makhwedzha, D.; Mavhungu, A.; Moropeng, M.L.; Mbaya, R. Activated Carbon Derived from Waste Orange and Lemon Peels for the Adsorption of Methyl Orange and Methylene Blue Dyes from Wastewater. Heliyon 2022, 8, e09930. [Google Scholar] [CrossRef] [PubMed]
  15. Salah Omer, A.; A.El Naeem, G.; Abd-Elhamid, A.I.; Farahat, O.O.M.; El-Bardan, A.A.; Soliman, H.M.A.; Nayl, A.A. Adsorption of Crystal Violet and Methylene Blue Dyes Using a Cellulose-Based Adsorbent from Sugercane Bagasse: Characterization, Kinetic and Isotherm Studies. J. Mater. Res. Technol. 2022, 19, 3241–3254. [Google Scholar] [CrossRef]
  16. Adeyemo, A.A.; Adeoye, I.O.; Bello, O.S. Adsorption of Dyes Using Different Types of Clay: A Review. Appl. Water Sci. 2017, 7, 543–568. [Google Scholar] [CrossRef]
  17. Amalina, F.; Razak, A.S.A.; Krishnan, S.; Zularisam, A.W.; Nasrullah, M. Dyes Removal from Textile Wastewater by Agricultural Waste as an Absorbent—A Review. Clean. Waste Syst. 2022, 3, 100051. [Google Scholar] [CrossRef]
  18. Abdelbasir, S.M.; Shehab, A.I.; Khalek, M.A.A. Spent Bleaching Earth; Recycling and Utilization Techniques: A Review. Resour. Conserv. Recycl. Adv. 2023, 17, 200124. [Google Scholar] [CrossRef]
  19. Tsai, W.; Chen, H.; Hsieh, M.; Sun, H.; Chien, S. Regeneration of Spent Bleaching Earth by Pyrolysis in a Rotary Furnace. J. Anal. Appl. Pyrolysis 2002, 63, 157–170. [Google Scholar] [CrossRef]
  20. Liu, Y.; Li, J.; Wu, L.; Shi, Y.; He, Q.; Chen, J.; Wan, D. Magnetic Spent Bleaching Earth Carbon (Mag-SBE@C) for Efficient Adsorption of Tetracycline Hydrochloride: Response Surface Methodology for Optimization and Mechanism of Action. Sci. Total Environ. 2020, 722, 137817. [Google Scholar] [CrossRef]
  21. Wan, D.; Wu, L.; Liu, Y.; Chen, J.; Zhao, H.; Xiao, S. Enhanced Adsorption of Aqueous Tetracycline Hydrochloride on Renewable Porous Clay-Carbon Adsorbent Derived from Spent Bleaching Earth via Pyrolysis. Langmuir 2019, 35, 3925–3936. [Google Scholar] [CrossRef]
  22. Rasdei, S.S.; Yatim, N.I.; Ali, N.; Kasan, N.A. Optimization of the Direct Synthesis of Hydroxyapatite from Aquaculture Wastewater Using Response Surface Methodology. AQUA—Water Infrastruct. Ecosyst. Soc. 2024, 73, 1789–1800. [Google Scholar] [CrossRef]
  23. Mitadar, S.P.; Adi, V.K. Adsorption and Statistical Analysis of Textile Effluent Contaminated with Congo Red On Orange Peel. Int. J. Innov. Technol. Explor. Eng. 2019, 8, 2607–2615. [Google Scholar] [CrossRef]
  24. Jawad, A.H.; Mohd Firdaus Hum, N.N.; Abdulhameed, A.S.; Mohd Ishak, M.A. Mesoporous Activated Carbon from Grass Waste via H3PO4-Activation for Methylene Blue Dye Removal: Modelling, Optimisation, and Mechanism Study. Int. J. Environ. Anal. Chem. 2022, 102, 6061–6077. [Google Scholar] [CrossRef]
  25. Box, G.E.P.; Behnken, D.W. Some New Three Level Designs for the Study of Quantitative Variables. Technometrics 1960, 2, 455–475. [Google Scholar] [CrossRef]
  26. Peng, L.; Gao, X.; Wang, L.; Zhu, A.; Cai, X.; Li, P.; Li, W. Design of Experiment Techniques for the Optimization of Chromatographic Analysis Conditions: A Review. Electrophoresis 2022, 43, 1882–1898. [Google Scholar] [CrossRef] [PubMed]
  27. Madhau, F.; Wu, Z.; Shi, Y.; Wan, D.; Tichapondwa, S.; Wang, Y.; Wang, J.; Wan, H. Adsorption of Methylene Blue onto Clay/Carbon Composite: Kinetics and Isotherms Study. Water Pract. Technol. 2024, 19, 4267–4281. [Google Scholar] [CrossRef]
  28. Tripathi, P.; Srivastava, V.C.; Kumar, A. Optimization of an Azo Dye Batch Adsorption Parameters Using Box-Behnken Design. Desalination 2009, 249, 1273–1279. [Google Scholar] [CrossRef]
  29. Ahmed, F.S.; AbdulRazak, A.A.; Alsaffar, M.A. Modelling and Optimization of Methylene Blue Adsorption from Wastewater Utilizing Magnetic Marble Dust Adsorbent: A Response Surface Methodology Approach. Mater. Today Proc. 2022, 60, 1676–1688. [Google Scholar] [CrossRef]
  30. Zhao, W.; Hao, C.; Guo, Y.; Shao, W.; Tian, Y.; Zhao, P. Optimization of Adsorption Conditions Using Response Surface Methodology for Tetracycline Removal by MnFe2O4/Multi-Wall Carbon Nanotubes. Water 2023, 15, 2392. [Google Scholar] [CrossRef]
  31. Hock, P.E.; Faizal, A.N.M.; Sirajo, L.; Zaini, M.A.A. Insight into Kinetics, Equilibrium, and Thermodynamics of Malachite Green Adsorption onto Banana Peel Adsorbents. Biomass Convers. Biorefinery 2024, 14, 17405–17421. [Google Scholar] [CrossRef]
  32. Sanou, I.; Bamogo, H.; Sanou, A.; Ouedraogo, M.; Saadi, L.; Waqif, M.; Millogo, Y. Adsorption of Methylene Blue in Aqueous Medium by Activated Carbon from Peanut Shells. Chem. Africa 2024, 7, 2777–2794. [Google Scholar] [CrossRef]
  33. Nandoost, A.; Bahramifar, N.; Moghadamnia, A.A.; Kazemi, S. Adsorption of Malachite Green (MG) as a Cationic Dye on Amberlyst 15, an Ion-Exchange Resin. J. Environ. Public Health 2022, 2022, 4593835. [Google Scholar] [CrossRef]
  34. Mohammad, A.-T.; Abdulhameed, A.S.; Jawad, A.H. Box-Behnken Design to Optimize the Synthesis of New Crosslinked Chitosan-Glyoxal/TiO2 Nanocomposite: Methyl Orange Adsorption and Mechanism Studies. Int. J. Biol. Macromol. 2019, 129, 98–109. [Google Scholar] [CrossRef]
  35. Mittal, A. Adsorption Kinetics of Removal of a Toxic Dye, Malachite Green, from Wastewater by Using Hen Feathers. J. Hazard. Mater. 2006, 133, 196–202. [Google Scholar] [CrossRef]
  36. Mohammed, M.A.; Shitu, A.; Ibrahim, A. Removal of Methylene Blue Using Low Cost Adsorbent: A Review. Res. J. Chem. Sci. 2014, 4, 91–102. [Google Scholar]
  37. Ibrahim, E.S.; Moustafa, H.; El-Molla, S.A.; Halim, S.A.; Ibrahim, S.M. Integrated Experimental and Theoretical Insights for Malachite Green Dye Adsorption from Wastewater Using Low Cost Adsorbent. Water Sci. Technol. 2021, 84, 3833–3858. [Google Scholar] [CrossRef] [PubMed]
  38. Moustafa, M.T. Preparation and Characterization of Low-Cost Adsorbents for the Efficient Removal of Malachite Green Using Response Surface Modeling and Reusability Studies. Sci. Rep. 2023, 13, 4493. [Google Scholar] [CrossRef]
  39. Mana, M.; Ouali, M.S.; Lindheimer, M.; Menorval, L.C. de Removal of Lead from Aqueous Solutions with a Treated Spent Bleaching Earth. J. Hazard. Mater. 2008, 159, 358–364. [Google Scholar] [CrossRef] [PubMed]
  40. Inam, M.A.; Khan, R.; Yeom, I.T.; Buller, A.S.; Akram, M.; Inam, M.W. Optimization of Antimony Removal by Coagulation-Flocculation-Sedimentation Process Using Response Surface Methodology. Processes 2021, 9, 117. [Google Scholar] [CrossRef]
  41. Boumya, W.; Khnifira, M.; Machrouhi, A.; Abdennouri, M.; Achak, M.; Qourzal, S.; Tounsadi, H.; Barka, N. Box–Behnken Design for Understanding of Adsorption Behaviors of Cationic and Anionic Dyes by Activated Carbon. Desalin. WATER Treat. 2021, 212, 204–211. [Google Scholar] [CrossRef]
  42. Bonyadi, Z.; Nasoudari, E.; Ameri, M.; Ghavami, V.; Shams, M.; Sillanpää, M. Biosorption of Malachite Green Dye over Spirulina Platensis Mass: Process Modeling, Factors Optimization, Kinetic, and Isotherm Studies. Appl. Water Sci. 2022, 12, 167. [Google Scholar] [CrossRef]
  43. Igder, A.; Fazlavi, A.; Allahkarami, E.; Dehghanipour, A. Optimization of Ni(II) & Co(II) Removal from Wastewater and Statistical Studies on the Results of Experimental Designs. Geosystem Eng. 2019, 22, 91–100. [Google Scholar] [CrossRef]
  44. Zekavat, S.R.; Raouf, F.; Talesh, S.S.A. Simultaneous Adsorption of Cu2+ and Cr (VI) Using HDTMA-Modified Zeolite: Isotherm, Kinetic, Mechanism, and Thermodynamic Studies. Water Sci. Technol. 2020, 82, 1808–1824. [Google Scholar] [CrossRef]
  45. Wannahari, R.; Mohamad, M.; Kamal, A.A.A.; Ai, J.Y.S. Removal of Malachite Green Dye by Peanut (Arachis Hypogaea) Shell Biochar: Optimisation Using Response Surface Methodology. Int. J. Sci. Technol. Res. 2019, 8, 2564–2569. [Google Scholar]
  46. Khelifi, O.; Affoune, A.M.; Nacef, M.; Chelaghmia, M.L.; Laksaci, H. Response Surface Modeling and Optimization of Ni(II) and Cu(II) Ions Competitive Adsorption Capacity by Sewage Sludge Activated Carbon. Arab. J. Sci. Eng. 2022, 47, 5797–5809. [Google Scholar] [CrossRef]
  47. Ba Mohammed, B.; Hsini, A.; Abdellaoui, Y.; Abou Oualid, H.; Laabd, M.; El Ouardi, M.; Ait Addi, A.; Yamni, K.; Tijani, N. Fe-ZSM-5 Zeolite for Efficient Removal of Basic Fuchsin Dye from Aqueous Solutions: Synthesis, Characterization and Adsorption Process Optimization Using BBD-RSM Modeling. J. Environ. Chem. Eng. 2020, 8, 104419. [Google Scholar] [CrossRef]
  48. Biradar, V.R.; Charde, M.S.; Chakole, R.D. QBD approach based development of validated analytical method for estimation of clarithromycin by RP-HPLC. J. Adv. Sci. Res. 2023, 14, 15–24. [Google Scholar] [CrossRef]
  49. Inam, M.A.; Khan, R.; Lee, K.H.; Babar, Z.B.; Yeom, I.T. Competitive Removal of Antimony and Humic Acid by Ferric Chloride: Optimization of Coagulation Process Using Response Surface Methodology. Water 2023, 15, 1676. [Google Scholar] [CrossRef]
  50. Jaafari, J.; Yaghmaeian, K. Response Surface Methodological Approach for Optimizing Heavy Metal Biosorption by the Blue-Green Alga Chroococcus Disperses. Desalin. Water Treat. 2019, 142, 225–234. [Google Scholar] [CrossRef]
  51. Bulut, Y.; Aydın, H. A Kinetics and Thermodynamics Study of Methylene Blue Adsorption on Wheat Shells. Desalination 2006, 194, 259–267. [Google Scholar] [CrossRef]
  52. Chemingui, H.; Rezma, S.; Lafi, R.; Alhalili, Z.; Missaoui, T.; Harbi, I.; Smiri, M.; Hafiane, A. Investigation of Methylene Blue Adsorption from Aqueous Solution onto ZnO Nanoparticles: Equilibrium and Box-Behnken Optimisation Design. Int. J. Environ. Anal. Chem. 2023, 103, 2716–2741. [Google Scholar] [CrossRef]
  53. Minale, M.; Gu, Z.; Guadie, A.; Li, Y.; Wang, Y.; Meng, Y.; Wang, X. Hydrous Manganese Dioxide Modified Poly(Sodium Acrylate) Hydrogel Composite as a Novel Adsorbent for Enhanced Removal of Tetracycline and Lead from Water. Chemosphere 2021, 272, 129902. [Google Scholar] [CrossRef] [PubMed]
  54. Beakou, B.H.; El Hassani, K.; Houssaini, M.A.; Belbahloul, M.; Oukani, E.; Anouar, A. A Novel Biochar from Manihot Esculenta Crantz Waste: Application for the Removal of Malachite Green from Wastewater and Optimization of the Adsorption Process. Water Sci. Technol. 2017, 76, 1447–1456. [Google Scholar] [CrossRef]
  55. Gürses, A.; Doǧar, Ç.; Karaca, S.; Açikyildiz, M.; Bayrak, R. Production of Granular Activated Carbon from Waste Rosa Canina Sp. Seeds and Its Adsorption Characteristics for Dye. J. Hazard. Mater. 2006, 131, 254–259. [Google Scholar] [CrossRef] [PubMed]
  56. Al-Asadi, S.T.; Al-Qaim, F.F.; Al-Saedi, H.F.S.; Deyab, I.F.; Kamyab, H.; Chelliapan, S. Adsorption of Methylene Blue Dye from Aqueous Solution Using Low-Cost Adsorbent: Kinetic, Isotherm Adsorption, and Thermodynamic Studies. Environ. Monit. Assess. 2023, 195, 676. [Google Scholar] [CrossRef]
  57. Gebre Meskel, A.; Kwikima, M.M.; Meshesha, B.T.; Habtu, N.G.; Naik, S.V.C.S.; Vellanki, B.P. Malachite Green and Methylene Blue Dye Removal Using Modified Bagasse Fly Ash: Adsorption Optimization Studies. Environ. Chall. 2024, 14, 100829. [Google Scholar] [CrossRef]
  58. Gul, S.; Afsar, S.; Shah, T.A.; Gul, H.; Aziz, T.; Zahra, N.; Alhomrani, M.; Alsanie, W.F.; Alamri, A.S. White Clover Components as an Effective Biosorbent for the Elimination of Toxic Malachite Green from Wastewater. Biomass Convers. Biorefinery 2025. [Google Scholar] [CrossRef]
Figure 1. SEM images: (a) SBE and (b) SBE/C (500 °C). The corresponding digital photographs are inserted in (a) and (b).
Processes 13 01217 g001
Figure 2. (a) FTIR spectra of SBE and SBE/C (500 °C) and (b) pHpzc plots of SBE/C (500 °C).
Processes 13 01217 g002
Figure 3. Actual and predicted plots of (a) MB and (b) MG dye removal capacities onto SBE/C (500 °C).
Processes 13 01217 g003
Figure 4. Interaction effect of pH and contact time (min) on (a) MB and (b) MG adsorption capacities by SBE/C (500 °C).
Processes 13 01217 g004
Figure 5. Interaction effect of contact time (min) and dosage (g/L) on (a) MB and (b) MG adsorption capacity by SBE/C (500 °C).
Processes 13 01217 g005
Figure 6. Interaction effect of pH and dosage (g/L) on (a) MB and (b) MG adsorption capacity by SBE/C (500 °C).
Processes 13 01217 g006
Table 1. Real values and their respective coded values.
Real Values Coded Values
VariableLowCenterHighLowCenterHigh
pH (A)46.59−10+1
Adsorbent dosage (g/L) (B)0.60.91.2−10+1
Contact time (min) (C)120210300−10+1
Table 2. Experimental response matrix and response values.
RunpH (A)Contact Time, min (B)Adsorbent Dosage (g/L) (C)MB Adsorption Capacity (mg/g)MB Adsorption Capacity (mg/g)MG Adsorption Capacity (mg/g)MG Adsorption Capacity (mg/g)
ExperimentalPredictedExperimentalPredicted
193000.919.6819.5919.4619.49
292100.622.6822.9524.0523.92
36.52100.914.4214.2313.3013.30
491200.915.5215.4615.3115.91
542101.28.438.167.617.73
642100.614.5914.719.219.71
76.52100.914.0814.2313.3013.30
86.52100.914.4914.2313.3013.30
96.51201.215.4615.6414.7214.63
1043000.910.1810.247.186.58
116.51200.620.5520.3320.2119.74
126.52100.914.0714.2313.3013.30
136.53001.215.8816.1015.0015.48
146.52100.914.0814.2313.3013.30
156.53000.625.3925.2121.4021.49
1692101.215.8315.7015.2914.79
1741200.98.939.037.597.56
Table 3. Model summary statistics for MB and MG adsorption capacities.
SourceSDR2Adj-R2Pred-R2Comment
MB
Linear2.62000.72460.66100.4499
2FI2.86000.74670.5947−0.1917
Quadratic0.27690.99830.99620.9811Suggested
Cubic0.20750.99950.9979 Aliased
MG
Linear2.63000.76440.71000.5201
2FI2.68000.81220.69950.0901
Quadratic0.49660.99550.98960.9275Suggested
Cubic0.00001.00001.0000 Aliased
Table 4. ANOVA for response surface quadratic model (MB adsorption capacity (mg/g)).
SourceSum of SquaresdfMean SquareF-Valuep-ValueRemarks
Model322.57935.84467.56<0.0001Significant
A-pH124.671124.671626.30<0.0001Significant
B-contact time14.26114.26185.98<0.0001Significant
C-dosage95.19195.191241.81<0.0001Significant
AB2.1312.1327.760.0012Significant
AC0.122110.12211.590.2473Not significant
BC4.8914.8963.81<0.0001Significant
A222.17122.17289.15<0.0001Significant
B211.41111.41148.85<0.0001Significant
C250.08150.08653.27<0.0001Significant
Residual0.536670.0767
Table 5. ANOVA for response surface quadratic model (MG adsorption capacity (mg/g)).
SourceSum of SquaresdfMean SquareF-Valuep-ValueRemarks
Model379.35942.15170.94<0.0001Significant
A-pH226.091226.09916.88<0.0001Significant
B-contact time3.3913.3913.740.0076Significant
C-dosage61.82161.82250.71<0.0001Significant
AB5.2015.2021.070.0025Significant
AC12.80112.8051.920.0002Significant
BC0.204210.20420.82830.3930Not Significant
A223.37123.3794.76<0.0001Significant
B28.7218.7235.360.0006Significant
C240.27140.27163.32<0.0001Significant
Residual1.7370.2466
Table 6. Optimal conditions and model validation.
Co (MB and MG)T °CABC qe (mg/g)
Pre (MB)Exp (MB)Pre (MG)Exp (MG)
204593000.627.76925.3927.37924.05
Disclaimer/Publisher’s Note: The statements, opinions and data contained in all publications are solely those of the individual author(s) and contributor(s) and not of MDPI and/or the editor(s). MDPI and/or the editor(s) disclaim responsibility for any injury to people or property resulting from any ideas, methods, instructions or products referred to in the content.

