Article

The Impact of Particle Size on the Electrical Resistivity of Burden in the Upper Zone of an EAF During Metallurgical-Grade Silicon Smelting

1
Faculty of Metallurgical and Energy Engineering, State Key Laboratory of Complex Nonferrous Metal Resources Clean Utilization, Kunming University of Science and Technology, Kunming 650093, China
2
Silicon Industry and Engineering Research Center of Yunnan Province, Silicon Material Industry Research Institution (Innovation Center) of Yunnan Province, Kunming University of Science and Technology, Kunming 650093, China
3
School of Engineering, Yunnan University, Kunming 650500, China
*
Authors to whom correspondence should be addressed.
Processes 2025, 13(4), 1227; https://doi.org/10.3390/pr13041227
Submission received: 19 February 2025 / Revised: 17 March 2025 / Accepted: 19 March 2025 / Published: 17 April 2025
(This article belongs to the Section Manufacturing Processes and Systems)

Abstract

:
As the energy consumption problem of an electric arc furnace (EAF) is becoming more and more prominent, improving the furnace charge resistivity becomes the key to reducing the energy consumption of metallurgical-grade silicon smelting. This study systematically examines the impact mechanism of the particle size of raw materials on the electrical resistivity of metallurgical-grade silicon furnace burden. The results show that in the range of 700–1300 °C, the size of the furnace charge consisting of coal and silica ore decreases from 6–9 mm to 0.25–0.3 mm, and the resistivity of the furnace charge increases from 0.9–1366.7 Ω·m to 2.5–2060.5 Ω·m. The effects of particle size on furnace charge resistivity are clarified by investigating how particle size influences the resistivity of coal and silica ore, along with an analysis performed within the context of furnace charge resistivity modeling. Research shows that particle size plays a crucial role in affecting the resistivity of the furnace charge. This impact is largely due to alterations in the graphitization-like degree of coal and changes in the contact resistance between particles. Together, these factors significantly influence the overall resistivity of the furnace charge. During this process, the particle size increased dramatically from 0.25–0.3 mm to 6–9 mm. The coal ID/IG ratio (degree of graphitization-like) was reduced from 1.36 to 1.32. The resistivity of the coal decreased by 29%, while the contact resistance of the charge was reduced by a factor of 2. The resistivity of the charge itself was also reduced by 64%. This transformation highlights the significant changes in the coal’s properties aimed at optimizing operational efficiency. This study is of great significance in clarifying the scheme of regulating furnace charge resistivity through particle size optimization, which is an important guide for energy saving and carbon reduction in the industrial silicon smelting process.

1. Introduction

Metallurgical-grade silicon is produced and prepared from silica and carbonaceous reductants in an electric arc furnace (EAF) [1]. Metallurgical-grade silicon serves as the primary raw material for numerous industries, including silicone production, photovoltaics, and silicon alloy manufacturing. Its versatile applications span across aerospace, automotive production, healthcare, construction, and various other sectors [2,3]. Electric arc furnaces (EAFs) have always had a problem with high energy consumption, which is becoming more and more apparent with the increase in industrial silicon production capacity. In order to solve the problem of high energy consumption of electric arc furnaces (EAFs), many research studies and efforts have been focused on reducing the energy consumption of electric arc furnaces (EAFs) during the production process [4,5,6]. The main heat source in metallurgical-grade silicon industrial smelting is the heat generated by the electric arc. The main role of the 700–1300 °C furnace charge layer is preheating and insulation, and the current it generates is the lateral branch current, and the main current of the electrode phase is connected in parallel. In order to make the arc exothermic concentration in the 700–1300 °C furnace charge layer of the lower layer/crucible area (also known as the main reaction area), reducing the furnace charge layer of the branch current is the most effective way. By concentrating more of the heat generated by the arc on the charge reaction, the energy consumption in silicon production is reduced and the energy efficiency is increased. Increasing the resistivity of the charge in the low-temperature range of 700–1300 °C is therefore the most effective strategy for improving energy efficiency. Meantime, this method is not only superior to other methods for reducing energy consumption; it is also the first choice for optimizing furnace performance [7]. It has also been noted that increasing the resistivity of the charge also has a greater effect on the silicon yield of the arc furnace [8]. Increasing the resistivity of the low-temperature charge zone not only increases the current in the crucible zone and improves the energy efficiency of the electric arc furnace (EAF) but also raises the electrodes and increases the extent of the crucible zone, which, in turn, increases the output efficiency of the silica water, thus resulting in a great improvement in the smelting energy consumption. Consequently, addressing the issue of elevated energy consumption in electric arc furnaces necessitates a comprehensive investigation of the resistivity of the furnace charge, with particular emphasis on the resistivity of the high-temperature furnace charge. The magnitude of furnace charge resistivity is determined not only by the material’s inherent conductivity but also significantly influenced by macrostructural factors. These factors include inter-particle contact properties, porosity, and gas permeability. Of these factors, particle size is a pivotal factor directly impacting the furnace charge structure and assumes a particularly substantial function in resistivity.
Most research endeavors hitherto have predominantly concentrated on exploring the impact of particle size on resistivity in metallic substances [9,10], with limited attention given to the influence of particle size on resistivity in carbon materials. Surup et al. [11] studied the resistivity of coal, semi-coke, and charcoal at high temperatures using homemade equipment, and the resistivity of different reducing agents at different particle sizes showed that charcoal was the best reducing agent. Eidem et al. [12] conducted a study to measure the resistivity and contact resistance of graphite and petroleum coke across two particle sizes within a temperature range of 0–1000 °C. Their findings revealed that the contact resistance was approximately 10 times greater than the resistance of the raw materials. Importantly, the particle size significantly influenced the contact resistance, which in turn affected the overall resistivity. Only a few studies on high-temperature resistivity focus on the high-temperature resistivity of carbon materials, and research on the high-temperature resistivity of furnace charge in the industrial silicon field is even more lacking. The majority of research endeavors are concentrated on elucidating the influence of particle size on the physical and chemical characteristics of the silicon furnace charge employed in industrial production. In a study by Xu et al. [13], researchers explored the physical and chemical properties of biomass carbon pellets across various particle sizes. The findings revealed that biomass carbon pellets with a particle size smaller than 100 μm exhibit superior properties compared to traditional charcoal. These particular pellets meet the stringent requirements necessary for industrial silicon smelting. Zobnin et al. [14] investigated the effect of particle size on the thermal stability of quartz in the furnace and obtained the best values for the average size of aktas (85–95 mm) and Sarykul (30–40 mm) quartz flakes, which had the best thermal stability. Research on the relationship between high-temperature resistivity and the particle size of carbon materials has historically centered on the effect of physical contact. However, this approach has overlooked the impact of variations in the physicochemical properties of different particle sizes on high-temperature resistivity. The intricate structure of carbon materials renders them susceptible to physicochemical alterations under elevated temperatures, which are contingent on their size [15]. A comprehensive understanding of these physicochemical transitions is pivotal for elucidating the electrical resistance behavior of carbon materials at elevated temperatures. Consequently, the impact of alterations in the physicochemical attributes of carbon materials on resistivity must be duly acknowledged. Meanwhile, the physicochemical properties of silica with different grain sizes at high temperatures are different, and the electron conduction mechanism will be changed [16]. Hence, alterations in the physical characteristics of the raw material resulting from particle dimensions may exert a significant impact on furnace charge electrical resistivity.
This study thoroughly examines how two different grain sizes, 0.25–0.3 mm and 6–9 mm, impact the resistivity of furnace charge at temperatures ranging from 700 °C to 1300 °C. Analyzing the mechanism of raw material particle size on the resistivity of the furnace charge from the point of view of the transformation of physicochemical properties and physical contacts. This analysis offers insights into the selection of raw materials with optimal particle sizes for arc furnaces and establishes a theoretical framework for the quantification of resistivity in industrial silicon smelting processes.

2. Experiment

2.1. Materials

The primary raw materials employed in this study are coal and silica, with the selected coal being anthracite, a material that is widely utilized in metallurgical-grade silicon smelting processes. The industrial evaluation of coal is illustrated in Table 1, while the quantification of its elemental composition is achieved through the implementation of X-ray fluorescence (XRF) analysis. The composition of silica ore is elucidated in Table 2. The coal undergoes a crushing and screening process that utilizes vibrating mills, electric vibrating screens, and standard sieves. The resultant coal particles are then sorted into two size classes: 6–9 mm and 0.25–0.3 mm.

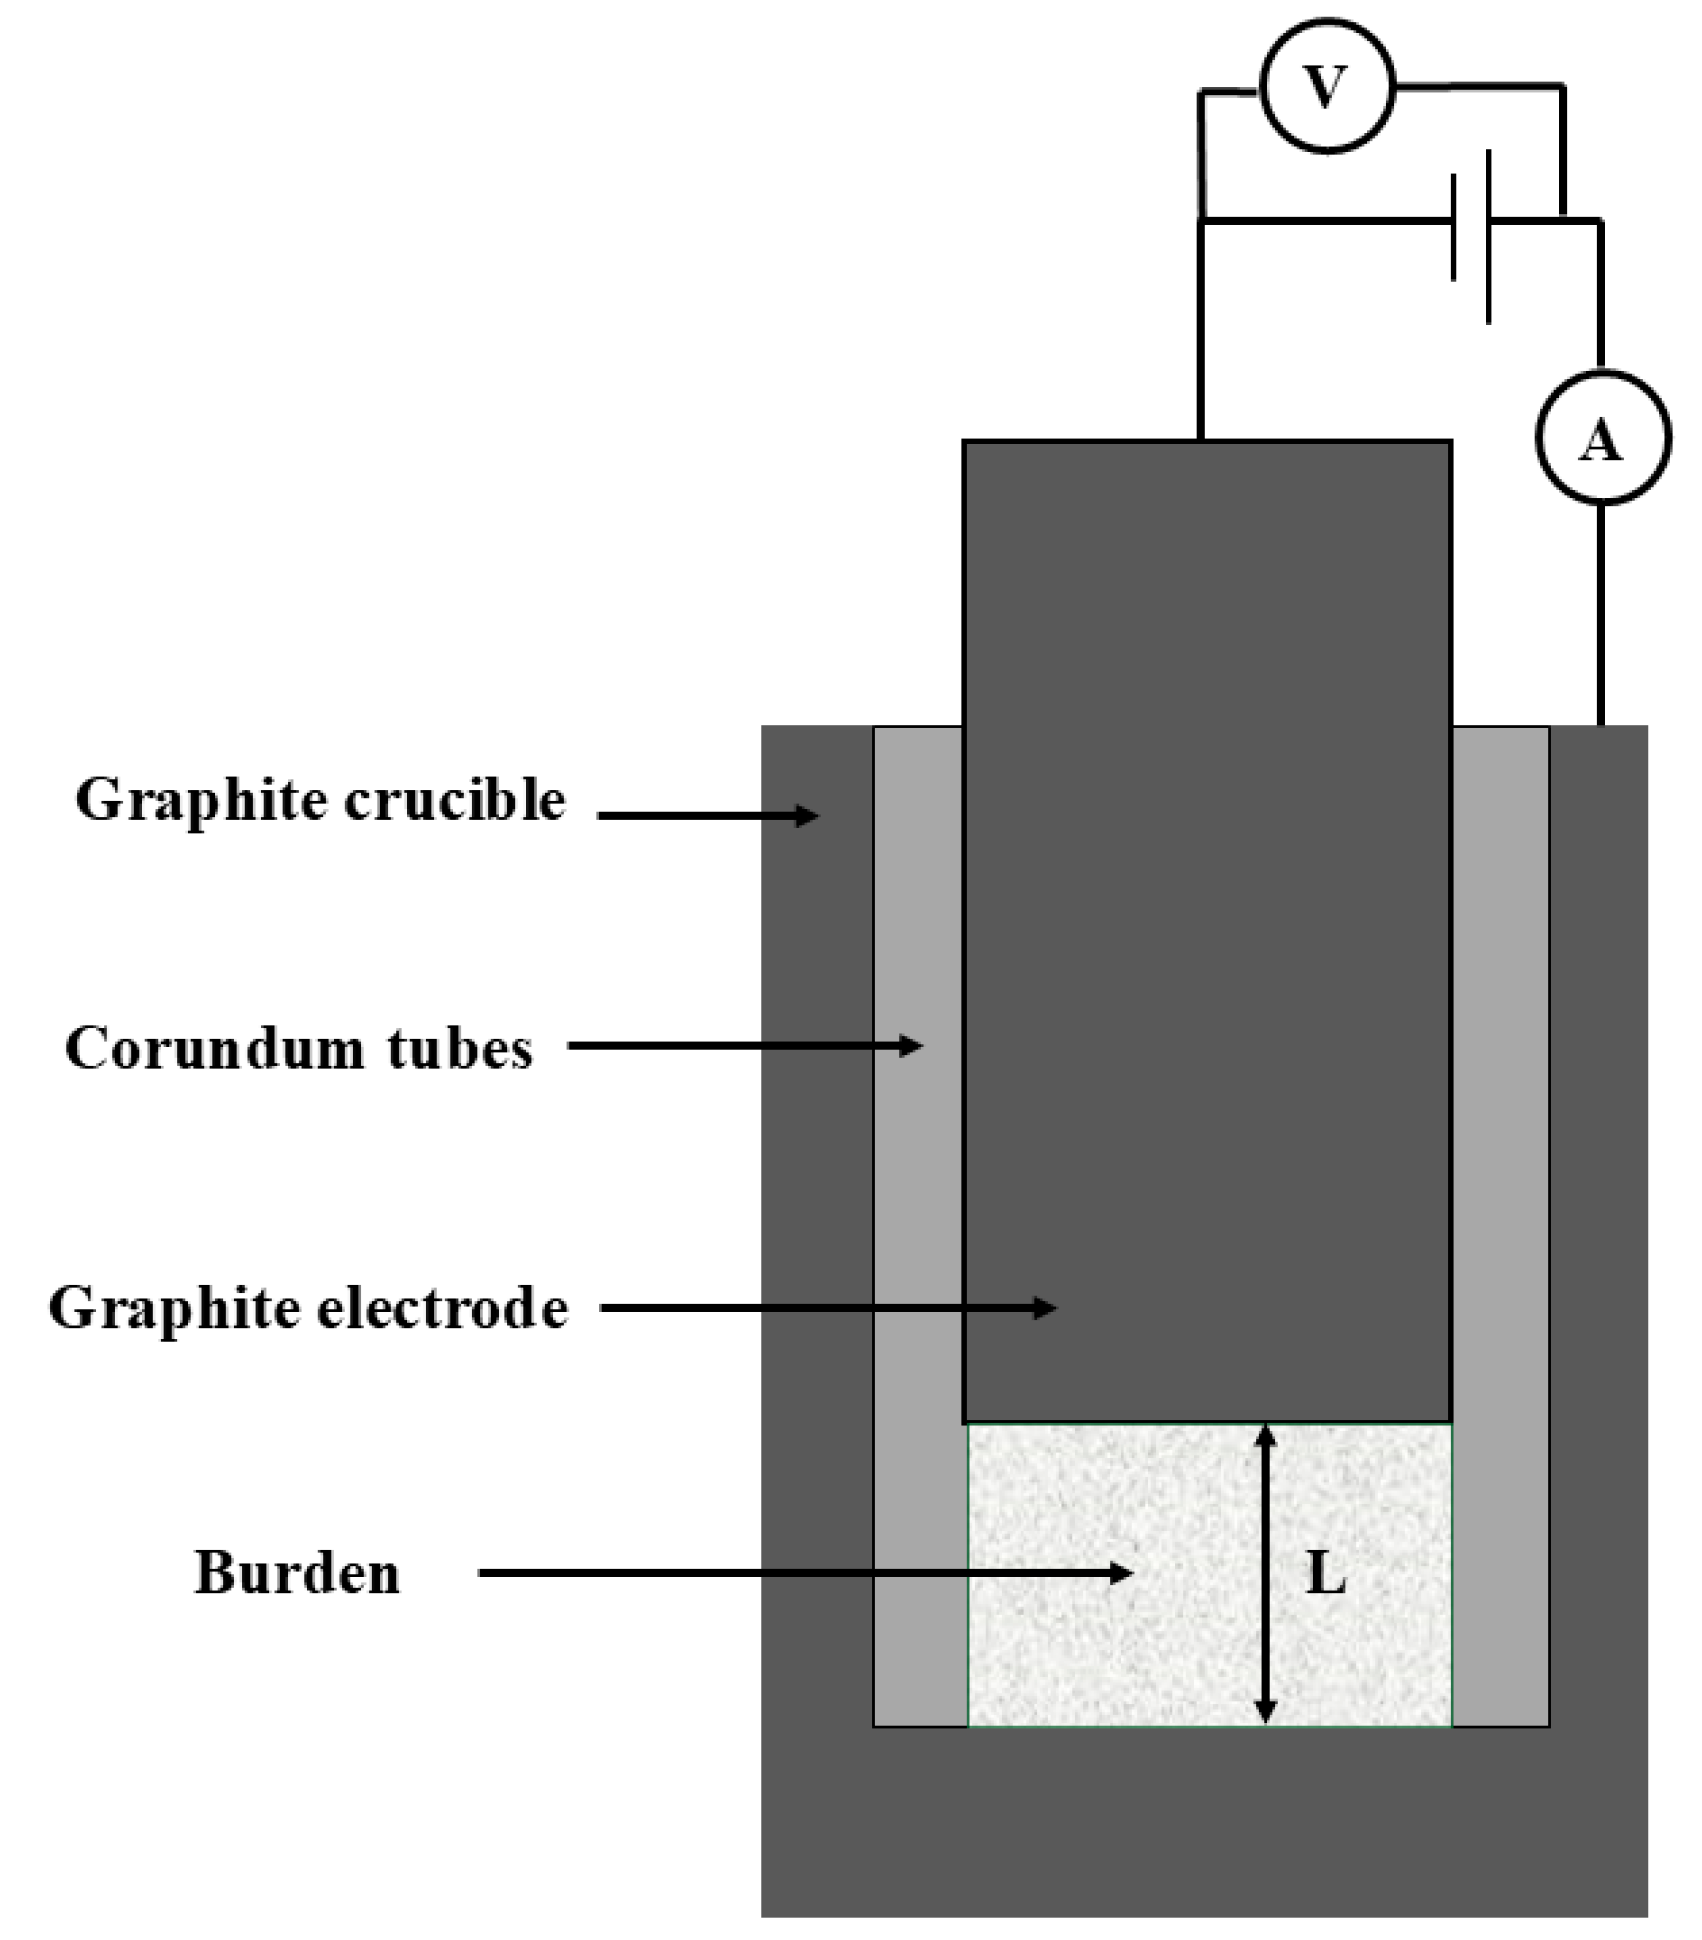
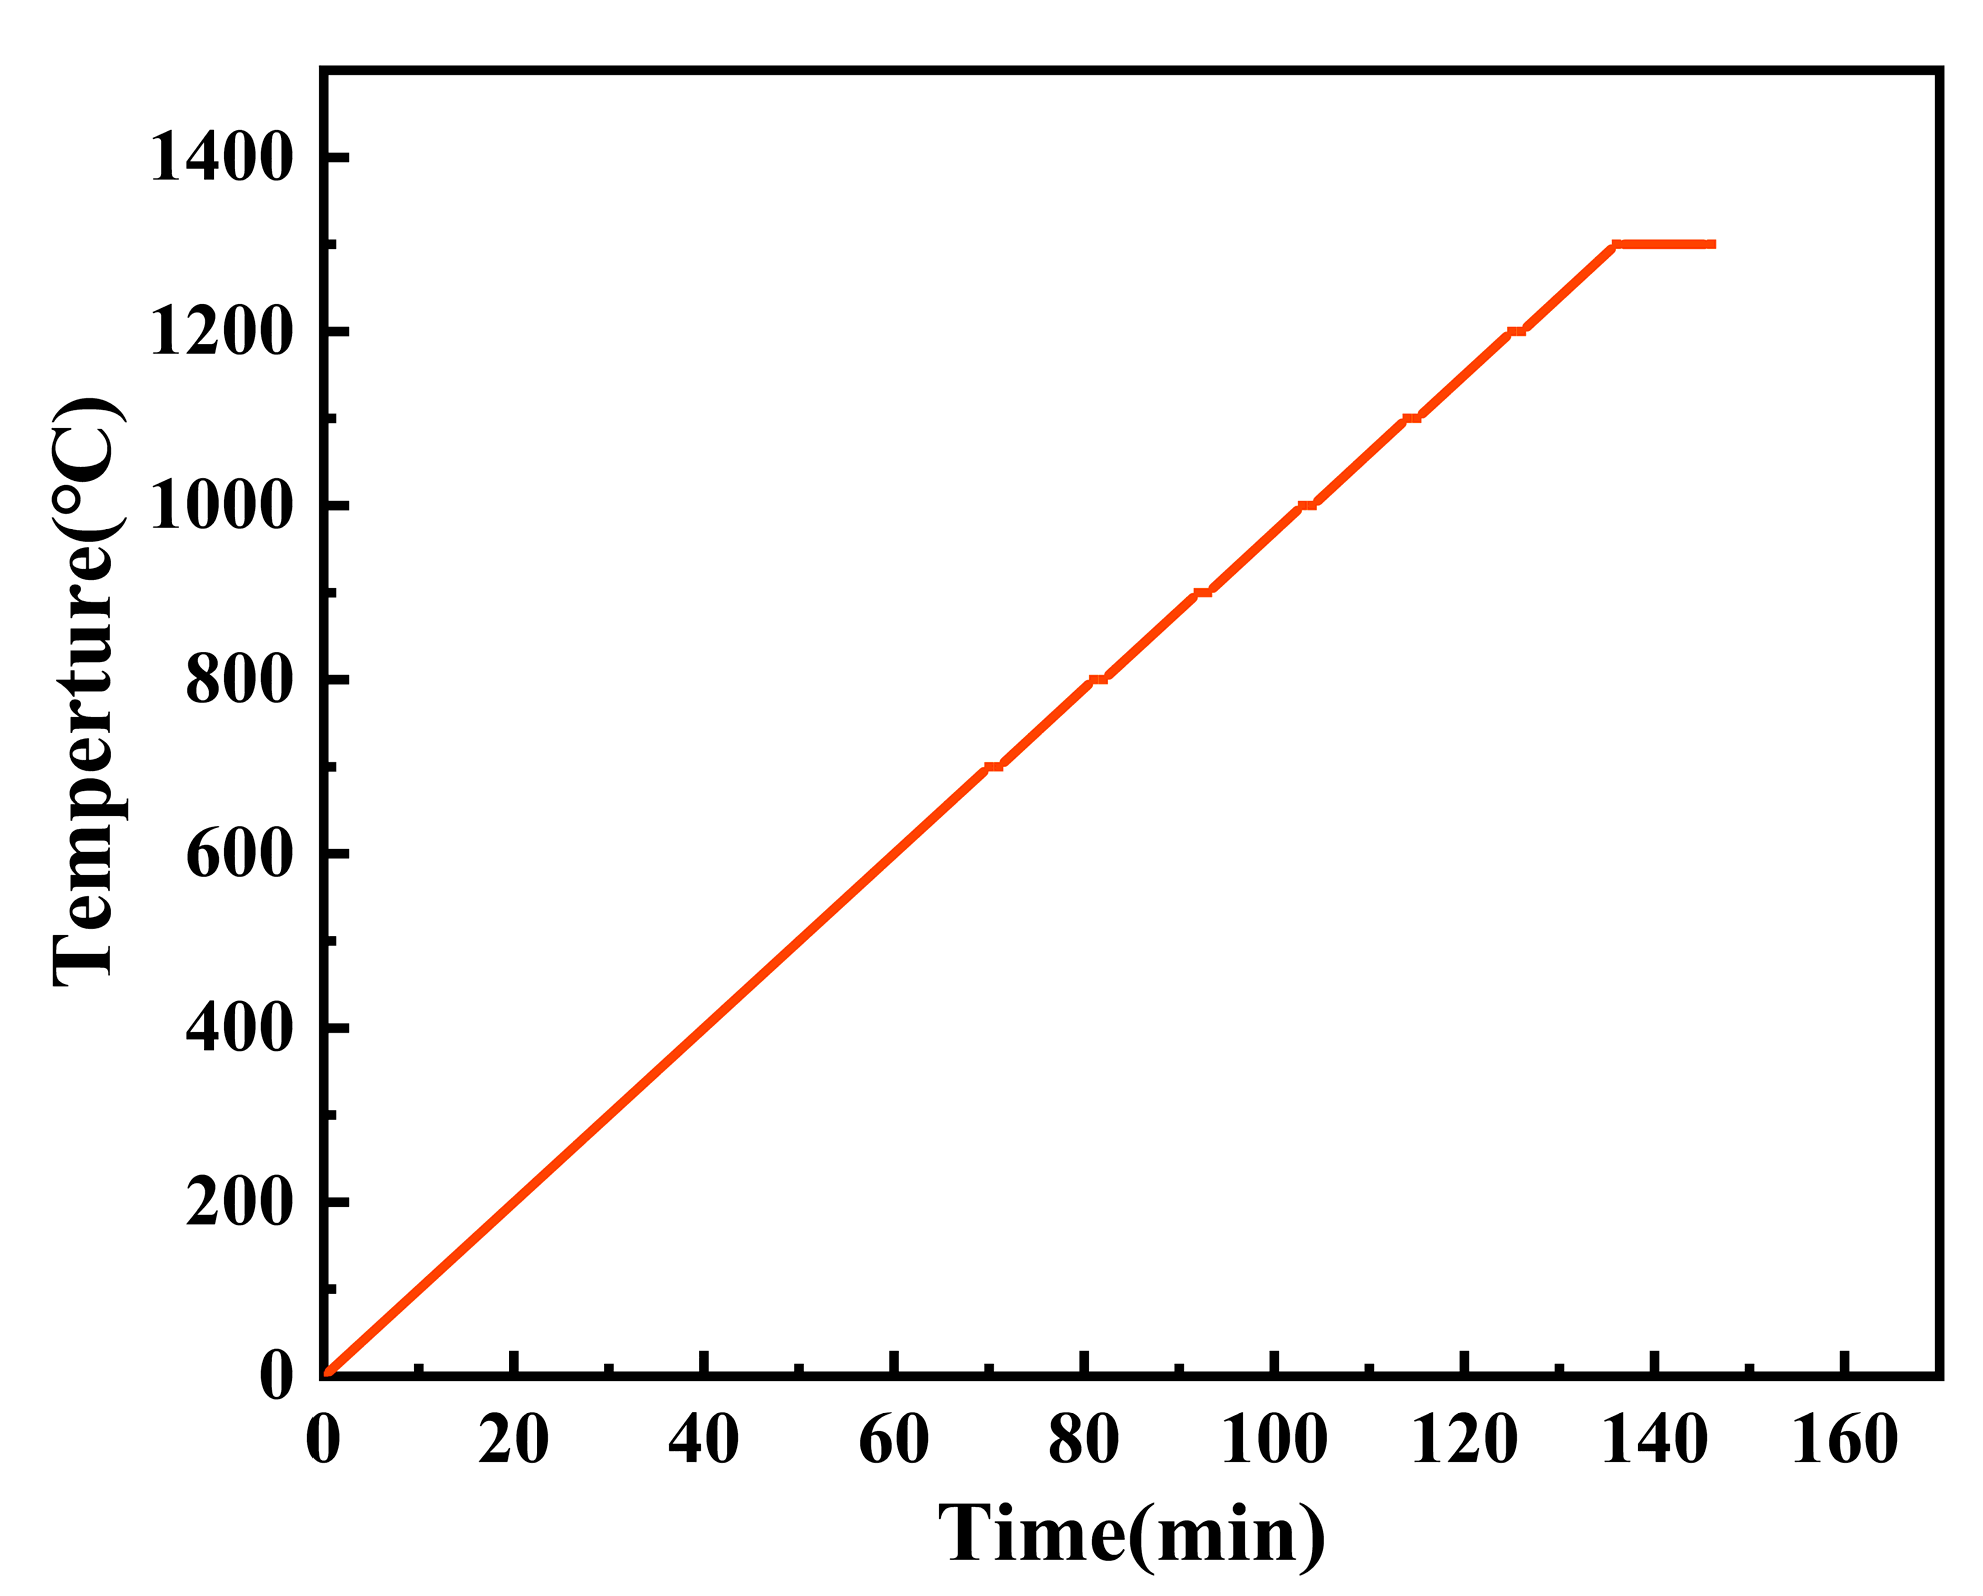
2.2. Experimental Methods

The experimental procedure, as illustrated in Figure 1, entails the incorporation of a corundum tube within the graphite crucible. The graphite electrode was subsequently positioned onto the specimen, and a force of 10 N was applied for a duration of ten minutes to achieve thorough contact. Graphite electrode and graphite crucible with external molybdenum wire were used. Key external components, including power supply, ammeter, and voltmeter, are integrated for accurate data acquisition at specified temperatures. The resistivity value is determined through the utilization of Equation (1):
σ = V L I A = R L A
where σ is the resistivity, V is the measured voltage, A is the cross-sectional area, I is the measured current, L is the height of the furnace charge stack, and R is the total resistance of the furnace charge.
Silica ore and coal were thoroughly blended in accordance with a 1:1 mass ratio. Subsequently, 4 g of the resulting mixture was meticulously weighed and loaded into the instrumentation depicted in Figure 1, which was then positioned within a muffle furnace (muffle furnace, GF17Q, China). The curved line in Figure 2 illustrates the heating profile of the specimen. The specimen was initially heated at a rate of 10 °C per minute for 70 min until reaching 700 °C. This was followed by a one-minute stabilization period to ensure the stability of the resistivity test. During this process, precise voltage and current measurements were recorded to assess the electrical properties of the material. The specimen is then subjected to incremental heating of 10 °C per minute for a duration of 10 min, culminating in an increase of 100 °C. This is followed by a one-minute pause at 100 °C intervals, during which the voltage and current are meticulously recorded. Subsequently, the specimen is heated to 1300 °C and maintained at this temperature for 10 min, during which the voltage and current are recorded. Upon completion of the heating process, the furnace is deactivated, and the specimen is permitted to cool gradually. Subsequent to the completion of the cooling phase, the height L of the specimen is measured at ambient temperature.

2.3. Contact Resistance

When particles in the furnace charge make contact, each point of contact between particles is typically viewed as a singular point, with each particle assumed to be an ideal model of uniform size and resistivity [17,18,19]. The contact resistance aligns with the formula detailed in Equation (2) [19]:
R c = 2 σ * n 2 3 π r i = 1 n ln E * π g r i = 4 σ * 3 π L ln B L
where σ * is the inherent resistivity of the mixture; r is the radius of the contact point, L is the stacking height, L = 2 n r , n is the number of contact points, B is a constant related to Young’s modulus [19], E * = E / ( 1 v 2 ) , E is the Young’s modulus, v is the Poisson’s ratio, and g is the acceleration of gravity.

2.4. Characterization Methods

2.4.1. Industrial Analyses

Ash, moisture, volatile matter, and fixed carbon content were determined by drying, roasting, and measuring the mass after the different stages of treatment; the fixed carbon content was calculated from the difference (Fixed Carbon = 100% − Ash − Volatile Matter Content).

2.4.2. Raman Spectral Analysis

Raman spectral analysis data of samples tested at room temperature using the Horiba LabRAM HR Evolution Raman test system (Raman Spectral, LabRam HR Evolution, Japan). The data were then fitted using Origin’s split-peak fitting function (Origin, https://apps.belacad.cn/app/30/origin?bd_vid=9742394440114776086), setting the initial positions at 1580 cm−1 (G band), 1200 cm−1 (D4 band), 1350 cm−1 (D1/D band), 1620 cm−1 (D2 band), and 1500 cm−1 (D3 band). The resulting ID/IG can represent the degree of graphitization [20].

2.4.3. Infrared Spectral Analysis

Coal was scanned by Fourier Transform Infrared Spectroscopy (FTIR, Nicolet iS 10, USA) to determine ordering and hydrogen bond strength. The samples were scanned, and infrared spectrograms were collected in the wavelength range of 4000 to 400 cm−1.

2.4.4. Specific Surface and Porosity Analysis

Nitrogen was slowly introduced into the material, and then the specific surface area and pore structure of the material could be calculated based on the amount of nitrogen added and the shape of the adsorption isotherm. Based on the adsorption isotherm data, the slope and intercept of the adsorption isotherm were obtained by fitting using the BET equation. The specific surface area of the samples was calculated from the parameters in the BET equation (BET, Micromeritics 3Flex, USA).

2.4.5. X-Ray Fluorescence Spectrometer

XRF (X-ray fluorescence, PANalytical Axios, The Netherlands) involves the bombardment of materials with high-energy X-rays or gamma rays, which causes electrons inside the atom to transition from a low energy level to a high energy level, thereby forming an excited state atom. The excited atom is in an unstable state, and the electrons rapidly transition from the high energy level to the low energy level, releasing excess energy. When an atom leaps from the excited state to the ground state, it emits fluorescent rays of a specific energy. The energy characteristics of the fluorescent rays produced by atoms of different elements vary, enabling their measurement and, consequently, the determination of the elemental composition and identity of the sample under investigation.

3. Results and Analyses

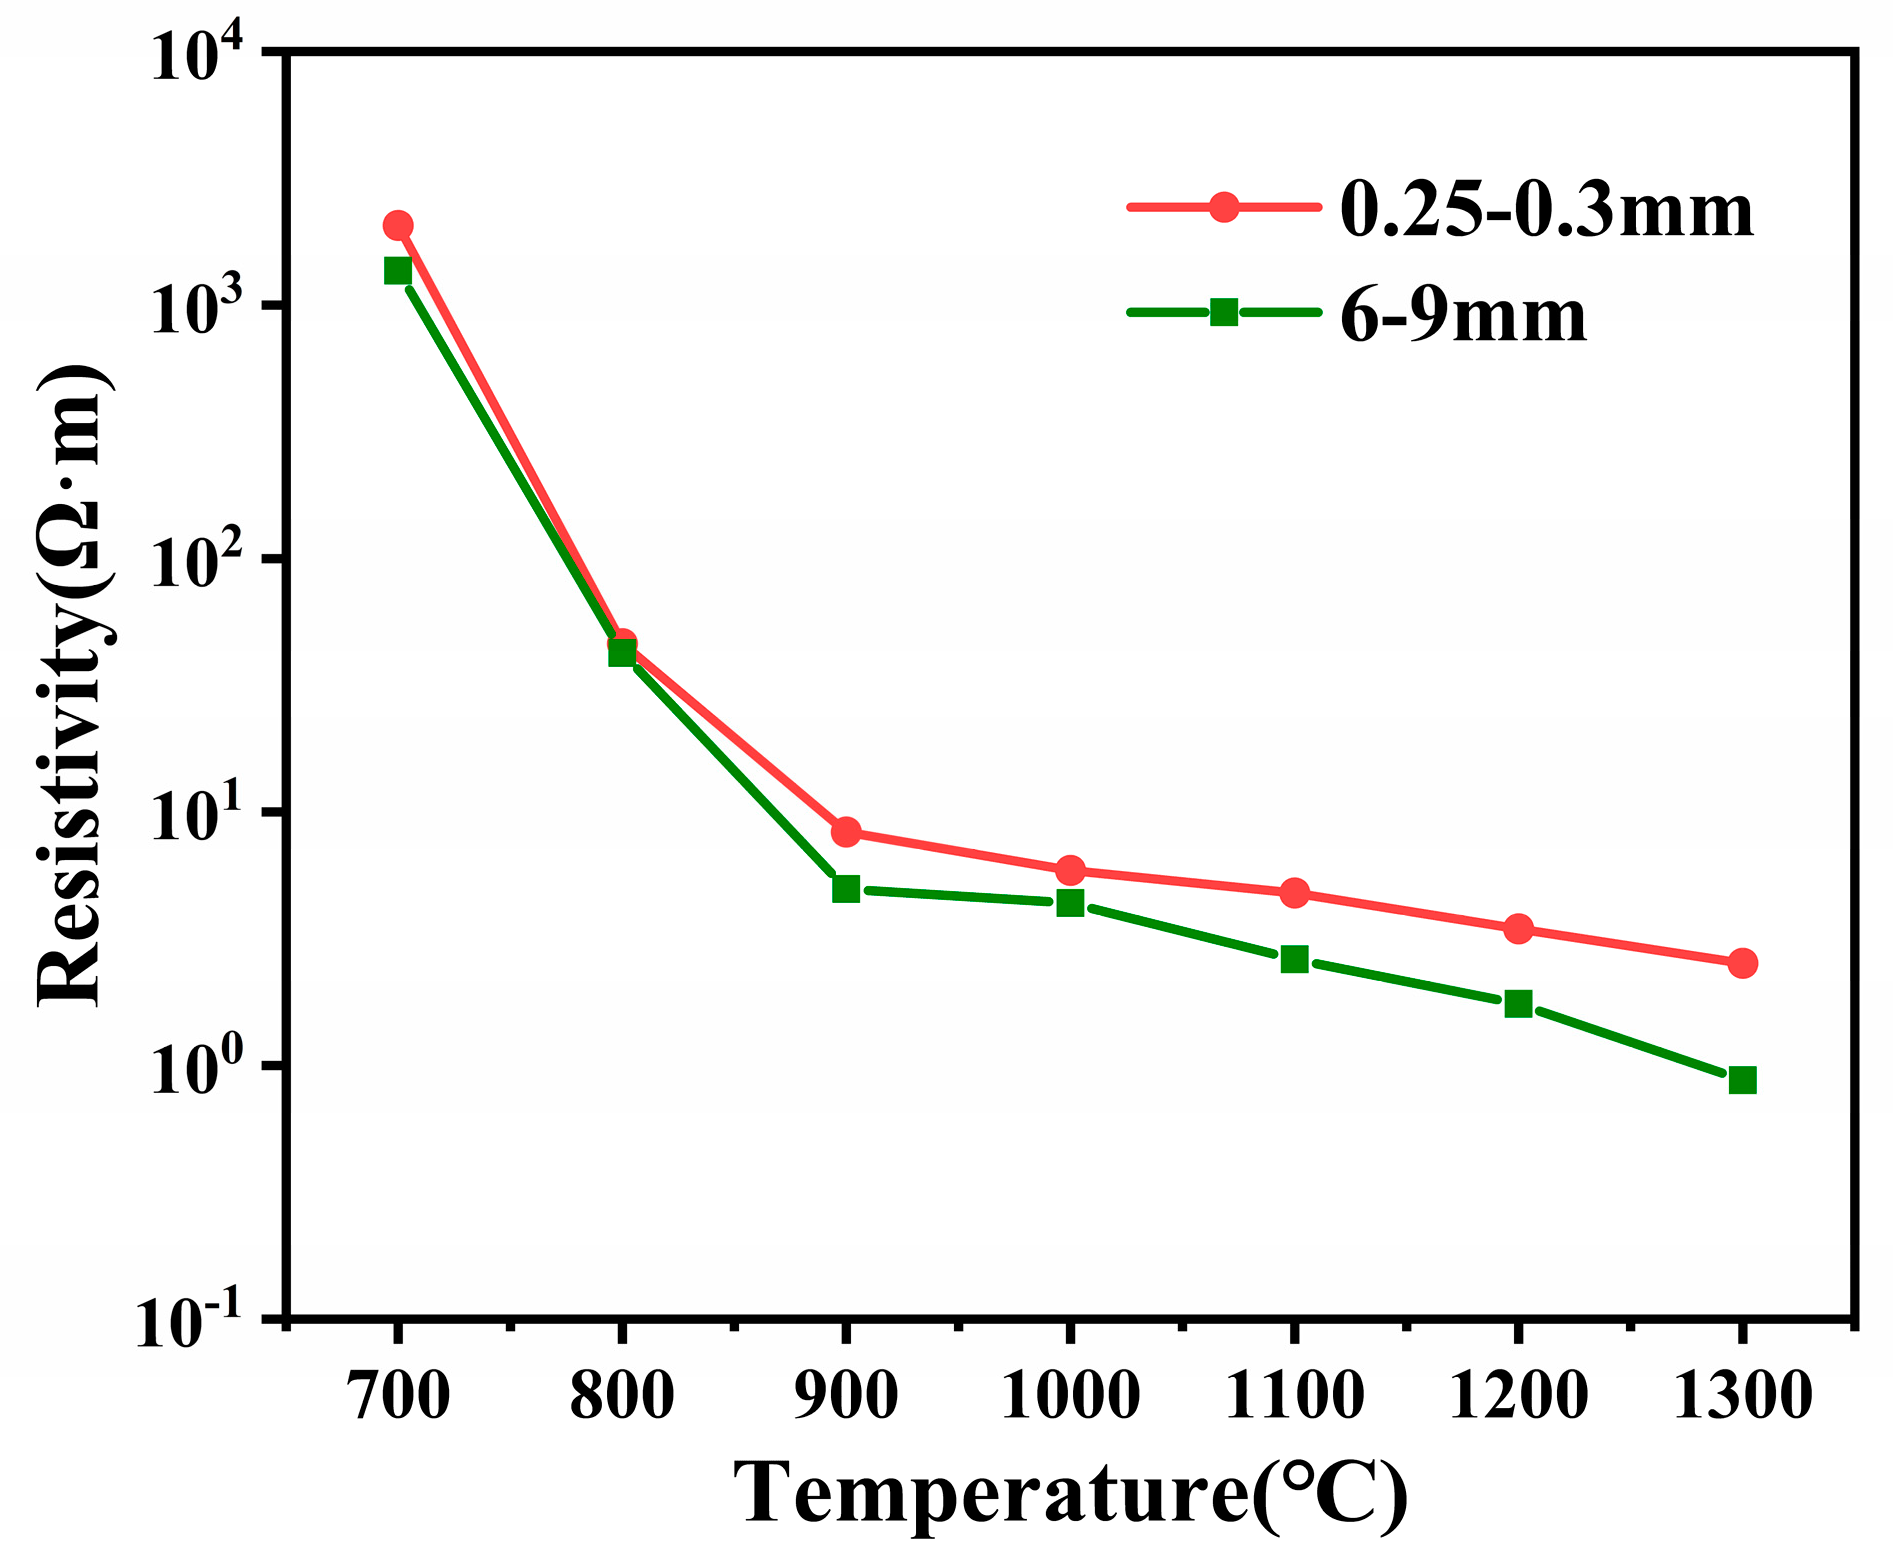
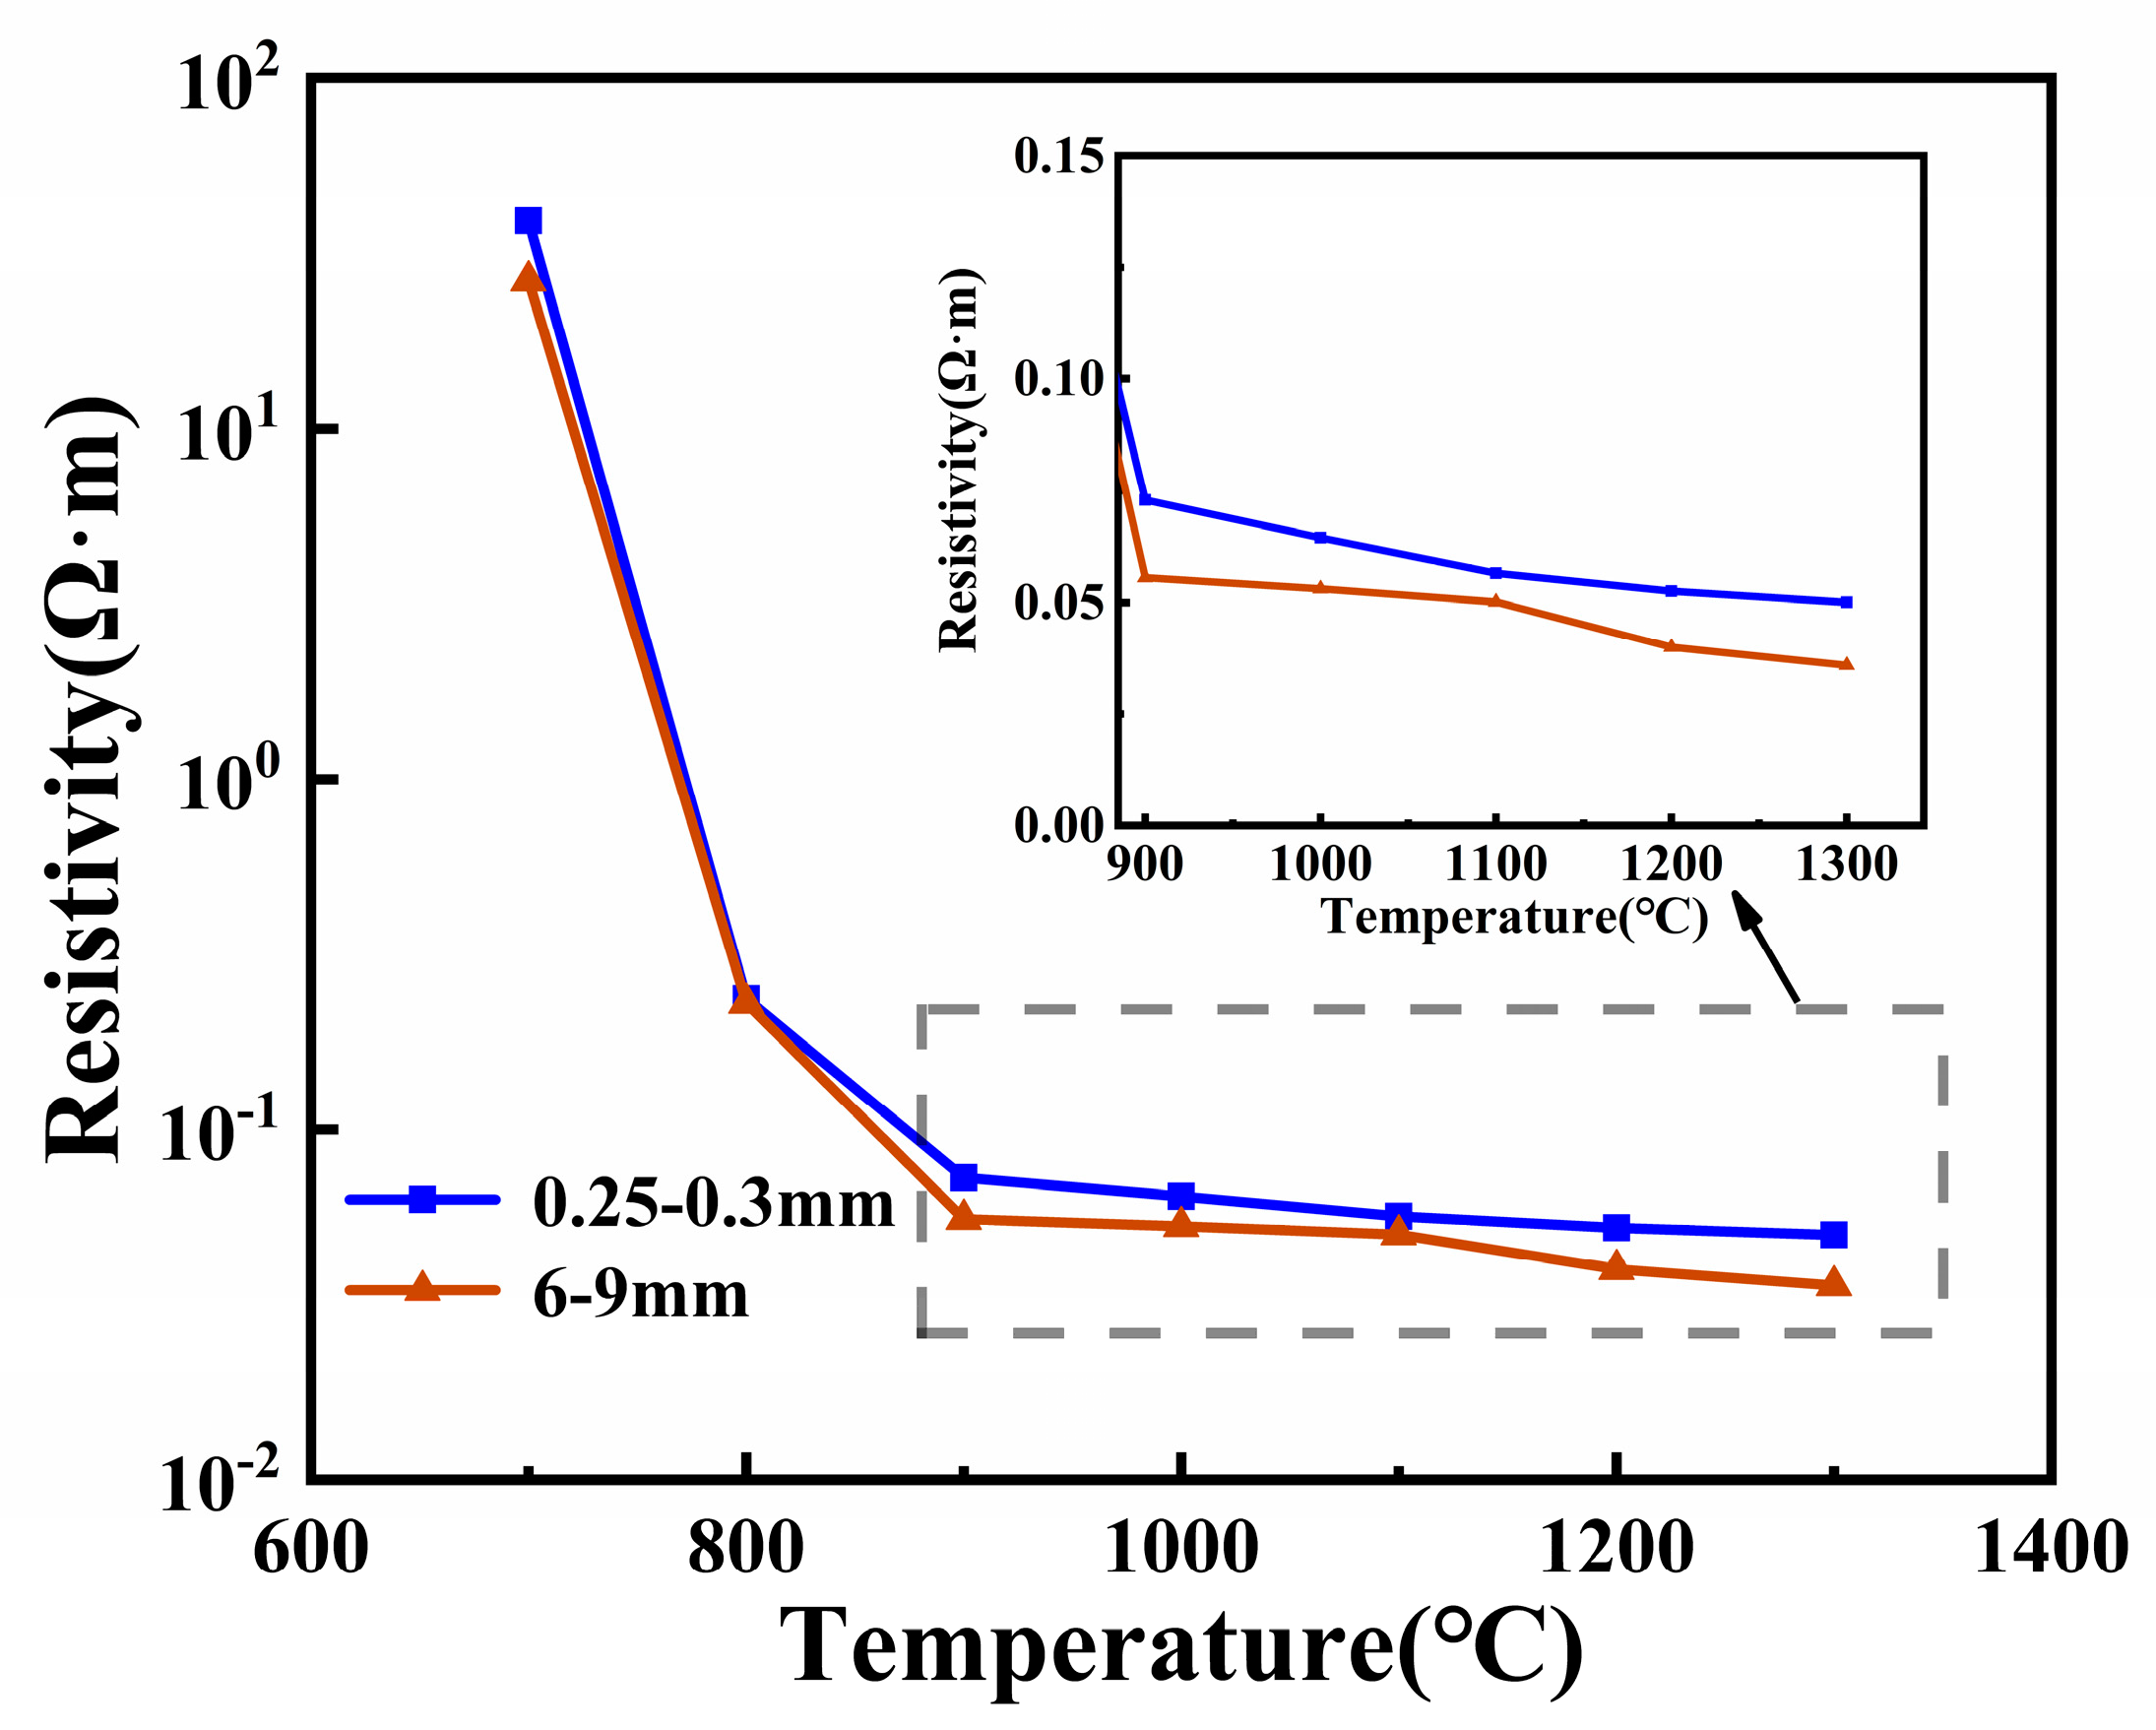
3.1. Results of Resistivity of Different Grain Sizes of Charge at High Temperature

The resistivity measurements of the furnace charge are presented in Figure 3. The findings indicate a downward trend in resistivity for furnace charges of varying particle sizes with rising temperatures. When the temperature of the furnace charge was elevated from 700 °C to 1300 °C, the resistivity of the furnace charge exhibited a notable decline. Specifically, for particles sized between 6 and 9 mm, the resistivity decreased from 1366.7 Ω·m to 0.9 Ω·m, while for particles sized between 0.25 and 0.3 mm, the resistivity decreased from 2060.5 Ω·m to 2.5 Ω·m. This is due to the enhanced conductivity of the material at high temperatures and the formation of electron conduction paths. The resistivity of the mixed systems with varying grain sizes exhibited notable variations under elevated temperatures. The resistivity of the finer-grained charge (0.25–0.3 mm) increased at higher temperatures compared to the resistivity of the coarser-grained charge (6–9 mm). This phenomenon suggests that differences in particle size affect the conductivity of the material and the formation of conductive pathways within the furnace charge system.
The preceding results indicate that the variation in particle size exerts a substantial influence on the conductive behavior of the mixed system. To elucidate the precise mechanism of the role of particle size, it is imperative to study the impact of particle size on coal and silica’s electrical resistivity independently. Only through such a rigorous and methodical approach can the electrical conductivity mechanism of the two materials in the mixed system be revealed.

3.2. Effect of Particle Size on Coal Resistivity

In order to study the effect of particle size on the high-temperature resistivity of coal, the resistivity analysis of coal at 700–1300 °C was carried out, and the results are shown in Figure 4. Resistivity values were found to decrease from 39.1191–0.0501 Ω·m to 26.4574–0.0358 Ω·m when the particle size increased from 0.25–0.3 mm to 6–9 mm. It is clear by comparing the resistivity of coal particles of different sizes that the resistivity decreases with increasing particle size. In particular, at 1300 °C, there is a significant 29 percent difference in resistivity between coal particles that are 0.25–0.3 mm and those that are 6–9 mm.
The internal structure of coal and the contact resistance between coal particles are the two main ways that particle size affects coal’s resistivity [18]. Coal’s inherent resistivity and the interfacial contact area between its particles work together to determine the coal’s contact resistance [17]. The colloidal materials in coal gradually stick to the outside of coal particles at high temperatures, increasing the interfacial contact area between adjacent coal particles [21]. Simultaneously, the inherent resistivity of coal experiences a notable reduction as the temperature rises. This dual effect causes the contact resistance between coal particles to decrease with increasing temperature. Furthermore, it has been demonstrated that, at elevated temperatures, the impact of contact resistance becomes progressively less significant in comparison to the alteration in material resistivity [22,23].
Significant variations are observed in the reactivity levels exhibited by coals of varying particle sizes when subjected to pyrolysis processes [15]. Alterations in particle dimensions have a significant impact on the microstructural properties of coal, such as pore size distribution, specific surface area, and the organization of the carbonaceous framework [24,25]. Modulations in these structural characteristics play a crucial role in influencing the electrical resistivity of coal. The impact of particle size on the structural arrangement of coal may play a more significant role in altering resistivity compared to variations in contact resistance attributed to particle size adjustments.
In order to investigate the relationship between coal structure and coal high-temperature resistivity, the fractional Raman spectroscopy method was used to analyze the coal structure for both grain sizes. The results are shown in Figure 5. The Raman spectra exhibited the fitting outcomes for coal specimens of varying particle sizes, illustrating characteristic peaks at approximately 1580 cm−1 (G-band) and 1350 cm−1 (D-band). It is noteworthy that the intensity of the D-band peaks exceeds that of the G-band peaks in both instances. The D-band typically signifies the presence of structural defects and disorder within the material, whereas the G-band is indicative of a well-organized lattice structure [26]. The degree of graphitization-like behavior of the carbon material, which signifies the ordering of the crystal structure in Raman spectroscopy, can be discerned by analyzing the ID/IG ratio [20]. The analysis illustrated in Figure 5a reveals that the G-band’s peak intensity is more pronounced in the 6–9 mm coal sample compared to the 0.25–0.3 mm coal sample, exhibiting ID/IG ratios of 1.36 and 1.32, respectively. These results indicate that of the two coal samples studied, the 6–9 mm sample shows more graphitization-like behavior and a more ordered coal structure. In contrast, the carbon atoms of coals with a higher degree of graphitization-like behavior are arranged in a more ordered manner, with more continuous conductive paths [27]. The results from coal Raman spectroscopy support the relationship between resistivity and particle size, indicating that the size of coal particles influences the degree of graphitization-like behavior and, consequently, the coal’s resistivity.
The preceding findings suggest that the influence of particle size on the resistivity of coal is intricately linked to its ability to adjust the level of graphitization-like behavior. Coal samples having larger particle sizes demonstrate reduced resistivity as a result of their elevated degree of graphitization-like behavior. The level of graphitization-like behavior serves as a crucial link between the microstructural organization of coal and its electrical characteristics, playing a pivotal role in influencing electron conductivity within the carbon substance. Hence, to investigate the precise influence of particle size on the graphitization-like process of coal, infrared spectroscopy was conducted on coal samples of two different particle sizes. The outcomes of this analysis are illustrated in Figure 6. The IR spectra corresponding to the groups [28] are shown in Table 3. The infrared spectrum of coal at 3000–3700 cm−1 corresponds to the hydroxyl (-OH) absorption peaks, and the absorption peaks reflect the aromatic rings of coal at around 1000–1800 cm−1. The intensity of both peaks was higher for 6–9 mm coals and lower for 0.25–0.3 mm coals. A high hydroxyl content indicates that the coal is rich in aliphatic structures, and a high content of aromatic rings usually indicates a high degree of graphitization-like behavior. The high content of both indicates that the coal is undergoing a dehydration condensation reaction, the aromatic rings are stacking up, and some of the hydroxyl groups are completely removed.
In order to further reveal the effect of particle size on the graphite-like process, the pore volume of the coal was analyzed, and the total pore volume of the coal with different particle sizes after roasting is shown in Figure 6c, and the specific pore volume in the coal increases with the decrease in this particle size. Variations in the composition of coal across varying particle dimensions are linked to alterations in surface area characteristics [29]. During the pyrolysis process of coal, the volatiles generated permeate the internal pores of coal particles before diffusing to the external surface. Any volatiles that have not undergone complete volatilization may experience subsequent chemical transformations such as cracking, condensation, or polymerization within the coal particles. This may lead to the deposition of secondary coke on the pore walls, which, in turn, leads to an increase in coal carbonization, resulting in an increase in the structural ordering of the coal [30,31]. Larger coal particle sizes result in a longer flow of volatiles to the outer surface and enhanced secondary reactions. It suggests that the more intense secondary reactions occurring in the larger particle sizes result in a higher degree of graphitization-like behavior in the coal. In conclusion, the enhanced secondary reaction of coal possessing a larger particle size results in a heightened level of graphitization-like behavior, consequently yielding lower resistivity in comparison to coal characterized by smaller particle sizes.
Table 3. Groups corresponding to infrared spectra [30,31].
Wavenumbers (cm−1)Functional Group
3000–3700Hydroxyl (-OH)
Around 1650C=C
Around 1400Methyl
500–800Benzene ring substituent

3.3. Effect of Particle Size on the Resistivity of Silica Ores

In order to investigate the effect of particle size on the resistivity of silica ore, the resistivity of silica ore with different particle sizes was tested. The resistivity of silica ore surpasses 200,000 Ω·m when below 900 °C, rendering it beyond the capacity of the experimental setup. Consequently, the resistivity of silica ore within the temperature range of 900–1300 °C was examined, yielding the findings illustrated in Figure 7. The resistivity of 6–9 mm silica decreased from 99,726.1 Ω·m to 620.3 Ω·m, and the resistivity of 0.25–0.3 mm decreased from 162,495.5 Ω·m to 740.8 Ω·m.
When examining the resistivity of silica ore particles of varying sizes, it is observed that silica ore particles of larger sizes exhibit reduced resistivity when contrasted with their smaller counterparts. Furthermore, with increasing temperature, the resistivity of silica ore particles of both sizes converges towards a similar value, indicating a diminishing influence of particle size on silica ore resistivity. The reduction in silica ore particle size results in an increased quantity of interfaces among the particles, giving rise to potential barriers such as surface states and grain boundary defects. These barriers impede the flow of electrons or ions, subsequently elevating resistivity levels. At reduced temperatures characterized by diminished carrier density and decreased electron transit probability across the interface, the impact of interface resistance on the overall resistivity becomes notably pronounced. As the temperature rises, the efficacy of potential barriers at grain boundaries diminishes due to thermal energy, enabling carriers to traverse the boundaries with greater ease, subsequently diminishing the impact of grain boundaries on resistance [32]. Meanwhile, as the temperature elevates, there is a notable escalation in the quantity of thermally activated electrons, leading to a substantial rise in carrier density. Consequently, high-energy carriers exhibit an increased propensity to surmount interfacial hindrances, thereby diminishing the influence of particle size on resistivity [33]. Consequently, as temperatures rise, the resistivity of fine-grained silica ore approaches that of coarse-grained silica, diminishing the impact of particle size on silica’s electrical conductivity within the furnace charge.

3.4. Mechanism of Particle Size Effect on High-Temperature Resistivity of the Furnace Charge

The electrical resistivity within the furnace charge system is predominantly dictated by the resistive characteristics inherent in coal and silica ore and the manner in which particles interact with one another. The variability in particle size can intricately influence the resistivity of the charging mechanism by altering the resistivity of coal and the contact resistance among particles. According to the principles of equivalent conductivity and contact resistance in hybrid materials, the overall resistivity of the furnace charge system can be divided into two components: the inherent resistivity of the material and the resistivity at the interfaces between particles. The electrical resistivity of the system is mathematically formulated as indicated below:
σ = σ * + σ c = σ * + R c A L
σ = σ * + 4 σ * A 3 π L 2 ln B L
where σ * is the equivalent intrinsic resistivity of the coal and silica blend and σ c is the contact resistivity.

3.4.1. Mechanisms of Inherent Resistivity of the Furnace Charge After Furnace Charge Mixing

When coal and silica are in perfect contact, the resistivity of the two is defined as the inherent resistivity of the charge, converted from the way each conducts itself in the furnace. The impact of particle size on the intrinsic resistivity within the mixed system predominantly manifests through the distinct conductivity characteristics exhibited by the constituent materials, namely coal and silica. The aforementioned experiments show that the resistivity of silica responds very little to changes in particle size, in contrast to coal, whose resistivity decreases gradually with increasing particle size. In addition, the variation in intrinsic resistivity is also affected by the way the conductive pathways are constructed in the charge, i.e., the specific roles played by coal and silica in the conductive pathways. After analyzing the high-temperature resistivity characteristics of coal and silica ore, it is evident that silica exhibits a high-temperature resistivity over five orders of magnitude greater than that of coal. Thus, silica can be classified as an insulator within the composite system. In the binary conductive system, the variation in the inherent resistivity is consistent with the theory of effective conductivity [34] due to the large difference between coal and silica resistivities, which can be described by the following equation:
σ * = σ 0 / ( φ φ c ) t
where σ 0 is the resistivity of the conductive portion; φ is the volume fraction of the conductive portion; φ c is the seepage threshold; and the general standard seepage threshold is 1.3. t is a constant related to the size and morphology of the conductive filler, and the value of t for coals that have been roasted at high temperatures is generally 1.7.
The model posits that the primary factor influencing the inherent resistivity of the charge is the fluctuation in resistivity of the conductive coal phase, with the size of silica particles exerting a minimal impact on resistivity. Consequently, the observed alterations in the inherent resistivity of the furnace charge system with varying particle sizes align with the coal resistivity’s dependence on particle size.

3.4.2. Mechanism of Furnace Charge in Furnace Charge Contact Resistance

The furnace charge contact resistance is in accordance with Equation (2) and is positively correlated with the intrinsic resistivity of the charge, σ * , and negatively correlated with the stacking height of the charge, L . The principle of variation in charge stack height L with particle size is shown in Figure 8. As the diameter of the particles diminishes from 6–9 mm to 0.25–0.3 mm, a rise in the number of contact points between the furnace charge within the crucible is observed, while simultaneously reducing the interspace among the charge. This leads to a reduction in the stacking height denoted as L , decreasing from 16 mm to 9 mm. According to Equation (2) the contact resistance increases when the stacking height L decreases. Meanwhile, according to the previous description, the intrinsic resistivity of the charge decreases with increasing particle size, which suggests that the contact resistance generally decreases with increasing particle size under the combined effect of particle size changes. The fluctuation in charge contact resistance is evidently influenced not solely by the height of stacking but also by the modulation in intrinsic resistivity based on particle size. The combined effect of these factors dictates contact resistance.
By modeling the resistivity of the furnace charge system, the effect of particle size on high-temperature resistivity can be clearly decomposed into the role of both inherent resistivity and contact resistivity. For this model, coal resistivity is utilized to validate the analysis of the charge resistivity. Comparing the resistivity of the charge with different particle sizes, the resistivity decreases with increasing particle size. When the temperature reaches 1300 °C, the difference between the resistivity of 0.25–0.3 mm coal and 6–9 mm coal is 29%, while the difference between the resistivity of the 0.25–0.3 mm charge and the 6–9 mm charge reaches 64%. The measured coal resistivity and the measured volume fraction of both after roasting ( φ is 0.25 for 0.25–0.3 mm coal and 0.30 for 6–9 mm coal) are brought into Equation (5), followed by bringing the data obtained from Equation (5), the stack height L , and the cross-sectional area A (the area A of the instrument measured is approximately 0.0005 m2) of the sample into Equations (2) and (4). The contact resistance of the furnace charge is calculated to be reduced by a factor of two, and the resistivity of the furnace charge itself is reduced by 64%. The findings validate the preceding mechanistic examination, indicating that the particle size plays a crucial role in furnace charge resistivity modulation through its impact on both the inherent resistivity and the extent of contact resistance.

4. Conclusions

In this paper, the resistivity of the furnace charge with different particle sizes at 700–1300 °C is measured, and the mechanism of the influence of the particle size on the resistivity of the furnace charge is explored from the change in the physical and chemical properties of the raw materials and the overall conductivity model of the furnace charge. The results show the following:
1.
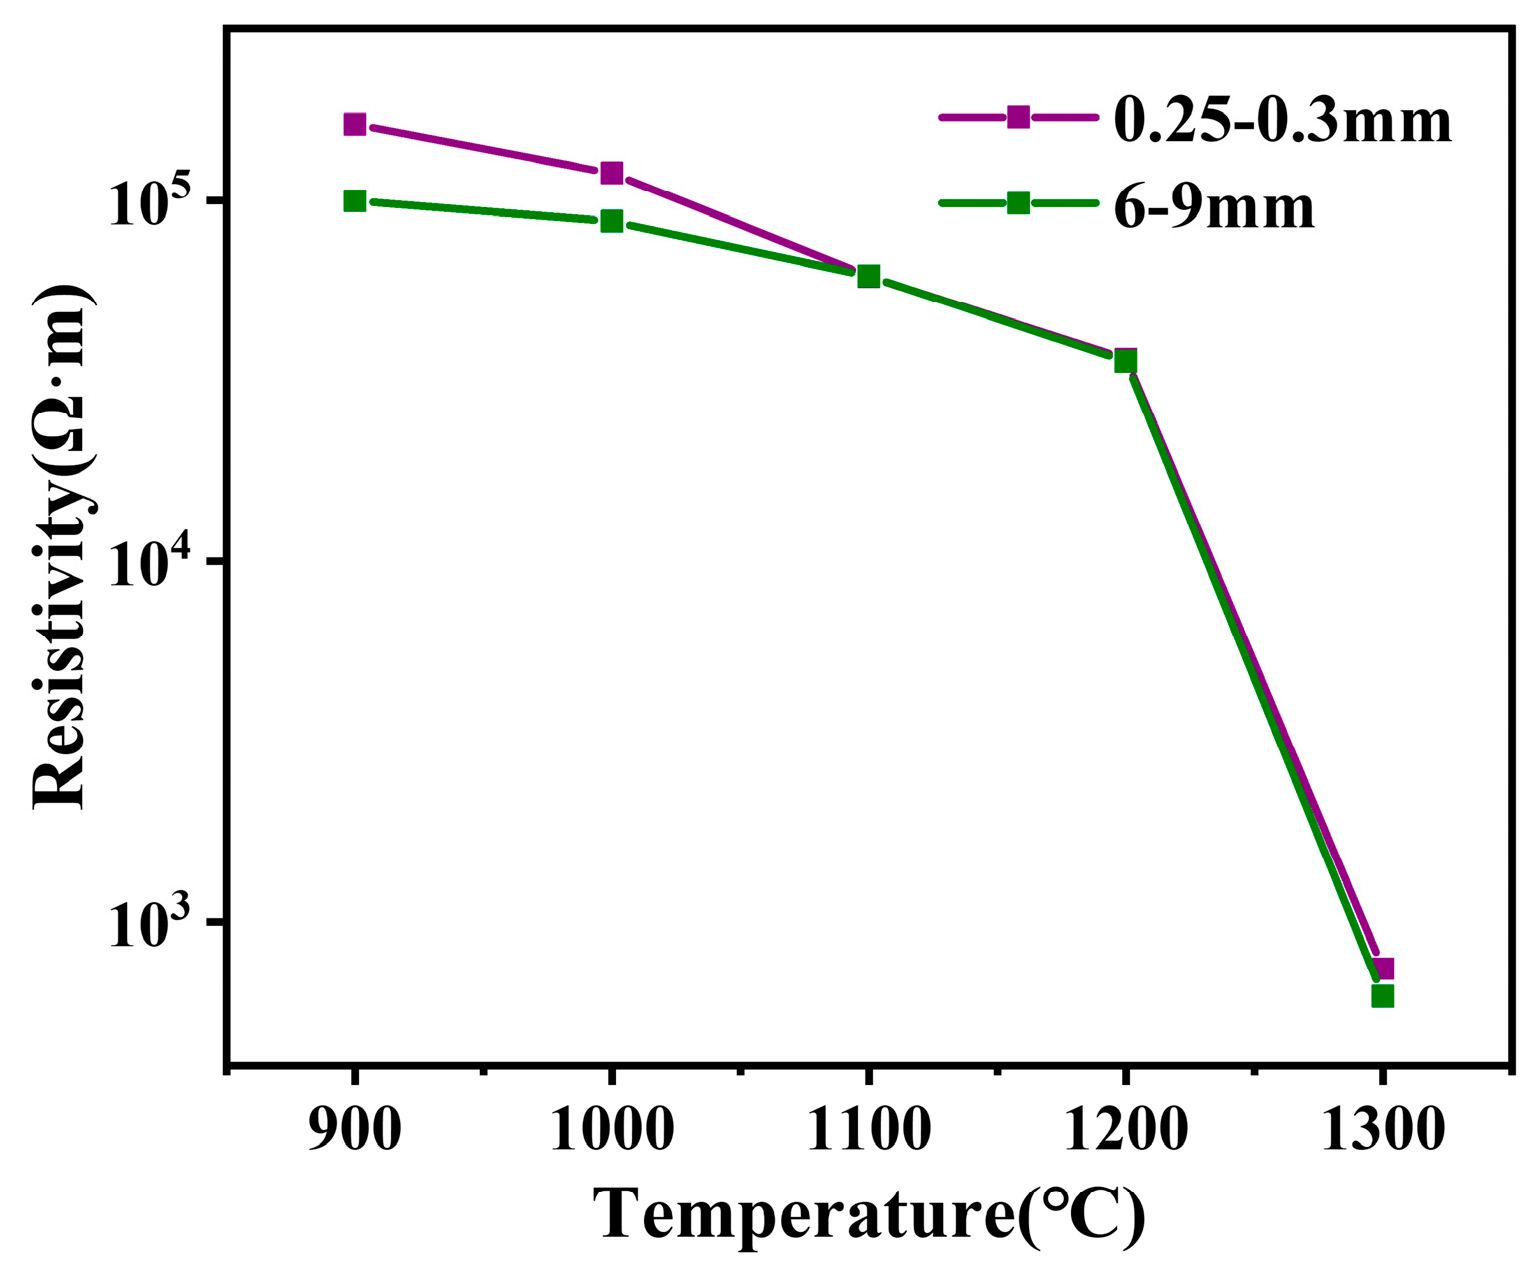
An increase in particle sizes from 0.25–0.3mm to 6–9 mm and a 64% reduction in resistivity were observed. The effect of particle size on the resistivity of the furnace charge can be divided into two parts: one is to change the physical and chemical properties of coal through the particle size to affect the inherent resistivity of the furnace charge, and the other is to change the height of the particle stack and the number of contact points to affect the contact resistance between the furnace charge.
2.
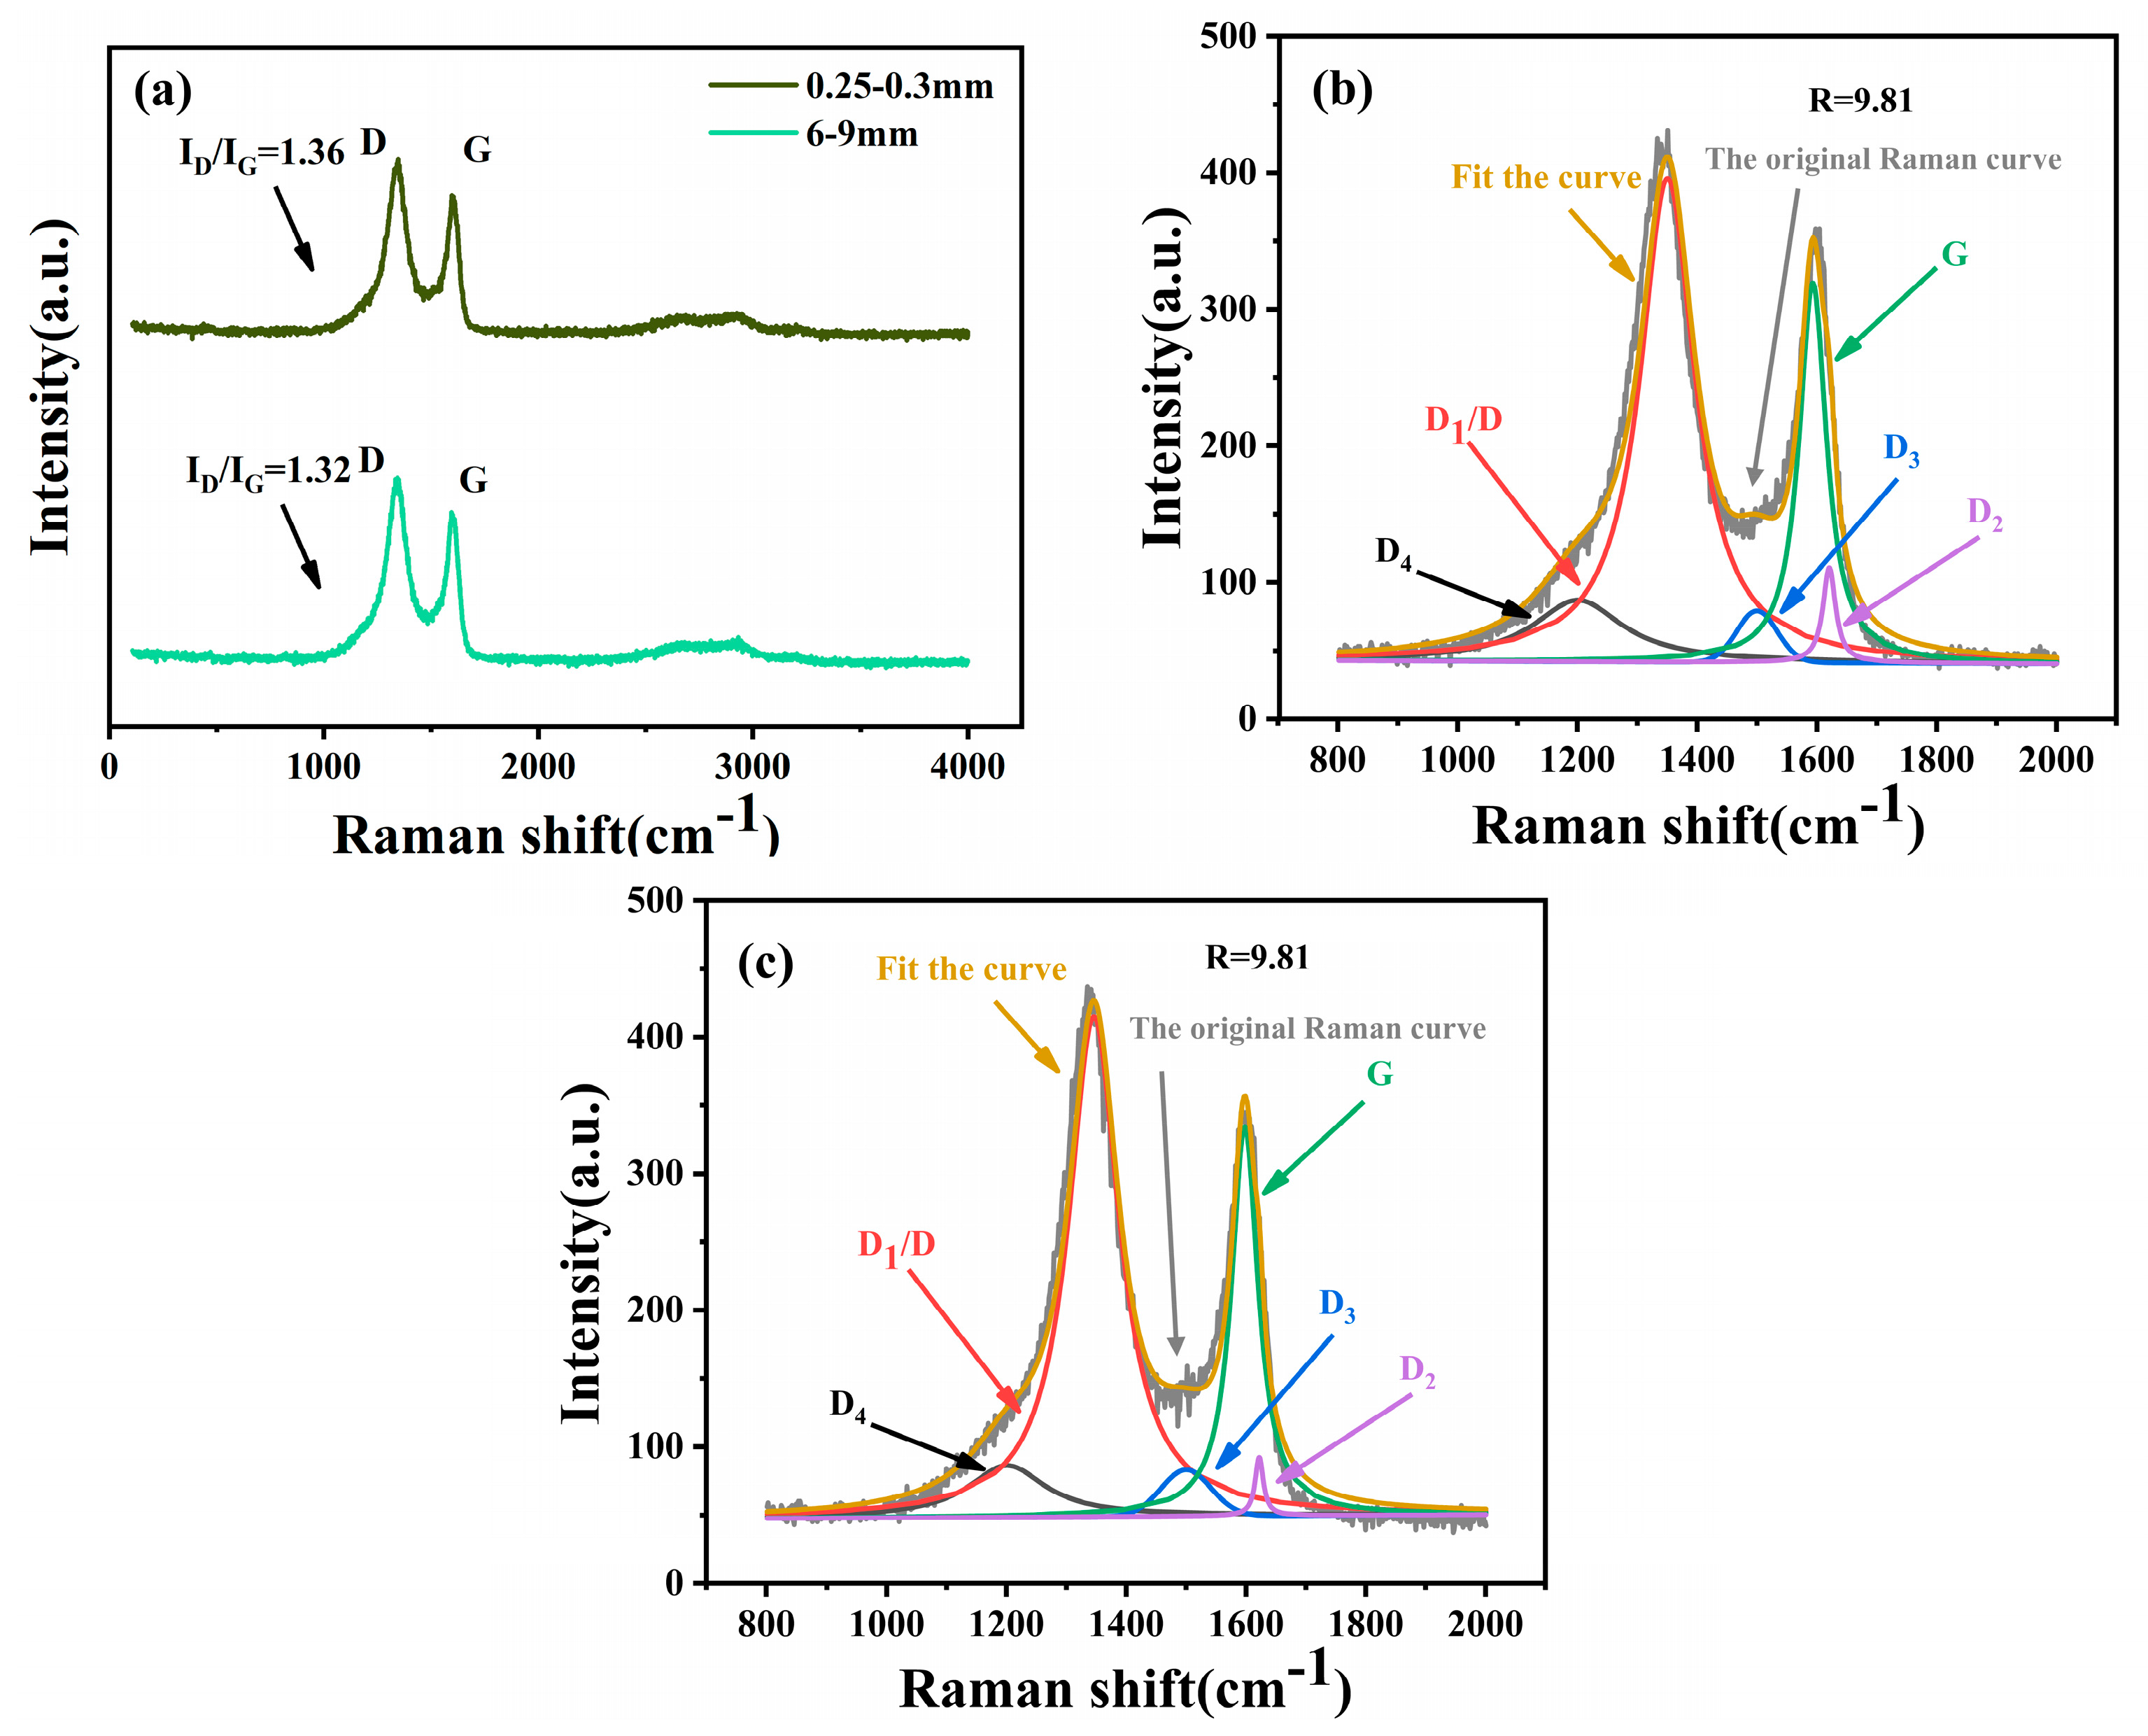
Particle size changes the inherent resistivity of coal by affecting its degree of graphitization-like behavior. When the particle size of coal decreases from 6–9 mm to 0.25–0.3 mm, the degree of graphitization-like behavior (ID/IG) increases from 1.32 to 1.36 and the structural ordering decreases. This resulted in an increase in the electrical resistivity of the coal of about 29 percent.
3.
An increase in particle size from 0.25–0.3 mm to 6–9 mm and a 2-fold reduction in the contact resistance of the furnace charge were observed.

Author Contributions

W.G.: Investigation, Methodology, Formal analysis, Writing—original draft. K.W.: Writing—review and editing, Conceptualization, Resources. X.D.: Writing—review and editing, Supervision. W.M.: Resources, Project administration. All authors have read and agreed to the published version of the manuscript.

Funding

The financial support for this research work was provided by the Yunnan Major Scientific and Technological Projects (Nos. 202202AB080008, 202202AG050012, 202402AF080005). Funds have been received to cover the costs of publication.

Data Availability Statement

No new data were created or analyzed in this study.

Conflicts of Interest

The authors declare that they have no known competing financial interests or personal relationships that could have appeared to influence the work reported in this paper.

References

  1. Bye, G.; Ceccaroli, B. Solar grade silicon: Technology status and industrial trends. Sol. Energy Mater. Sol. Cells 2014, 130, 634–646. [Google Scholar] [CrossRef]
  2. Ballif, C.; Haug, F.J.; Boccard, M.; Verlinden, P.J.; Hahn, G. Status and perspectives of crystalline silicon photovoltaics in research and industry. Nat. Rev. Mater. 2022, 7, 597–616. [Google Scholar] [CrossRef]
  3. Ringdalen, E.; Tangstad, M. Reaction mechanisms in carbothermic production of silicon, study of selected reactions. Miner. Met. Mater. Soc. 2012, 17, 195–203. [Google Scholar] [CrossRef]
  4. Neuschutz, D. State and trends of the electric arc furnace technology. High Temp. Mater. Process. Int. Q. High-Technol. Plasma Process. 2000, 4, 12. [Google Scholar] [CrossRef]
  5. Tesfahunegn, Y.A.; Magnusson, T.; Tangstad, M.; Saevarsdottir, G. Comparative study of AC and DC solvers based on current and power distributions in a submerged arc furnace. Metall. Mater. Trans. B 2020, 51, 510–518. [Google Scholar] [CrossRef]
  6. Xie, R.; Chen, Z.; Ma, W.; Wang, X.; Gan, X.; Tao, C.; Qu, J. High efficient and clean utilization of renewable energy for the process of industrial silicon. Renew. Energy 2024, 231, 120902. [Google Scholar] [CrossRef]
  7. Chen, Z.; Ma, W.; Wu, J.; Wei, K.; Yang, X.; Lv, G.; Xie, K.; Yu, J. Influence of carbothermic reduction on submerged arc furnace energy efficiency during silicon production. Energy 2016, 116, 687–693. [Google Scholar] [CrossRef]
  8. Hasannezhad, H.; Meysami, A. Effects of porosity and electrical resistance of metallurgical coke and semicoke on silicon recovery in an electric arc furnace. JOM 2019, 71, 336–341. [Google Scholar] [CrossRef]
  9. Tong, X.; You, G.; Ding, Y.; Xue, H.; Wang, Y.; Guo, W. Effect of grain size on low-temperature electrical resistivity and thermal conductivity of pure magnesium. Mater. Lett. 2018, 229, 261–264. [Google Scholar] [CrossRef]
  10. Ivanov, O.; Maradudina, O.; Lyubushkin, R. Grain size effect on electrical resistivity of bulk nanograined Bi2Te3 material. Mater. Charact. 2015, 99, 175–179. [Google Scholar] [CrossRef]
  11. Surup, G.R.; Pedersen, T.A.; Chaldien, A.; Beukes, J.P.; Tangstad, M. Electrical resistivity of carbonaceous bed material at high temperature. Processes 2020, 8, 933. [Google Scholar] [CrossRef]
  12. Eidem, P.; Tangstad, M.; Bakken, J. Measurement of material resistivity and contact resistance of metallurgical coke. In Proceedings of the International Ferro-Alloys Congress XI, New Delhi, India, 18–21 February 2007; pp. 561–571. [Google Scholar]
  13. Xu, C.; Wei, K.; Du, Z.; Ma, W. Effect of particle size on the properties of biomass gasification residue pellets used as a metallurgical-grade silicon reducing agent. Powder Technol. 2024, 435, 119406. [Google Scholar] [CrossRef]
  14. Zobnin, N.N.; Torgovets, A.K.; Pikalova, I.A.; Yussupova, Y.S.; Atakishiyev, S.A. Influence of thermal stability of quartz and the particle size distribution of burden materials on the process of electrothermal smelting of metallurgical silicon. Orient. J. Chem. 2018, 34, 1120. [Google Scholar] [CrossRef]
  15. Kök, M.V.; Özbas, E.; Karacan, O.; Hicyilmaz, C. Effect of particle size on coal pyrolysis. J. Anal. Appl. Pyrolysis 1998, 45, 103–110. [Google Scholar] [CrossRef]
  16. Parkhomenko, E.I. Electrical resistivity of minerals and rocks at high temperature and pressure. Rev. Geophys. 1982, 20, 193–218. [Google Scholar] [CrossRef]
  17. Tsybul’kin, G.A. On the calculation of the electrical resistivity of conducting loose materials. Russ. Metall. 2011, 2011, 594–598. [Google Scholar] [CrossRef]
  18. Greenwood, J.A.; Williamson, J. Contact of nominally flat surfaces. Proceedings of the royal society of London. Ser. A Math. Phys. Sci. 1966, 295, 300–319. [Google Scholar] [CrossRef]
  19. Jiang, Y.; Gao, Y.; Feng, Z. A contact model for electrical contact resistance between a rigid plane and a cylindrical surface. J. Mech. Sci. Technol. 2021, 35, 4125–4134. [Google Scholar] [CrossRef]
  20. Sadezky, A.; Muckenhuber, H.; Grothe, H.; Niessner, R.; Pöschl, U. Raman microspectroscopy of soot and related carbonaceous materials: Spectral analysis and structural information. Carbon 2005, 43, 1731–1742. [Google Scholar] [CrossRef]
  21. Hu, J.; Si, Y.; Yang, H.; Shao, J.; Wang, X.; Lei, T.; Agblevor, F.A.; Chen, H. Influence of volatiles-char interactions between coal and biomass on the volatiles released, resulting char structure and reactivity during co-pyrolysis. Energy Convers. Manag. 2017, 152, 229–238. [Google Scholar] [CrossRef]
  22. Babu, S.S.; Santella, M.L.; Feng, Z.; Riemer, B.W.; Cohron, J.W. Empirical model of effects of pressure and temperature on electrical contact resistance of metals. Sci. Technol. Weld. Join. 2001, 6, 126–132. [Google Scholar] [CrossRef]
  23. Bi, D.; Chen, H.; Ye, T. Influences of temperature and contact pressure on thermal contact resistance at interfaces at cryogenic temperatures. Cryogenics 2012, 52, 403–409. [Google Scholar] [CrossRef]
  24. Liu, S.; Gao, D.; Sang, S.; Wang, H. Characteristics of apparent resistivity of coals with different particle sizes. Coal Sci. Technol. 2022, 50, 162–169. [Google Scholar] [CrossRef]
  25. Xu, X.; Cao, D.; Wei, Y.; Wang, A.; Chen, G.; Wang, T.; Wang, G.; Chen, X. Impact of graphitization degree on the electrochemical and thermal properties of coal. ACS Omega 2024, 9, 2443–2456. [Google Scholar] [CrossRef]
  26. Zhu, H.; Yu, G.; Guo, Q.; Wang, X. In situ Raman spectroscopy study on catalytic pyrolysis of a bituminous coal. Energy Fuels 2017, 31, 5817–5827. [Google Scholar] [CrossRef]
  27. Mochidzuki, K.; Soutric, F.; Tadokoro, K.; Antal, M.J.; Tóth, M.; Zelei, B.; Várhegyi, G. Electrical and physical properties of carbonized charcoals. Ind. Eng. Chem. Res. 2003, 42, 5140–5151. [Google Scholar] [CrossRef]
  28. Possokhov, Y.M.; Butakova, V.I.; Popov, V.K. Decomposition of IR spectra of coal. Coke Chem. 2015, 58, 49–57. [Google Scholar] [CrossRef]
  29. Sun, S.; Xu, D.; Wei, Y.; Zhi, Y.; Jiang, G.; Guo, Y. Influence laws of operating parameters on coal pyrolysis characteristics. J. Anal. Appl. Pyrolysis 2022, 167, 105684. [Google Scholar] [CrossRef]
  30. Zhu, W.; Song, W.; Lin, W. Effect of the coal particle size on pyrolysis and char reactivity for two types of coal and demineralized coal. Energy Fuels 2008, 22, 2482–2487. [Google Scholar] [CrossRef]
  31. Stubington, J.F. Release of volatiles from large coal particles in a hot fluidized bed. Fuel 1984, 63, 1013–1019. [Google Scholar] [CrossRef]
  32. Parkhomenko, E.I. Electrical Properties of Rocks; Springer: Berlin/Heidelberg, Germany, 1967. [Google Scholar] [CrossRef]
  33. Saeed, A.; Adewuyi, S.O.; Ahmed, H.A.; Alharbi, S.R.; Al Garni, S.E.; Abolaban, F. Electrical and dielectric properties of the natural calcite and quartz. Silicon 2022, 14, 5265–5276. [Google Scholar] [CrossRef]
  34. Hashin, Z.; Shtrikman, S. A variational approach to the theory of the effective magnetic permeability of multiphase materials. J. Appl. Phys. 1962, 33, 3125–3131. [Google Scholar] [CrossRef]
Figure 1. Schematic diagram of the furnace charge resistivity measurement equipment.
Processes 13 01227 g001
Figure 2. Sample warming curve.
Processes 13 01227 g002
Figure 3. Plot of high-temperature resistivity of different grain sizes of furnace charge.
Processes 13 01227 g003
Figure 4. Plot of high-temperature resistivity of coal with different particle sizes.
Processes 13 01227 g004
Figure 5. Raman analysis of roasted coal: (a) Raman plots of three kinds of coal sizes, (b) Raman fit for 6–9 mm coal, (c) Raman fit for 0.25–0.3 mm coal.
Processes 13 01227 g005
Figure 6. Pore space and infrared spectra of coal after roasting for three particle sizes: (a) infrared spectra of 0.25–0.3 mm coal, (b) infrared spectra of 6–9 mm coal, (c) total pore volume of coal before and after roasting for different particle sizes.
Processes 13 01227 g006
Figure 7. High-temperature resistivity of silica ores with different grain sizes.
Processes 13 01227 g007
Figure 8. Schematic diagram of the variation in stacking height of furnace pellets with particle size.
Processes 13 01227 g008
Table 1. Industrial analyses of coal.
SampleMad (%)Aad (%)Vad (%)FCad (%)
Coal3.211.0540.0854.94
Table 2. Composition of silica.
IngredientFe2O3Al2O3CaOSiO2
Content/%0.0420.2830.00399.6
Disclaimer/Publisher’s Note: The statements, opinions and data contained in all publications are solely those of the individual author(s) and contributor(s) and not of MDPI and/or the editor(s). MDPI and/or the editor(s) disclaim responsibility for any injury to people or property resulting from any ideas, methods, instructions or products referred to in the content.

