
A Computational Fluid Dynamics Simulation Study on the Variation of Temperature and Pressure in the Container During the Dry Storage Process of Radioactive Metal Oxides


Abstract
:1. Introduction
2. Calculation Conditions and Methods
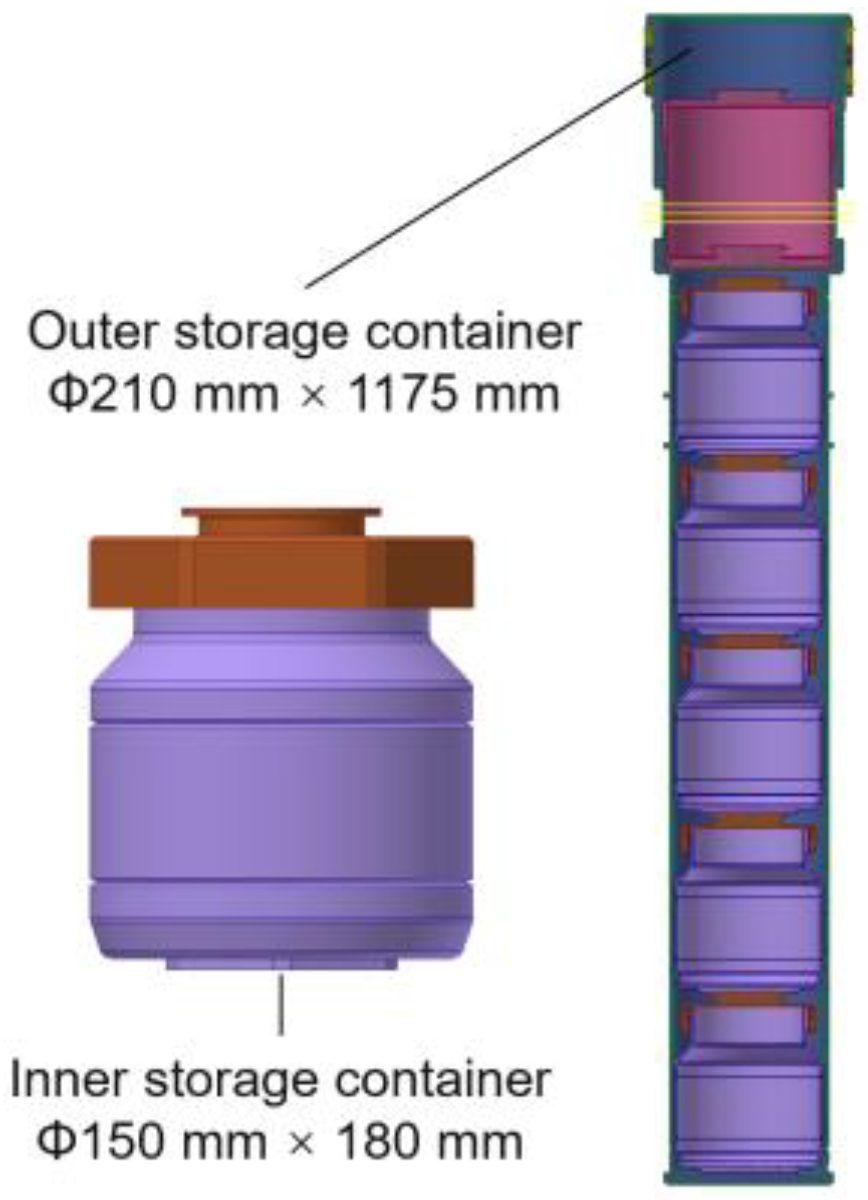
2.1. Radioactive Metal Oxide Storage Containers
2.2. Materials and Their Properties
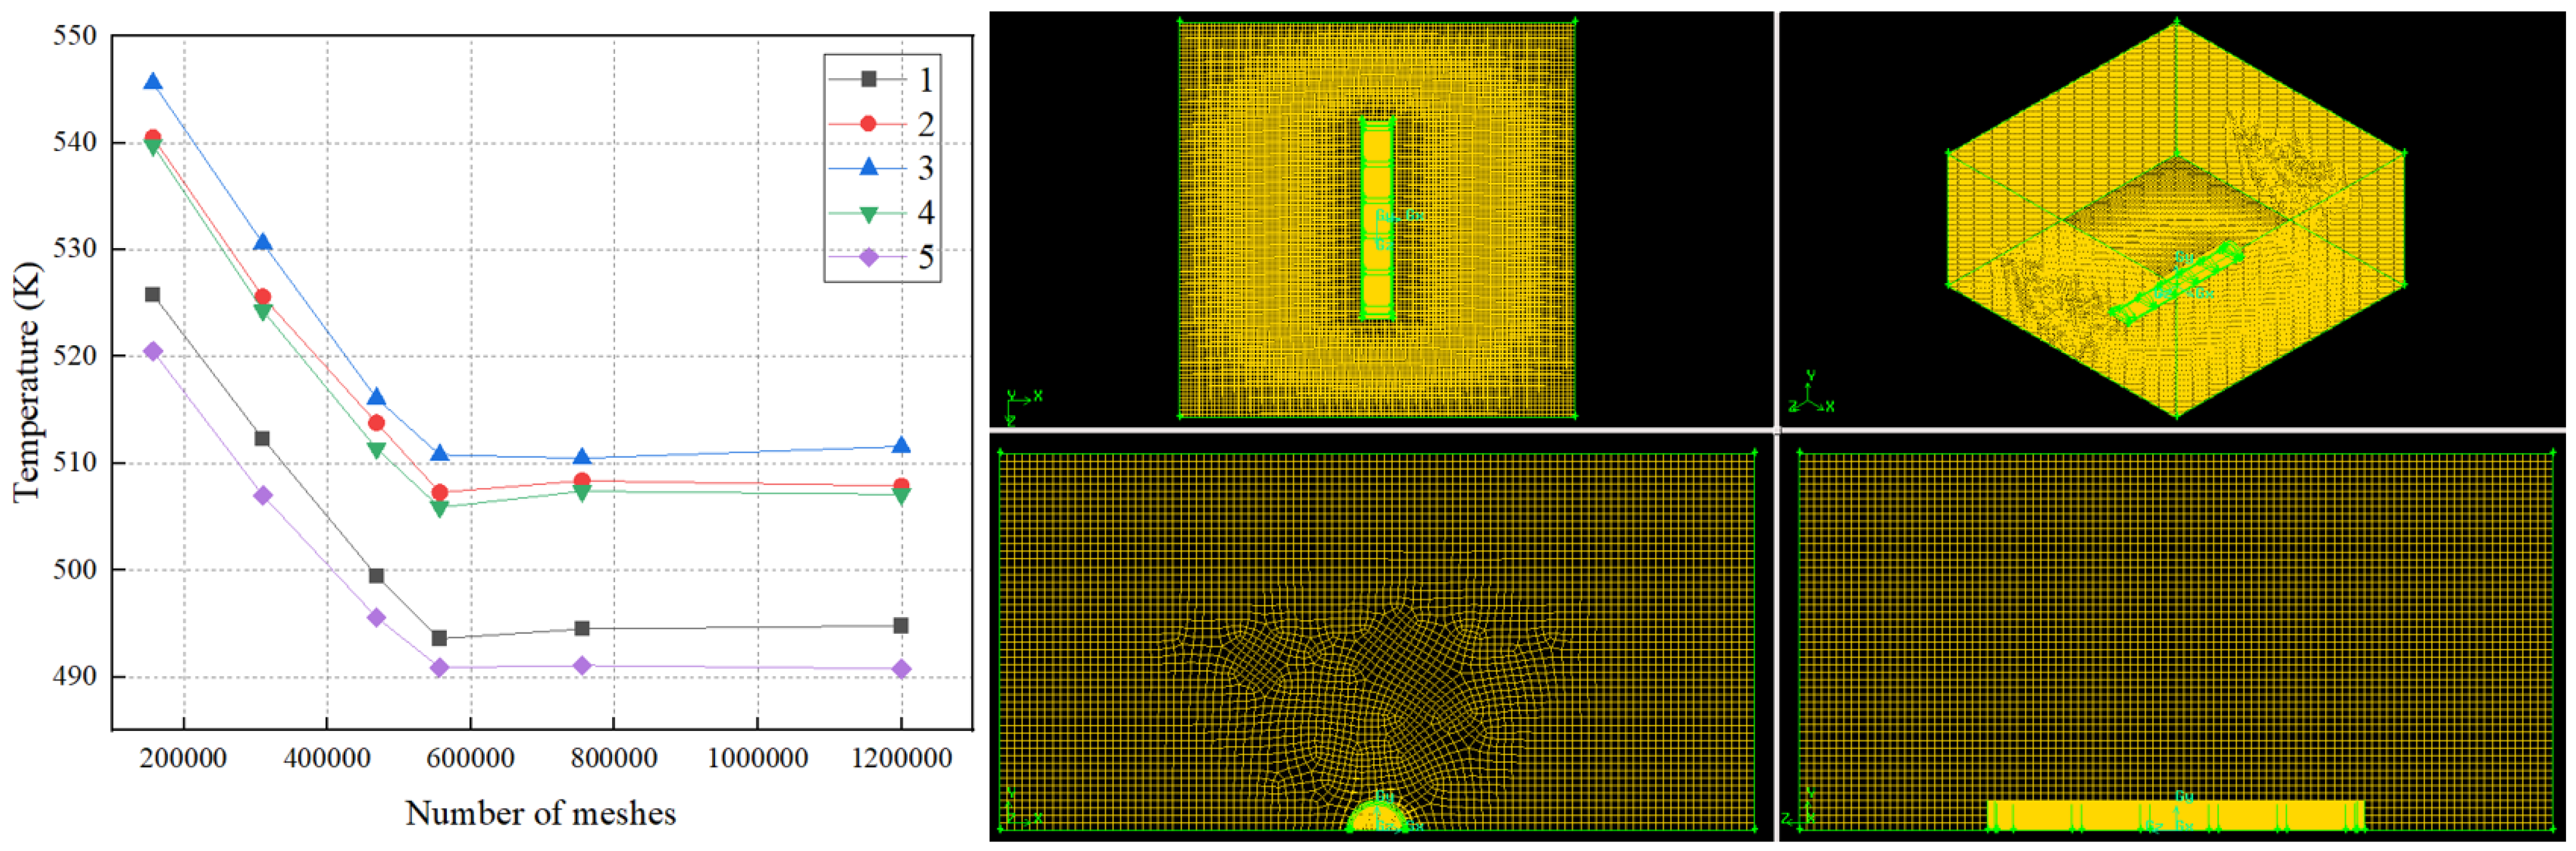
2.3. Simulation of Areas and Meshing
2.4. Calculation Method and Boundary Conditions
3. Results and Discussion
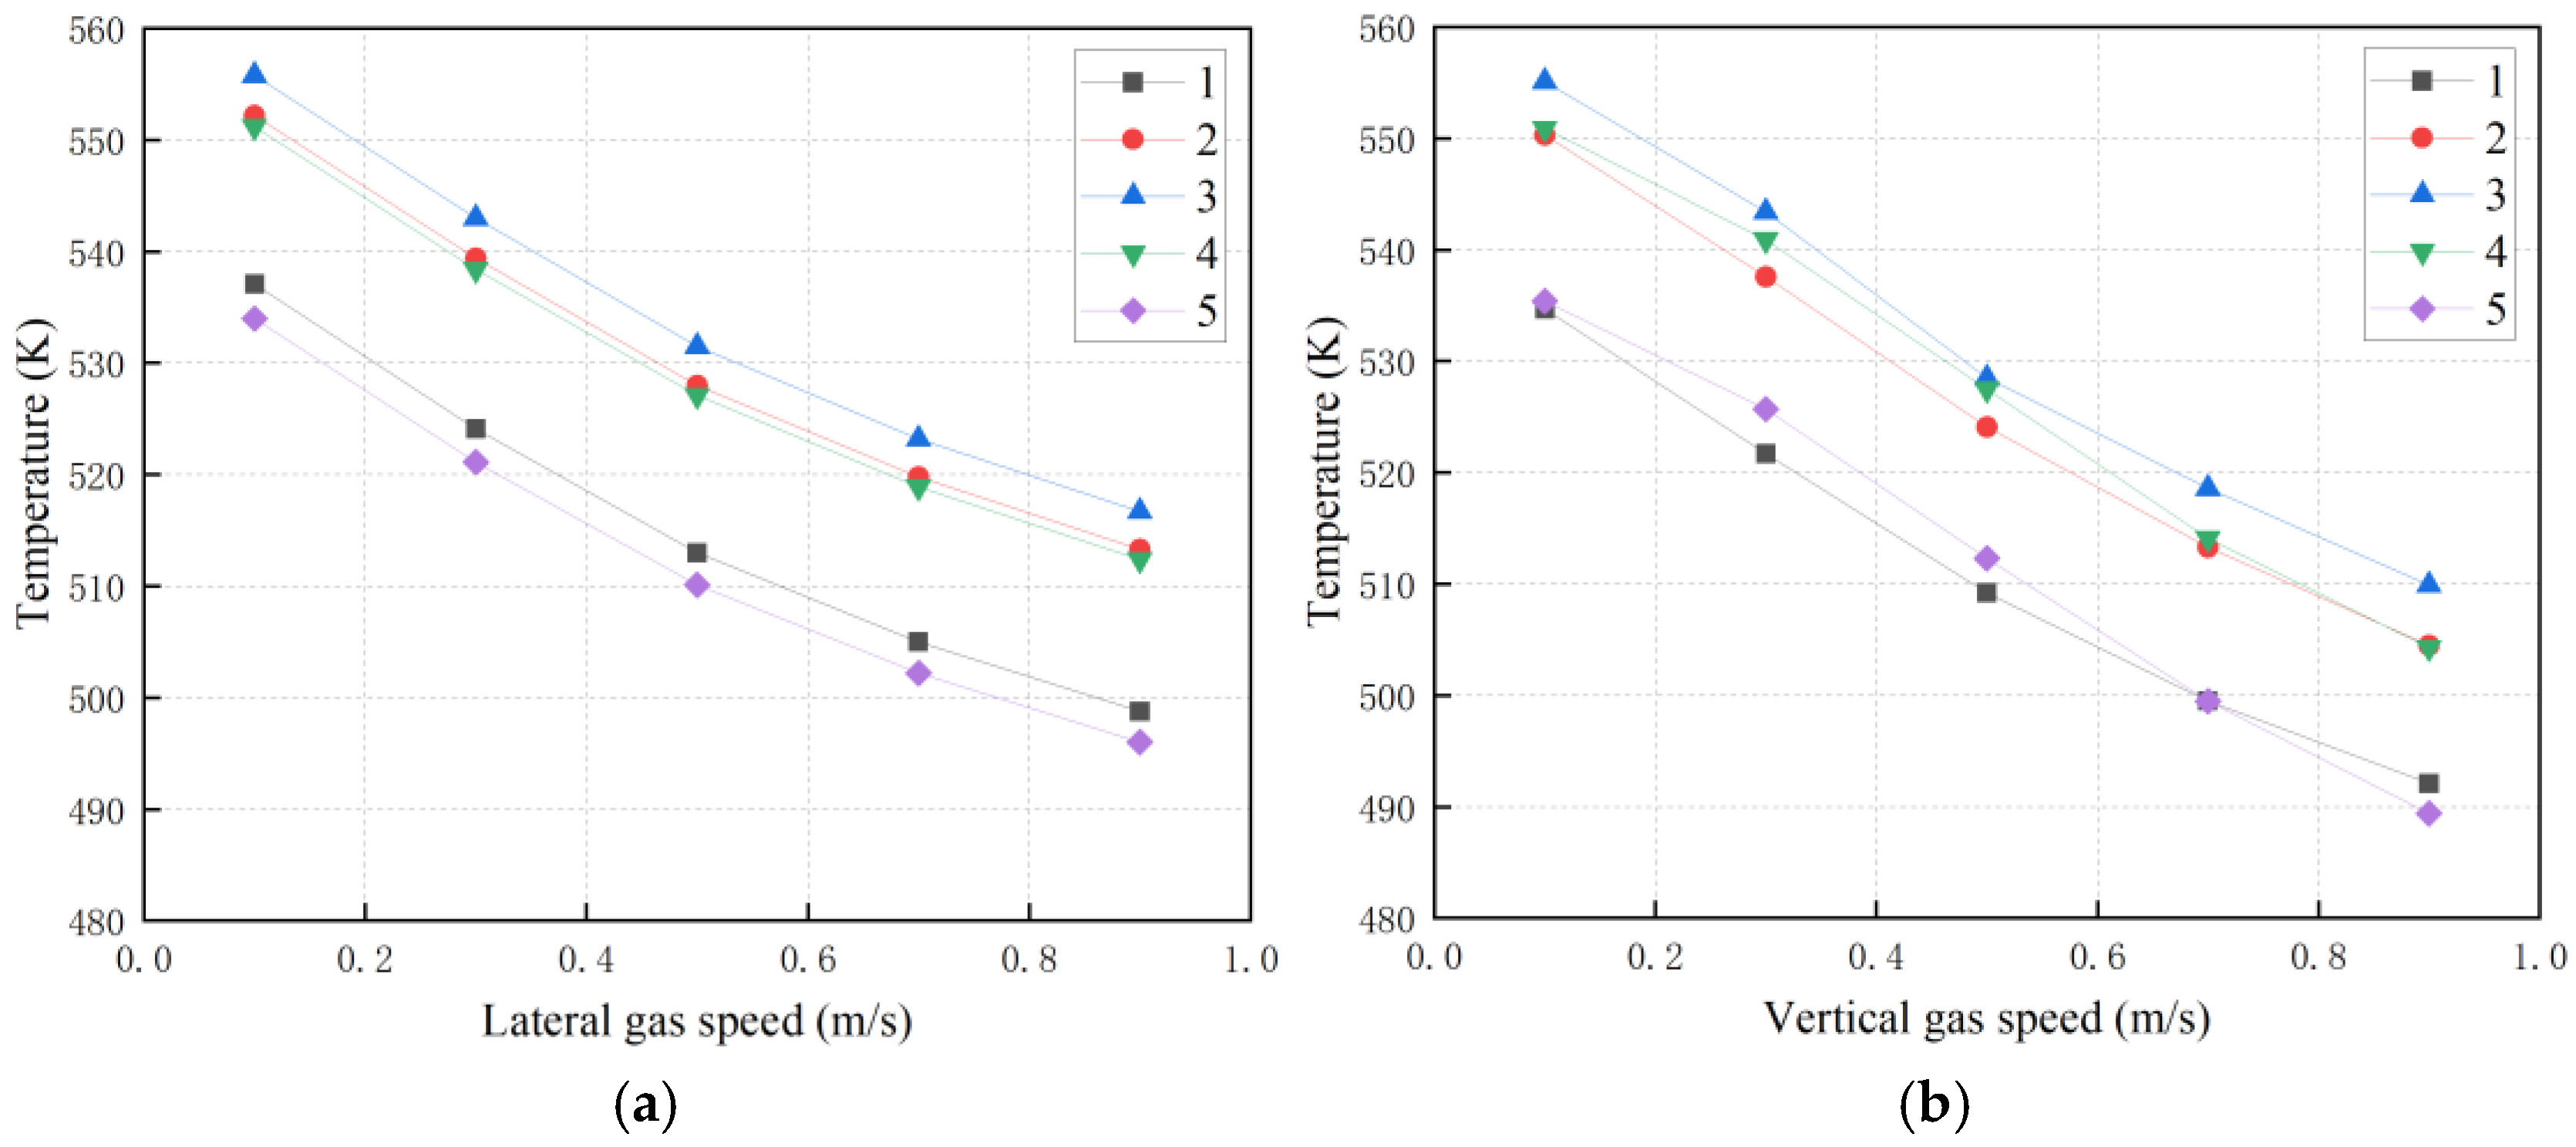
3.1. Effect of Ventilation Process Parameters on the Temperature of Radioactive Metal Oxides
3.2. Effect of Metal Oxide Filling and Moisture Content on Temperature
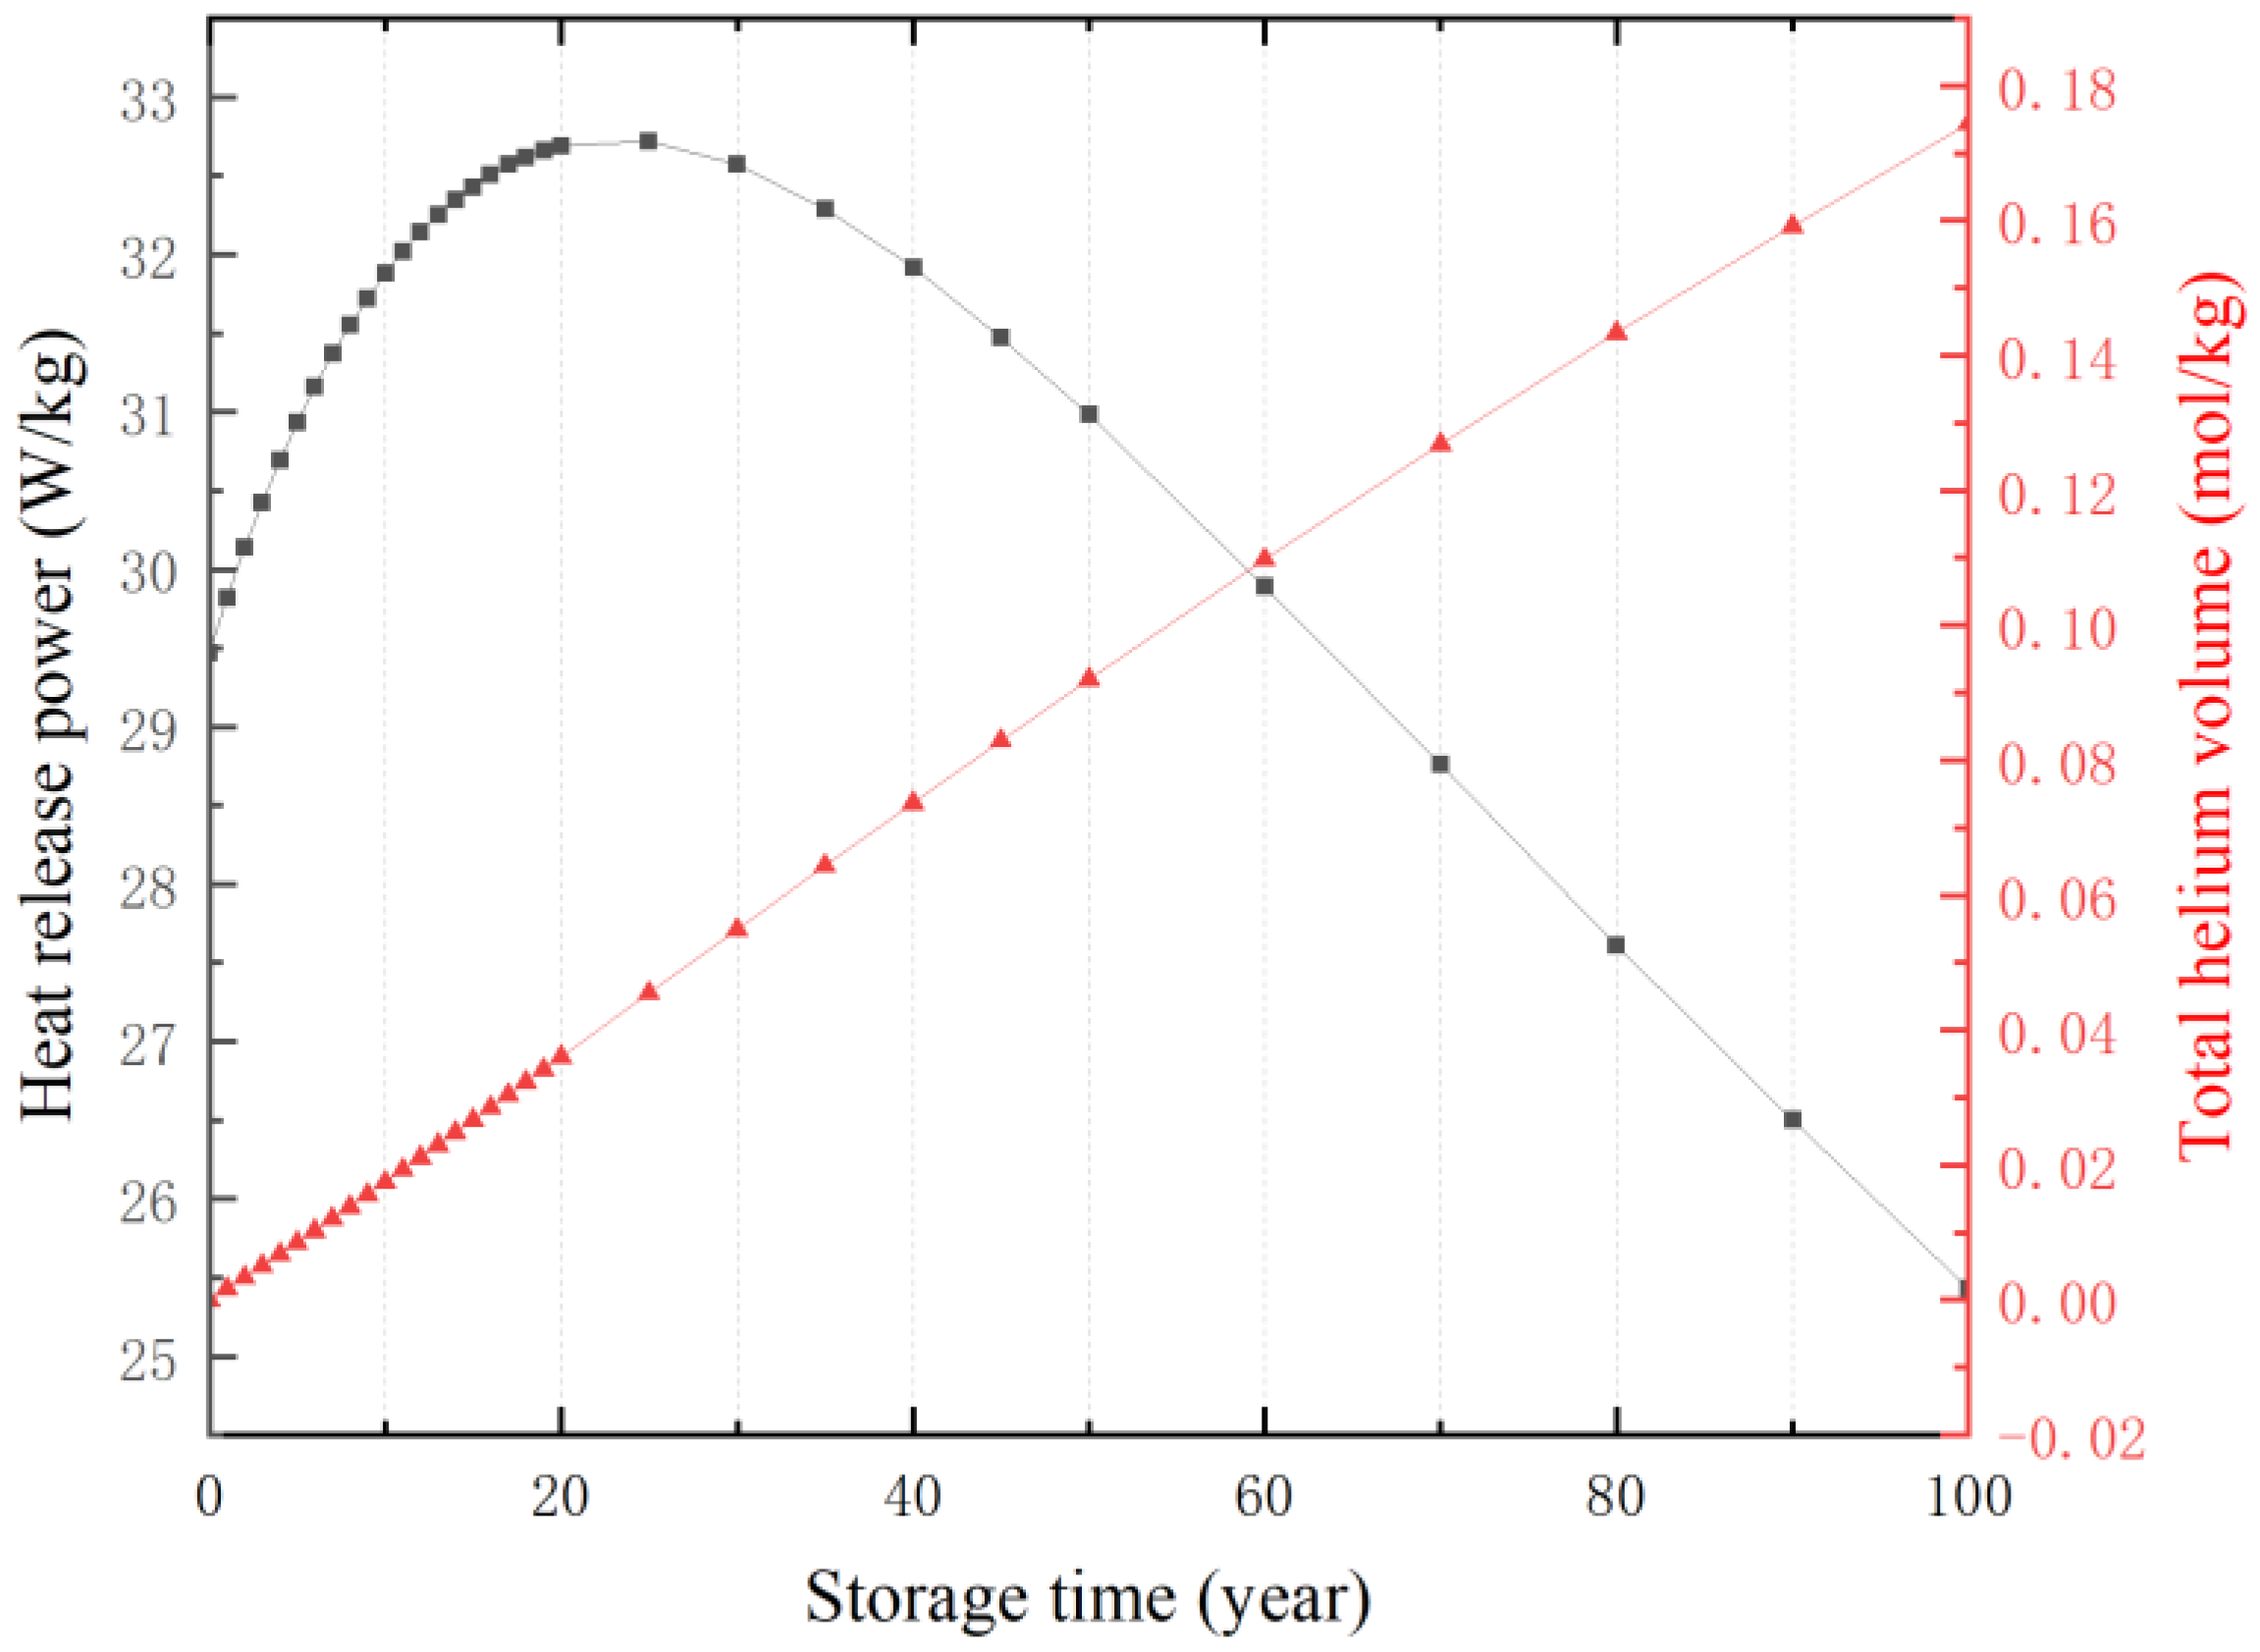
3.3. The Effect of Storage Year and Bulk Density on Temperature
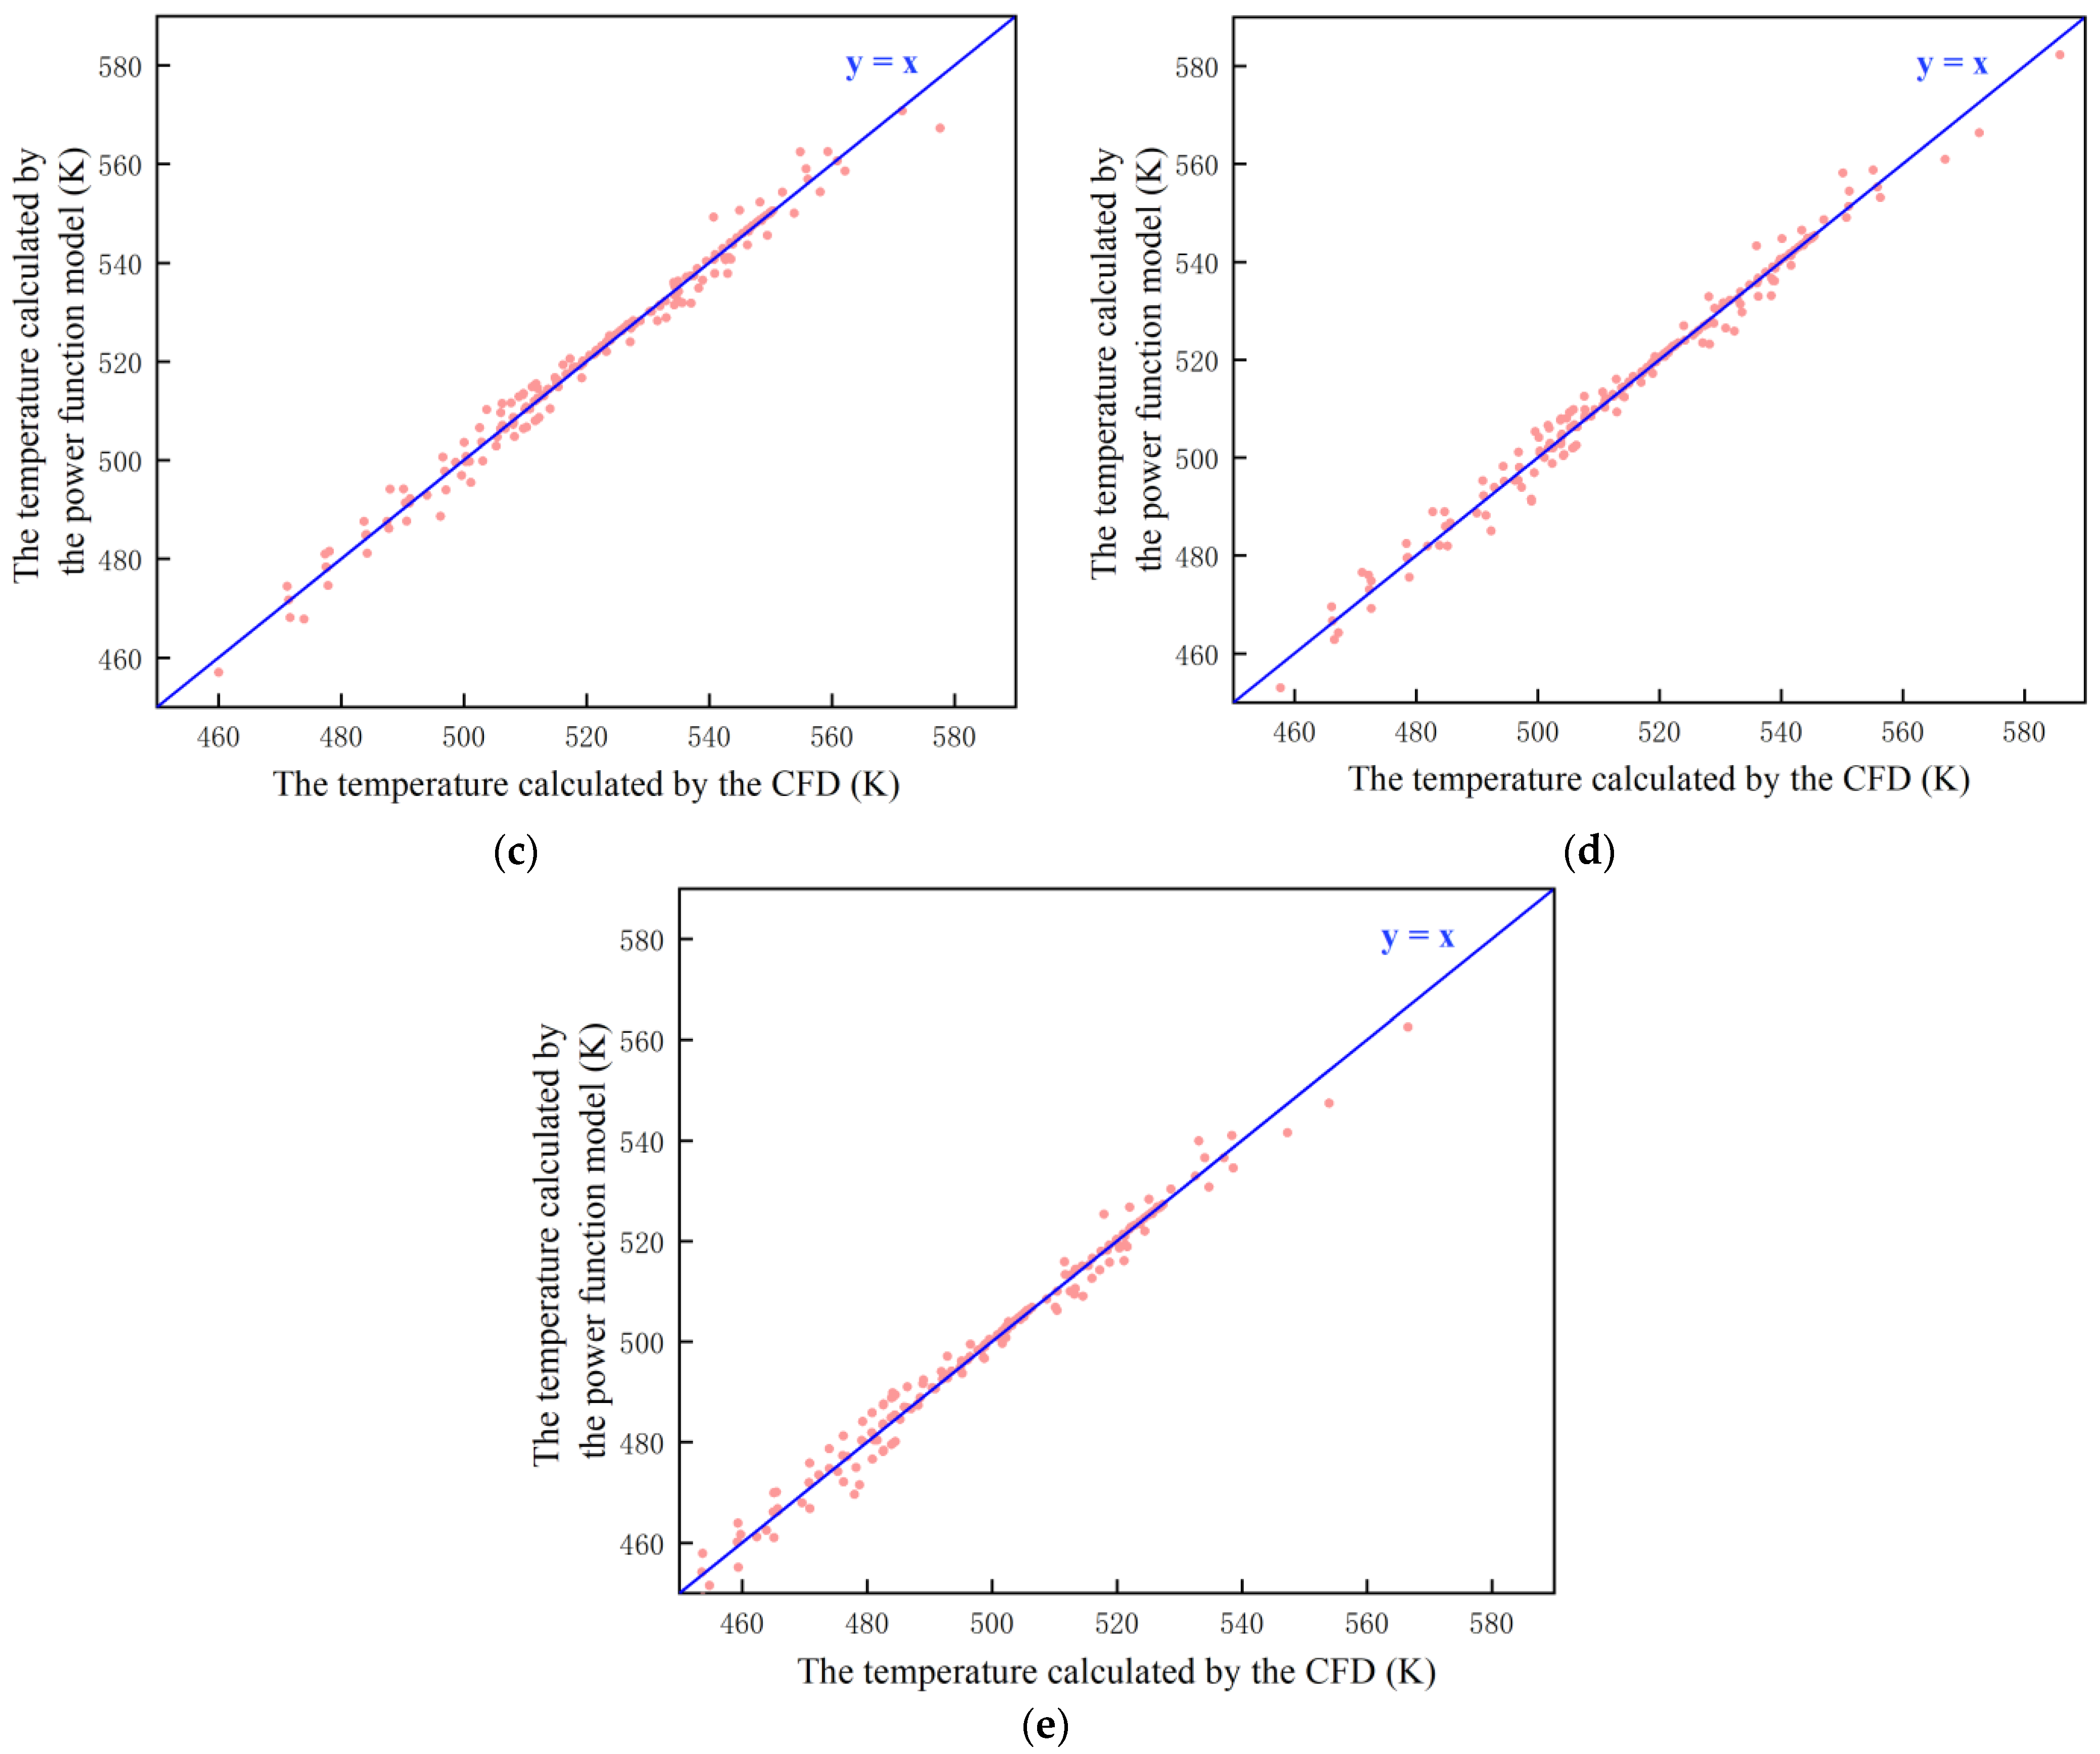
3.4. Construction of a Mathematical Model of Temperature Power Function
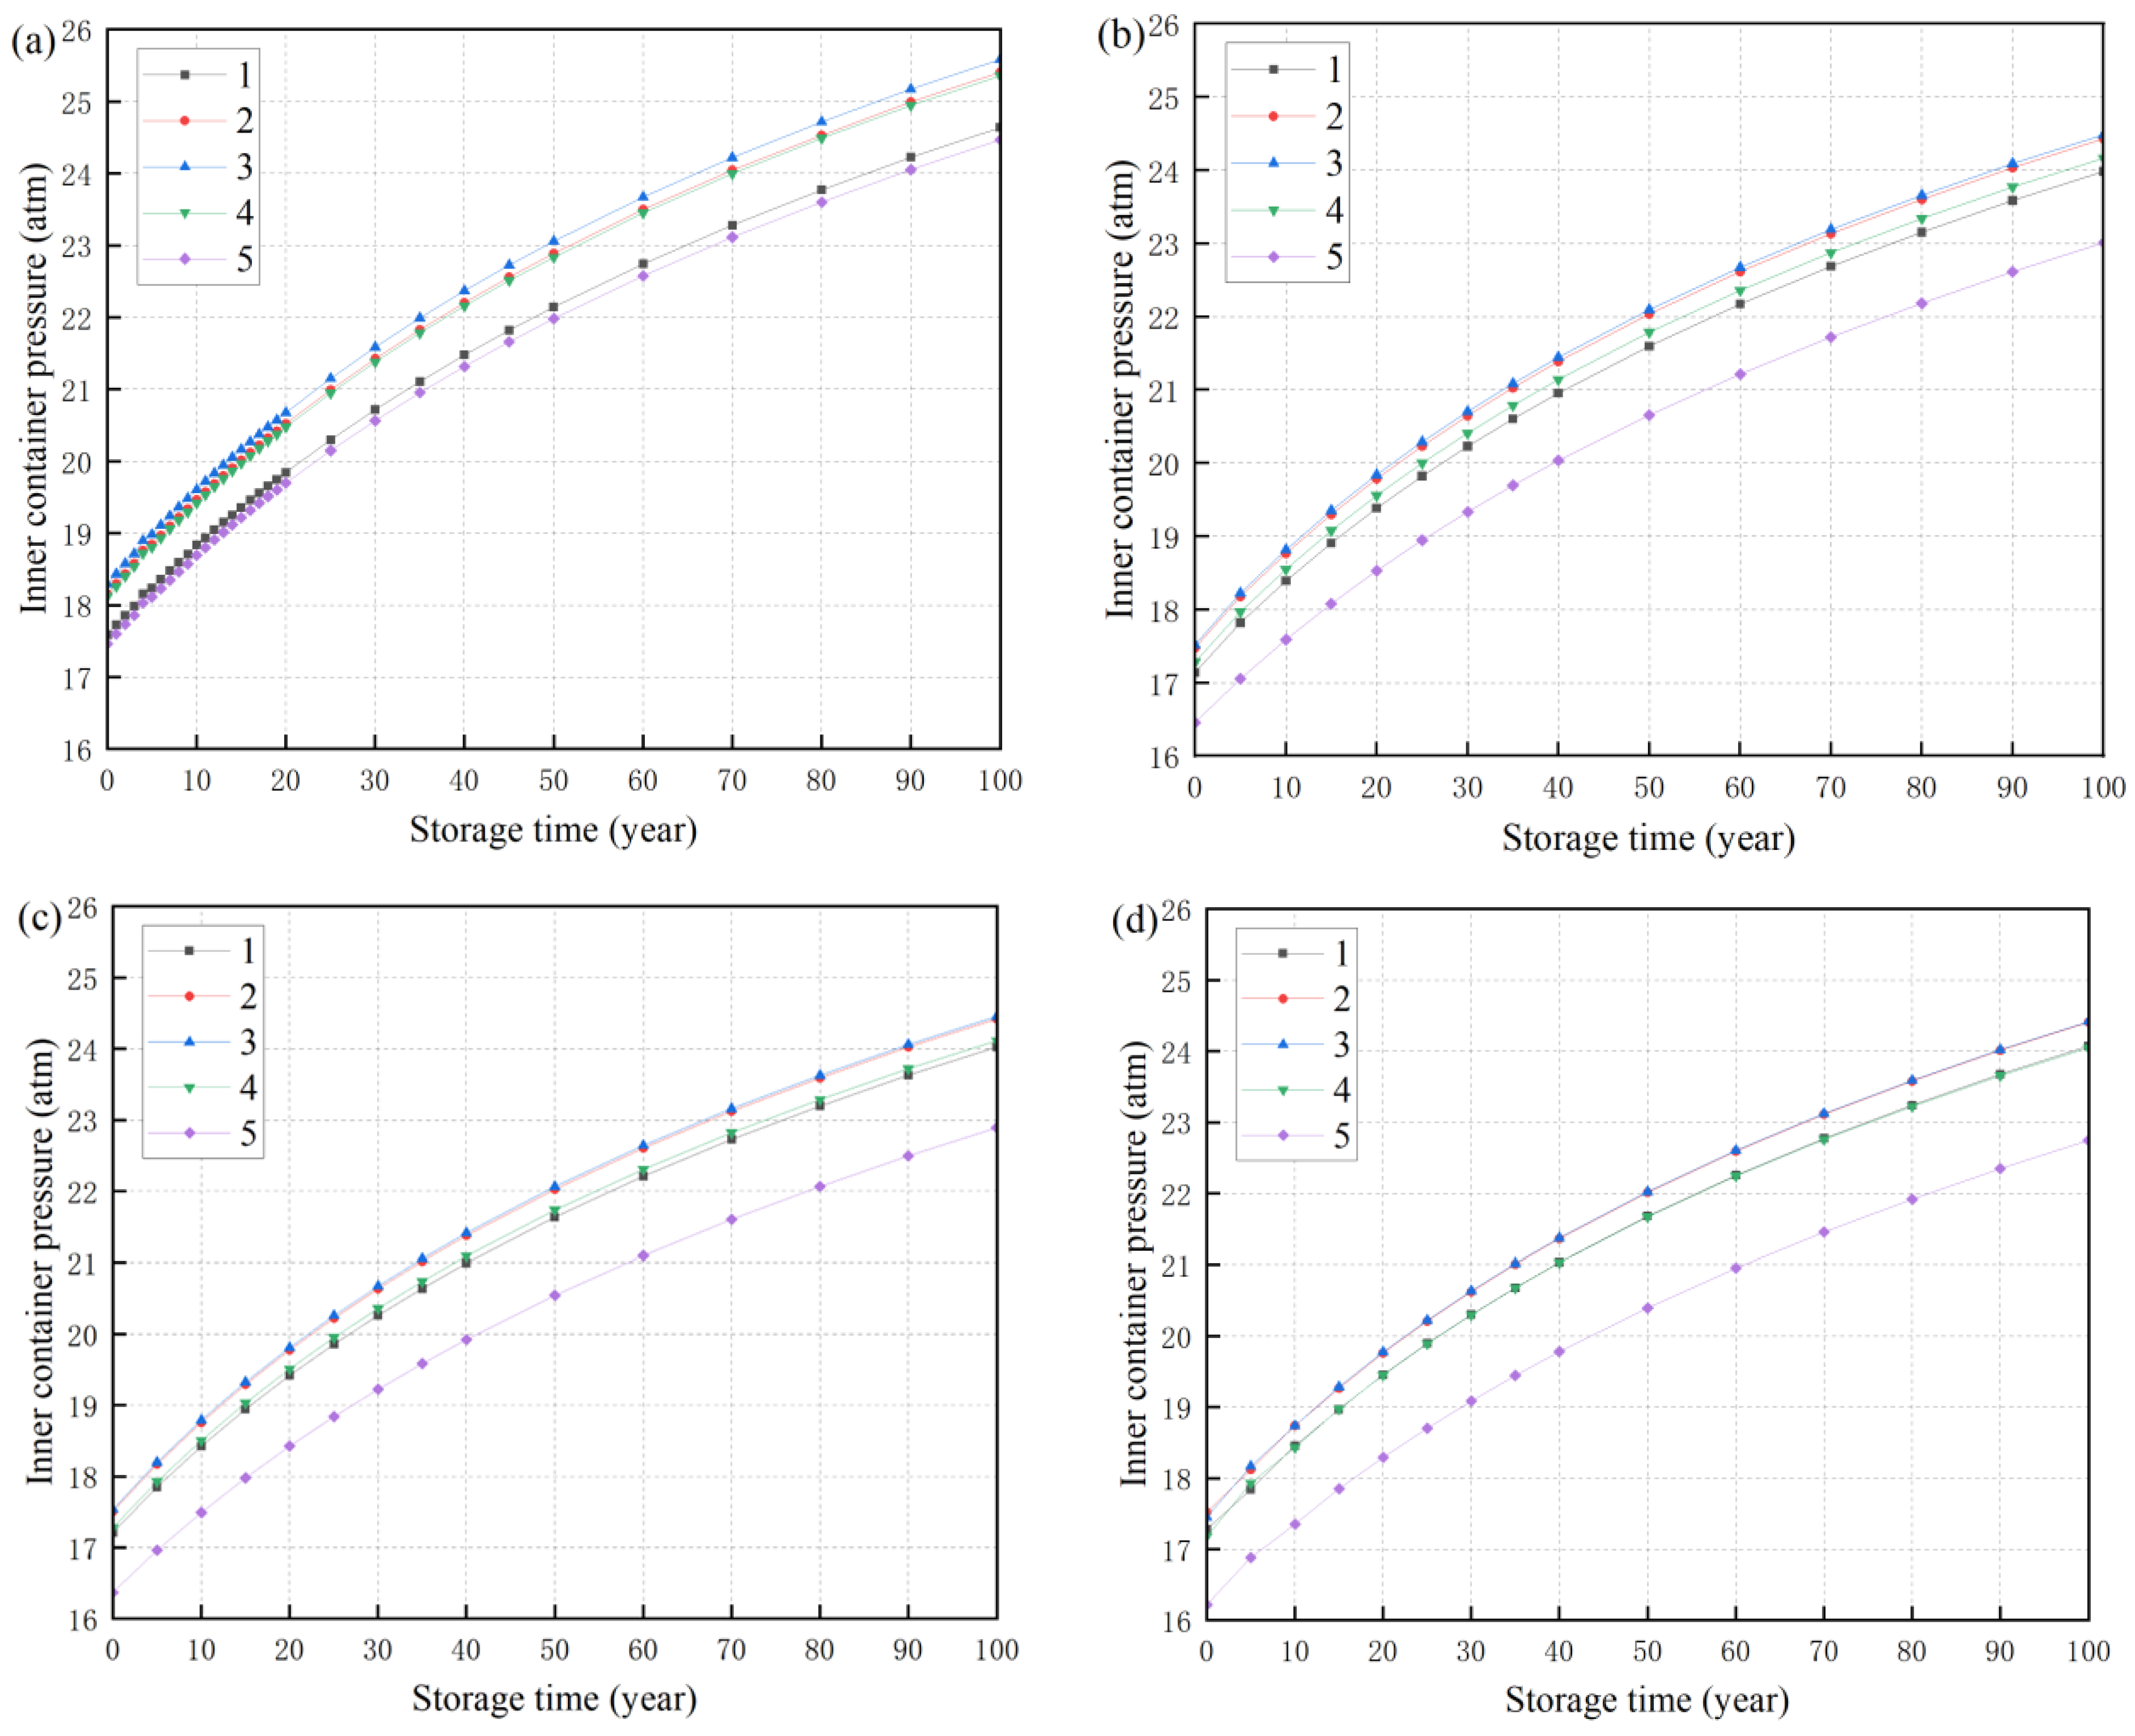
3.5. The Pressure of the Storage Vessel Changes Regularly
4. Conclusions
Author Contributions
Funding
Data Availability Statement
Conflicts of Interest
Appendix A. Governing Equation
Appendix B

| Number | Gas Velocity (m/s) | Loading Capacity (kg) | Heating Power (W/kg) | Water Content (%) | Temper-ature (K) | He Content (mol/kg) | Metal Bulk Density (g/mL) | Container 1 | Container 2 | Container 3 | Container 4 | Container 5 |
|---|---|---|---|---|---|---|---|---|---|---|---|---|
| 1 | 0.1 | 3 | 28.74 | 0.5 | 308 | 0.03914 | 1.330565 | 537.145 | 552.2699 | 555.8429 | 551.2527 | 534.0904 |
| 2 | 0.3 | 3 | 28.74 | 0.5 | 308 | 0.03914 | 1.330565 | 524.1371 | 539.4051 | 543.0437 | 538.4351 | 521.1744 |
| 3 | 0.5 | 3 | 28.74 | 0.5 | 308 | 0.03914 | 1.330565 | 513.0479 | 528.0569 | 531.5979 | 527.1256 | 510.1512 |
| 4 | 0.7 | 3 | 28.74 | 0.5 | 308 | 0.03914 | 1.330565 | 505.0917 | 519.8278 | 523.2722 | 518.9284 | 502.2502 |
| 5 | 0.9 | 3 | 28.74 | 0.5 | 308 | 0.03914 | 1.330565 | 498.889 | 513.3609 | 516.712 | 512.4884 | 496.096 |
| 6 | 0.1 | 2.6 | 32.72 | 0.5 | 308 | 0.04549 | 1.330565 | 536.143 | 551.1882 | 554.8955 | 550.1825 | 533.1255 |
| 7 | 0.3 | 2.6 | 32.72 | 0.5 | 308 | 0.04549 | 1.330565 | 524.2207 | 539.429 | 543.2068 | 538.4631 | 521.2767 |
| 8 | 0.5 | 2.6 | 32.72 | 0.5 | 308 | 0.04549 | 1.330565 | 513.3267 | 528.2923 | 531.9812 | 527.3647 | 510.4476 |
| 9 | 0.7 | 2.6 | 32.72 | 0.5 | 308 | 0.04549 | 1.330565 | 505.4829 | 520.1942 | 523.7903 | 519.2977 | 502.6577 |
| 10 | 0.9 | 2.6 | 32.72 | 0.5 | 308 | 0.04549 | 1.330565 | 499.3544 | 513.8142 | 517.3214 | 512.9443 | 496.5767 |
| 11 | 0.5 | 2.8 | 28.74 | 0.5 | 308 | 0.03914 | 1.330565 | 501.6521 | 515.9109 | 519.4291 | 515.0027 | 498.8542 |
| 12 | 0.5 | 2.8 | 28.74 | 0.7 | 308 | 0.03914 | 1.330565 | 497.9214 | 512.0361 | 514.8926 | 511.1395 | 495.1443 |
| 13 | 0.5 | 2.8 | 28.74 | 0.9 | 308 | 0.03914 | 1.330565 | 494.6691 | 508.652 | 512.0793 | 507.7658 | 491.9124 |
| 14 | 0.5 | 2.8 | 28.74 | 1.1 | 308 | 0.03914 | 1.330565 | 491.78 | 505.6388 | 509.0253 | 504.7629 | 489.043 |
| 15 | 0.5 | 2.8 | 28.74 | 1.3 | 308 | 0.03914 | 1.330565 | 489.1809 | 502.922 | 506.2673 | 501.7179 | 486.4652 |
| 16 | 0.5 | 2.8 | 28.74 | 1.5 | 308 | 0.03914 | 1.330565 | 486.8212 | 500.4526 | 503.7636 | 499.5953 | 484.1195 |
| 17 | 0.5 | 3.2 | 32.72 | 0.4 | 308 | 0.04549 | 1.330565 | 540.3311 | 556.8816 | 560.9103 | 555.8722 | 537.1554 |
| 18 | 0.5 | 3.2 | 32.72 | 0.6 | 308 | 0.04549 | 1.330565 | 535.7493 | 552.1458 | 556.1247 | 551.1467 | 532.5905 |
| 19 | 0.5 | 3.2 | 32.72 | 0.8 | 308 | 0.04549 | 1.330565 | 531.7873 | 548.0399 | 551.9722 | 547.0512 | 528.6466 |
| 20 | 0.5 | 3.2 | 32.72 | 1 | 308 | 0.04549 | 1.330565 | 528.2886 | 544.406 | 548.2939 | 543.4272 | 525.1654 |
| 21 | 0.5 | 3.2 | 32.72 | 1.2 | 308 | 0.04549 | 1.330565 | 525.1534 | 541.1427 | 544.988 | 540.1731 | 522.0462 |
| 22 | 0.5 | 3.2 | 32.72 | 1.4 | 308 | 0.04549 | 1.330565 | 521.027 | 536.9429 | 540.7602 | 535.9863 | 517.9504 |
| 23 | 0.5 | 2.6 | 28.74 | 0.5 | 308 | 0.03914 | 1.330565 | 494.7598 | 507.4124 | 514.0809 | 506.3173 | 490.7511 |
| 24 | 0.5 | 2.7 | 28.74 | 0.5 | 308 | 0.03914 | 1.330565 | 497.6935 | 511.6992 | 515.1636 | 510.8051 | 494.946 |
| 25 | 0.5 | 2.8 | 28.74 | 0.5 | 308 | 0.03914 | 1.330565 | 501.6516 | 515.9103 | 519.4284 | 515.0022 | 498.8538 |
| 26 | 0.5 | 2.9 | 28.74 | 0.5 | 308 | 0.03914 | 1.330565 | 505.0896 | 519.6459 | 527.1507 | 518.7581 | 502.2546 |
| 27 | 0.5 | 3 | 28.74 | 0.5 | 308 | 0.03914 | 1.330565 | 513.0899 | 528.0869 | 528.7826 | 527.1566 | 510.1992 |
| 28 | 0.5 | 3.1 | 28.74 | 0.5 | 308 | 0.03914 | 1.330565 | 514.5036 | 529.5786 | 534.9477 | 528.9687 | 513.3507 |
| 29 | 0.5 | 3.2 | 28.74 | 0.5 | 308 | 0.03914 | 1.330565 | 520.2954 | 535.4878 | 538.9511 | 533.3102 | 517.2822 |
| 30 | 0.5 | 2.6 | 32.72 | 0.5 | 308 | 0.04549 | 1.330565 | 515.7111 | 525.4544 | 534.3521 | 524.0296 | 512.5536 |
| 31 | 0.5 | 2.7 | 32.72 | 0.5 | 308 | 0.04549 | 1.330565 | 516.2839 | 531.4307 | 534.9428 | 530.5165 | 513.3847 |
| 32 | 0.5 | 2.8 | 32.72 | 0.5 | 308 | 0.04549 | 1.330565 | 523.746 | 539.8243 | 542.5306 | 538.7047 | 520.4277 |
| 33 | 0.5 | 2.9 | 32.72 | 0.5 | 308 | 0.04549 | 1.330565 | 525.3223 | 540.9587 | 549.5107 | 539.9356 | 522.2878 |
| 34 | 0.5 | 3 | 32.72 | 0.5 | 308 | 0.04549 | 1.330565 | 529.5656 | 545.4073 | 553.8803 | 544.3884 | 526.4894 |
| 35 | 0.5 | 3.1 | 32.72 | 0.5 | 308 | 0.04549 | 1.330565 | 536.4696 | 553.9206 | 558.1326 | 550.75 | 534.7642 |
| 36 | 0.5 | 3.2 | 32.72 | 0.5 | 308 | 0.04549 | 1.330565 | 541.802 | 557.8561 | 562.1699 | 556.3515 | 538.6311 |
| 37 | 0.5 | 3 | 24.76 | 0.5 | 308 | 0 | 1.330565 | 489.2412 | 502.6664 | 505.9976 | 501.7804 | 486.5467 |
| 38 | 0.5 | 3 | 25.12 | 0.5 | 308 | 0.001388 | 1.330565 | 491.2409 | 504.7942 | 508.1549 | 503.9029 | 488.5263 |
| 39 | 0.5 | 3 | 25.47 | 0.5 | 308 | 0.0028 | 1.330565 | 492.8645 | 506.3954 | 510.2242 | 505.7972 | 490.4331 |
| 40 | 0.5 | 3 | 25.78 | 0.5 | 308 | 0.004234 | 1.330565 | 494.8596 | 508.6447 | 512.0582 | 507.7439 | 492.1088 |
| 41 | 0.5 | 3 | 26.08 | 0.5 | 308 | 0.00659 | 1.330565 | 496.4139 | 510.3013 | 513.7369 | 509.38 | 493.5461 |
| 42 | 0.5 | 3 | 26.36 | 0.5 | 308 | 0.007165 | 1.330565 | 497.9795 | 511.9643 | 515.4228 | 511.0556 | 495.1979 |
| 43 | 0.5 | 3 | 26.61 | 0.5 | 308 | 0.008659 | 1.330565 | 499.3018 | 513.251 | 516.8459 | 512.3689 | 496.5072 |
| 44 | 0.5 | 3 | 26.85 | 0.5 | 308 | 0.01017 | 1.330565 | 500.5632 | 514.714 | 518.2095 | 513.7988 | 497.7562 |
| 45 | 0.5 | 3 | 27.07 | 0.5 | 308 | 0.0117 | 1.330565 | 501.695 | 515.9198 | 519.4317 | 515.0017 | 498.8769 |
| 46 | 0.5 | 3 | 27.27 | 0.5 | 308 | 0.01324 | 1.330565 | 502.5147 | 516.8244 | 520.5347 | 515.7126 | 499.6035 |
| 47 | 0.5 | 3 | 27.45 | 0.5 | 308 | 0.01479 | 1.330565 | 503.935 | 518.125 | 521.5771 | 517.1004 | 500.8893 |
| 48 | 0.5 | 3 | 27.62 | 0.5 | 308 | 0.01636 | 1.330565 | 504.518 | 518.9261 | 522.4785 | 518.0012 | 501.6722 |
| 49 | 0.5 | 3 | 27.78 | 0.5 | 308 | 0.01794 | 1.330565 | 505.2871 | 519.7441 | 523.3067 | 518.8177 | 502.4343 |
| 50 | 0.5 | 3 | 27.92 | 0.5 | 308 | 0.01953 | 1.330565 | 505.9747 | 520.4773 | 524.0498 | 519.5492 | 503.115 |
| 51 | 0.5 | 3 | 28.04 | 0.5 | 308 | 0.02113 | 1.330565 | 506.5397 | 521.0797 | 524.6602 | 520.1504 | 503.6745 |
| 52 | 0.5 | 3 | 28.16 | 0.5 | 308 | 0.02273 | 1.330565 | 507.1002 | 521.6771 | 525.2652 | 520.7465 | 504.2294 |
| 53 | 0.5 | 3 | 28.26 | 0.5 | 308 | 0.02435 | 1.330565 | 507.5546 | 522.1624 | 525.757 | 521.2309 | 504.6796 |
| 54 | 0.5 | 3 | 28.35 | 0.5 | 308 | 0.02597 | 1.330565 | 507.9534 | 522.5887 | 526.189 | 521.6564 | 505.0745 |
| 55 | 0.5 | 3 | 28.43 | 0.5 | 308 | 0.0276 | 1.330565 | 508.2966 | 522.9559 | 526.5609 | 522.0228 | 505.4142 |
| 56 | 0.5 | 3 | 28.5 | 0.5 | 308 | 0.02924 | 1.330565 | 508.4558 | 523.1213 | 526.7263 | 522.1887 | 505.5734 |
| 57 | 0.5 | 3 | 28.56 | 0.5 | 308 | 0.03088 | 1.330565 | 508.8024 | 523.5001 | 527.1125 | 522.5659 | 505.9146 |
| 58 | 0.5 | 3 | 28.74 | 0.5 | 308 | 0.03914 | 1.330565 | 509.3224 | 524.0659 | 527.6867 | 523.1311 | 506.4285 |
| 59 | 0.5 | 3 | 28.73 | 0.5 | 308 | 0.04746 | 1.330565 | 508.7933 | 523.5195 | 527.1344 | 522.5865 | 505.9028 |
| 60 | 0.5 | 3 | 28.59 | 0.5 | 308 | 0.05577 | 1.330565 | 507.5639 | 522.2288 | 525.8279 | 521.2992 | 504.6826 |
| 61 | 0.5 | 3 | 28.35 | 0.5 | 308 | 0.06405 | 1.330565 | 505.7951 | 520.3644 | 523.9397 | 519.4398 | 502.9293 |
| 62 | 0.5 | 3 | 28.04 | 0.5 | 308 | 0.07225 | 1.330565 | 503.6618 | 518.1126 | 521.6591 | 517.1938 | 500.8147 |
| 63 | 0.5 | 3 | 27.66 | 0.5 | 308 | 0.08037 | 1.330565 | 501.142 | 515.4477 | 518.9568 | 514.1892 | 498.3212 |
| 64 | 0.5 | 3 | 26.82 | 0.5 | 308 | 0.09627 | 1.330565 | 495.6855 | 509.674 | 513.1093 | 508.7773 | 492.9119 |
| 65 | 0.5 | 3 | 25.9 | 0.5 | 308 | 0.1117 | 1.330565 | 489.7879 | 503.4244 | 506.7752 | 502.5445 | 487.0711 |
| 66 | 0.5 | 3 | 24.97 | 0.5 | 308 | 0.1265 | 1.330565 | 483.8468 | 496.6405 | 500.3779 | 496.2528 | 481.181 |
| 67 | 0.5 | 3 | 24.05 | 0.5 | 308 | 0.1409 | 1.330565 | 477.9371 | 490.847 | 494.0234 | 490.0028 | 475.34 |
| 68 | 0.5 | 3 | 23.15 | 0.5 | 308 | 0.1547 | 1.330565 | 472.149 | 484.6961 | 487.7855 | 483.8701 | 469.6131 |
| 69 | 0.5 | 3 | 29.47 | 0.5 | 308 | 0 | 1.330565 | 515.648 | 530.6976 | 534.4027 | 529.7456 | 512.7045 |
| 70 | 0.5 | 3 | 29.82 | 0.5 | 308 | 0.001662 | 1.330565 | 517.4361 | 532.5969 | 536.3265 | 531.6408 | 514.4759 |
| 71 | 0.5 | 3 | 30.14 | 0.5 | 308 | 0.003347 | 1.330565 | 519.0548 | 534.3156 | 538.0674 | 533.3561 | 516.0804 |
| 72 | 0.5 | 3 | 30.42 | 0.5 | 308 | 0.005053 | 1.330565 | 520.4489 | 535.7965 | 539.5673 | 534.834 | 517.4619 |
| 73 | 0.5 | 3 | 30.69 | 0.5 | 308 | 0.006778 | 1.330565 | 521.795 | 537.2268 | 541.016 | 536.2614 | 518.7961 |
| 74 | 0.5 | 3 | 30.93 | 0.5 | 308 | 0.00852 | 1.330565 | 522.9503 | 538.4541 | 542.2589 | 537.4863 | 519.9409 |
| 75 | 0.5 | 3 | 31.16 | 0.5 | 308 | 0.01028 | 1.330565 | 524.0623 | 539.6359 | 543.4558 | 538.6657 | 521.0429 |
| 76 | 0.5 | 3 | 31.37 | 0.5 | 308 | 0.01205 | 1.330565 | 525.0624 | 540.699 | 544.5324 | 539.7268 | 522.034 |
| 77 | 0.5 | 3 | 31.55 | 0.5 | 308 | 0.01384 | 1.330565 | 525.9009 | 541.591 | 545.4357 | 540.6171 | 522.8651 |
| 78 | 0.5 | 3 | 31.72 | 0.5 | 308 | 0.01564 | 1.330565 | 526.6836 | 542.4237 | 546.279 | 541.4482 | 523.6407 |
| 79 | 0.5 | 3 | 31.88 | 0.5 | 308 | 0.01746 | 1.330565 | 527.4105 | 543.1973 | 547.0624 | 542.2204 | 524.3612 |
| 80 | 0.5 | 3 | 32.02 | 0.5 | 308 | 0.01928 | 1.330565 | 528.0317 | 543.8589 | 547.7324 | 542.8808 | 524.9768 |
| 81 | 0.5 | 3 | 32.14 | 0.5 | 308 | 0.02112 | 1.330565 | 528.5457 | 544.407 | 548.2874 | 543.4279 | 525.486 |
| 82 | 0.5 | 3 | 32.25 | 0.5 | 308 | 0.02296 | 1.330565 | 529.0065 | 544.8986 | 548.7853 | 543.9187 | 525.9426 |
| 83 | 0.5 | 3 | 32.35 | 0.5 | 308 | 0.02481 | 1.330565 | 529.4146 | 545.3346 | 549.2268 | 544.3539 | 526.3469 |
| 84 | 0.5 | 3 | 32.43 | 0.5 | 308 | 0.02667 | 1.330565 | 529.8269 | 545.771 | 549.6687 | 544.7895 | 526.7556 |
| 85 | 0.5 | 3 | 32.51 | 0.5 | 308 | 0.02853 | 1.330565 | 530.0198 | 545.9828 | 549.8835 | 545.001 | 526.9462 |
| 86 | 0.5 | 3 | 32.57 | 0.5 | 308 | 0.0304 | 1.330565 | 530.2174 | 546.1957 | 550.0995 | 545.2137 | 527.1418 |
| 87 | 0.5 | 3 | 32.62 | 0.5 | 308 | 0.03228 | 1.330565 | 530.3629 | 546.3535 | 550.2596 | 545.3712 | 527.2856 |
| 88 | 0.5 | 3 | 32.66 | 0.5 | 308 | 0.03416 | 1.330565 | 530.4567 | 546.4566 | 550.3644 | 545.4743 | 527.3783 |
| 89 | 0.5 | 3 | 32.69 | 0.5 | 308 | 0.03604 | 1.330565 | 530.499 | 546.5052 | 550.4139 | 545.5228 | 527.4199 |
| 90 | 0.5 | 3 | 32.72 | 0.5 | 308 | 0.04549 | 1.330565 | 530.0911 | 546.0914 | 549.9966 | 545.1104 | 527.0134 |
| 91 | 0.5 | 3 | 32.57 | 0.5 | 308 | 0.05494 | 1.330565 | 528.7625 | 544.7008 | 548.59 | 543.7232 | 525.6936 |
| 92 | 0.5 | 3 | 32.29 | 0.5 | 308 | 0.06436 | 1.330565 | 526.7705 | 542.6067 | 546.4709 | 541.634 | 523.7168 |
| 93 | 0.5 | 3 | 31.92 | 0.5 | 308 | 0.07369 | 1.330565 | 524.3225 | 540.0284 | 543.8611 | 539.0615 | 521.2882 |
| 94 | 0.5 | 3 | 31.47 | 0.5 | 308 | 0.08292 | 1.330565 | 521.4639 | 537.0134 | 540.8088 | 536.0534 | 518.4529 |
| 95 | 0.5 | 3 | 30.98 | 0.5 | 308 | 0.09202 | 1.330565 | 518.4009 | 533.78 | 537.5347 | 532.8274 | 515.4155 |
| 96 | 0.5 | 3 | 29.89 | 0.5 | 308 | 0.1098 | 1.330565 | 511.703 | 526.7011 | 530.3653 | 525.7653 | 508.7756 |
| 97 | 0.5 | 3 | 28.76 | 0.5 | 308 | 0.1269 | 1.330565 | 504.7922 | 519.388 | 522.9567 | 518.4701 | 501.9268 |
| 98 | 0.5 | 3 | 27.61 | 0.5 | 308 | 0.1434 | 1.330565 | 497.7598 | 511.9378 | 515.4072 | 511.0389 | 494.9602 |
| 99 | 0.5 | 3 | 26.5 | 0.5 | 308 | 0.1592 | 1.330565 | 490.9318 | 504.6968 | 508.0678 | 503.8171 | 488.1983 |
| 100 | 0.5 | 3 | 25.43 | 0.5 | 308 | 0.1744 | 1.330565 | 484.3059 | 497.6632 | 500.9369 | 496.803 | 481.6388 |
| 101 | 0.1 | 2.6 | 20 | 0.5 | 298 | 0.001 | 1.330565 | 462.3237 | 473.5818 | 477.5601 | 472.6449 | 459.7792 |
| 102 | 0.3 | 2.6 | 25 | 0.8 | 308 | 0.005848 | 1.330565 | 479.4274 | 499.8259 | 501.1722 | 498.9505 | 476.8293 |
| 103 | 0.5 | 2.6 | 30 | 1.1 | 318 | 0.0342 | 1.330565 | 500.8981 | 515.2844 | 519.2456 | 514.0279 | 498.6368 |
| 104 | 0.7 | 2.6 | 35 | 1.5 | 323 | 0.02 | 1.330565 | 520.7981 | 529.0453 | 537.0106 | 528.1448 | 511.6222 |
| 105 | 0.5 | 2.8 | 20 | 1.5 | 308 | 0.001 | 1.330565 | 447.51 | 458.472 | 460.0356 | 457.7251 | 445.2596 |
| 106 | 0.7 | 2.8 | 25 | 1.1 | 298 | 0.005848 | 1.330565 | 459.3589 | 475.5352 | 478.1026 | 471.1461 | 463.9168 |
| 107 | 0.1 | 2.8 | 30 | 0.8 | 323 | 0.0342 | 1.330565 | 541.3937 | 556.1682 | 559.3713 | 555.1595 | 538.4053 |
| 108 | 0.3 | 2.8 | 35 | 0.5 | 318 | 0.02 | 1.330565 | 547.0688 | 573.4572 | 571.4847 | 572.6079 | 553.9997 |
| 109 | 0.7 | 3 | 20 | 0.8 | 318 | 0.02 | 1.330565 | 457.0108 | 467.9837 | 473.9524 | 467.2499 | 454.7843 |
| 110 | 0.5 | 3 | 25 | 0.5 | 323 | 0.001 | 1.330565 | 495.4417 | 508.5117 | 515.1643 | 507.6671 | 492.8573 |
| 111 | 0.3 | 3 | 30 | 1.5 | 298 | 0.005848 | 1.330565 | 517.6426 | 533.369 | 537.0793 | 532.3644 | 514.5874 |
| 112 | 0.1 | 3 | 35 | 1.1 | 308 | 0.0342 | 1.330565 | 570.3422 | 587.1756 | 591.4796 | 585.8906 | 566.6113 |
| 113 | 0.3 | 3.2 | 20 | 1.1 | 323 | 0.0342 | 1.330565 | 481.1741 | 493.1647 | 496.2254 | 492.3641 | 478.7879 |
| 114 | 0.1 | 3.2 | 25 | 1.5 | 318 | 0.02 | 1.330565 | 522.9911 | 536.7238 | 542.6828 | 536.1961 | 519.9005 |
| 115 | 0.7 | 3.2 | 30 | 0.8 | 308 | 0.001 | 1.330565 | 514.7444 | 530.0428 | 534.2508 | 529.0965 | 511.7496 |
| 116 | 0.5 | 3.2 | 35 | 0.5 | 298 | 0.005848 | 1.330565 | 550.5168 | 567.9636 | 577.6766 | 567.0098 | 547.3171 |
| 117 | 0.5 | 3 | 24.76 | 0.5 | 308 | 0 | 2 | 477.5562 | 486.7126 | 487.9805 | 482.7621 | 465.4873 |
| 118 | 0.5 | 3 | 26.36 | 0.5 | 308 | 0.007165 | 2 | 489.0691 | 498.5675 | 500.08 | 494.3526 | 473.9487 |
| 119 | 0.5 | 3 | 27.45 | 0.5 | 308 | 0.01479 | 2 | 494.7324 | 504.4777 | 506.0446 | 500.2107 | 479.328 |
| 120 | 0.5 | 3 | 28.16 | 0.5 | 308 | 0.02273 | 2 | 498.1537 | 508.0483 | 509.6519 | 503.7575 | 482.6236 |
| 121 | 0.5 | 3 | 28.56 | 0.5 | 308 | 0.03088 | 2 | 499.7955 | 509.7627 | 511.3878 | 505.4649 | 484.1731 |
| 122 | 0.5 | 3 | 28.74 | 0.5 | 308 | 0.03914 | 2 | 500.2001 | 510.1875 | 511.8237 | 505.8955 | 484.5531 |
| 123 | 0.5 | 3 | 28.73 | 0.5 | 308 | 0.04746 | 2 | 499.5518 | 509.5147 | 511.1532 | 505.2395 | 483.9377 |
| 124 | 0.5 | 3 | 28.59 | 0.5 | 308 | 0.05577 | 2 | 498.1937 | 508.1015 | 509.7358 | 503.8502 | 482.6515 |
| 125 | 0.5 | 3 | 28.35 | 0.5 | 308 | 0.06405 | 2 | 496.2943 | 506.1235 | 507.7487 | 501.9018 | 480.8548 |
| 126 | 0.5 | 3 | 27.66 | 0.5 | 308 | 0.08037 | 2 | 491.374 | 500.9958 | 502.5918 | 496.8457 | 476.2069 |
| 127 | 0.5 | 3 | 26.82 | 0.5 | 308 | 0.09627 | 2 | 485.6726 | 495.049 | 496.6071 | 490.9811 | 470.8306 |
| 128 | 0.5 | 3 | 25.9 | 0.5 | 308 | 0.1117 | 2 | 479.5682 | 488.6772 | 490.1917 | 484.6984 | 465.0851 |
| 129 | 0.5 | 3 | 24.97 | 0.5 | 308 | 0.1265 | 2 | 473.4552 | 482.2921 | 483.7614 | 478.4052 | 459.3426 |
| 130 | 0.5 | 3 | 24.05 | 0.5 | 308 | 0.1409 | 2 | 467.4213 | 475.9846 | 477.4075 | 472.1914 | 453.6851 |
| 131 | 0.5 | 3 | 23.15 | 0.5 | 308 | 0.1547 | 2 | 461.5372 | 469.83 | 471.2066 | 466.1314 | 448.1788 |
| 132 | 0.5 | 3 | 24.76 | 0.5 | 308 | 0 | 2.2 | 481.1984 | 489.8272 | 491.1491 | 485.4323 | 465.6951 |
| 133 | 0.5 | 3 | 26.36 | 0.5 | 308 | 0.007165 | 2.2 | 490.0122 | 499.0136 | 500.4081 | 494.5129 | 473.9745 |
| 134 | 0.5 | 3 | 27.45 | 0.5 | 308 | 0.01479 | 2.2 | 495.6983 | 504.9372 | 506.3786 | 500.3735 | 479.3223 |
| 135 | 0.5 | 3 | 28.16 | 0.5 | 308 | 0.02273 | 2.2 | 499.1357 | 508.5182 | 509.9879 | 503.9187 | 482.5558 |
| 136 | 0.5 | 3 | 28.56 | 0.5 | 308 | 0.03088 | 2.2 | 500.789 | 510.2413 | 511.7248 | 505.6265 | 484.1076 |
| 137 | 0.5 | 3 | 28.74 | 0.5 | 308 | 0.03914 | 2.2 | 501.2015 | 510.6728 | 512.1599 | 506.0561 | 484.4885 |
| 138 | 0.5 | 3 | 28.73 | 0.5 | 308 | 0.04746 | 2.2 | 500.5572 | 510.0043 | 511.4864 | 505.3973 | 483.8719 |
| 139 | 0.5 | 3 | 28.59 | 0.5 | 308 | 0.05577 | 2.2 | 499.2019 | 508.5955 | 510.0667 | 504.006 | 482.5851 |
| 140 | 0.5 | 3 | 28.35 | 0.5 | 308 | 0.06405 | 2.2 | 497.3027 | 506.6199 | 508.0758 | 502.0544 | 480.7865 |
| 141 | 0.5 | 3 | 27.66 | 0.5 | 308 | 0.08037 | 2.2 | 492.3742 | 501.4895 | 502.905 | 496.9866 | 476.1299 |
| 142 | 0.5 | 3 | 26.82 | 0.5 | 308 | 0.09627 | 2.2 | 486.6617 | 495.5392 | 496.9082 | 491.1124 | 470.7468 |
| 143 | 0.5 | 3 | 25.9 | 0.5 | 308 | 0.1117 | 2.2 | 480.5426 | 489.1614 | 490.4804 | 484.8202 | 464.9949 |
| 144 | 0.5 | 3 | 24.97 | 0.5 | 308 | 0.1265 | 2.2 | 474.4104 | 482.7662 | 484.035 | 478.5286 | 459.2444 |
| 145 | 0.5 | 3 | 24.05 | 0.5 | 308 | 0.1409 | 2.2 | 468.3602 | 476.4526 | 477.6721 | 472.3207 | 453.5842 |
| 146 | 0.5 | 3 | 23.15 | 0.5 | 308 | 0.1547 | 2.2 | 462.4565 | 470.2885 | 471.4598 | 466.2628 | 448.0738 |
| 147 | 0.5 | 3 | 24.76 | 0.5 | 308 | 0 | 2.5 | 485.7888 | 493.3928 | 487.5218 | 481.8975 | 462.3753 |
| 148 | 0.5 | 3 | 26.36 | 0.5 | 308 | 0.007165 | 2.5 | 487.5527 | 495.8787 | 499.6799 | 499.0057 | 478.0085 |
| 149 | 0.5 | 3 | 27.45 | 0.5 | 308 | 0.01479 | 2.5 | 496.861 | 505.111 | 505.3115 | 499.4318 | 478.254 |
| 150 | 0.5 | 3 | 28.16 | 0.5 | 308 | 0.02273 | 2.5 | 499.1125 | 507.7073 | 509.7463 | 504.2404 | 482.5915 |
| 151 | 0.5 | 3 | 28.56 | 0.5 | 308 | 0.03088 | 2.5 | 502.0073 | 510.5059 | 511.87 | 505.9387 | 484.1445 |
| 152 | 0.5 | 3 | 28.74 | 0.5 | 308 | 0.03914 | 2.5 | 502.4185 | 510.9412 | 512.3083 | 506.3743 | 484.532 |
| 153 | 0.5 | 3 | 28.73 | 0.5 | 308 | 0.04746 | 2.5 | 501.7936 | 510.3062 | 511.6709 | 505.7507 | 483.9482 |
| 154 | 0.5 | 3 | 28.59 | 0.5 | 308 | 0.05577 | 2.5 | 500.4357 | 508.9064 | 510.2617 | 504.3682 | 482.6723 |
| 155 | 0.5 | 3 | 28.35 | 0.5 | 308 | 0.06405 | 2.5 | 498.5278 | 506.9329 | 508.272 | 502.4179 | 480.8796 |
| 156 | 0.5 | 3 | 27.66 | 0.5 | 308 | 0.08037 | 2.5 | 493.5808 | 501.8096 | 503.1096 | 497.3543 | 476.2369 |
| 157 | 0.5 | 3 | 26.82 | 0.5 | 308 | 0.09627 | 2.5 | 487.8493 | 495.8674 | 497.1218 | 491.4845 | 470.8691 |
| 158 | 0.5 | 3 | 25.9 | 0.5 | 308 | 0.1117 | 2.5 | 481.7105 | 489.4972 | 490.702 | 485.1963 | 465.1325 |
| 159 | 0.5 | 3 | 24.97 | 0.5 | 308 | 0.1265 | 2.5 | 475.5602 | 483.1122 | 484.2693 | 478.898 | 459.3983 |
| 160 | 0.5 | 3 | 24.05 | 0.5 | 308 | 0.1409 | 2.5 | 469.4703 | 476.78 | 477.8861 | 472.6552 | 453.7289 |
| 161 | 0.5 | 3 | 23.15 | 0.5 | 308 | 0.1547 | 2.5 | 463.5415 | 470.6161 | 471.6764 | 466.5838 | 448.2252 |
| 162 | 0.5 | 3 | 29.47 | 0.5 | 308 | 0 | 2.2 | 511.0976 | 522.2425 | 516.2214 | 510.6872 | 488.9699 |
| 163 | 0.5 | 3 | 30.93 | 0.5 | 308 | 0.00852 | 2.2 | 515.6384 | 525.6774 | 527.2807 | 520.9109 | 498.1864 |
| 164 | 0.5 | 3 | 31.88 | 0.5 | 308 | 0.01746 | 2.2 | 520.1127 | 530.3315 | 531.9723 | 525.5268 | 502.4201 |
| 165 | 0.5 | 3 | 32.43 | 0.5 | 308 | 0.02667 | 2.2 | 522.3633 | 532.6723 | 534.3307 | 527.8506 | 504.5453 |
| 166 | 0.5 | 3 | 32.69 | 0.5 | 308 | 0.03604 | 2.2 | 523.0397 | 533.378 | 535.0417 | 528.5522 | 505.1754 |
| 167 | 0.5 | 3 | 32.72 | 0.5 | 308 | 0.04549 | 2.2 | 522.49 | 532.8096 | 534.4693 | 527.991 | 504.6419 |
| 168 | 0.5 | 3 | 32.57 | 0.5 | 308 | 0.05494 | 2.2 | 520.9929 | 531.2563 | 532.9039 | 526.453 | 503.209 |
| 169 | 0.5 | 3 | 32.29 | 0.5 | 308 | 0.06436 | 2.2 | 518.8185 | 528.9985 | 530.6285 | 524.2171 | 501.1349 |
| 170 | 0.5 | 3 | 31.92 | 0.5 | 308 | 0.07369 | 2.2 | 516.1824 | 526.2601 | 527.8687 | 521.5054 | 498.6253 |
| 171 | 0.5 | 3 | 30.98 | 0.5 | 308 | 0.09202 | 2.2 | 509.8882 | 519.7172 | 521.2748 | 515.0293 | 492.6474 |
| 172 | 0.5 | 3 | 29.89 | 0.5 | 308 | 0.1098 | 2.2 | 502.843 | 512.3884 | 513.8887 | 507.7804 | 485.9754 |
| 173 | 0.5 | 3 | 28.76 | 0.5 | 308 | 0.1269 | 2.2 | 495.6291 | 504.8786 | 506.3199 | 500.3582 | 479.1618 |
| 174 | 0.5 | 3 | 27.61 | 0.5 | 308 | 0.1434 | 2.2 | 488.3378 | 497.283 | 498.6646 | 492.8632 | 472.2941 |
| 175 | 0.5 | 3 | 26.5 | 0.5 | 308 | 0.1592 | 2.2 | 481.2999 | 489.9462 | 491.2704 | 485.6385 | 465.6823 |
| 176 | 0.5 | 3 | 25.43 | 0.5 | 308 | 0.1744 | 2.2 | 474.5082 | 482.8616 | 484.1302 | 478.6662 | 459.3176 |
| 177 | 0.5 | 2.6 | 28.74 | 0.5 | 298 | 0.03914 | 1.330565 | 488.0676 | 502.0149 | 505.4797 | 501.1105 | 485.3027 |
| 178 | 0.5 | 2.6 | 28.74 | 0.5 | 303 | 0.03914 | 1.330565 | 490.8527 | 504.6989 | 508.1357 | 503.8071 | 488.1229 |
| 179 | 0.5 | 2.6 | 28.74 | 0.5 | 308 | 0.03914 | 1.330565 | 493.6486 | 507.3937 | 510.8026 | 506.5143 | 490.9532 |
| 180 | 0.5 | 2.6 | 28.74 | 0.5 | 313 | 0.03914 | 1.330565 | 500.0682 | 514.1248 | 512.8479 | 513.0407 | 495.2577 |
| 181 | 0.5 | 2.6 | 28.74 | 0.5 | 318 | 0.03914 | 1.330565 | 503.0446 | 515.4956 | 515.112 | 514.2698 | 498.8061 |
| 182 | 0.5 | 2.6 | 28.74 | 0.5 | 323 | 0.03914 | 1.330565 | 505.8909 | 518.2272 | 517.8158 | 517.013 | 501.6729 |
| 183 | 0.5 | 2.8 | 32.72 | 1 | 298 | 0.04549 | 1.330565 | 513.4841 | 529.2146 | 533.0436 | 528.2633 | 510.436 |
| 184 | 0.5 | 2.8 | 32.72 | 1 | 303 | 0.04549 | 1.330565 | 516.2592 | 531.871 | 535.6601 | 530.924 | 513.2344 |
| 185 | 0.5 | 2.8 | 32.72 | 1 | 308 | 0.04549 | 1.330565 | 519.0386 | 534.5332 | 538.3175 | 533.6084 | 516.0389 |
| 186 | 0.5 | 2.8 | 32.72 | 1 | 313 | 0.04549 | 1.330565 | 521.8284 | 537.2078 | 540.9536 | 536.2868 | 518.8487 |
| 187 | 0.5 | 2.8 | 32.72 | 1 | 318 | 0.04549 | 1.330565 | 524.6245 | 539.888 | 543.5997 | 538.9739 | 521.6668 |
| 188 | 0.5 | 2.8 | 32.72 | 1 | 323 | 0.04549 | 1.330565 | 527.4299 | 542.5779 | 546.2572 | 541.6707 | 524.4939 |
References
- Sims, H.E.; Webb, K.J.; Brown, J.; Morris, D.; Taylor, R.J. Hydrogen yields from water on the surface of plutonium dioxide. J. Nucl. Mater. 2013, 437, 359–364. [Google Scholar] [CrossRef]
- Veirs, D.K. Gas generation from water adsorbed onto pure plutonium dioxide powder. Mater. Res. Soc. Symp. Proc. 2006, 893, 8930703. [Google Scholar] [CrossRef]
- Haschke, J.M.; Allen, T.H.; Morales, L.A. Reaction of plutonium dioxide with water: Formation and properties of PuO2+x. Science 2000, 287, 285–287. [Google Scholar] [CrossRef] [PubMed]
- Bushuev, A.V. Determination of the plutonium mass in containers with plutonium dioxide according to the γ radiation from spontaneous-fission products. At. Energy 2010, 108, 46–52. [Google Scholar] [CrossRef]
- Hirooka, S. Toward long-term storage of nuclear materials in MOX fuels fabrication facility. Front. Nucl. Eng. 2023, 2, 1119567. [Google Scholar] [CrossRef]
- Rahman, H.S.; Hunter, T.N.; Heggs, P.J. Simplified heat transfer model for highly active raffinate contained in buffer storage tanks. Chem. Eng. Res. Des. 2023, 190, 464–475. [Google Scholar] [CrossRef]
- Bae, J.; Bean, R.; Abboud, R. CFD analysis of a dry storage cask with advanced spent nuclear fuel cask additives. Ann. Nucl. Energy 2020, 145, 107610. [Google Scholar] [CrossRef]
- Benavides, J.; Jimenez, G.; Galban, M.; Lioret, M. Methodology for thermal analysis of spent nuclear fuel dry cask using CFD codes. Ann. Nucl. Energy 2019, 133, 257–274. [Google Scholar] [CrossRef]
- Zuo, Q.; Zhu, L.; Liu, J. Research and verification on CFD natural convection model of QM400. Ann. Nucl. Energy 2019, 126, 443–451. [Google Scholar] [CrossRef]
- Tseng, Y.S.; Wang, J.R.; Tsai, F.P.; Cheng, Y.H.; Shih, C. Thermal design investigation of a new tube-type dry-storage system through CFD simulations. Ann. Nucl. Energy 2011, 38, 1088–1097. [Google Scholar] [CrossRef]
- Maxwell, C.I.; Pencer, J. Molecular dynamics modelling of the thermal conductivity of off-stoichiometric UO2±x and (UyPu1−y)O2±x using equilibrium molecular dynamics. J. Ann. Nucl. Energy 2019, 131, 317–324. [Google Scholar] [CrossRef]
- DOE-STD-3013-2012; Stabilization, Packaging, and Storage of Plutonium-Bearing Materials. U.S. Department of Energy: Washington, DC, USA, 2012.
- Wang, Y.H.; Lin, Y.P.; Chang, H.Y.; Lai, C.M. Ventilation pattern and heat dissipation characteristics of a vertical dry storage cask for spent nuclear fuel: Wind tunnel experiments and CFD simulations. Ann. Nucl. Energy 2021, 160, 108364. [Google Scholar] [CrossRef]
- Tang, J.; Chen, J.; Liu, P. First principles study of oxygen diffusion in plutonium dioxide, sesquioxide, and their interface under activated conditions. J. Nucl. Mater. 2023, 578, 154348. [Google Scholar] [CrossRef]
- Bottau, V.; Tondut, L.; Allinei, P.G.; Perot, B.; Eleon, C.; Carasco, C.; Stefano, R.D.; Faussier, G. High-Resolution Gamma Spectrometry of a Plutonium Bearing Waste Drum with High-Energy Reaction-Induced Gamma Rays. IEEE Trans. Nucl. Sci. 2020, 67, 575–584. [Google Scholar] [CrossRef]


| Air | Water Vapor | Hydrogen | Helium | 304 Stainless Steel | Radioactive Metal Oxides | |
|---|---|---|---|---|---|---|
| Density (kg/m3) | 1.146 | 0.71223 | 0.080 | 0.158 | 7900 | 11,460 |
| Specific heat (J/kg·K) | 1030 | 2984 | 14,520 | 5193 | 500 | 297 |
| Thermal conductivity (W/m·K) | 0.0407 | 0.0436 | 0.266 | 0.22 | 18 | 7 |
| Viscosity (Pa·s) | 2.7 × 10⁻⁵ | 1.67 × 10⁻⁵ | 1.26 × 10⁻⁵ | 2.83 × 10⁻⁵ | / | / |
| Emissivity | / | / | / | / | 0.45 | / |
| Number | a0 | a1 | a2 | a3 | a4 | a5 |
|---|---|---|---|---|---|---|
| 1 | 489.3 | 2.038 | −6.98 × 10⁻² | 9.79 × 10⁻⁴ | −7.16 × 10⁻⁶ | 2.14 × 10⁻⁸ |
| 2 | 502.7 | 2.167 | −7.41 × 10⁻² | 1.05 × 10⁻³ | −7.74 × 10⁻⁶ | 2.35 × 10⁻⁸ |
| 4 | 506.1 | 2.184 | −7.45 × 10⁻² | 1.04 × 10⁻³ | −7.59 × 10⁻⁶ | 2.26 × 10⁻⁸ |
| 4 | 501.9 | 2.145 | −7.26 × 10⁻² | 9.97 × 10⁻⁴ | −7.10 × 10⁻⁶ | 2.06 × 10⁻⁸ |
| 5 | 486.7 | 2.001 | −6.80 × 10⁻² | 9.43 × 10⁻⁴ | −6.80 × 10⁻⁶ | 2.01 × 10⁻⁸ |
| Number | b0 | b1 | b2 | b3 | b4 | b5 | b6 | b7 |
|---|---|---|---|---|---|---|---|---|
| 1 | 1.40 × 101 | −3.49 × 10⁻² | 2.25 × 10⁻¹ | 3.07 × 10⁻¹ | −1.67 × 10⁻² | 4.01 × 10⁻¹ | −1.33 × 10⁻¹ | −3.14 × 10⁻² |
| 2 | 1.70 × 101 | −3.55 × 10⁻² | 2.33 × 10⁻¹ | 3.15 × 10⁻¹ | −1.73 × 10⁻² | 3.66 × 10⁻¹ | −1.39 × 10⁻¹ | −5.08 × 10⁻² |
| 4 | 1.95 × 101 | −3.52 × 10⁻² | 2.40 × 10⁻¹ | 3.18 × 10⁻¹ | −1.64 × 10⁻² | 3.41 × 10⁻¹ | −1.35 × 10⁻¹ | −6.00 × 10⁻² |
| 4 | 1.61 × 101 | −3.58 × 10⁻² | 2.33 × 10⁻¹ | 3.15 × 10⁻¹ | −1.75 × 10⁻² | 3.76 × 10⁻¹ | −1.34 × 10⁻¹ | −6.46 × 10⁻² |
| 5 | 1.59 × 101 | −3.54 × 10⁻² | 2.26 × 10⁻¹ | 3.04 × 10⁻¹ | −1.69 × 10⁻² | 3.81 × 10⁻¹ | −1.32 × 10⁻¹ | −8.58 × 10⁻² |
| Number | P2 | F | 10FT | R2 | Mean Relative Error | Maximum Relative Error |
|---|---|---|---|---|---|---|
| 1 | 0.9999 | 1,076,718 | 19.9 | 0.987 | 0.32 | 1.49% |
| 2 | 0.9999 | 936,846 | 19.9 | 0.987 | 0.35 | 1.50% |
| 4 | 0.9999 | 902,949 | 19.9 | 0.987 | 0.35 | 1.80% |
| 4 | 0.9999 | 838,227 | 19.9 | 0.986 | 0.36 | 1.59% |
| 5 | 0.9999 | 769,284 | 19.9 | 0.986 | 0.38 | 1.76% |
Disclaimer/Publisher’s Note: The statements, opinions and data contained in all publications are solely those of the individual author(s) and contributor(s) and not of MDPI and/or the editor(s). MDPI and/or the editor(s) disclaim responsibility for any injury to people or property resulting from any ideas, methods, instructions or products referred to in the content. |
© 2025 by the authors. Licensee MDPI, Basel, Switzerland. This article is an open access article distributed under the terms and conditions of the Creative Commons Attribution (CC BY) license (https://creativecommons.org/licenses/by/4.0/).
Share and Cite
Chen, J.; Zhou, G.; Wu, D.; Zhang, P.; Xie, F.; Liu, J.; Yang, W. A Computational Fluid Dynamics Simulation Study on the Variation of Temperature and Pressure in the Container During the Dry Storage Process of Radioactive Metal Oxides. Processes 2025, 13, 1240. https://doi.org/10.3390/pr13041240
Chen J, Zhou G, Wu D, Zhang P, Xie F, Liu J, Yang W. A Computational Fluid Dynamics Simulation Study on the Variation of Temperature and Pressure in the Container During the Dry Storage Process of Radioactive Metal Oxides. Processes. 2025; 13(4):1240. https://doi.org/10.3390/pr13041240
Chicago/Turabian StyleChen, Junxiang, Guanchen Zhou, Dehui Wu, Peng Zhang, Fei Xie, Jiapeng Liu, and Weimin Yang. 2025. "A Computational Fluid Dynamics Simulation Study on the Variation of Temperature and Pressure in the Container During the Dry Storage Process of Radioactive Metal Oxides" Processes 13, no. 4: 1240. https://doi.org/10.3390/pr13041240
APA StyleChen, J., Zhou, G., Wu, D., Zhang, P., Xie, F., Liu, J., & Yang, W. (2025). A Computational Fluid Dynamics Simulation Study on the Variation of Temperature and Pressure in the Container During the Dry Storage Process of Radioactive Metal Oxides. Processes, 13(4), 1240. https://doi.org/10.3390/pr13041240