Abstract
The dynamic characteristics of liquid with high viscosity impact on stagnant packing are investigated by a computational fluid dynamics (CFD) method. The three-dimensional model, employing the volume-of-fluid (VOF) approach, simulates the evolution of liquid profiles and describes four interaction stages—approaching, encapsulation, uncovering, and detachment—between the liquid and the packings, including Raschig rings, Pall rings, and Cascade mini rings. Based on the analysis of liquid dynamic behavior, the effects of packing type, packing size, and liquid viscosity on the liquid holding volume, film area, and surface renewal rate of highly viscous fluid in packing are analyzed. Furthermore, a correlation is developed to predict the specific area of liquid in terms of dimensionless numbers. This work provides a fundamental reference for realizing the interfacial characteristics in packed columns involving highly viscous fluids.
1. Introduction
Highly viscous fluids are widely present in various chemical processes, such as heavy oil processing [1], biological fermentation [2], hydrophobic absorbents [3], ionic liquid decarburization [4], polymer devolatilization [5,6], etc. These fluids typically exhibit high molecular weights and stable molecular structures, which lead to poor fluidity and reduced mass transfer efficiency. Consequently, they often result in low conversion rates or the formation of harmful by-products [7]. Therefore, enhancing the capability of chemical equipment to handle highly viscous fluids is a crucial aspect of advancing the chemical industry.
Packed columns offer a large gas–liquid contact area and relatively weak gas–liquid interactions, which contribute to enhanced mass transfer efficiency and greater operational flexibility [8]. Effective mass transfer within the packing not only decreases the height of the column but also results in a reduction in capital costs. In the packed column, packings have consistently been a focal point of research due to their vital importance in the determination of mass transfer area. There have been some applications and studies of packed columns in fluids with the viscosity order of 10−1 Pa·s [9,10]. However, experimental research on packed columns in fluids with much higher viscosities (101–102 Pa·s) remains insufficient, because in such highly viscous fluids, the diffusion of tracers in the liquid phase is significantly slow, leading to uneven concentration distributions and reduced diffusion rates. These characteristics limit the applicability of traditional tracer methods for measuring mass transfer areas.
Computational fluid dynamics (CFD) is widely used to evaluate the flow behavior in the packed column and has been used to study the hydraulic behavior of packings, which can be categorized into structured and random packings [11,12]. Structured packings, characterized by their repetitive unit structures, allow for local periodic simulations that significantly reduce computational costs [13,14]. However, applying CFD to the detailed hydraulic properties of random packings is challenging. The complex and irregular geometry of random packings does not permit the creation of repeatable units as seen with structured packings. As a result, there are only a few reports on random packings, in which the flow field structure can only be simulated by setting up a small-size column or simplifying the packing by porous media [15,16]. This method is time-consuming in computation, and the results are roughly not reliable and generalizable. Therefore, it is of great significance to provide a simple and efficient CFD simulation process to rapidly evaluate the interface characteristics of packings and compare the differences among various packings.
For multiphase flow in packed columns, the dispersed phase is typically used as the liquid phase, while the continuous phase is used as the gas phase. Therefore, the study of liquid interfacial characteristics requires methods that can effectively capture the gas–liquid interface. The volume-of-fluid (VOF) method is most commonly used to track the gas–liquid two-phase flow state and capture the interface between the two phases. To date, numerous studies have employed the VOF method to simulate falling film flow patterns of highly viscous fluids. Xie et al. [17] used the VOF method to simulate the liquid film flow behavior of highly viscous liquid on a vertically opened window plate and found that the maximum velocity of liquid film increased by 2.5–16 times within the Reynolds number range from 0.0135 to 1.35. Their results show that open windows significantly enhance surface renewal in viscous liquid films without additional cost. Chen et al. [18] used the VOF method to study the flow behavior of gravity-driven falling film of highly viscous polymers on an industrial-scale vertical wave wall and found that the falling film flow of highly viscous fluid is stable in a large film thickness condition. The result of the film thickness, both in the crest and in the trough of the wavy wall by simulation, was in good agreement with the experiment. Lin et al. [19] used the VOF method to study falling film outside three special-shaped vertical tubes for highly viscous fluids. The simulations revealed that the velocity distribution within the liquid films of elliptical and semicircular tubes follows the Nusselt semi-parabolic distribution, and all special-shaped tubes can increase the surface renewal of liquid films. Thus, it can be considered that the VOF method is effective to study the interface characteristics of highly viscous fluid.
Based on the above literature survey, in this work, the computational fluid dynamics (CFD) method is used to simulate the flow characteristics of highly viscous fluid around a single packing. Geometric models of three types of packings (Raschig ring, Pall ring, and Cascade mini ring) are constructed. The volume-of-fluid (VOF) method is employed to investigate the evolution of the liquid profile and analyze the liquid dynamic behavior. Based on the statistical average of packing orientation, the effects of packing type, packing size, and liquid viscosity on liquid holding volume, film area, and surface renewal rate are examined for highly viscous fluid in the packing. Finally, a correlation is developed to determine the specific area of liquid in various packings as a function of dimensionless numbers.
2. CFD Modeling Approach
2.1. Packings
In this work, three typical packing elements are chosen for the geometric modeling and numerical simulation, namely a Raschig ring (RR), Pall ring (PR), and Cascade mini ring (CMR), all of which are made of polypropylene. The basic structure of the packings is shown in Figure 1. The Raschig ring features a hollow cylindrical structure with an equal outer diameter and height. The Pall ring incorporates a structure with windows on its surface and sheets inside the ring, and the Cascade mini ring further reduces the height–diameter ratio and introduces a tapered flange at one end. The dimension parameters of these packings are summarized in Table 1. For convenience, we denote the packing in the format of [packing type] [dN of packing] throughout the text. For example, PR38 represents the Pall ring with a nominal diameter of 38 mm.
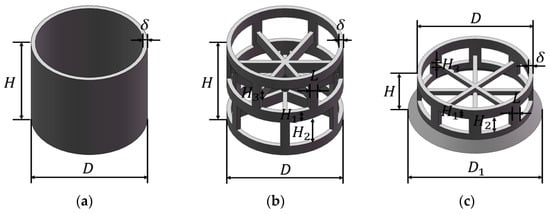
Figure 1.
Structure of packing: (a) Raschig ring (RR); (b) Pall ring (PR); (c) Cascade mini ring (CMR).

Table 1.
Dimension parameters of the packings (unit: mm).
2.2. Fluid Properties
When the order of fluid viscosity under study is high (101–102 Pa·s), it is convenient to employ maltose syrup as the working fluid. Table 2 displays the properties of air and maltose syrup used in this work. These parameters are incorporated into the simulation and experimental validation.
Table 2.
Properties of air and maltose syrup.
2.3. Simulation Domain
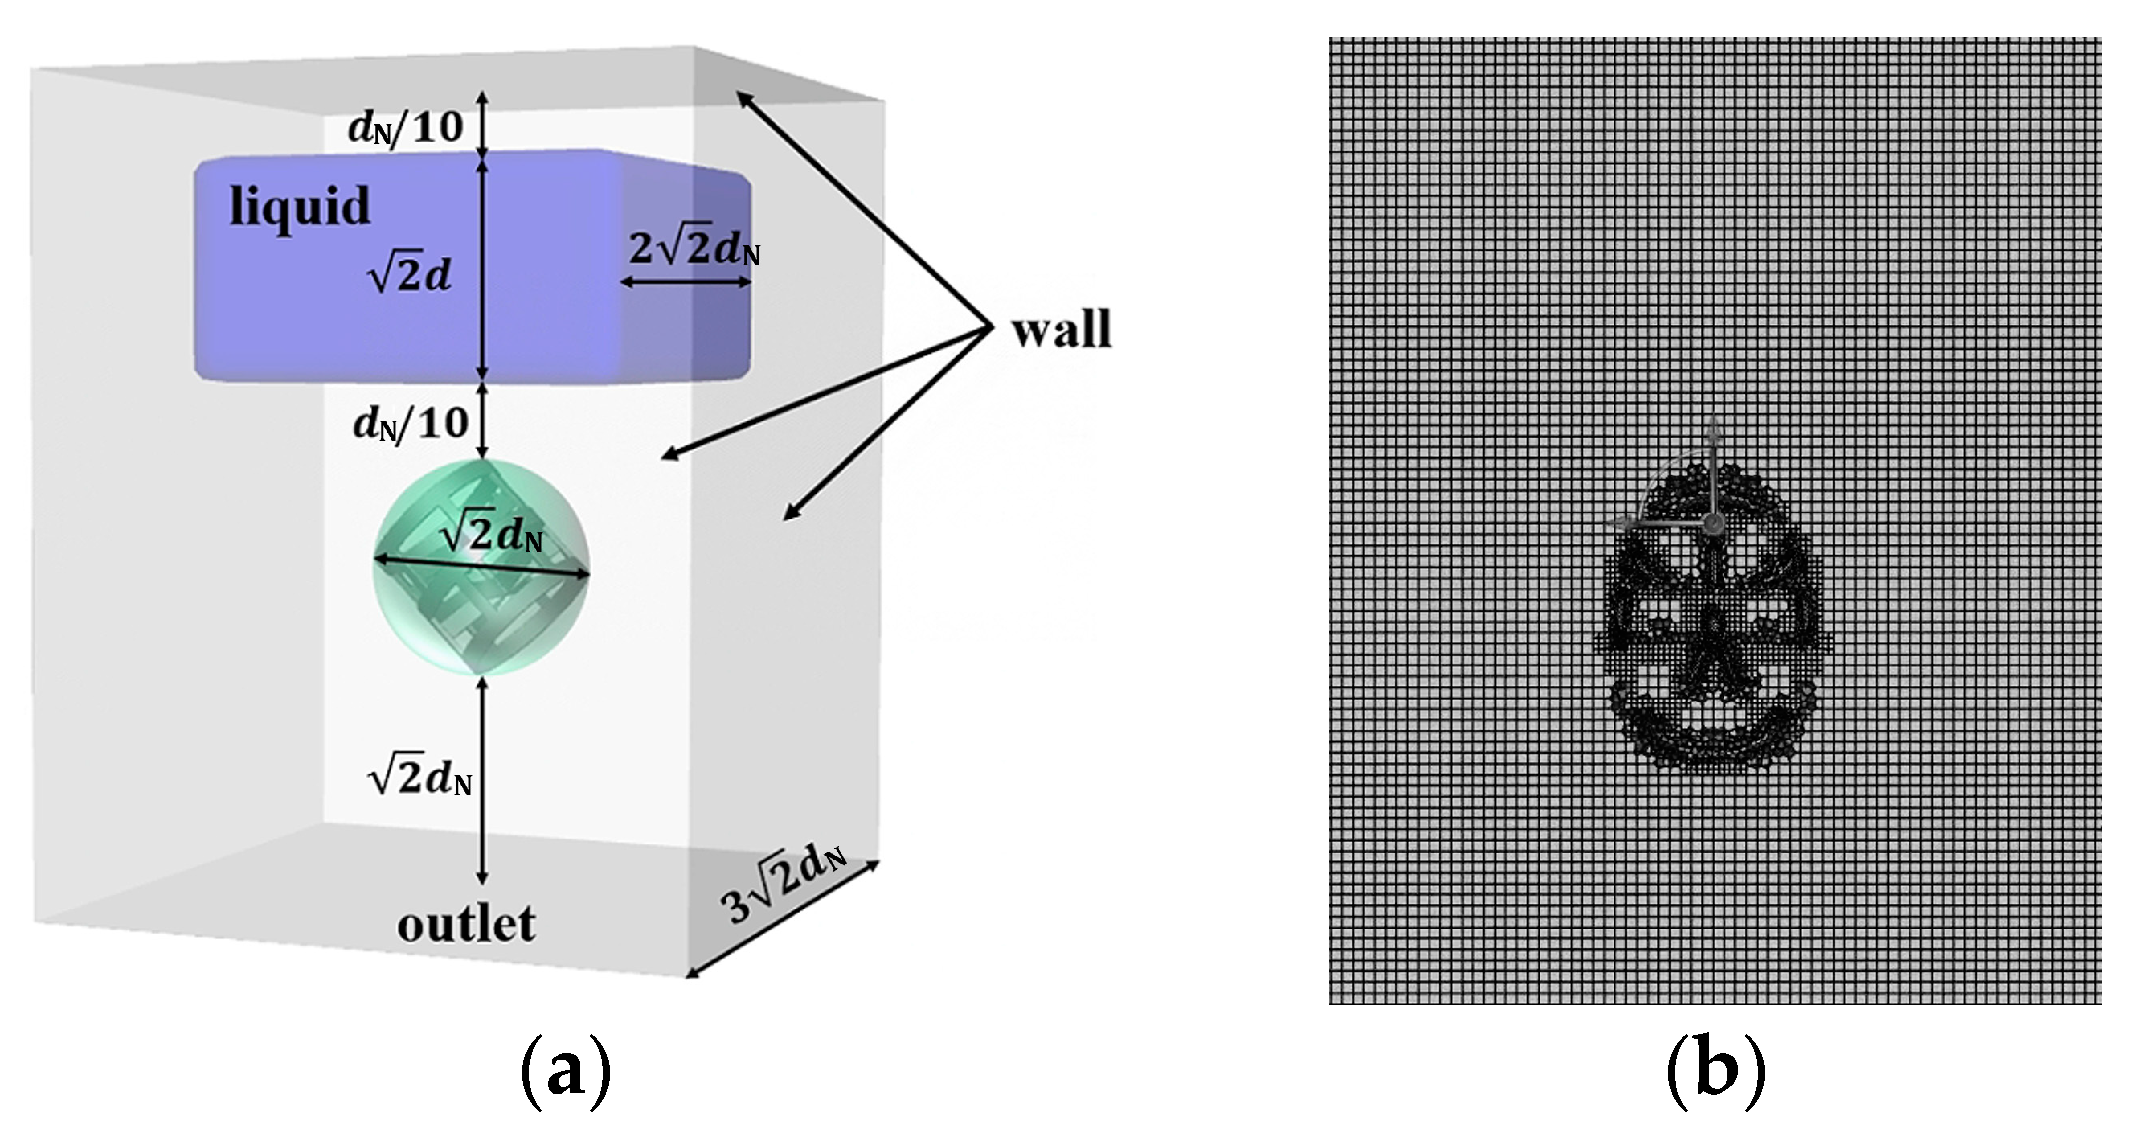
Figure 2 shows the structure and dimensions of the simulation domain for the flow of highly viscous fluid around a single packing. To ensure the comparability of simulation results across different packing sizes, all dimensions within the simulation domain are set based on the nominal diameter of the packing. The domain is set as a cuboid with a square base. The bottom surface is designated as an outlet, while all other surfaces are treated as walls. A single stationary packing is positioned within the domain, with its centroid aligned vertically with the center of the bottom surface. For packings with the same nominal diameter, the height–diameter ratio of the CMR is only half that of the RR and PR. To enable meaningful comparisons between different packing types, two CMR packings are placed symmetrically, with their unflanged tori connected to form a single characteristic element for simulation. In this work, an intermittent feeding strategy is employed. Specifically, an expanded liquid phase region above the packing is initialized by the region-patch method, following the entire initial gas-phase domain. This approach, illustrated in the blue region of Figure 2, is designed to avoid the contingencies in interface characteristics caused by the special feeding positions. The blue region is a cuboid with a horizontal side length of and a height of , and its center is aligned vertically with the centroid of the packing. This setup allows simulating the entire process of the liquid falling freely onto the packing under gravity and subsequently interacting with it.
Considering the inherent randomness of packing arrangements in an actual column, it is necessary to investigate the influence of packing orientation on the flow characteristics. Due to the axial symmetry of the packings, their orientation can be fully described by the angle between the packing axis and the horizontal plane, as shown in Figure 2a. In this work, several typical values for —specifically 0°, 30°, 45°, 60°, and 90°—are selected to represent different orientations of the packing within the domain. The gap between the plane beneath the initial liquid and the centroid of the packing is set to . Non-structured meshes are generated by a hexahedra-led polyhedron to accommodate the complex structures of various packings. Mesh refinement is applied in the regions of high curvature and proximity near the packing, as shown in Figure 2b. Considering the balance between computational accuracy and efficiency, a grid with about 762,000 cells is adopted for the domain.

Figure 2.
(a) Simulation domain; (b) mesh.
Figure 2.
(a) Simulation domain; (b) mesh.
2.4. Governing Equations
As described above, the liquid impingement process on the packing surface involves a gas–liquid two-phase flow. Herein, the volume-of-fluid (VOF) method is employed to compute the interaction of mass and momentum during incompressible, isothermal, and laminar flow of highly viscous fluid around the packing [20]. The volume fraction of each phase in the control volume satisfies
where the subscript g represents the gas phase and l represents the liquid phase.
In the VOF equation for multiphase flow, the continuity equation and the momentum conservation equation can be solved with a set of equations. The continuity equation takes the form
The momentum equation is expressed as follows:
where is the time, is the velocity vector, is the density, is the viscosity, is the pressure, is the gravitational acceleration vector, and is the external volume force, which represents the surface tension effect at the free phase interface.
The density and viscosity and weighted by the volume fraction of each phase in the control volume are expressed as follows:
The surface tension effect is calculated by the continuous surface force (CSF) model and added as a source term to the momentum equation, which is expressed as [21]
where is the surface tension and is the curvature of the gas–liquid interface defined by divergence of unit normal vector
where
Considering the wall adhesion effect of the solid surface, the normal element is determined by the contact angle as follows:
where is the unit vector perpendicular to the interface, and are the unit normal and tangential vectors of the wall, and is the contact angle between the wall and the liquid.
2.5. Boundary and Initial Conditions
In this work, the following pressure outlet boundary condition is used at the bottom surface of the domain:
Non-slip and non-permeable boundary conditions are applied on the other edges (top and sides) and packing surface:
The free-falling initial condition is used to initialize the liquid phase region as follows:
where is the initial liquid velocity.
3. Simulation Methodology
The VOF model was solved by a pressure-based solver in the commercial computational fluid dynamics software Ansys Fluent. In the numerical simulation, the air phase is set as the primary phase while the liquid as the secondary phase. The laminar flow model is used to compute the fluid dynamics. Transient simulations of the gas–liquid two-phase flow are conducted with a time step of 10−5–10−4 s to ensure that the Courant number remains below 1 [22]. The SIMPLE (Semi-Implicit Pressure Linked Equation) algorithm is used for pressure–velocity coupling. The pressure, momentum, and volume fraction are discretized by the PRESTO! (Pressure Staggering Option), Second-Order Upwind, and Geo-Reconstruct schemes. Additionally, the acceleration due to gravity (g = 9.81 m/s2) acting along the vertical downward axis was incorporated into the simulation. In this work, the simulation scheme is set including the packings and operating conditions, as shown in Table 3.
Table 3.
Simulation scheme in this work.
3.1. Mesh Independence Test
An unstructured hexahedra-led polyhedron is used to generate the mesh. Taking liquid volume as the test standard, the mesh independence test is carried out with three sets of grids. As shown in Figure 3, it is found that the liquid volume is basically stable at the same value. Considering the computer accuracy, the number of cells is set to 762,804 to capture the flow details in this work.

Figure 3.
Liquid volume curves under different cell number.
3.2. Model Validation
To validate the numerical simulation, an experiment is conducted to measure the liquid holding volume () on a single packing surface. Maltose syrup is employed as the working fluid. The physical properties of maltose syrup and air are consistent with the simulation. The experimental setup is shown in Figure 4a. The packing is held to the specified orientation by a filament. The movable plate is pulled, and the liquid flows through the packing and falls into the bottom vessel. The liquid holding volume of the packing is obtained by calculating the difference between the initial liquid mass and the residual liquid mass of the container, movable plate, and bottomless vessel after the experiment. The comparative analysis revealed a deviation of 7.62% to 8.28% between the simulated and experimental values, as shown in Figure 4b. Overall, the simulation method demonstrates satisfactory agreement with the experimental findings, providing validation for further investigation.
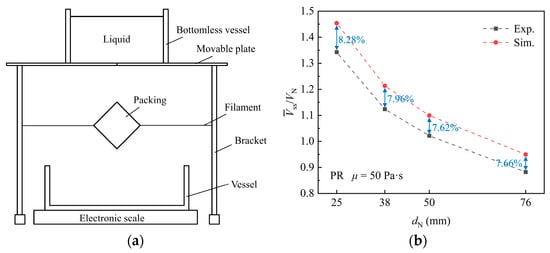
Figure 4.
(a) Experimental setup. (b) Comparison between simulation and experiment.
4. Results and Discussion
4.1. Evolution of Interfacial Morphology
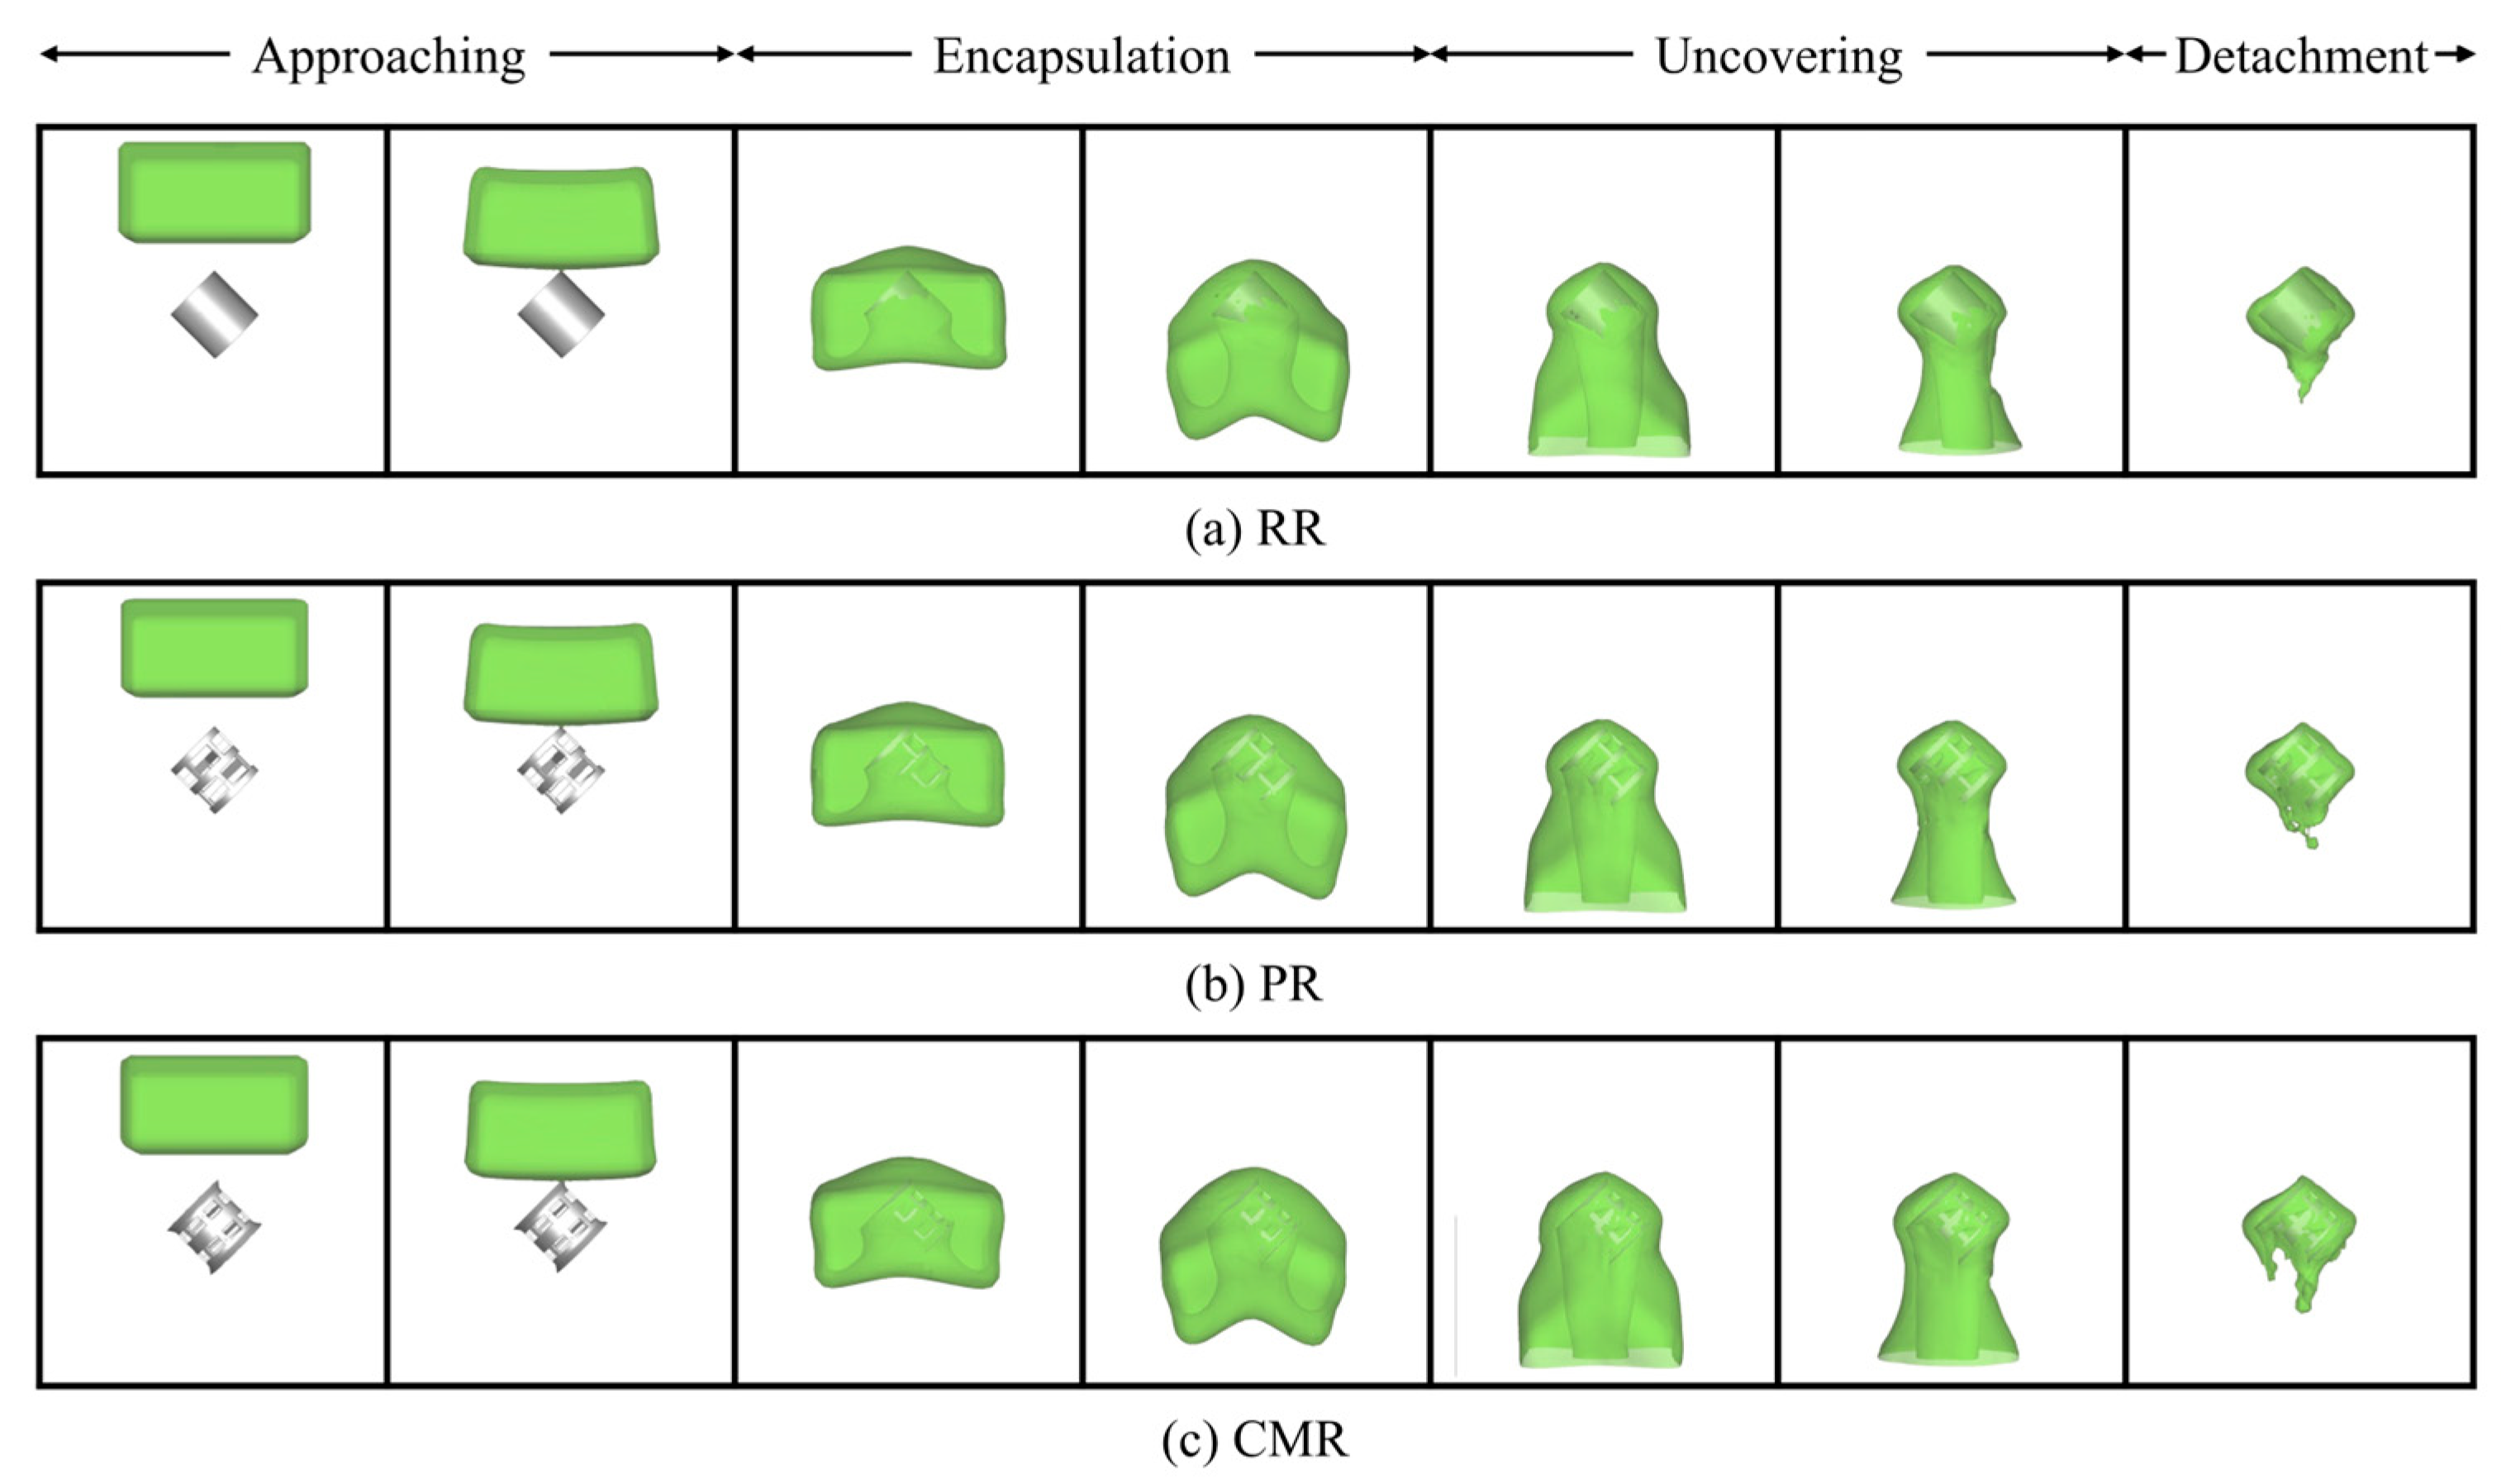
The evolution of the liquid profiles during impact on the packing is illustrated qualitatively in Figure 5, which depicts the morphological representation of the deformed profile during liquid impingement at a fixed orientation angle (θ = 45°). It can be observed that the liquid encounters several distinguished stages, which can be summarized as follows: approaching, encapsulation, uncovering, and detachment. Initially, the liquid falls freely toward the stationary packing below under gravity, noted as the “approaching” stage. As the liquid makes contact with the stationary packing, it begins to envelop the packing from its apex, a stage termed “encapsulation”. The deformation on the liquid profile is visible from the contours. Progressively, the liquid spreads horizontally away from the packing, reaching maximum horizontal spread when it completely engulfs the packing. Subsequently, the liquid begins to fall and drain downward gradually due to gravity. During this stage, the liquid film around the packing surface thins out, which can be called “uncovering”. At this time, the majority of the liquid mass hangs below the packing after passing around it. The elongation of the liquid causes the horizontal spread to decrease. Finally, the gravitational force overcomes the viscous force holding the liquid to the packing, leading to the detachment of liquid mass from the packing and its exit from the domain, which marks the “detachment” stage. Due to the resistance offered by the packing surface, a bulk liquid mass remains adhered to the packing surface after detachment. Under the continuous action of gravity, the liquid continues to flow slowly around the packing surface and exit the domain. As more liquid detaches, the liquid film thickness on the packing surface continues to decrease, leading to increased viscous resistance. This heightened resistance makes further detachment increasingly difficult. Consequently, the remaining liquid mass on the packing surface tends to stabilize.

Figure 5.
Pattern of numerical contours of liquid impact on the different packings (the green color represents the interface where = 0.5).
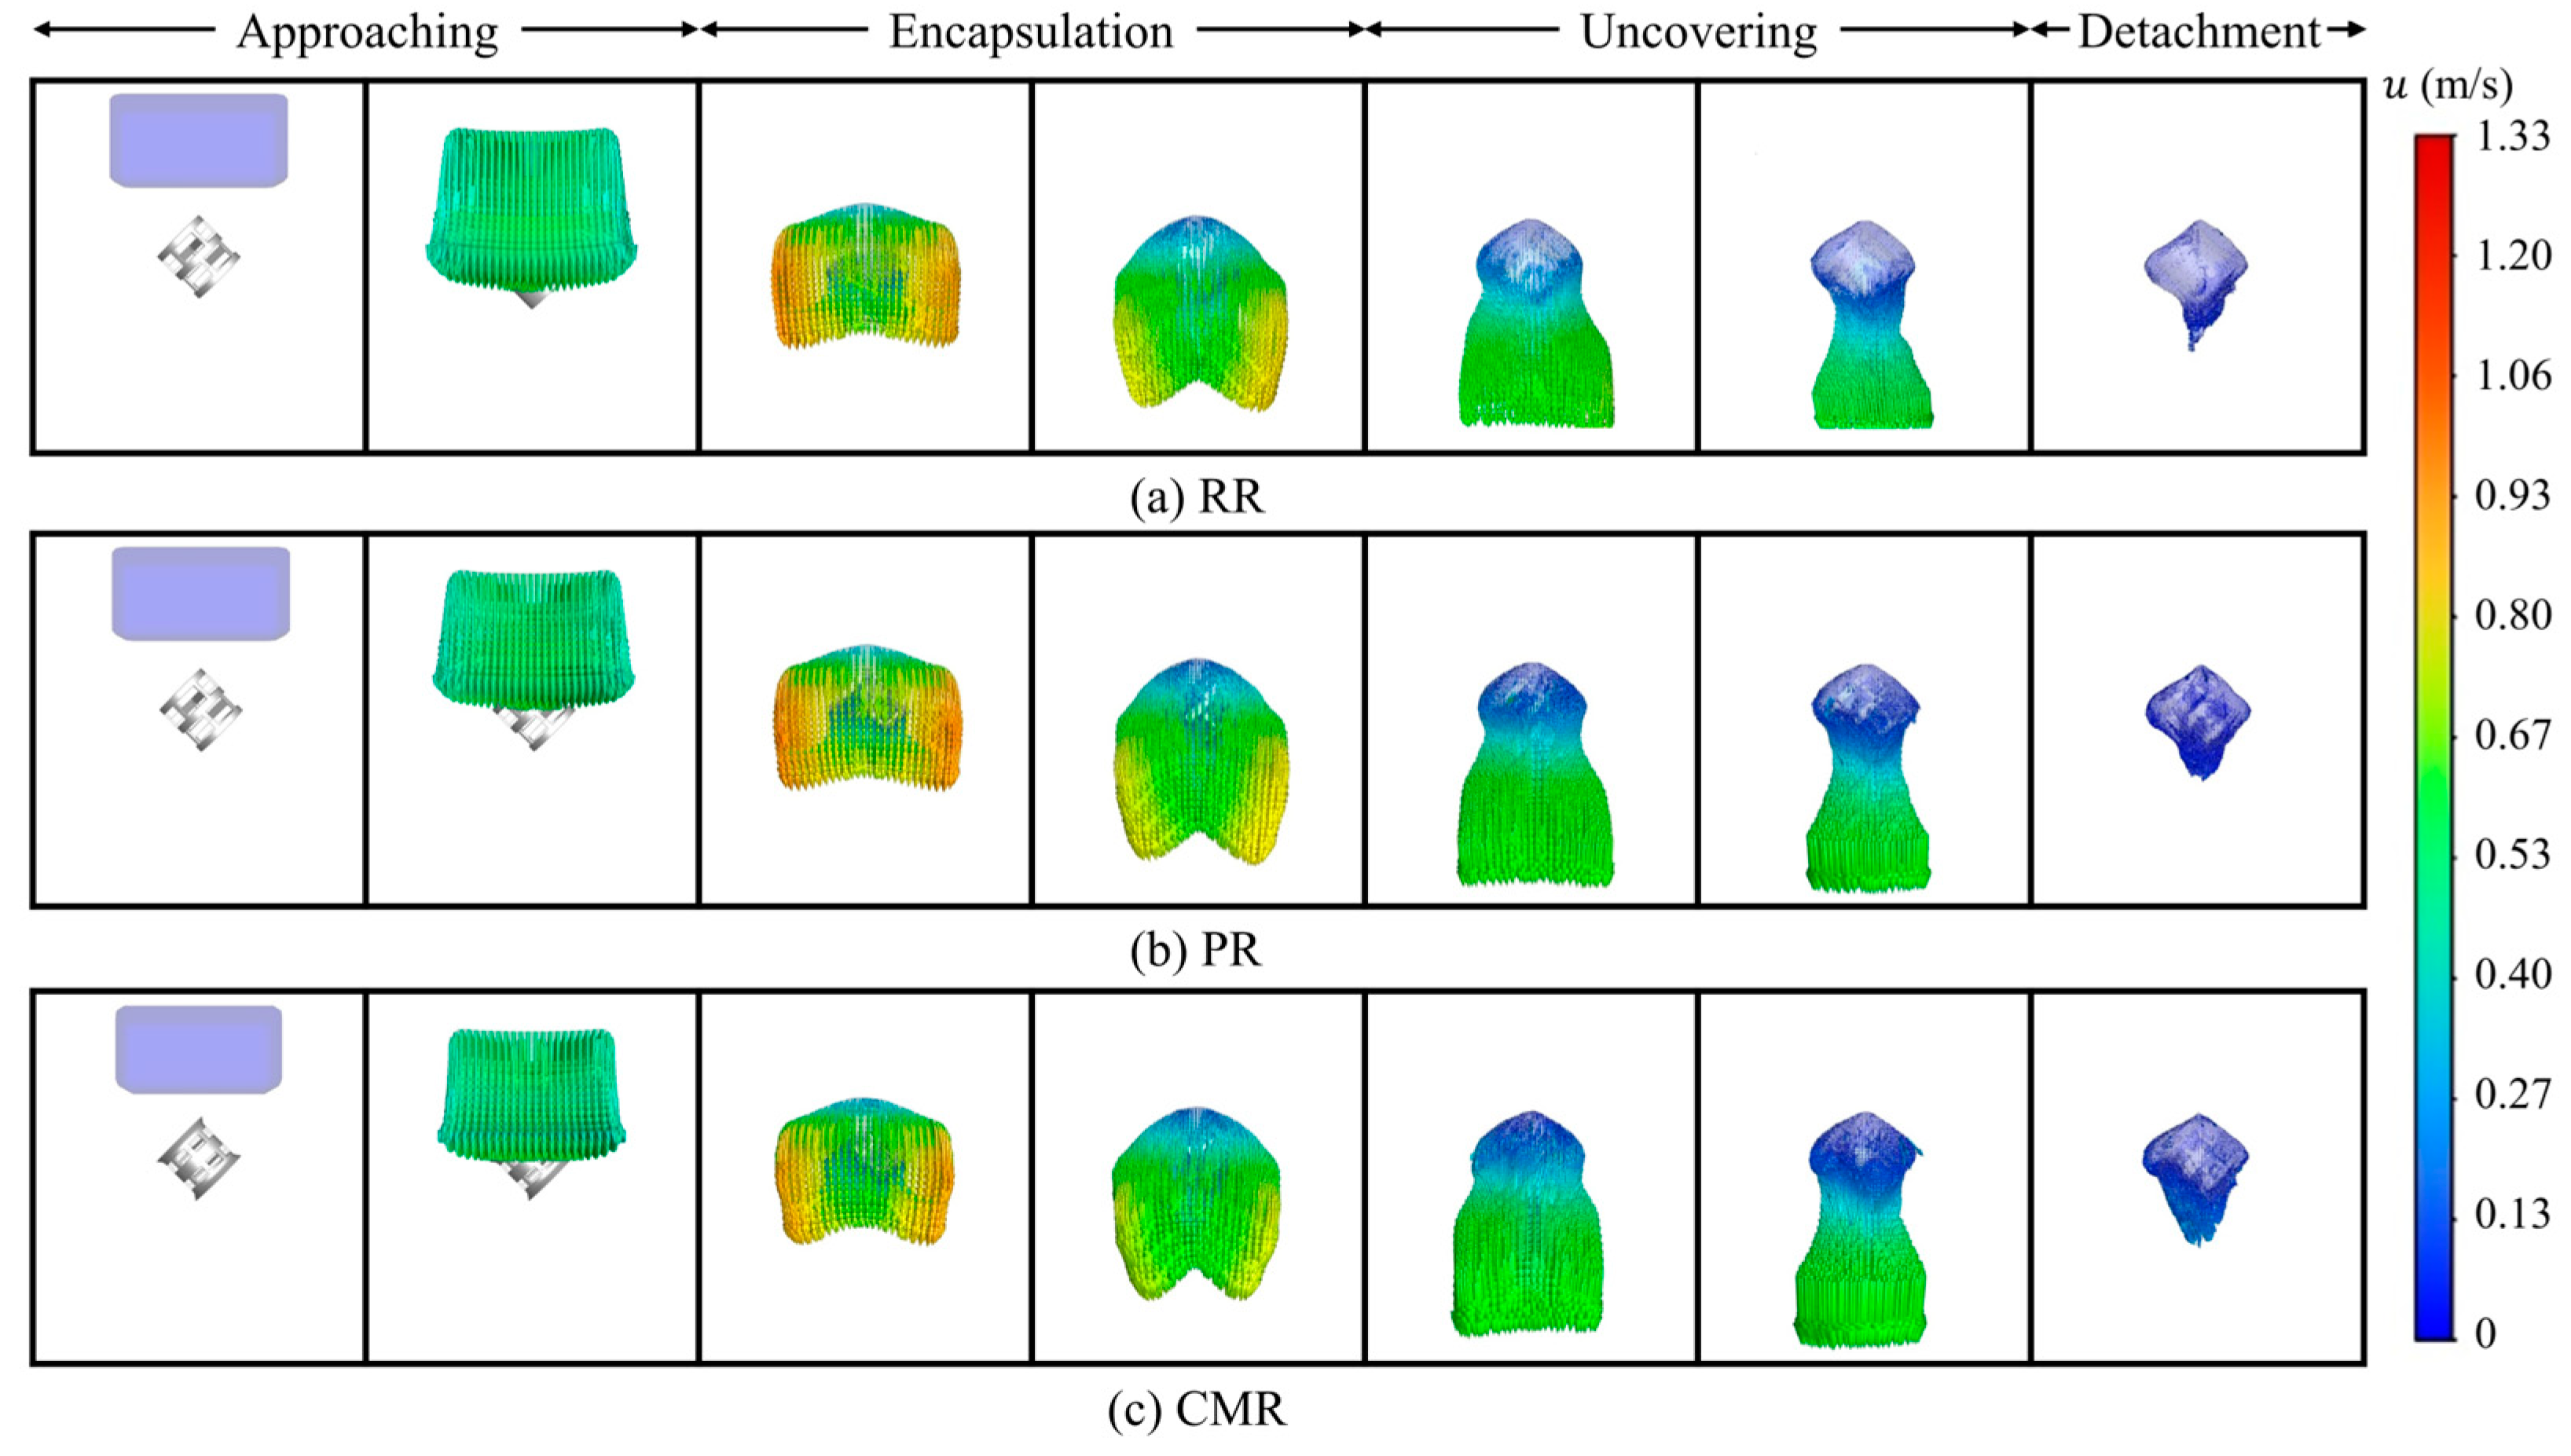
Liquid deformation is closely related to its velocity distribution. The detailed interaction between the liquid and the packing from the velocity distribution can be observed visually, which provides valuable insights into the underlying fluid dynamics. Figure 6 shows the liquid velocity vector distribution at various stages. In the approaching stage, the liquid falls freely with a relatively uniform velocity. As the liquid is completely enveloped by the packing, the liquid around the packing rapidly decelerates under the direct impact from the packing surface. Meanwhile, in the horizontal direction, the viscous resistance exerted by the packing decreases with increasing distance between the liquid and the packing surface, resulting in increased liquid velocity in regions farther from the packing. Subsequently, as the liquid around the packing converges towards the lower central region of the packing, the overall liquid velocity gradually decreases. At this stage, the viscous resistance of the packing surface plays a dominant role in the liquid flow. The liquid velocity above the packing is minimal, while the liquid beneath the packing, driven by the pull of gravity, exhibits a relatively higher velocity. During the uncovering stage, the liquid velocity near the packing is the lowest, with this portion of the liquid tending to adhere to the packing surface. The liquid beneath the packing continues to stretch under gravity, where the liquid is about to be detached from the packing. In the detachment stage, the liquid with the lower velocity still adheres to the packing surface, forming a certain volume of liquid retention.

Figure 6.
Liquid velocity vector along different packings.
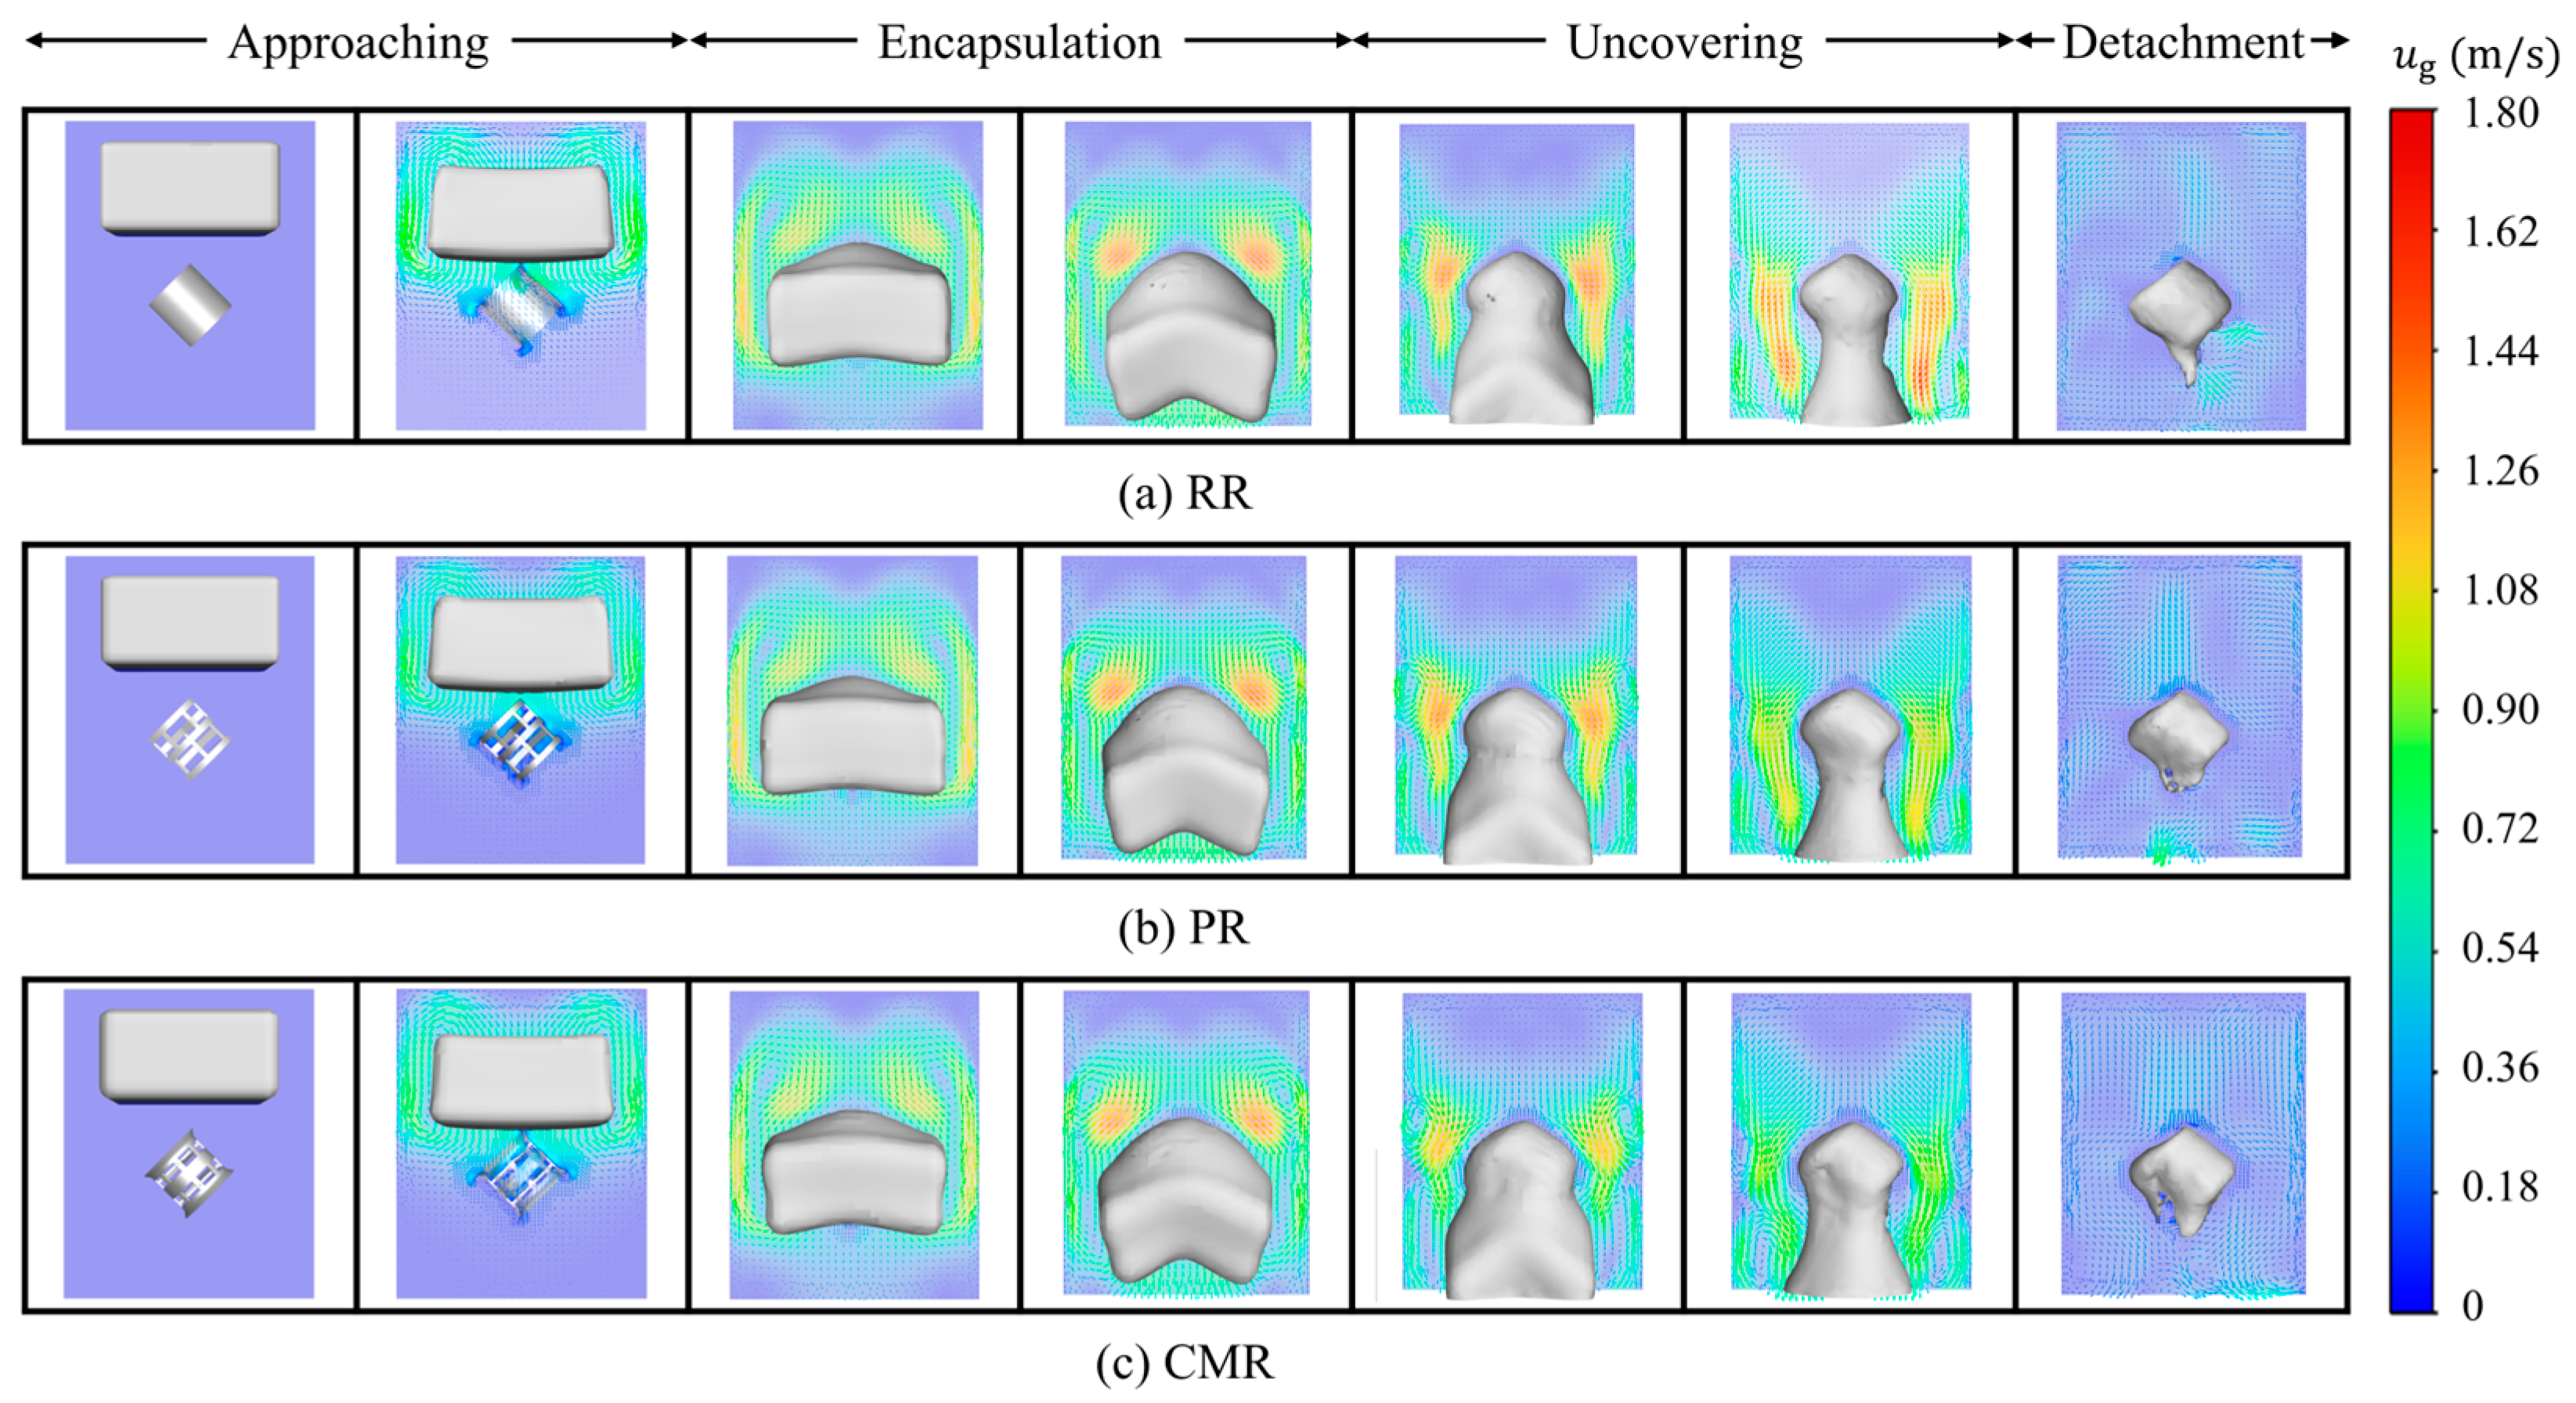
Figure 7 shows the gas velocity vector distribution at various stages. In the approaching stage, the falling liquid drive the surrounding gas to show a higher gas velocity. Due to the limitation of the packing and simulation domain space, the gas velocity vector beneath the liquid shifts to the sides and passes through the gap between the liquid and sides to form a circulating flow. Entering the encapsulation stage, the space above the liquid continues to expand, providing more space for the gas cycle, forming a more pronounced vortex. In the uncovering stage, the vortex formed by the gas begins to shrink, and the gas velocity near the packing tends to move down the outlet with the liquid. Finally, in the detachment stage, because the attached liquid is retained in the packing, the gas velocity gradually stabilizes in the absence of liquid driving.
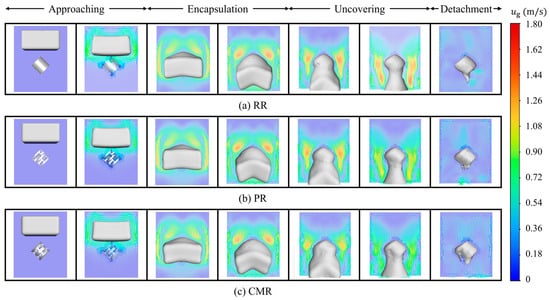
Figure 7.
Gas velocity vector around different packings.
4.2. Dynamic Characteristics of Liquid Flow
Understanding the dynamic characteristics of liquid flow is essential for elucidating the fundamental laws involving this process, thereby enriching the characterization of liquid behavior around the packing. This section examines two instantaneous variables of liquid flow during the interaction with the packing: liquid volume in domain () and gas–liquid interface area (). The reference volume and reference area related to the packing size are used to normalize the liquid volume and interface area to and . Taking packing PR38 as an example in the next sections, the effects of packing size and liquid viscosity on the behavior of each parameter on the time scale are shown below, so as to provide a comprehensive understanding of the underlying dynamics.
4.2.1. Liquid Volume in Domain
In the simulation setup, a localized liquid-phase region is patched within the domain, with its dimensions determined by the characteristic packing size. As observed in the simulation result, with time progressing, the specified volume of liquid undergoes “approaching” and “encapsulation” stages in the domain, followed by the “uncovering” stage with a decrease in the liquid volume in the domain. Until the detachment stage, the liquid volume in the domain corresponds to the liquid retention on the packing, which can be further used to analyze the liquid holding volume.
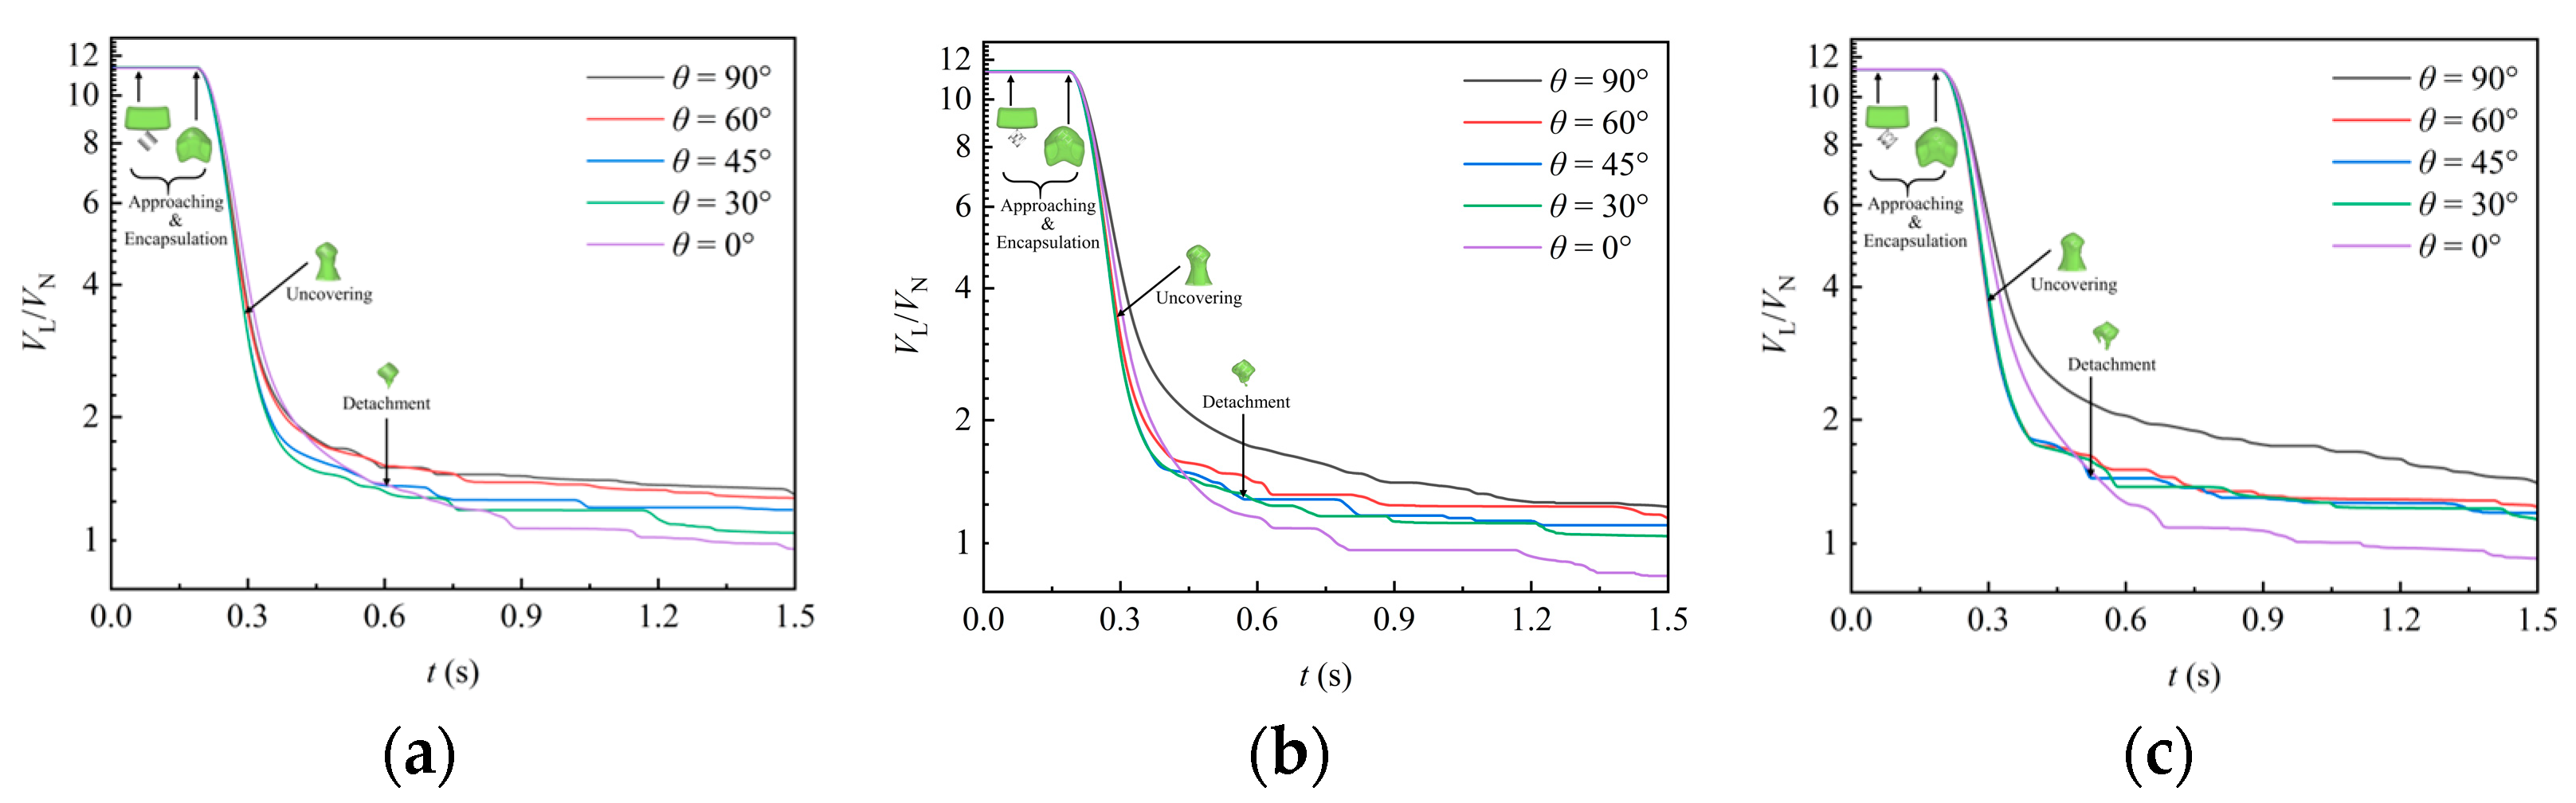
Figure 8 shows the instantaneous variation of liquid volume in the simulation domain under various packing orientation angles, where the ordinate is drawn with a nonlinear coordinate scale to enhance the clarity of visualization. Initially, the liquid volume remains constant for a short period. After reaching a moment around 0.19 s, the liquid volume begins to decrease continuously as the liquid starts to flow out of the domain during uncovering stage. Until the detachment stage, the first portion of liquid exits the domain, and the remaining liquid adheres to the packing surface, maintaining a constant volume for a period of time. Under the action of gravity, the rest of liquid continues to detach from the packing and exit the domain. Multiple plateaus are observed in the liquid volume reduction curves, indicating intermittent detachment events. Comparing the results for various orientation angles of packing, it is evident that after detachment, the liquid volume attached to the packing is largest when the packing is placed laterally (). As the orientation angle decreases, the attached liquid volume generally diminishes. Conversely, when the packing is placed vertically (), the attached liquid volume can even be much less than 1. This suggests that vertical placement reduces the resistance offered by the packing surface and internal sheets to the downward liquid flow.
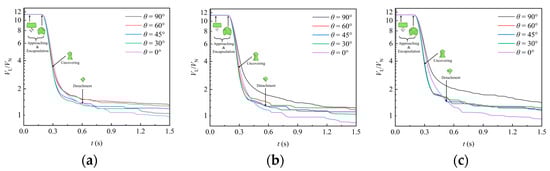
Figure 8.
Effect of packing orientation on the variation of liquid volume in the domain: (a) RR38; (b) PR38; (c) CMR38.
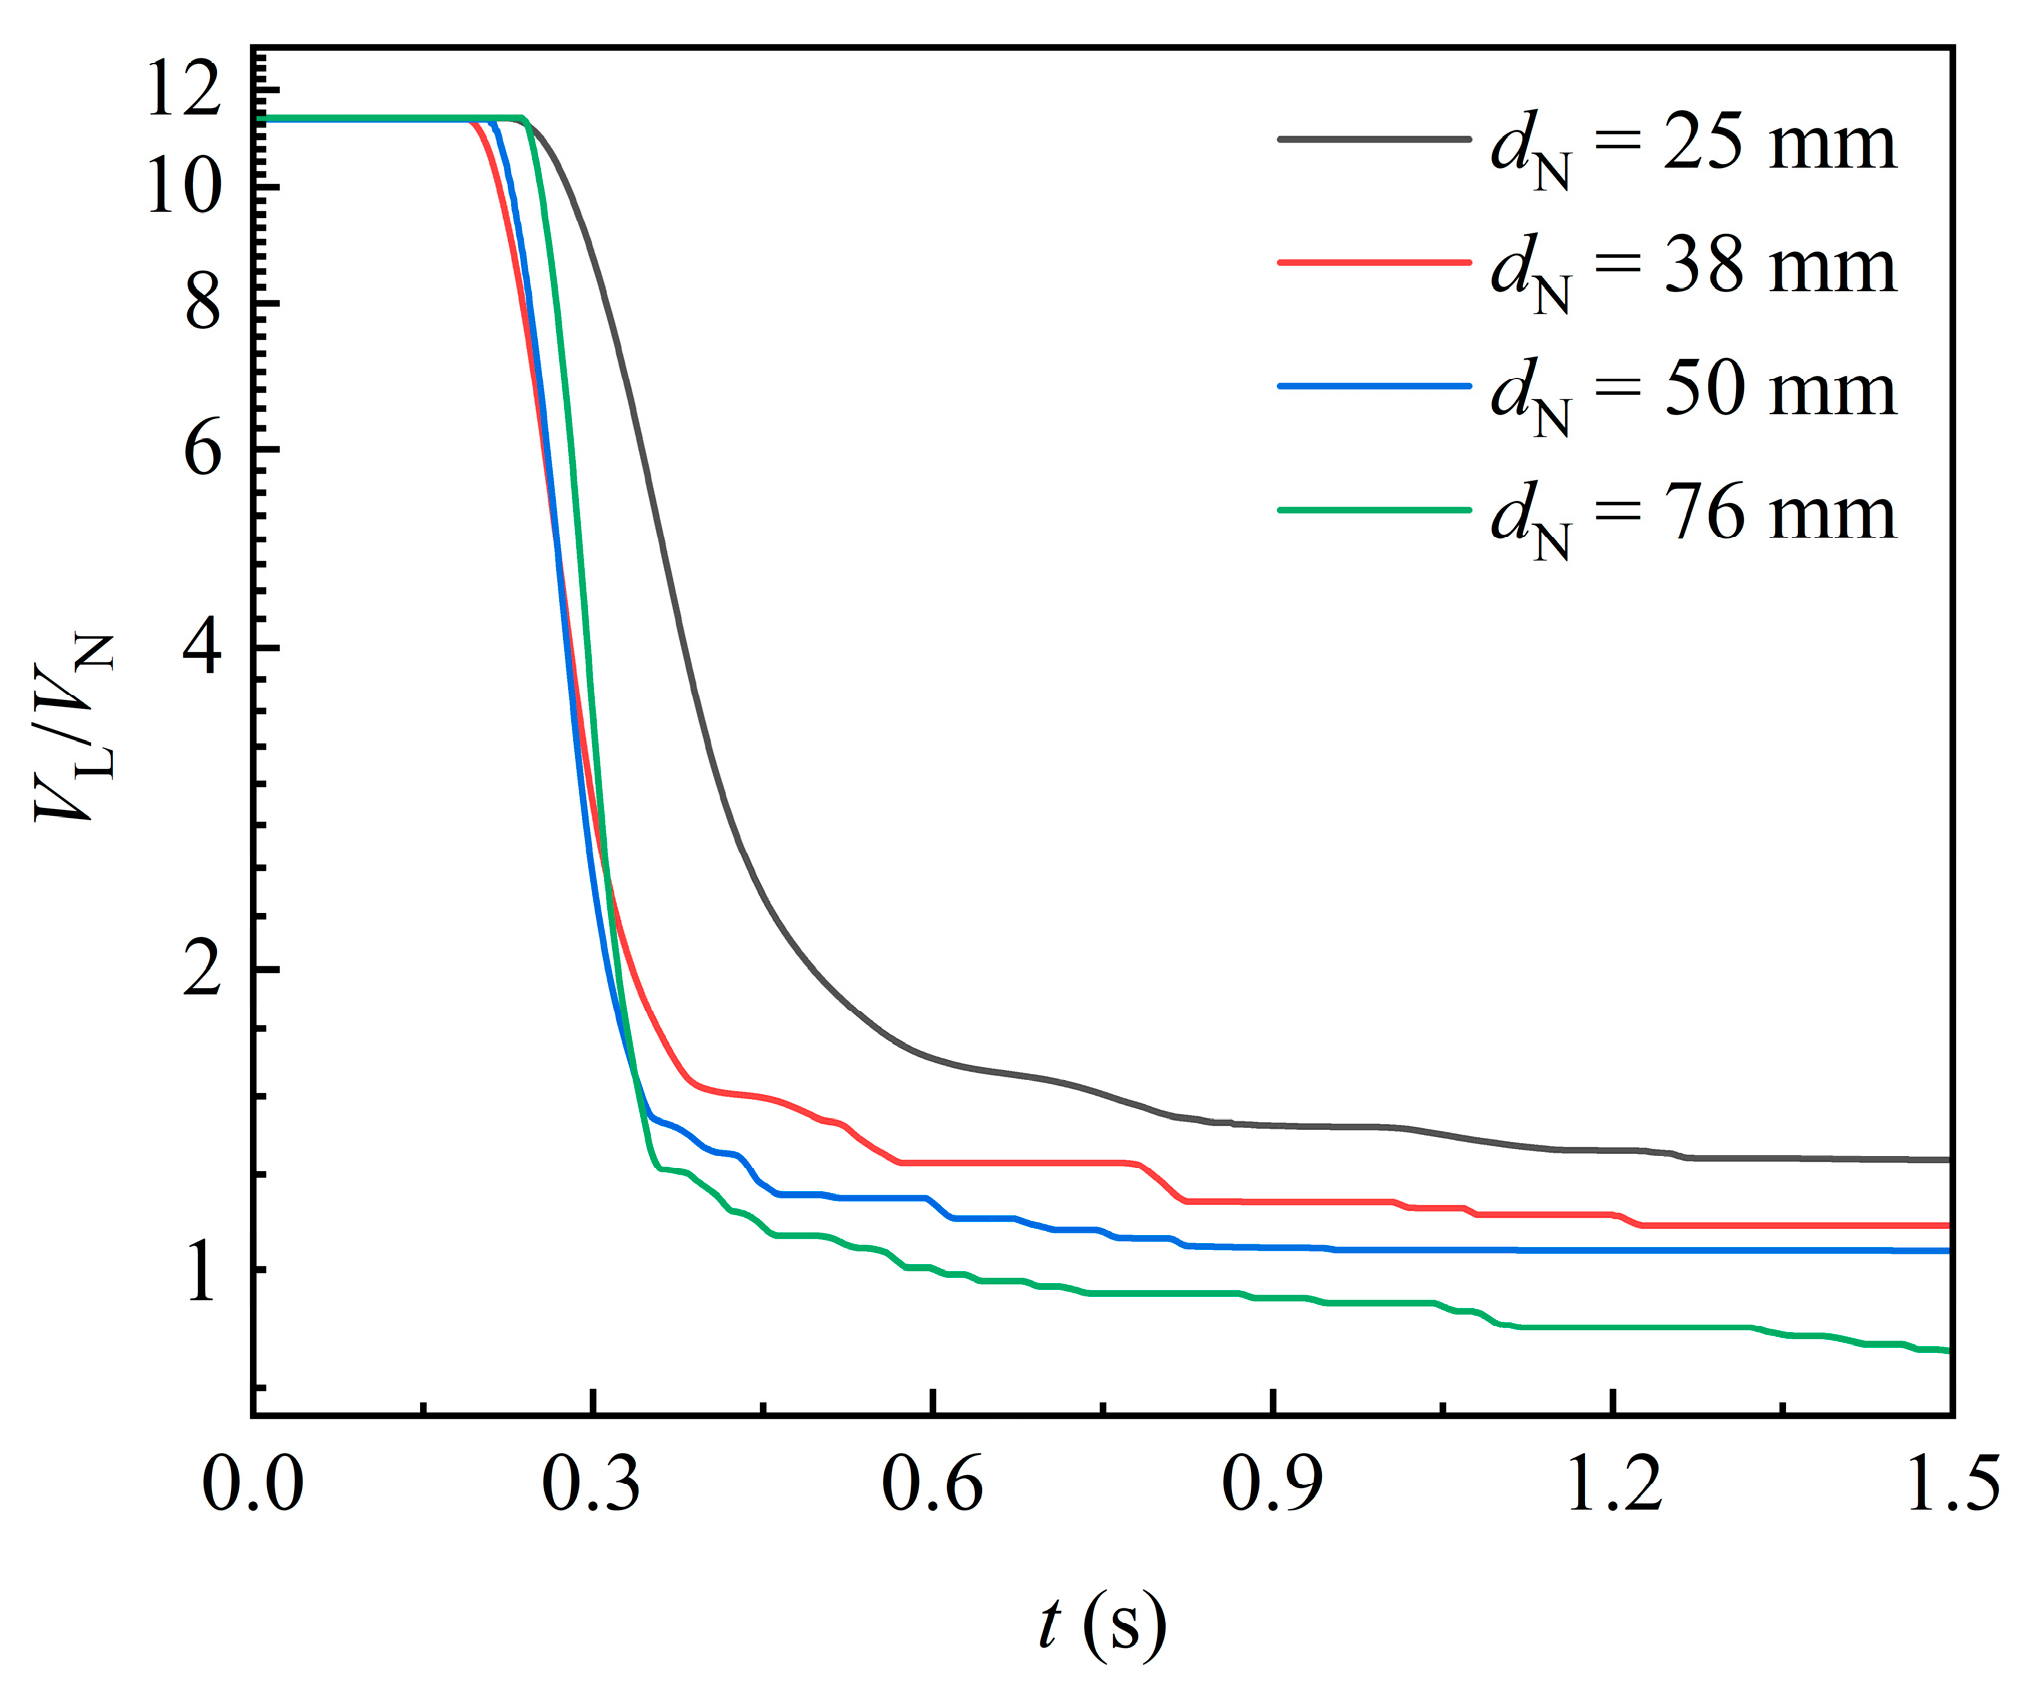
Figure 9 shows the temporal variation of liquid volume in the domain for varying packing sizes. As packing size increases, the attached liquid volume per unit packing volume decreases. This trend can be attributed to the increased internal space in larger packings, which allows the liquid flow to be less constrained by viscous resistance. Additionally, before the first portion of liquid exits the domain, the rate of liquid volume decline accelerates with increasing packing size. This further indicates that larger packings offer less viscous resistance to the liquid.
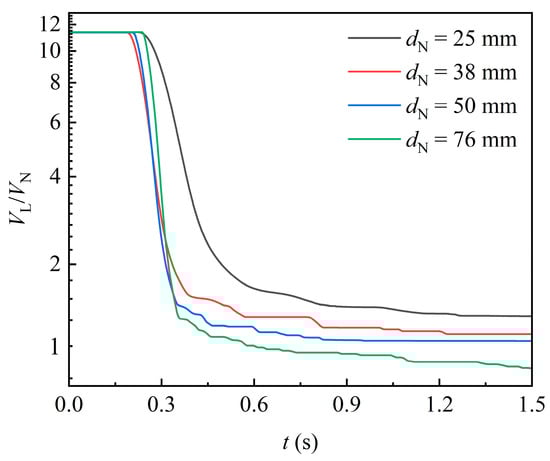
Figure 9.
Effect of packing size on the variation of liquid volume in the domain ().
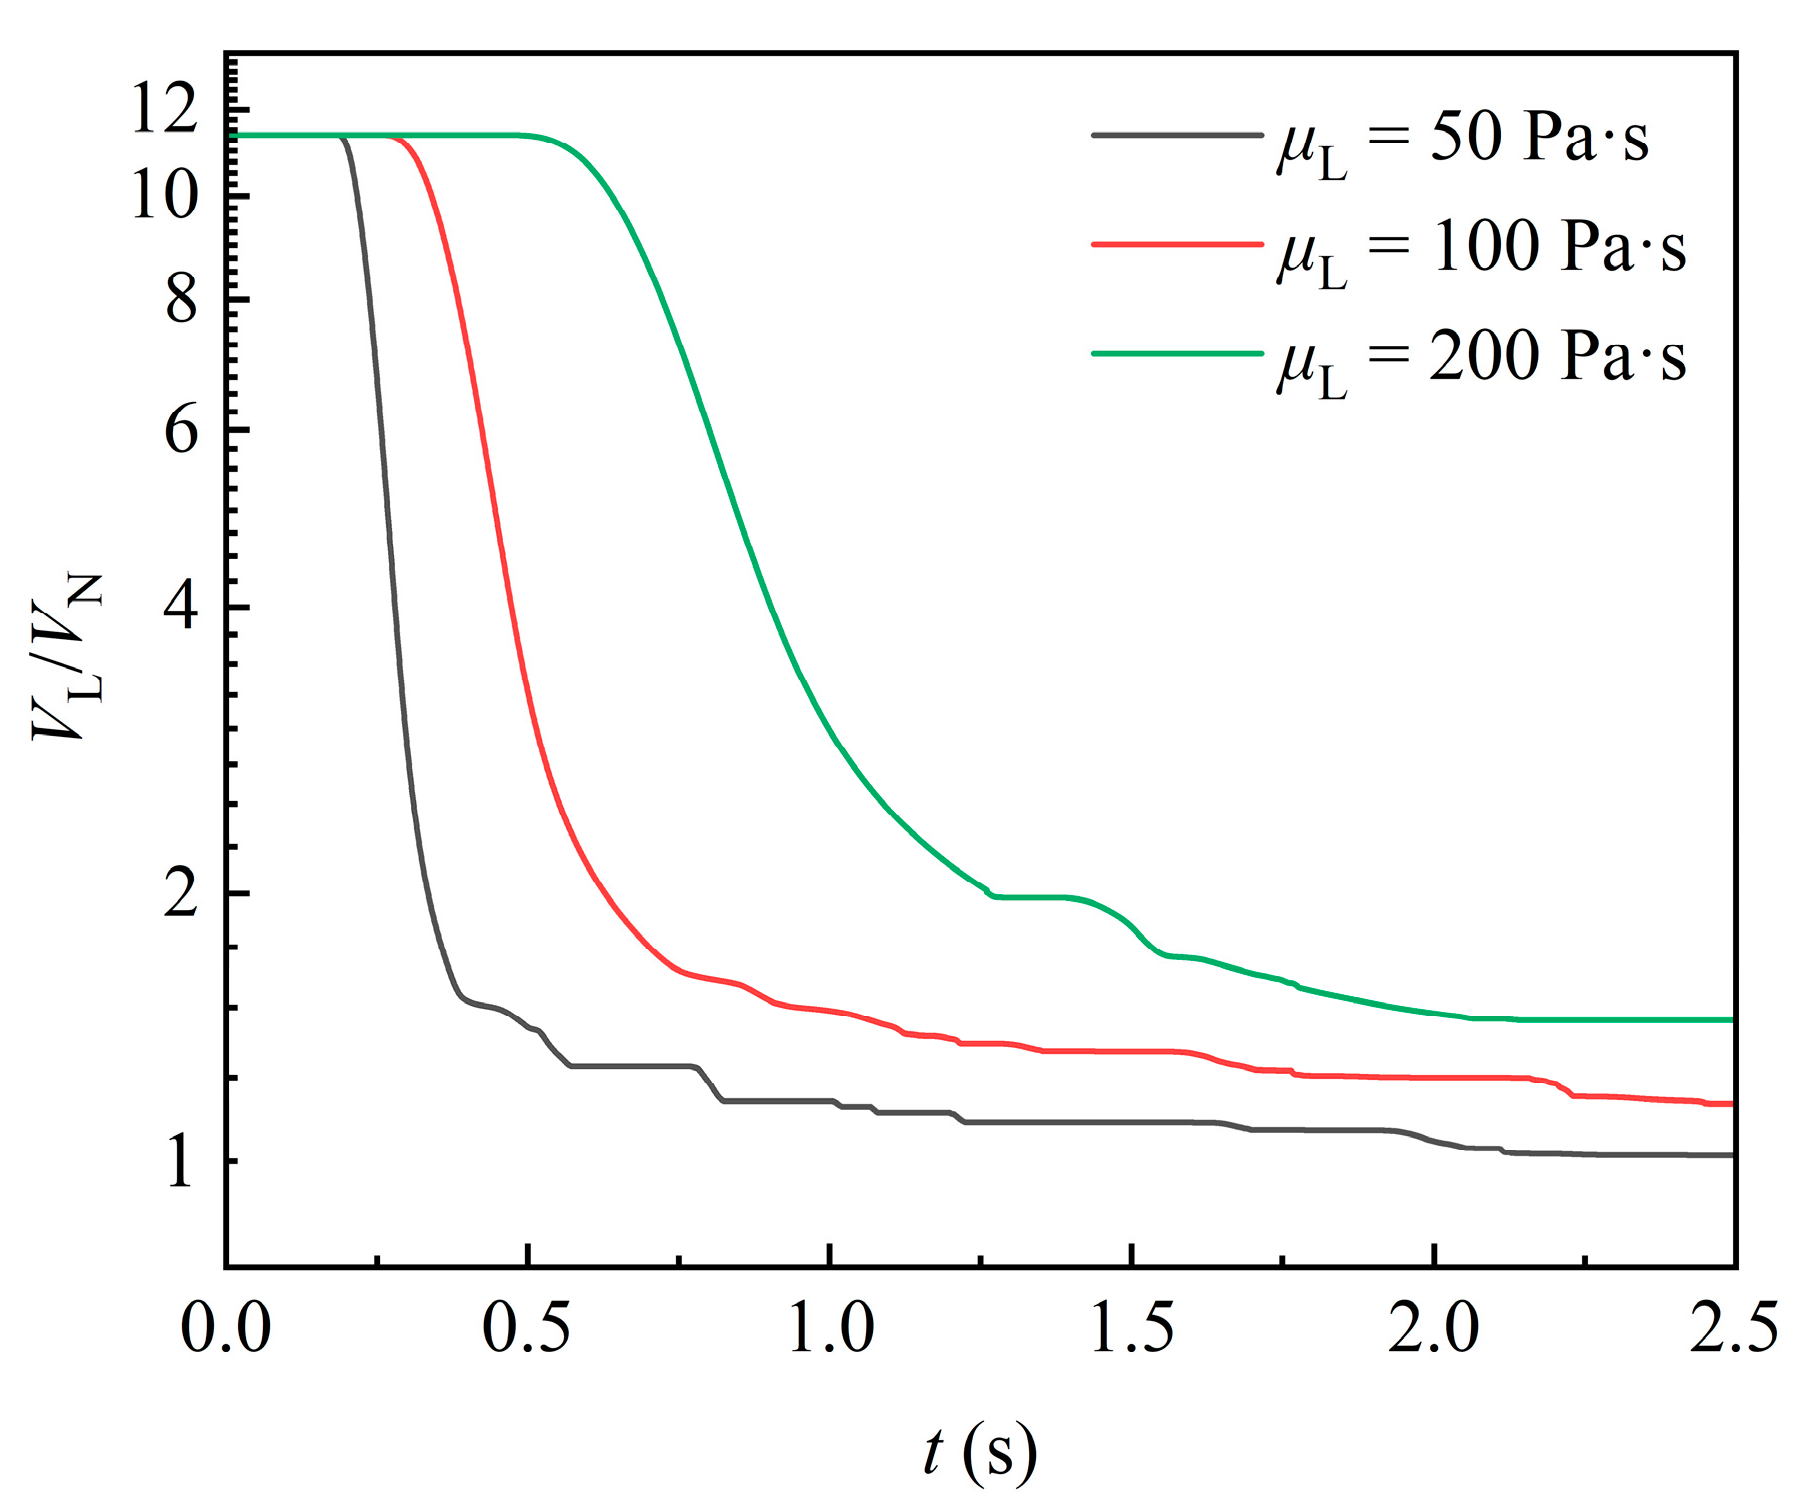
Figure 10 shows the temporal variation in liquid volume in the domain for varying liquid viscosities. With the increase in liquid viscosity, the moment at which the liquid volume begins to flow out of the domain is significantly delayed, and the rate of liquid volume decline is markedly reduced. After the first portion of liquid detaches from the packing, the attached liquid volume is larger for higher-viscosity fluids. This is because increased viscosity directly enhances the viscous forces of the liquid, leading to poorer fluidity throughout the process. In addition, when the gravity acting on the liquid is constant, higher-viscosity fluid exhibits a lower flow velocity and Reynolds number, as well as a more stable flow that is less prone to detachment. In contrast, for fluid with lower viscosity, such as 50 Pa·s, the liquid is less likely to attach to the packing, and the liquid is more frequently detached from the packing, resulting in more pronounced fluctuations in the curve.

Figure 10.
Effect of liquid viscosity on the variation in liquid volume.
4.2.2. Gas–Liquid Interface Area
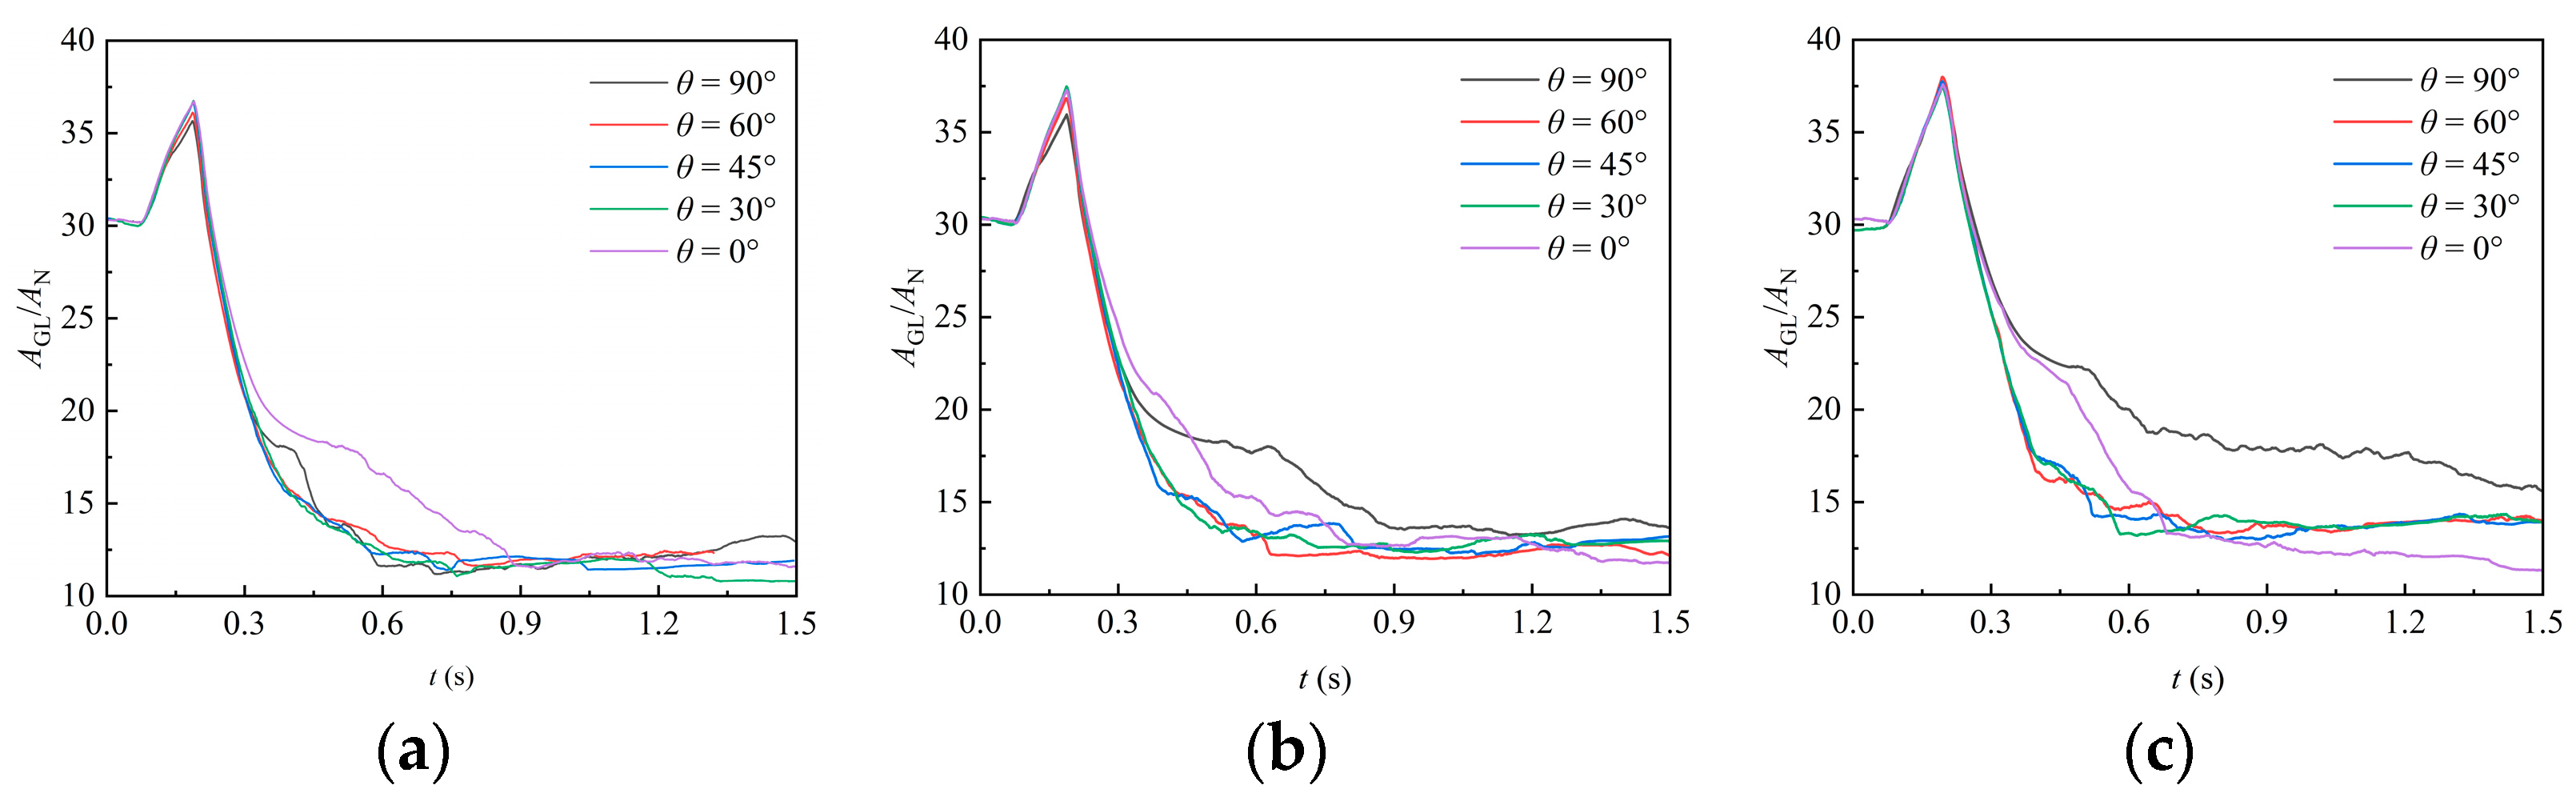
In this section, the region with a liquid phase volume fraction of 0.5 is extracted to represent the gas–liquid interface, and the interface area can be obtained accordingly. Figure 11 shows the temporal variation in the gas–liquid interface area under various packing orientation angles. At the beginning of the simulation (), the liquid does not contact the packing, and only a relatively weak contraction occurs as the liquid falls, resulting in a slight reduction in the interface area. When the liquid contacts the packing, it undergoes significant deformation due to the obstruction of the packing. This deformation leads to an increase in the interface area, which reaches a peak at the moment . This peak corresponds to the moment when the liquid is about to flow out of the domain and the liquid volume begins to decrease. In the uncovering stage (), the liquid beneath the packing contracts and flows out of the domain, resulting in a quick reduction in the interface area. After a portion of liquid exits the domain, the attached liquid continues to deform under gravity, leading to fluctuations in the interface area. As liquid continues flowing out of the domain, the interface area shows a slight decrease but gradually stabilizes. For cases with different orientation angles, it can be observed that it exhibits a relatively random variation, which reflects the complex influence of the irregular structure of the packing surface on liquid film formation, while, as observed in Figure 8, the liquid volume generally decreases with a decreasing orientation angle.
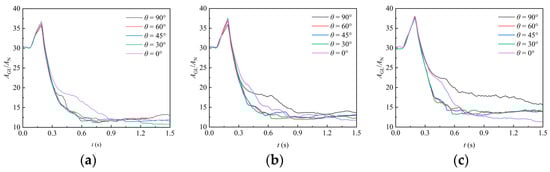
Figure 11.
Effect of different packing orientation on the gas–liquid interface area: (a) RR38; (b) PR38; (c) CMR38.
The effect of packing size on the gas–liquid interface area over time is shown in Figure 12, in which the normalized interface area generally decreases as the packing size increases. This is because the increased internal space in larger packings reduces the flow resistance for highly viscous liquid, making it less prone to form stagnant films on the packing surface. Instead, the liquid tends to stretch more freely in the internal space of packing and therefore detach more easily from it. Consequently, the gas–liquid interface formed per unit of packing space is diminished.
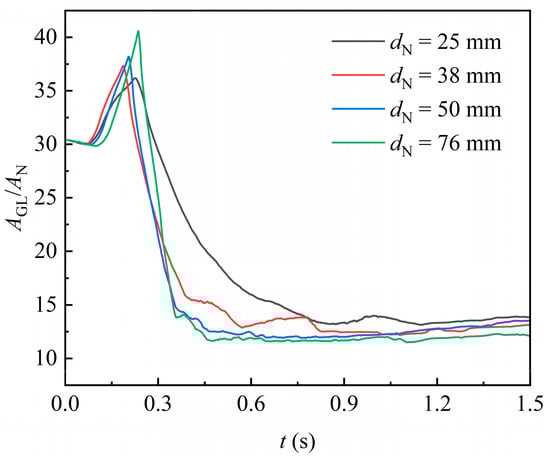
Figure 12.
Effect of different packing orientation on the gas–liquid interface area.
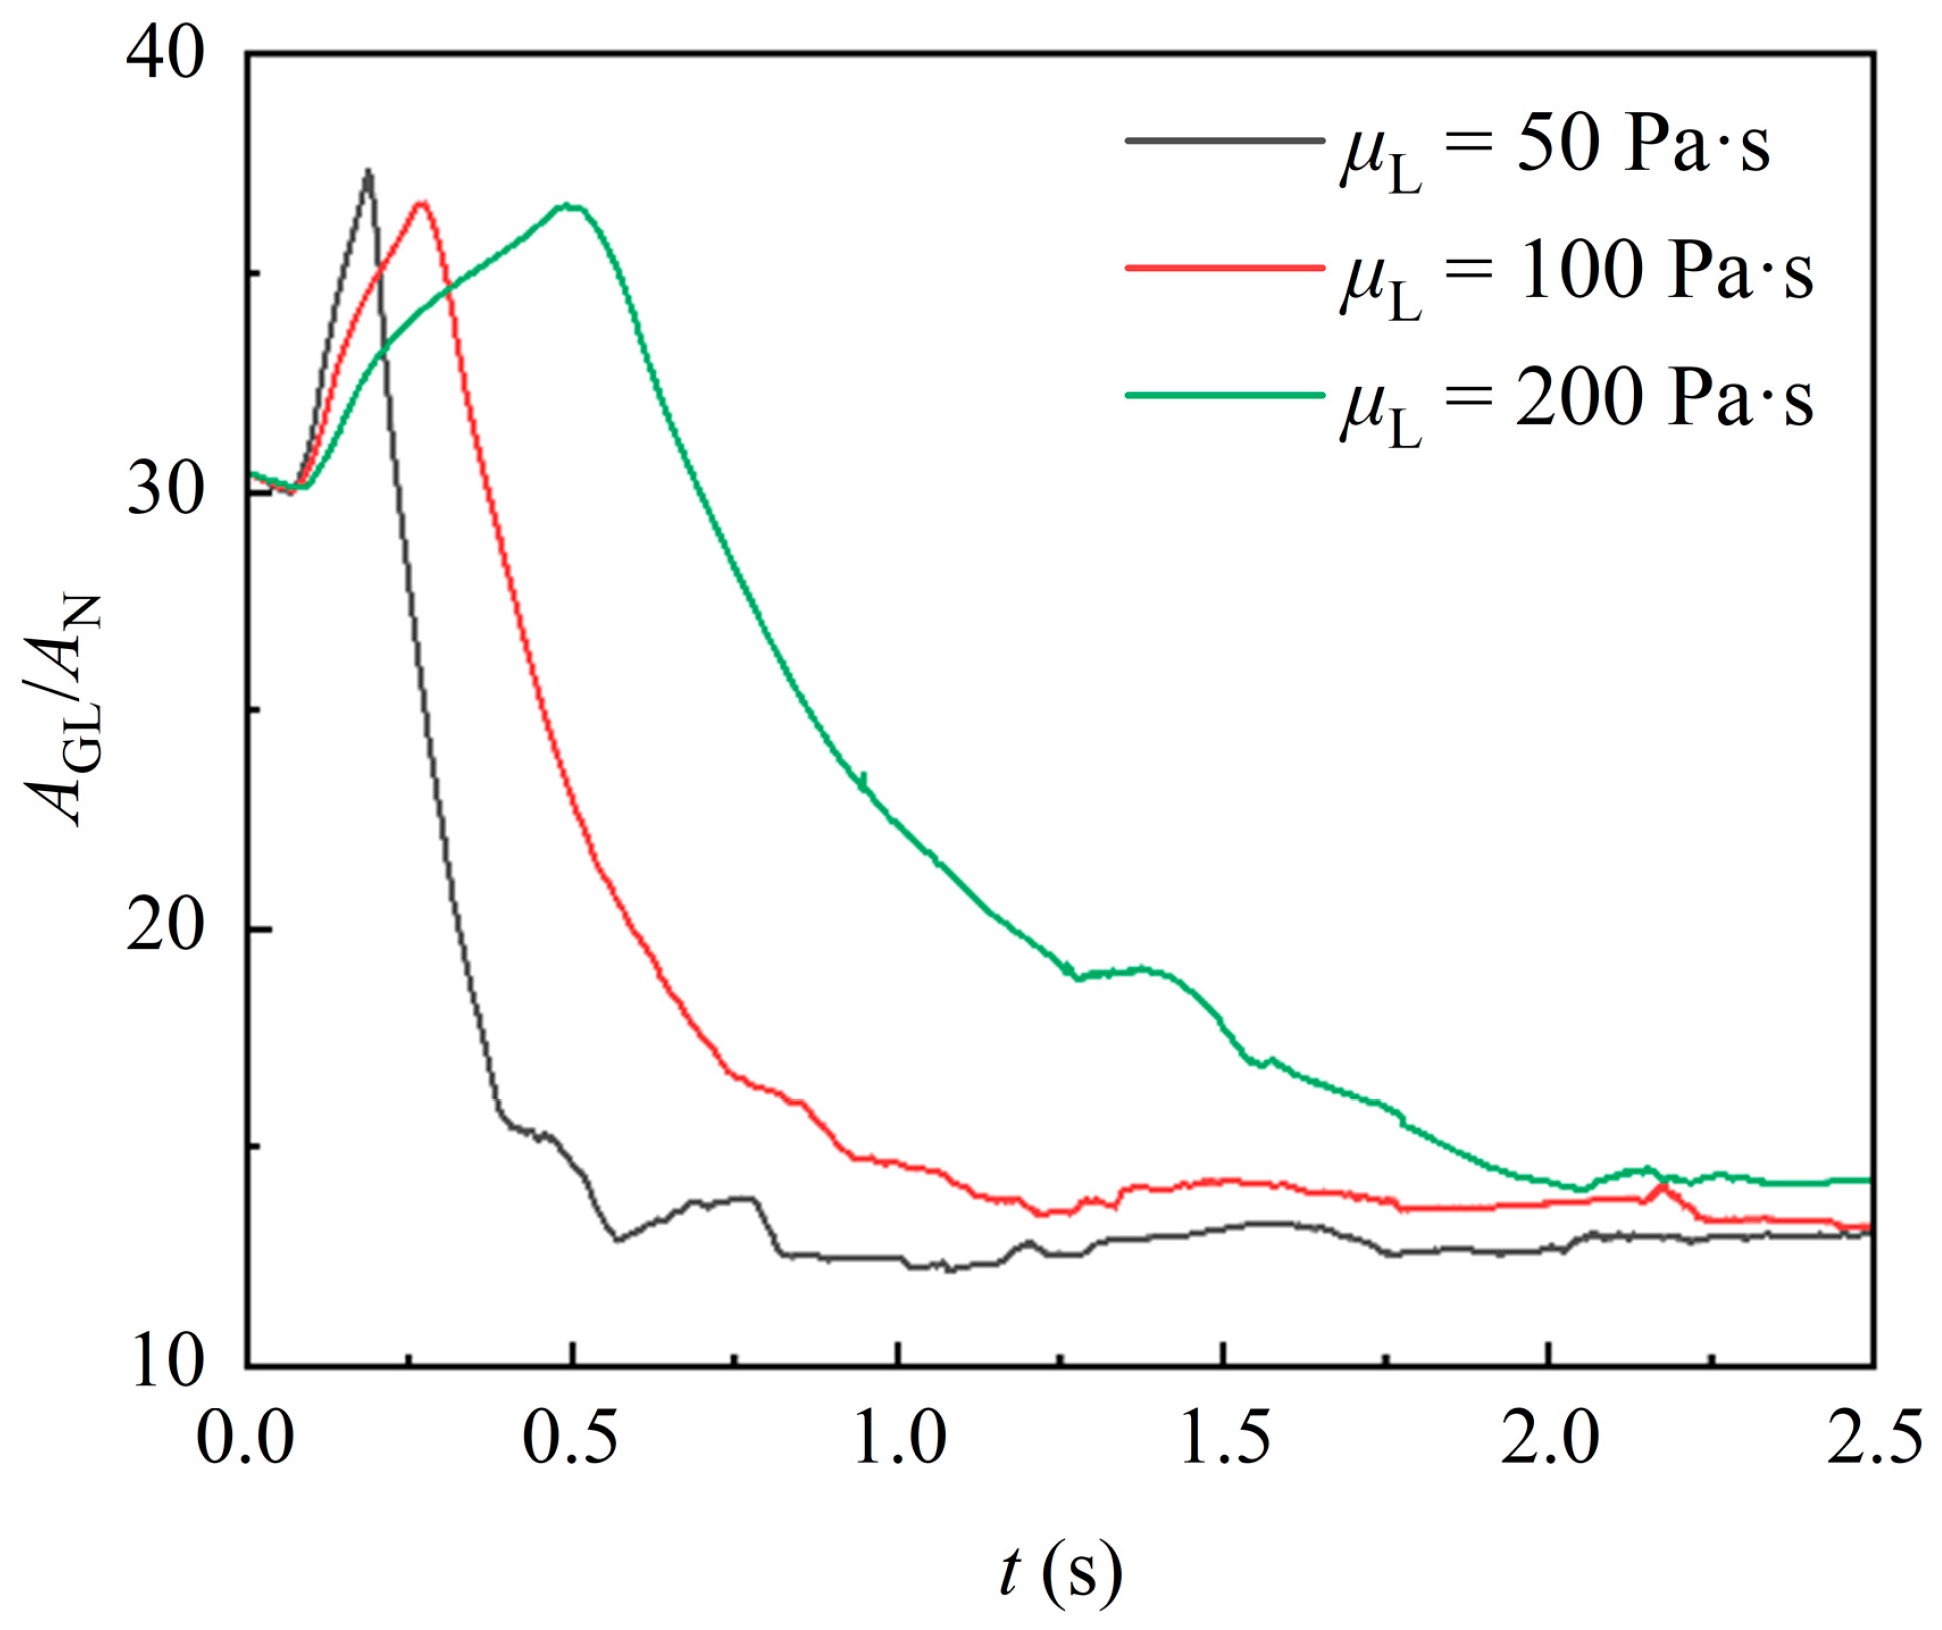
Figure 13 shows the temporal variation of the gas–liquid interface area of liquid with different viscosities. It is obvious that the gas–liquid interface deformation is significantly slower for the higher-viscosity liquids, which results from poorer fluidity and deformation. Notably, there is no significant difference in the maximum interface area of liquid with different viscosities. This can be attributed to the short duration of the encapsulation stage, during which the effects of liquid viscosity have not yet fully manifested. Meanwhile, the liquid with higher viscosity provides additional time for the gas–liquid interface area to reach its maximum, allowing all liquids to achieve a similar maximum interface area. Subsequently, the interface area of highly viscous liquid remains significantly larger. This is due to the greater tensile retardation effect of the viscous force in highly viscous liquid. As a result, the liquid exhibits a greater horizontal spread during the uncovering stage and accumulates a thicker liquid film on the packing surface.
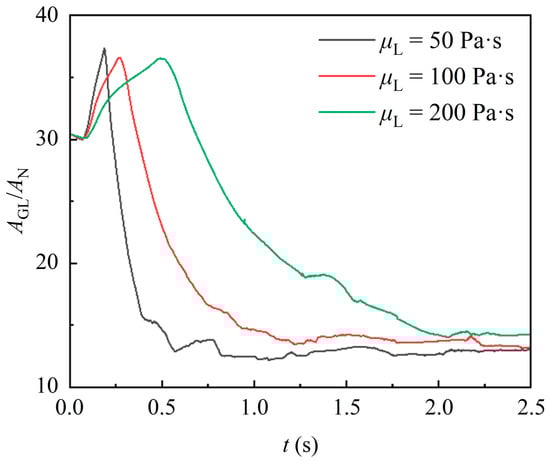
Figure 13.
Effect of different liquid viscosity on the gas–liquid interface area.
4.3. Gas–Liquid Interface Characteristics
In the last section, the dynamic characteristics of liquid flow are studied. On this basis, we aim to further determine the statistical average characteristics of liquid flow around the packing. To achieve this, we define the following parameters:
The liquid holding volume of the packing is calculated as follows:
where is the moment when curve first reaches the plateau in Figure 8, and is used to calculate the mean value over the specified time range.
The calculation of the film area of the packing is similar to the above:
As increases, and gradually stabilize. The value of is determined as the moment when the relative change rates of and fall below 0.01%.
The surface renewal rate of the liquid as it passes through the packing is calculated as follows:
To eliminate the bias caused by the specific orientation of the packing and to evaluate the characteristic parameters objectively, the above characteristic parameters are further statistically averaged.
4.3.1. Liquid Holding Volume of Packing
The liquid holding volume of packing is an important hydrodynamic parameter of packing, which reflects the flow resistance and available free flow space of the liquid in the packing and directly affects the capacity of the packing.
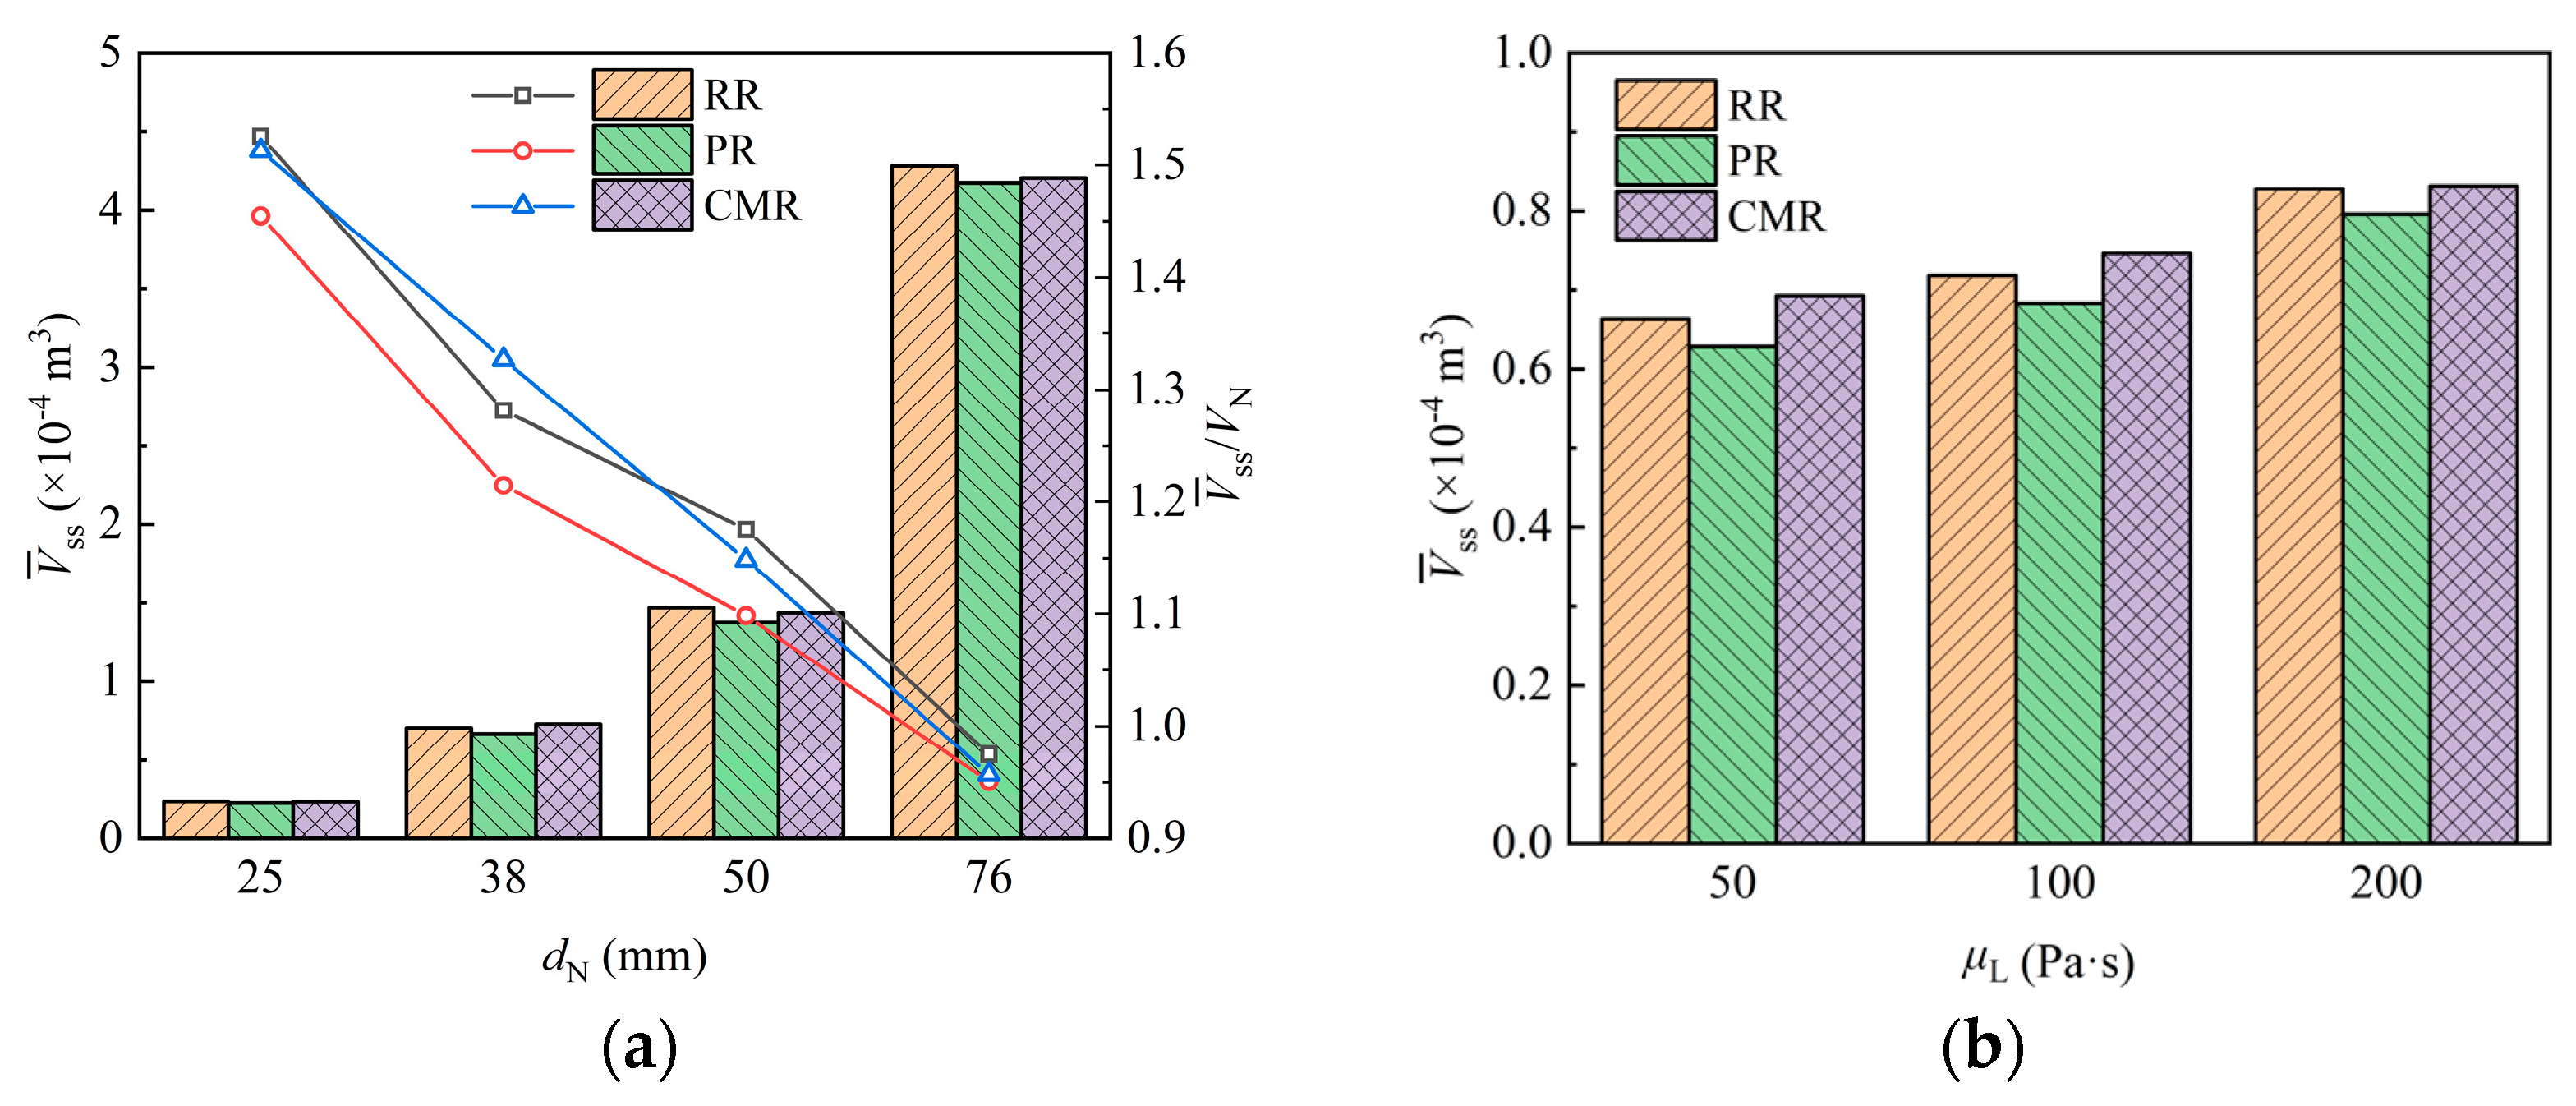
Figure 14a shows how the liquid holding volume of the packing varies with the packing size. It is evident that an increase in packing size leads to a higher liquid holding volume, which is obviously only due to the expanded packing surface providing a greater attachment area for liquid retention. However, compared to packings with a nominal diameter of 25 mm, the volume occupied by packings with diameters of 38 mm, 50 mm, and 76 mm increases by 2.5, 7, and 27 times, while the liquid holding volume only increases about 2, 5, and 17 times, respectively. The dot plot corresponding to the right vertical axis further shows that the liquid holding volume per unit packing volume decreases with increasing packing size at a rate of 0.6–1.8 mm−1. This is because the larger packing provides more space for the liquid to flow freely inside, which reduces the possibility of liquid accumulation on the packing surface, thereby decreasing liquid retention.
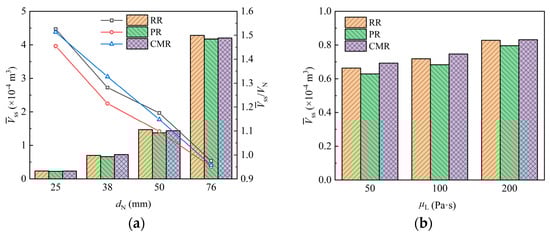
Figure 14.
Liquid holding volume of packing with different packing size (a) and liquid viscosity (b).
Figure 14b shows the variation in liquid holding volume when liquids with different viscosity contact the packing. The results show that the liquid holding volume for liquids with viscosities of 100 Pa·s and 200 Pa·s increases by 8% and 24%, respectively, compared to that of the 50 Pa·s liquid. This is due to the poorer fluidity and higher flow resistance of more viscous liquids. As a result, the liquid flow rate slows down on the packing surface and within its pores, increasing the residence time of liquid and leading to greater liquid accumulation in the packing.
4.3.2. Liquid Film Area on Packing
Film characteristics are essential for mass transfer in chemical processes, with the film area being a key factor. Enhancing the film area on the packing is an effective strategy to intensify the mass transfer process, so it is necessary to quantitatively obtain the film area on the packing.
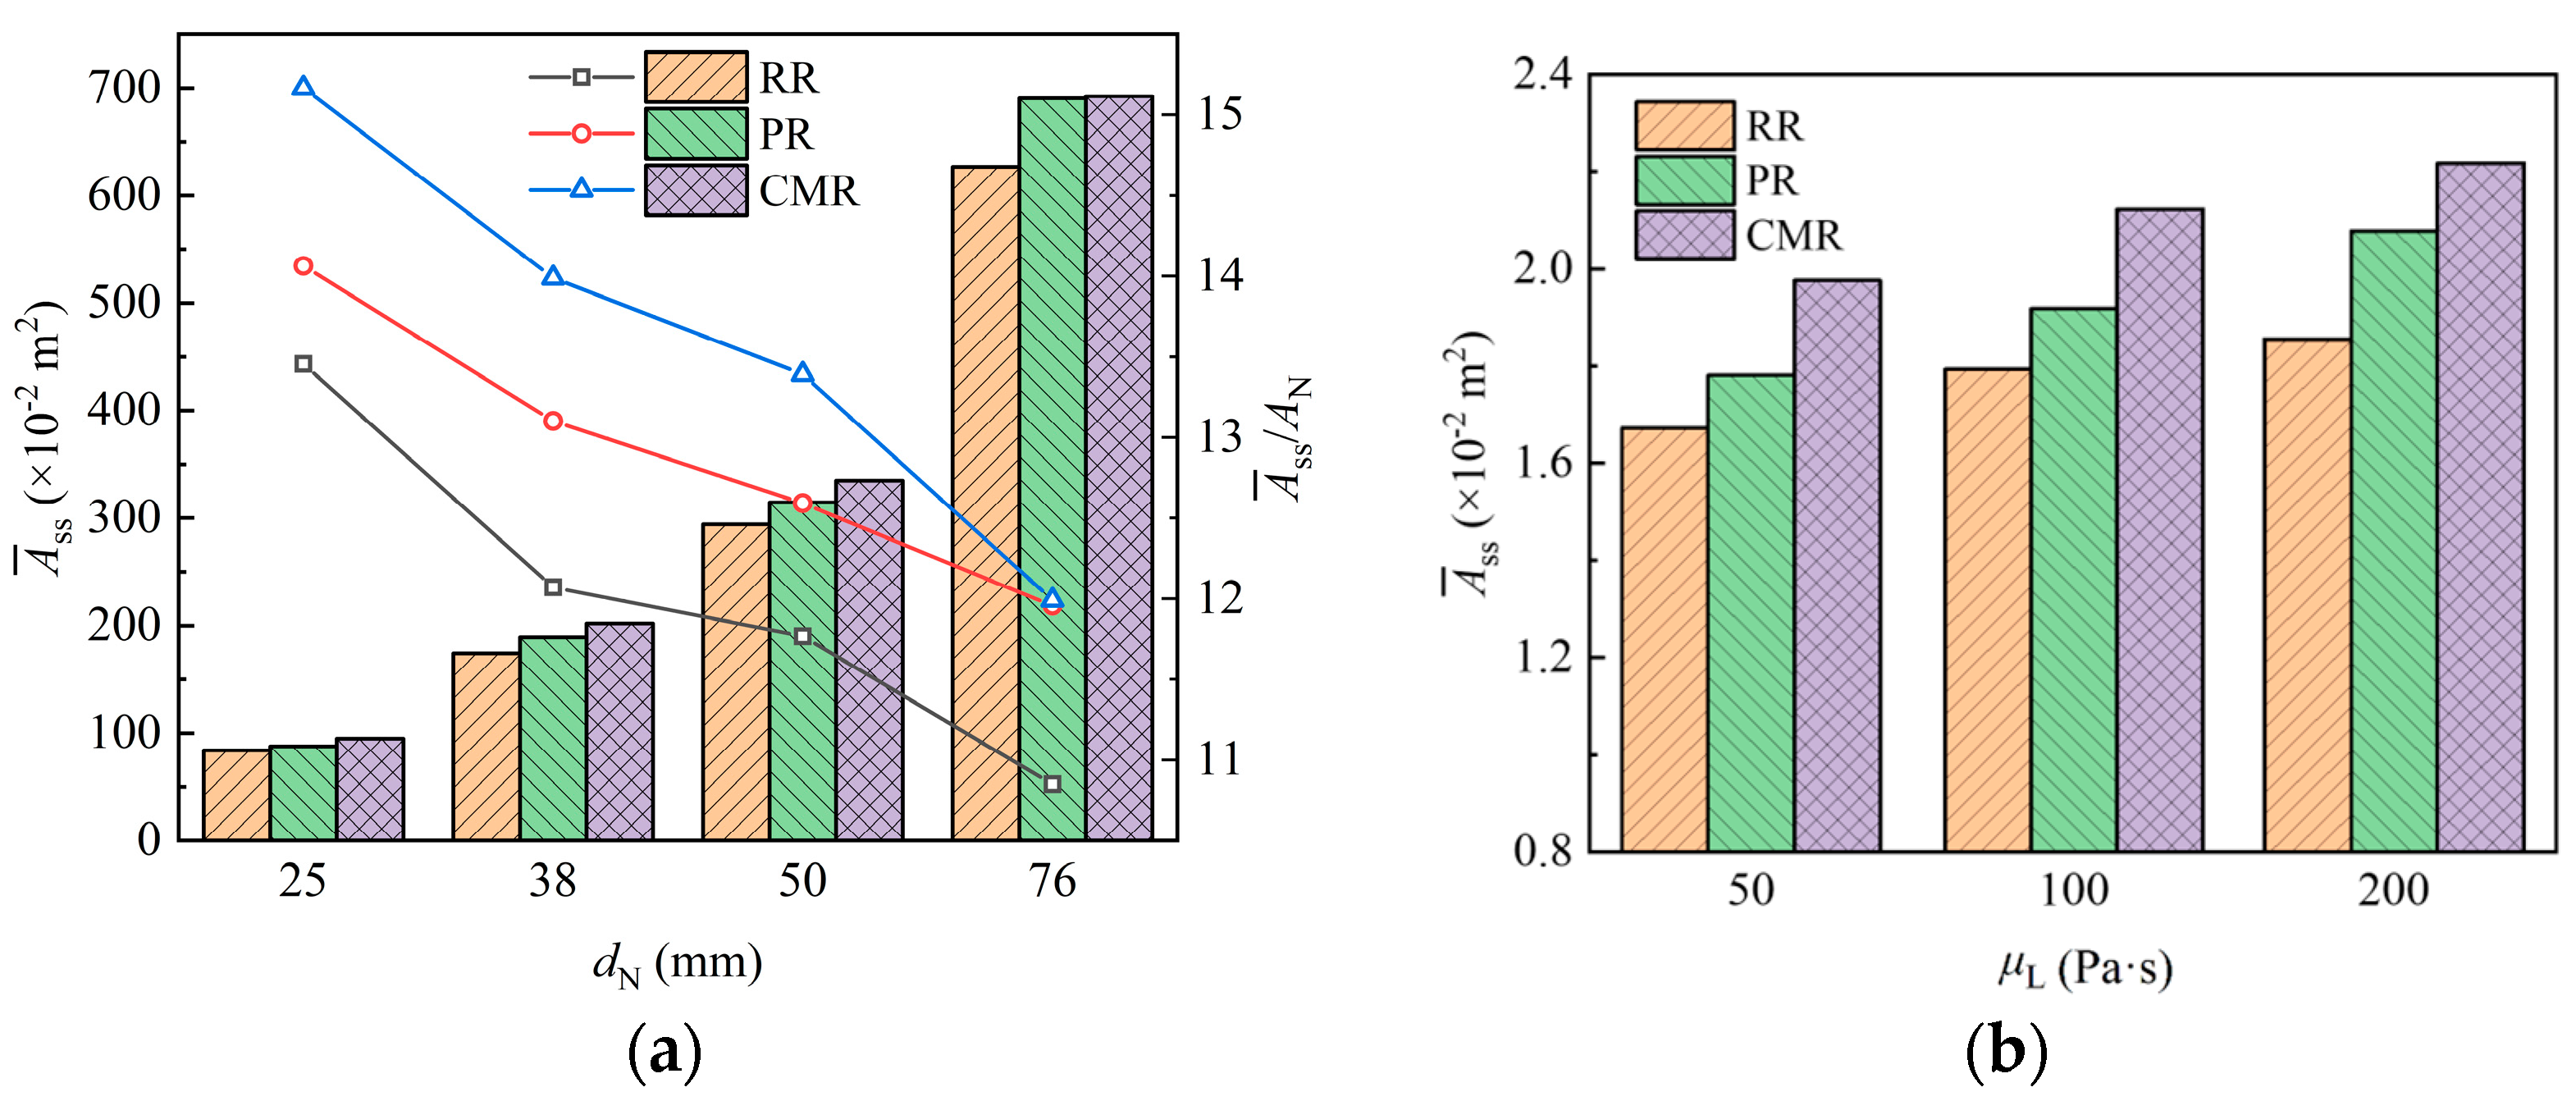
Figure 15 shows the film areas for packings with different sizes, in which it can be seen that there is the lowest film area on the Raschig ring (RR) packing, generally. This is attributed to the liquid being entirely distributed on its annular surface, with the internal space of the packing remaining underutilized. In contrast, the Pall ring (PR) features windows on its annular surface and an internal sheet inside the ring, which is beneficial for the liquid attaching and distribution, thereby increasing the film area, while the Cascade mini ring (CMR) further enhances the area due to its outward-flanged structure.
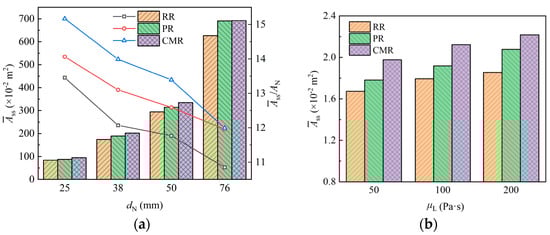
Figure 15.
Film area of packing with different packing size (a) and liquid viscosity (b).
Figure 15a shows the variation in the film area on the packing with the packing size. As packing size increases, the surface area of a single packing increases accordingly, providing more surface for liquid wetting and thereby increasing the film area on the packing. However, larger packings also provide wider channels for free liquid flow, and the liquid more easily detaches from these packings due to lower flow resistance. Therefore, this reduces the proportion of the surface area available for liquid wetting, leading to a decrease in the film area per unit volume of packing.
The variation in film area when liquids with different viscosity contact the packing is shown in Figure 15b. The results show that the film area increases as the liquid viscosity increases. Compared with liquid with a viscosity of 50 Pa·s, the film area for liquids with viscosities of 100 Pa·s and 200 Pa·s increased by about 7.4% and 13.2%, respectively. This is because the flow resistance of the high-viscosity liquid is larger, which makes the liquid less mobile and results in thicker liquid films on the packing surface. These thicker films cover a larger packing surface, thereby increasing the overall film area.
4.3.3. Surface Renewal Rate of Packing
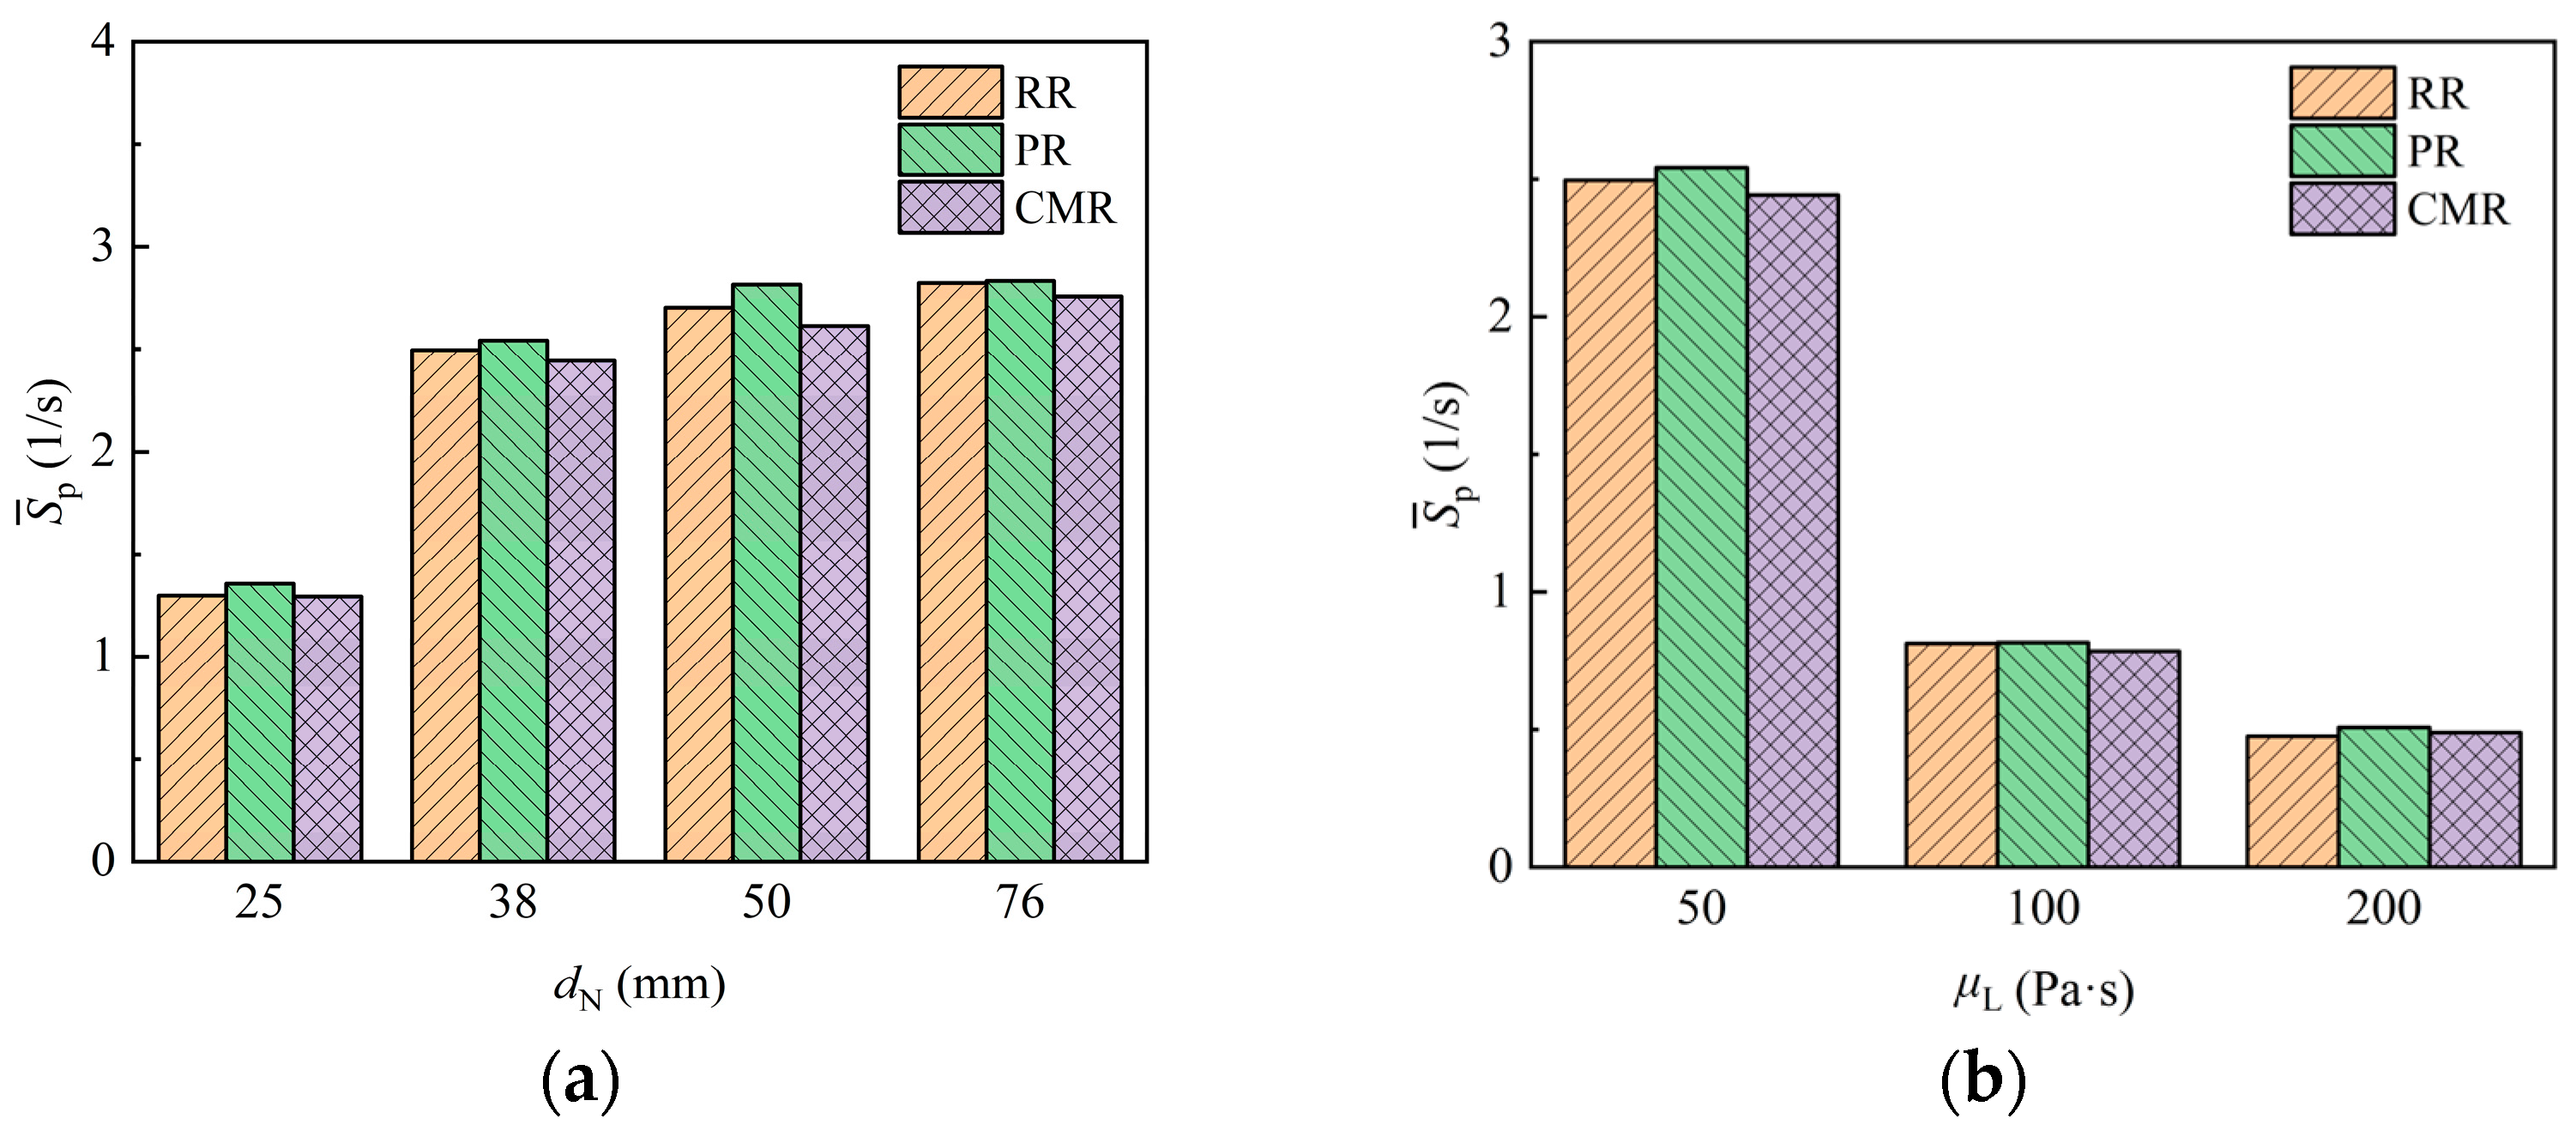
The surface renewal of fluid can reflect the dynamic transport behavior at the interface and provides a crucial reference for assessing the mass transfer process. Figure 16 shows the surface renewal rate results for packings with different sizes as liquids with different viscosities flow around them. When the liquid viscosity is 50 Pa·s, the surface renewal rate of the packing is in the range of 1–3 s−1, aligning with the results of the disc reactor dealing with highly viscous fluids [23,24], while the surface renewal rate of the Pall ring (PR) is slightly higher than that of the Raschig ring (RR) and Cascade mini ring (CMR) in general. Generally, the surface renewal rate rises as the packing size increases. However, when the nominal diameter of the packing exceeds 38 mm, the growth of the surface renewal rate decreases significantly with increasing packing size. This is because the increased interface area for larger packing reduces the difference in its variation per unit interface area. For the laminar flow of highly viscous fluid around the packing, the surface renewal only comes from the deformation and stretching of the liquid. As the liquid viscosity increases, the surface renewal rate exhibits a significant reduction. Compared to liquid with a viscosity of 50 Pa·s, the surface renewal rate for liquids with viscosities of 100 Pa·s and 200 Pa·s decreases by about 68% and 80%, respectively. Consequently, the higher-viscosity liquid tends to stagnate in the packing, which is more likely to cause blockage and the formation of dead zones, thereby imposing stricter limitations on the operational load.
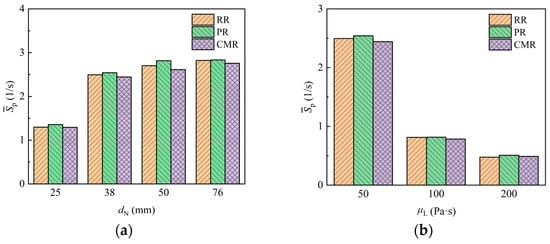
Figure 16.
Surface renewal rate of packing with different packing size (a) and liquid viscosity (b).
4.3.4. Specific Area of Liquid on Packing
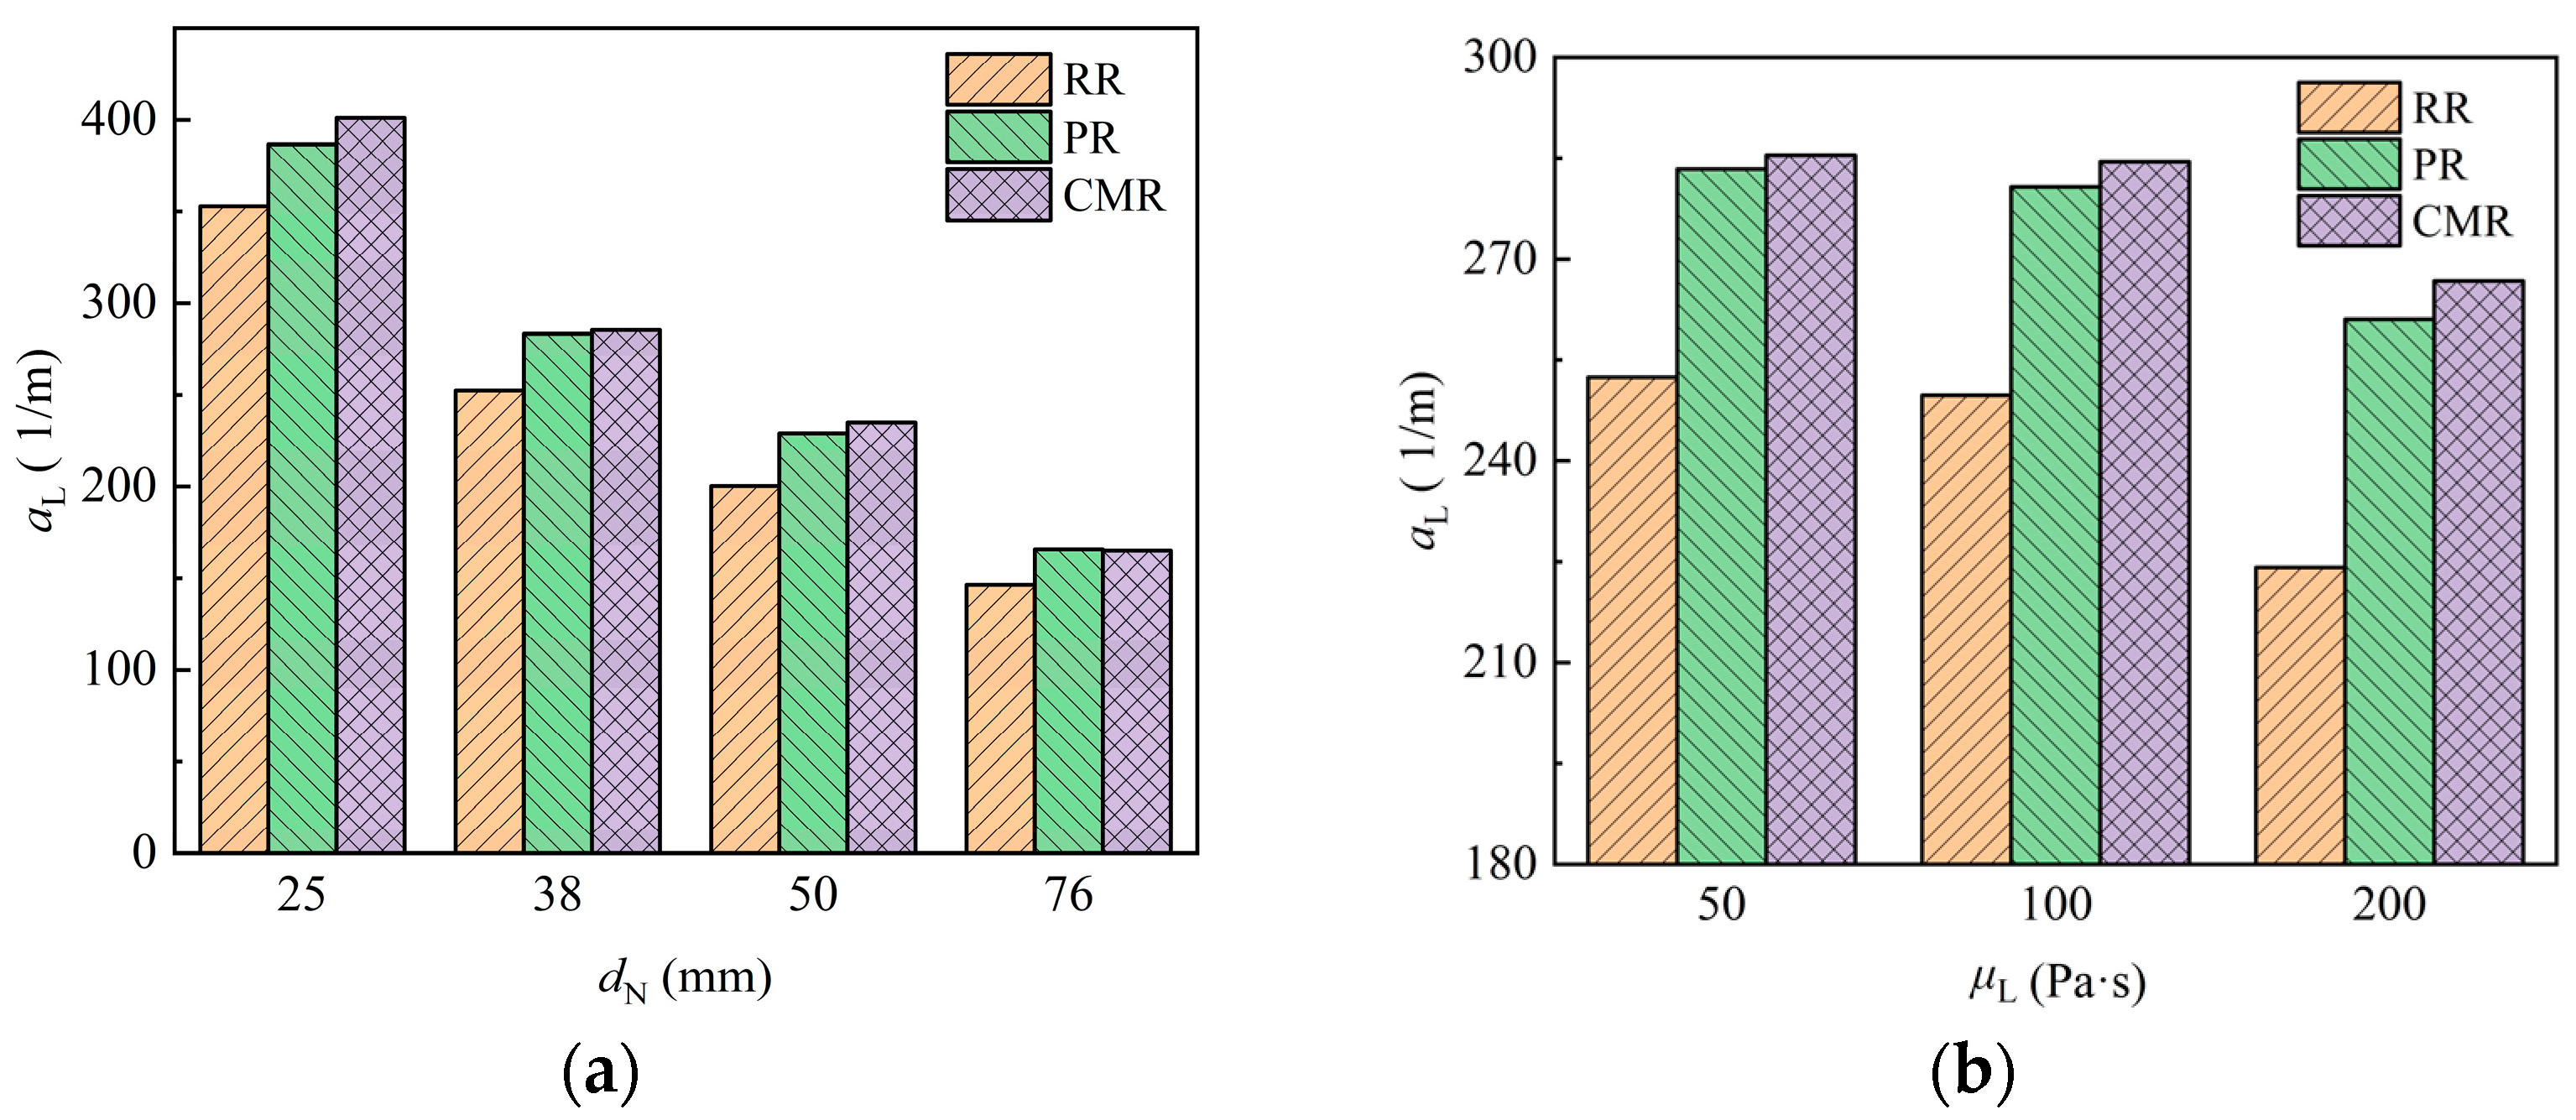
The specific area of liquid in the packing, defined as the gas–liquid interface area exposed per unit liquid volume on the packing, reflects the dispersion behavior of the liquid. A higher specific area indicates a more uniform liquid distribution, making it an important parameter for evaluating packing performance. It can be expressed as follows:
Figure 17 shows the variation of the specific area of liquid in different packings with packing size and liquid viscosity. The Raschig ring (RR) exhibits the smallest specific area, while the Cascade mini ring (CMR) has a slightly higher specific area than the Pall ring (PR). With the increase of packing size and the decrease of liquid viscosity, the specific area of liquid rises, indicating more uniform liquid dispersion.

Figure 17.
Specific area of liquid in the packing under different packing size (a) and liquid viscosity (b).
4.3.5. Correlation of Liquid Specific Area on Packing
To evaluate the influence of the liquid viscosity and packings on the specific area of liquid, a correlation was developed based on the following dimensionless numbers [25]:
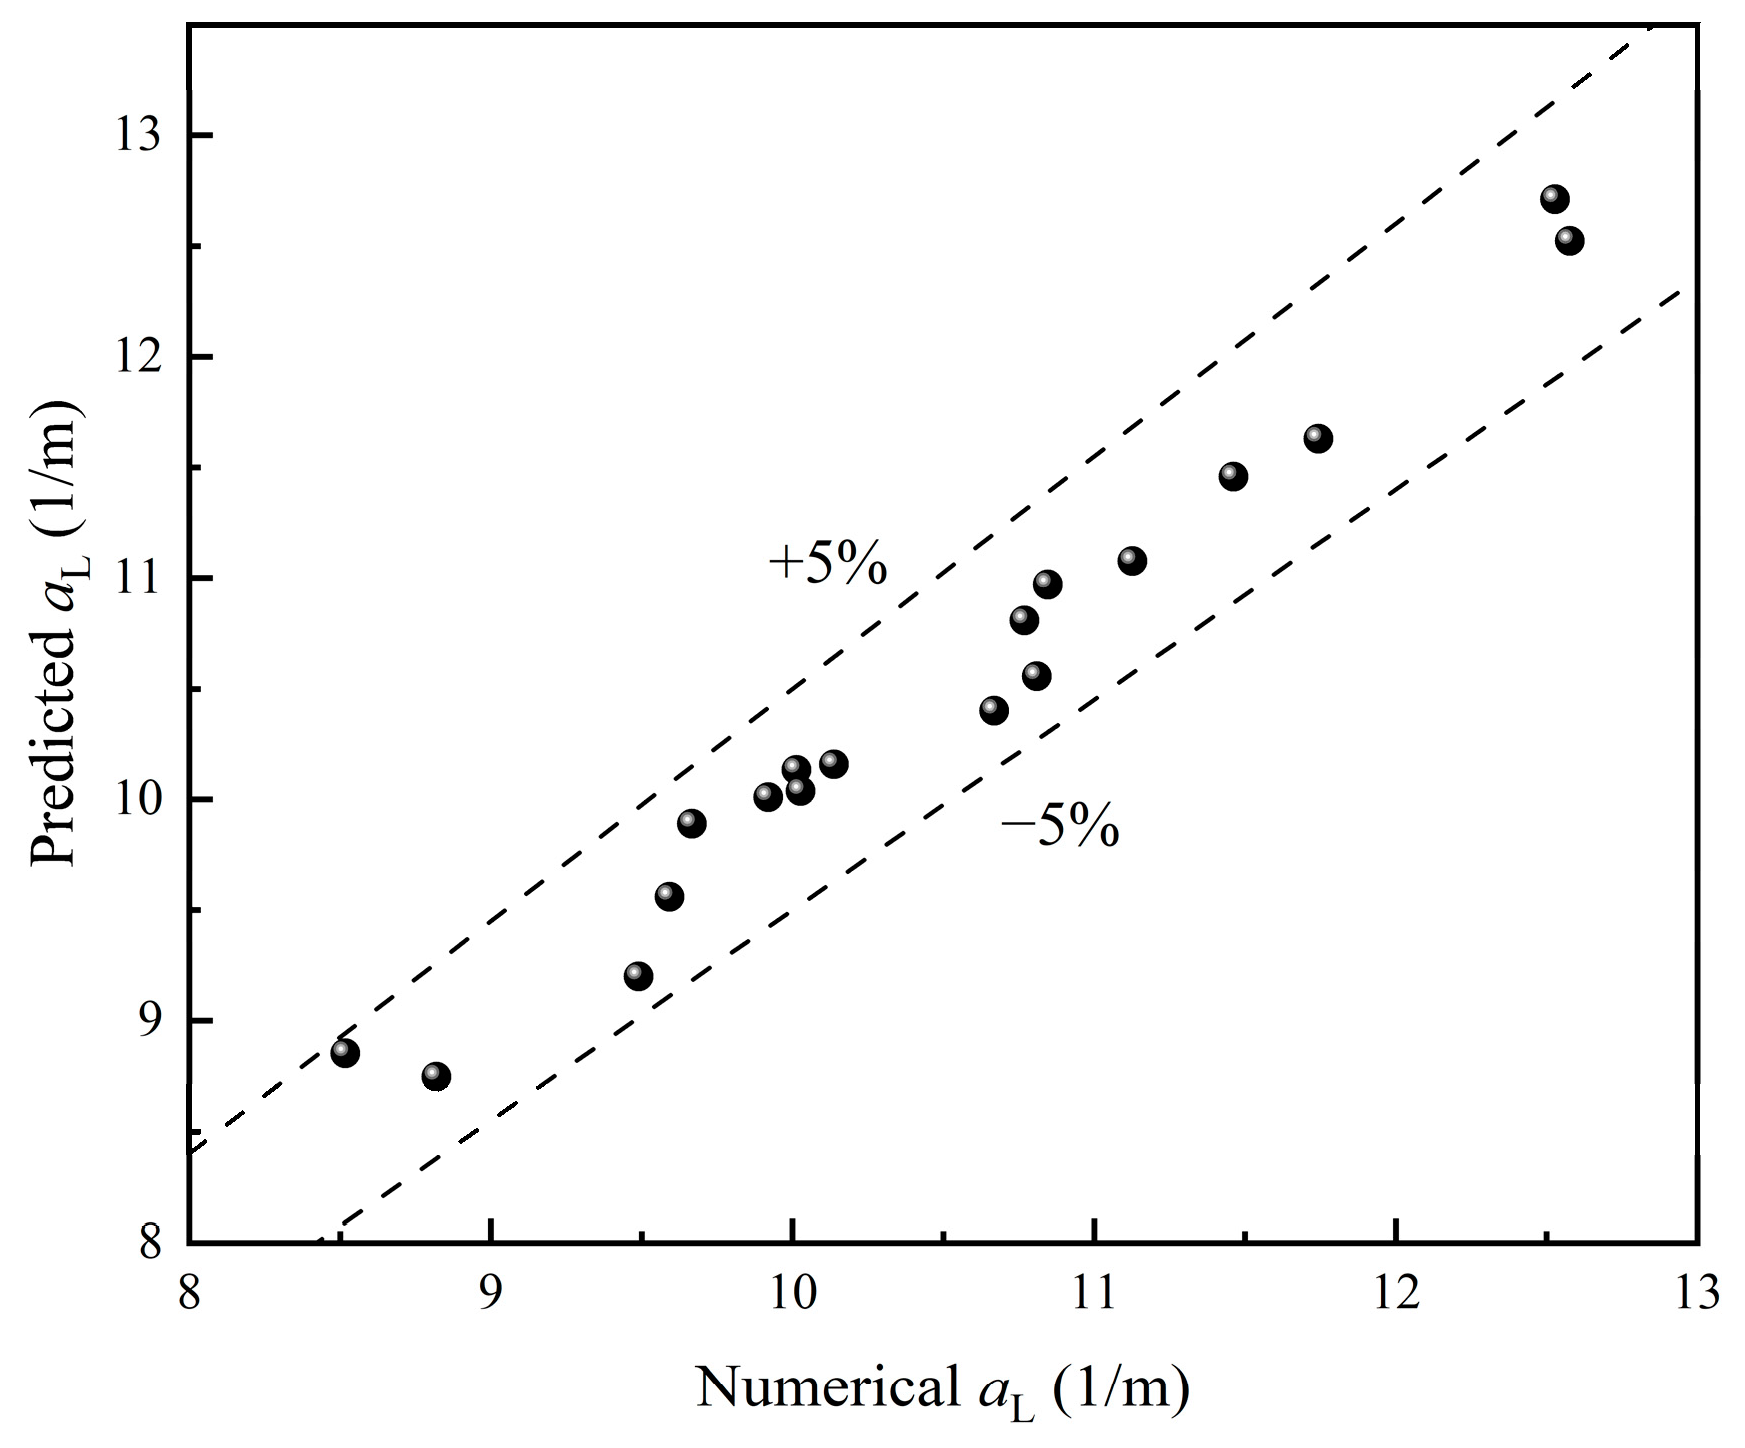
For the dimensionless number ranges of 5.82 ≤ ≤ 46.5 and 114 ≤ ≤ 1053, the specific area of liquid in the packing is correlated as follows:
For different packing types, the values of pre-factor are listed below:
A comparison between numerical and predicted is shown in Figure 18, indicating good consistency with deviations within ±5%. Overall, the correlation is demonstrated to be capable of providing a reliable prediction of .
Figure 18.
Comparison of numerical and predicted data of .
5. Conclusions
In this work, the flow characteristics of highly viscous fluid around a single packing are numerically simulated. The variation in liquid profile, velocity distribution, and flow parameters are investigated. The effects of different packing sizes and liquid viscosity on flow characteristics are studied, and a correlation for the specific area of liquid is established. It provides a simple and feasible simulation method to compare the flow behavior of highly viscous fluid in different packings. The main conclusions are as follows:
- (1).
- The interaction between the highly viscous liquid and the packing involves several main stages: approaching, encapsulation, uncovering, and detachment. As liquid viscosity increases, the timing of these stages is delayed. However, the overall liquid profile remains similar across different viscosities.
- (2).
- Before the first portion of liquid detaches from the packing, the liquid shrinkage section exhibits high velocity, facilitating liquid detachment. Meanwhile, the lowest liquid velocity occurs near the packing surface, promoting liquid adhesion to the packing during the detachment stage.
- (3).
- As the liquid begins to exit the domain, its volume decreases while the corresponding gas–liquid interface area reaches a maximum. Under the action of gravity, the liquid attached to the packing surface detaches in batches. This results in multiple plateaus in liquid volume, while the gas–liquid interface area fluctuates continuously. Over time, these values stabilize, and the change rate of the interface area transitions from positive to negative as the flow progresses from the encapsulation to the uncovering stage.
- (4).
- Increasing liquid viscosity leads to a higher liquid holding volume and film area of the packing. Conversely, increasing packing size results in a lower liquid holding volume and film area per unit packing space. When liquid viscosity exceeds 50 Pa·s, the surface renewal rate of the packing does not exceed 3 s−1 and decreases with higher viscosity and smaller packing sizes.
- (5).
- The specific area of liquid increases with decreasing packing size and liquid viscosity. Comparative results show that the specific area follows the order CMR > PR > RR. A correlation is developed to fit the specific area for highly viscous fluids flowing around a single packing. The pre-factor in this correlation reflects the relative magnitude of the specific area for different packing types.
- (6).
- The simulation results show that the surface renewal rate of packing is in the range of 0.5–3 s−1, and the specific area of liquid on packing is in the range of 150–400 m−1. These results are consistent with the order of magnitude of the disc reactor dealing with highly viscous fluids [23,24], indicating that the packing can provide similar mass transfer performance without additional cost.
These results show that this work provides a fundamental reference for realizing the interfacial characteristics in packed columns involving highly viscous fluids. The simulation method presented in this work is simple and effective, and it can be easily extended to the simulation and interface characteristic evaluation of other random packings.
Author Contributions
Conceptualization, X.L.; writing—original draft preparation, X.L.; writing—review and editing, J.W.; supervision, Z.G. All authors have read and agreed to the published version of the manuscript.
Funding
This research was funded by China Petrochemical Corporation (Sinopec Group, project number: 223177 and 222129).
Data Availability Statement
The original contributions presented in this study are included in the article. Further inquiries can be directed to the corresponding authors.
Acknowledgments
The authors would also like to acknowledge the Center for Fluid Mixing and Reactor Engineering of Beijing University of Chemical Technology for providing access to the computer cluster.
Conflicts of Interest
The authors declare no conflicts of interest.
Abbreviations
| Variable | |
| Specific area of liquid in the packing, 1/m | |
| Gas–liquid interface area, m2 | |
| Reference area, m2 | |
| Film area, m2 | |
| Nominal diameter of the packing, mm | |
| Surface force, N | |
| Gravitational acceleration, m/s2 | |
| Pressure, Pa | |
| Outlet pressure, Pa | |
| Surface renewal rate, s−1 | |
| Time, s | |
| Moment when the liquid volume first reaches the plateau, s | |
| Final moment to calculate the liquid volume, s | |
| Velocity, m/s | |
| Initial liquid velocity, m/s | |
| Liquid volume, m3 | |
| Reference volume, m3 | |
| Liquid holding volume, m3 | |
| Subscripts | |
| l | Liquid phase |
| g | Gas phase |
| Dimensionless Groups | |
| Ohnesorge number | |
| Bond number | |
| Abbreviations | |
| CFD | Computational fluid dynamics |
| CMR | Cascade mini ring |
| Probability density function | |
| PR | Pall ring |
| RR | Raschig ring |
| VOF | Volume of fluid |
References
- Wang, Q.; Zhang, W.; Wang, C.; Han, X.; Wang, H. Microstructure of heavy oil components and mechanism of influence on viscosity of heavy oil. ACS Omega 2023, 8, 10980–10990. [Google Scholar] [CrossRef]
- Rodriguez, G.; Micheletti, M.; Ducci, A. Macro-and micro-scale mixing in a shaken bioreactor for fluids of high viscosity. Chem. Eng. Res. Des. 2018, 132, 890–901. [Google Scholar] [CrossRef]
- Chen, C.C.; Huang, Y.H.; Fang, J.Y. Hydrophobic deep eutectic solvents as green absorbents for hydrophilic VOC elimination. J. Hazard. Mater. 2022, 424, 127366. [Google Scholar] [CrossRef]
- Gao, N.; Yang, Y.; Wang, Z.; Guo, X.; Jiang, S.; Li, J.; Hu, Y.; Liu, Z.; Xu, C. Viscosity of ionic liquids: Theories and models. Chem. Rev. 2023, 124, 27–123. [Google Scholar] [CrossRef] [PubMed]
- Hirschfeld, S.; Wünsch, O. Mass transfer during bubble-free polymer devolatilization: A systematic study of surface renewal and mixing effects. Heat. Mass. Tran. 2020, 56, 25–36. [Google Scholar] [CrossRef]
- De San Luis, A.; Santini, C.C.; Chalamet, Y.; Dufaud, V. Removal of volatile organic compounds from bulk and emulsion polymers: A comprehensive survey of the existing techniques. Ind. Eng. Chem. Res. 2019, 58, 11601–11623. [Google Scholar] [CrossRef]
- Wiesinger, H.; Wang, Z.; Hellweg, S. Deep dive into plastic monomers, additives, and processing aids. Environ. Sci. Tech. 2021, 55, 9339–9351. [Google Scholar] [CrossRef] [PubMed]
- Amini, Y.; Karimi-Sabet, J.; Nasr Esfahany, M.; Haghshenasfard, M.; Dastbaz, A. Experimental and numerical study of mass transfer efficiency in new wire gauze with high capacity structured packing. Sep. Sci. Technol. 2019, 54, 2706–2717. [Google Scholar] [CrossRef]
- Lhuissier, M.; Couvert, A.; Kane, A.; Amrane, A.; Biard, P.F. Volatile organic compounds absorption in a structured packing fed with waste oils: Experimental and modeling assessments. Chem. Eng. Sci. 2021, 238, 116598. [Google Scholar] [CrossRef]
- Song, D.; Seibert, A.F.; Rochelle, G.T. Mass Transfer Parameters for Packings: Effect of Viscosity. Ind. Eng. Chem. Res. 2018, 57, 718–729. [Google Scholar] [CrossRef]
- Amini, Y.; Nasr Esfahany, M. CFD simulation of the structured packings: A review. Sep. Sci. Technol. 2019, 54, 2536–2554. [Google Scholar] [CrossRef]
- Kang, J.L.; Huang, S.H.; Jang, S.S. Evaluation of Hydrodynamic Performance of New Random Packing Structure Using CFD. Processes 2022, 10, 1276. [Google Scholar] [CrossRef]
- Haroun, Y.; Raynal, L.; Alix, P. Prediction of effective area and liquid hold-up in structured packings by CFD. Chem. Eng. Res. Des. 2014, 92, 2247–2254. [Google Scholar] [CrossRef]
- Macfarlan, L.H.; Phan, M.T.; Eldridge, R.B. Structured packing geometry study for liquid-phase mass transfer and hydrodynamic performance using CFD. Chem. Eng. Sci. 2022, 249, 117353. [Google Scholar] [CrossRef]
- Fu, Y.; Bao, J.; Singh, R.; Wang, C.; Xu, Z. Investigation of countercurrent flow profile and liquid holdup in random packed column with local CFD data. Chem. Eng. Sci. 2020, 221, 115693. [Google Scholar] [CrossRef]
- Fu, Y.; Bao, J.; Singh, R.K.; Zheng, R.F.; Anderson-Cook, C.M.; Bhat, K.S.; Xu, Z. The influence of random packed column parameters on the liquid holdup and interfacial area. AIChE J. 2022, 68, e17691. [Google Scholar] [CrossRef]
- Xie, H.; Zong, Y.; Shen, L.; Dai, G. Interfacial mass transfer intensification with highly viscous mixture. Chem. Eng. Sci. 2021, 236, 116531. [Google Scholar] [CrossRef]
- Chen, S.; Zhang, L.; Wang, Y.; Zhang, X.; Chen, W. Residence time distribution of high viscosity fluids falling film flow down outside of industrial-scale vertical wavy wall: Experimental investigation and CFD prediction. Chin. J. Chem. Eng. 2019, 27, 1586–1594. [Google Scholar] [CrossRef]
- Lin, Y.; Zhang, G.; Yi, Z.; Cong, M.; Shen, H.; Zhao, J. Experimental study and CFD simulation on the falling film characteristics of viscous fluid outside a vertical tube at very low Reynolds numbers. Chem. Eng. Res. Des. 2025, 216, 174–185. [Google Scholar] [CrossRef]
- Mohan, A.; Tomar, G. Volume of fluid method: A brief review. J. Indian. Inst. Sci. 2024, 104, 229–248. [Google Scholar] [CrossRef]
- Montazeri, H.; Zandavi, S.H. Derivative of Heaviside step function vs. delta function in continuum surface force (CSF) models. Int. J. Multiphas. Flow. 2018, 100, 196–199. [Google Scholar] [CrossRef]
- De Moura, C.A.; Kubrusly, C.S. The courant–friedrichs–lewy (cfl) condition. AMC 2013, 10, 45–90. [Google Scholar]
- Cheng, W.; Wang, J.; Gu, X.; Feng, L. Film flow on rotating wheel in a horizontal twin-shaft reactor for polymer devolatilization. Chem. Eng. Sci. 2018, 191, 468–478. [Google Scholar] [CrossRef]
- Li, L.; Xie, H.; He, L.; Deng, B.; Zong, Y.; Yang, X.; Zhao, L.; Dai, G. Numerical investigation of twin-liquid film on spoked rotating disk reactor with highly viscous fluid. Chem. Eng. Sci. 2022, 255, 117666. [Google Scholar] [CrossRef]
- Sahoo, P.C.; Senapati, J.R.; Rana, B.K. Characterization of Droplet Collision and Breakup on a Hemispherical Target. Ind. Eng. Chem. Res. 2024, 63, 20883–20902. [Google Scholar] [CrossRef]

Disclaimer/Publisher’s Note: The statements, opinions and data contained in all publications are solely those of the individual author(s) and contributor(s) and not of MDPI and/or the editor(s). MDPI and/or the editor(s) disclaim responsibility for any injury to people or property resulting from any ideas, methods, instructions or products referred to in the content. |
© 2025 by the authors. Licensee MDPI, Basel, Switzerland. This article is an open access article distributed under the terms and conditions of the Creative Commons Attribution (CC BY) license (https://creativecommons.org/licenses/by/4.0/).