Article

A Novel Fe(III)-Complex with 1,10-Phenanthroline and Succinate Ligands: Structure, Intermolecular Interactions, and Spectroscopic and Thermal Properties for Engineering Applications

by
Danilo Gualberto Zavarize
1,
João G. de Oliveira Neto
1,*,
Kamila Rodrigues Abreu
1,
Alejandro Pedro Ayala
2,
Francisco Ferreira de Sousa
3 and
Adenilson Oliveira dos Santos
1
1
Center for Social Sciences, Health and Technology, Federal University of Maranhão—UFMA, Imperatriz 65900-410, Brazil
2
Department of Physics, Center of Sciences, Federal University of Ceara—UFC, Fortaleza 60455-970, Brazil
3
Institute of Exact and Natural Sciences, Federal University of Para—UFPA, Belem 66075-110, Brazil
*
Author to whom correspondence should be addressed.
Processes 2025, 13(5), 1267; https://doi.org/10.3390/pr13051267
Submission received: 17 March 2025 / Revised: 16 April 2025 / Accepted: 18 April 2025 / Published: 22 April 2025
(This article belongs to the Special Issue Transport and Energy Conversion at the Nanoscale and Molecular Scale)

Abstract

:
A new complex, tetrakis(1,10-phenanthroline)-bis(succinate)-(µ₂-oxo)-bis(iron(III)) nonahydrate, [Fe2(Phen)4(Succinate)2(μ-O)](H2O)9, was synthesized using the slow evaporation method. This study provides a comprehensive characterization of this coordination compound, focusing on its structural, spectroscopic, and thermal properties, which are relevant for applications in catalysis, material science, and chemical engineering processes. Single-crystal X-ray diffraction (XRD), Raman spectroscopy, Fourier-transform infrared (FT-IR), ultraviolet-visible (UV-Vis) spectroscopy, and thermoanalytical analyses were employed to investigate the material properties. Intermolecular interactions were further explored through Hirshfeld surface analysis. XRD results revealed a monoclinic crystal system with the C2/c space group, lattice parameters: a = 12.7772(10) Å, b = 23.0786(15) Å, c = 18.9982(13) Å, β = 93.047(2)°, V = 5594.27(7) Å3, and four formulas per unit cell (Z = 4). The crystal packing is stabilized by C–H⋯O, C–O⋯H, C–H⋯π, and π⋯π intermolecular interactions, as confirmed by vibrational spectroscopy. The heteroleptic coordination environment, combining weak- and strong-field ligands, results in a low-spin state with an estimated crystal field stabilization energy of −4.73 eV. Electronic properties indicate direct allowed transitions (γ = 2) with a maximum optical band gap of 2.66 eV, suggesting potential applications in optoelectronics and photochemical processes. Thermal analysis demonstrated good stability within the 25–136 °C range, with three main stages of thermal decomposition, highlighting its potential for use in high-temperature processes. These findings contribute to the understanding of Fe(III)-based complexes and their prospects in advanced material design, catalytic systems, and process optimization.

1. Introduction

The synthesis and investigation of properties of 1,10-phenanthroline (PHEN) crystal derivatives coordinated to metals with other highly active co-ligands have become more important due to their multifunctional applications [1,2]. It is a versatile N-heterocyclic organic compound widely used as a ligand in green chemistry due to its ability to form stable coordination compounds with various metal ions [3] that have shown multiple applications in luminescence [4], catalysis and photocatalysis [5], electrochemistry [6], spintronics [7], among others [8,9,10].
With this background, PHEN-derived complexes are of high scientific value because of specific structural, spectroscopical, and thermal properties and useful intermolecular contacts, all under the influence of different co-ligands that can interact with compounds of environmental concern, such as heavy metals, gases, toxins, drugs, etc. [11,12]. As a matter of fact, the use of alternative and widely available ligands in the synthesis of complexes makes them powerful electron donors into the electron transport chain during molecular interactions, which has a special interest in green chemistry, as is the case of succinic acid (SUAC) and its derivative forms—a dicarboxylic organic acid with strong chelating capacity, functioning as a bidentate coordination ligand when under pH change or when interacting with other different metals [13,14].
Upon consideration of their chemical abilities, this study hypothesized that PHEN and SUAC coordinated to iron (Fe) ions could be a powerful multifunctional structure for intermolecular electrostatic interactions, applicable in several green chemistry processes, such as catalysis, photocatalysis, bioengineering, and adsorption [15,16,17]. Besides the evidence on the properties of PHEN and SUAC reported previously, Fe ions in such oxidation state can also exhibit unique features, such as [18,19]: (I) variable spin states, which can be potentialized by both C=O and C–N bonds in coordination complexes (present in both PHEN and SUAC) that can provide distinct magnetic and optical properties; (II) the ability for redox activity, allowing it to easily transit from Fe(III) to Fe(II) or Fe(I) and become a suitable option for catalysis by involving electron transfer processes or oxygenation reactions; (III) ligand substitution reactions, which are often observed for such ions by enabling a ligand to be exchanged by another and, therefore, highly advantageous when designing crystalline complexes for specific applications; and (IV) Lewis acid character, meaning that such oxidation state confers to the Fe the ability to accept electron pairs from dentate donor ligands (characteristics of both PHEN and SUAC), allowing the easy and often fast formation of direct coordination bonds or atom-bridged bonds, such mono- or higher-order µ bridges, able to form dinuclear complexes.
Specifically, dinuclear complexes with 1st-row transition metals, especially Fe and its different oxidation states, tend to exhibit several distinctive characteristics [12,20,21]: (I) As mentioned, the ability for mono-, bis-, tris, or higher-order µ bridges in metal–metal interactions, typically by oxygen atoms in oxide form or hydroxyl groups, which play a crucial role in facilitating electron transfer between the metal centers; (II) antiferromagnetic coupling ability, because the magnetic moments of the two centered ions tend to align in opposite directions (a characteristic of systems where µ bridging allows for efficient overlapping of the d-orbital involved in bonding dynamics). This creates a super-exchange interaction mediated by the atom bridging the two centers once the unpaired electrons of the metal ions are reached, resulting in a lower overall magnetic moment for the complex; and (III) improved redox reactivity, given that this property can be finely tuned by both the nature of the ligands forming the complex and the influence of µ-bridge order between the metal ion centers (i.e., functioning as a “channel” in this second case), and that altogether makes it opportunely more versatile for green chemistry applications, especially those involving electron transfer reactions, such as biological or catalytic activities.
In line with the growing demand for cost-effective materials in chemical and engineering processes, this study aims to develop a novel Fe-based complex with potential applications in coordination chemistry, catalysis, and material science. The work provides a comprehensive investigation of the complex’s synthesis, alongside detailed characterizations of its structural, spectroscopic, and thermal properties. Additionally, a theoretical study explores key intermolecular interactions and coordination mechanisms, offering valuable insights into the design of advanced materials and optimization of chemical processes. These findings contribute to the broader field of sustainable engineering and process development.

2. Materials and Methods

2.1. Materials and General Methods

Chemicals used for the synthesis of crystals are of analytical grade, and no additional purification processes were employed. 1,10-phenanthroline (PHEN) (C12H8N2∙H2O, CAS: 66-71-7, MW: 198.22 g·mol−1, purity: 99.0%) and methanol (CH3OH, CAS: 67-56-1, MW: 32.04 g·mol−1, purity: 99.8%) were obtained from Synth (São Paulo, Brazil), succinic acid (SUAC) (C4H6O4, CAS: 110-15-6, MW: 118.09 g·mol−1, purity: ≥ 99.0%) and ferrous chloride tetrahydrate (FeCl2∙4H2O, CAS: 13478-10-9, MW: 198.81 g·mol−1, purity: ≥98.0%) were purchased from Sigma-Aldrich (São Paulo, Brazil). Ferric chloride hexahydrate (FeCl3∙6H2O, CAS: 10025-77-1, MW: 270.30 g·mol−1, purity: ≥98.0%) was purchased from Cinética (São Paulo, Brazil). The synthesis reaction occurred through the slow evaporation method of solvents H2O and CH3OH in a solution that gradually added precursor chemicals (PHEN, SUAC, and iron (II,III) oxide). The synthesis of iron(II,III) oxide, hereafter referred to as compound (1), was based on an adaptation from the method proposed by Roth et al. [22] using ferrous chloride tetrahydrate and ferric chloride hexahydrate as precursors. Briefly, 0.5 g of both FeCl3∙6H2O and FeCl2∙4H2O were added into a solution of 60 mL of deionized water and initially submitted to magnetic stirring at 150 RPM at room temperature (25 ± 2 °C); subsequently, 20 mL of methanol and 20 mL of a 0.05 g solution of NaOH (pH ≈ 8) were added. Once the solution was homogeneous, the temperature and stirring speed rose to 90 °C and 1000 rpm, respectively, for 40 min. The reaction was manually finished once the color changed from a bright yellow to a ferrous-like red and was then allowed to cool down to room temperature (25 ± 2 °C). Once cooled, the Fe3O4 precipitate was separated through a 0.22-µM paper filter and then washed with deionized water until the washing solution was colorless; subsequently, it was left to air dry and then stored for further usage in the synthesis of crystals.

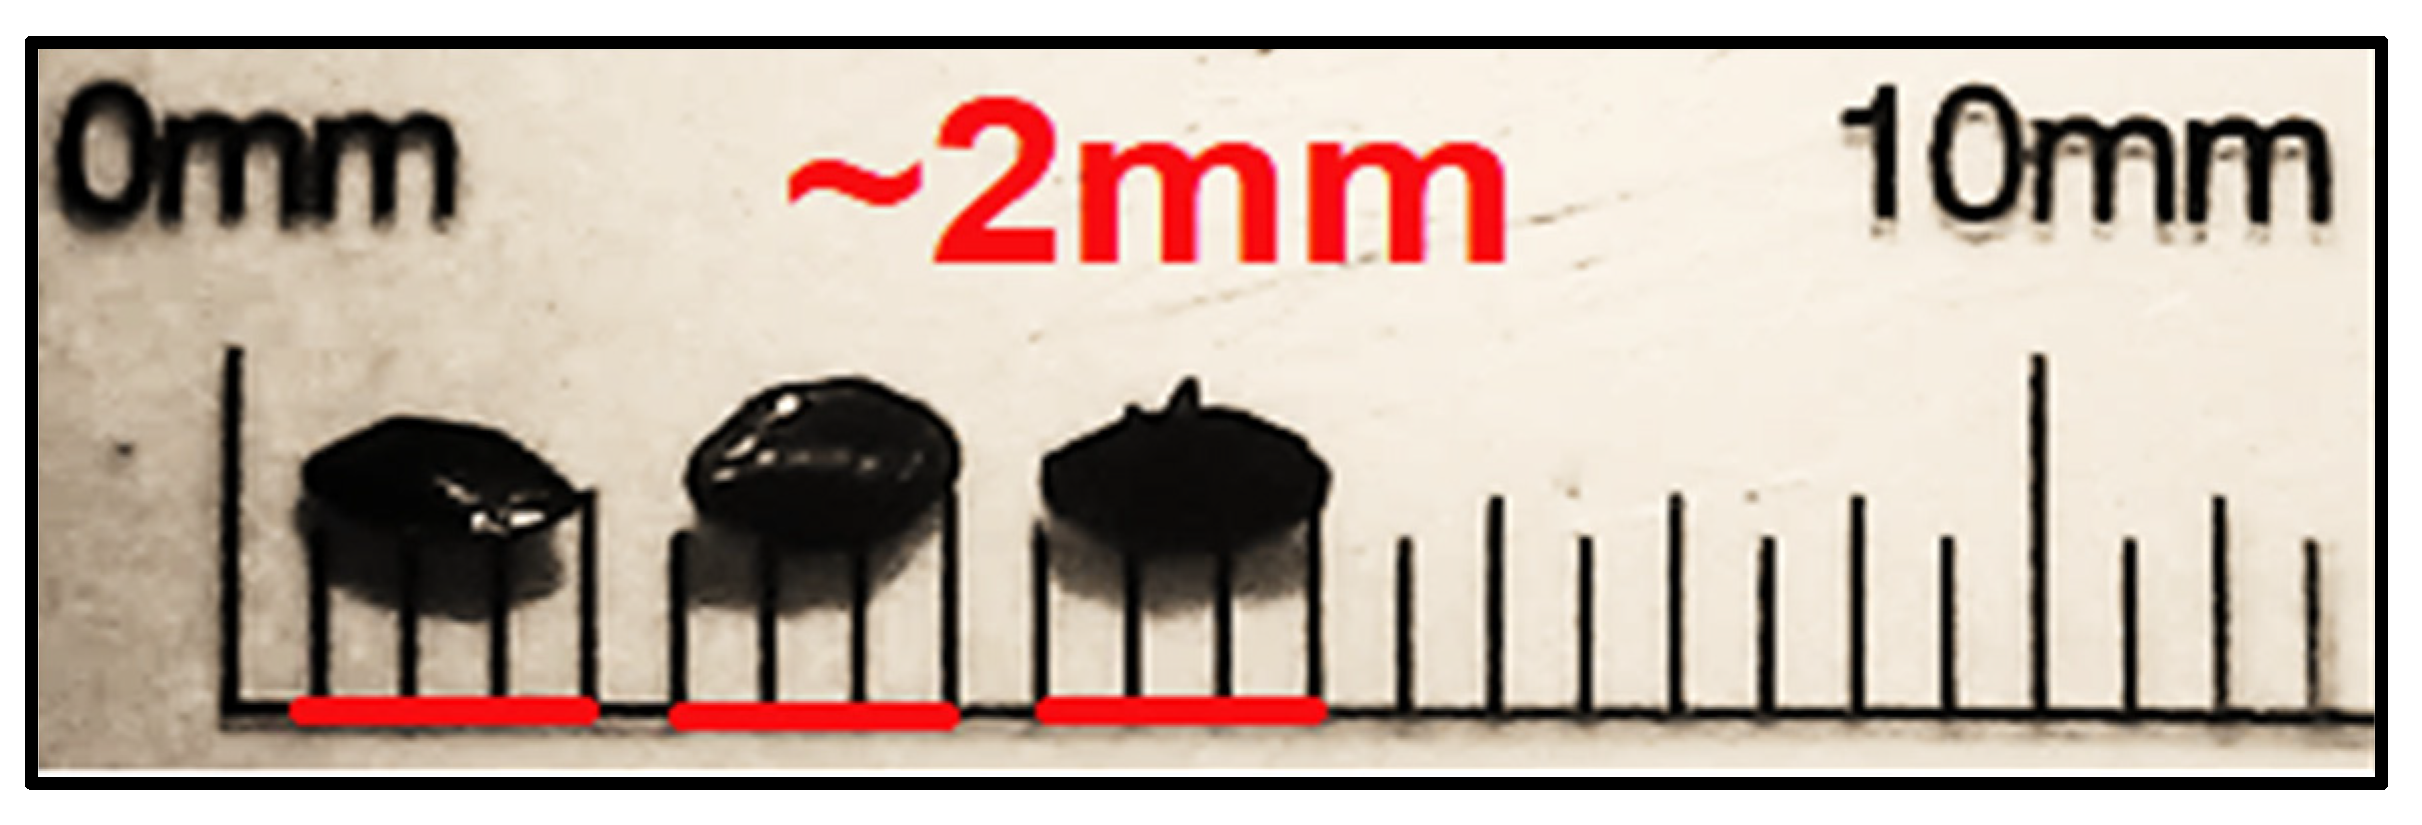
2.2. Preparation of Crystals

A schematic illustration of the synthesis is shown in Figure 1. The general procedure for the synthesis of intermediate compound (2) began with PHEN (≈3 mmol, 0.5 g), which was added to a 40 mL methanol solution-containing compound (1) (≈1 mmol, 0.25 g). The mixture was magnetically stirred at 600 RPM and 40 °C for 1 h. Upon homogenization, the solution turned into a translucid brownish-orange color. The synthesis of the target complex final compound (3) (C56H58Fe2N8O18∙9(H2O)) was then initiated by adding SUAC (≈1 mmol, 0.25 g) dissolved in 20 mL of deionized water to the solution of compound (2). The reaction was allowed to proceed for another 2 h under the same conditions (600 RPM, 40 °C) until an opaque dark red color was achieved. After completion, the solution was allowed to cool to room temperature (25 ± 2 °C) and filtered through a 0.22-µM paper filter into a 250 mL beaker. The beaker was covered with a perforated PVC film to enable slow evaporation at room temperature under minimal light exposure. Dark reddish crystals (average length of 2 mm) formed after 12 days, yielding approximately 0.73 g (73% overall yield), as depicted in Figure 2.

2.3. Characterization Techniques and Theoretical Methods

Single-crystal X-ray diffraction data collection from suitable crystal (ϕ scans and ω scans with κ and θ offsets) were done at 302 K using a Bruker D8 Venture κ-geometry diffractometer (Bruker, Billerica, MA, USA) (equipped with a Photon II CPAD detector and an IµS 3.0 Incoatec MoKα microfocus source (λ = 0.71073 Å). Data collection for unit cell determination was conducted with APEX4 software version 2021.4-0 (Bruker, Madison, WI, USA) [23] and the Bruker SAINT package version 8.36 (Bruker, Madison, WI, USA) [24], performing data reduction and global cell refinement while using SADABS software version 2.05 (Bruker, Billerica, MA, USA) to handle multi-scan absorption corrections. Solving of the crystal structure was conducted with ShelXT [25] and ShelXL [26] using intrinsic phasing and direct methods, basing its refinement on a full-matrix least-square method for obtaining F2, with auxiliary aid of the Olex2 interface program [27]. Anisotropic aspects were applied to refine non-hydrogen atoms by treating them with the riding model, i.e., placement of H atoms in accordance with required geometrical criteria. MERCURY [28] and ORTEP [29] programs were used to build up the CIF (crystallographic information file) and the artwork representations meant for publication. The deposit of CIF in the Cambridge Structural Database (CSD) of the Cambridge Crystallographic Data Centre (CCDC) received the number 2300427.
Fourier-transform infrared (FT-IR) spectroscopy was conducted with a Bruker Vertex 70v FT-IR spectrometer (spectral range from 4000 to 400 cm−1 with spectral resolution of 4 cm−1) using the KBr pellet method (99% KBr, 1% sample, pressure of 8 tons for 30 s), InGaAs and DLaTGS excitation, 8 accumulations and an average of 32 scans. The Raman spectrum was recorded in the 40–3200 cm−1 range using a LabRAM HR Evolution Horiba spectrometer with a charge-coupled device (CCD) detection system and thermoelectricity cooling system based on Peltier-cooling and a red solid-state laser (λ = 633 nm) with power near 2.6 mW as the excitation source. Additionally, the spectrum was obtained with a counting time of 60 s for each, 6 accumulations, and a spectral resolution of 4 cm−1. Ultraviolet-Visible (UV-Vis) spectrum was obtained using a ThermoScientific Evolution 220 UV-Vis spectrophotometer (ThermoScientific, Seoul, Korea) at room temperature (25 ± 2 °C) and methanol as the solution media, in the wavelength range from 190 to 600 nm (previously checked for electronic activities up to 1100 nm, which showed no significant ones), adopting a spectral resolution of 1 nm, rate of 10 nm∙s−1, concentration of 1 mg/mL, and optical path of 1 cm. The overall nature of the electronic transitions in the UV-Vis absorbance data was inferred from the highest optical bandgap observed from plotting of Tauc equation (Equation (1)) with experimental data, testing usual γ values: γ = 2 for directly allowed transitions, γ = 1/2 for indirect allowed transitions, γ = 2/3 for directly forbidden transitions, and γ = 1/3 for indirect forbidden transitions [30], all with their respective plots.
α h ν γ = A ( h ν E g )
The absorption coefficient (α) in the Tauc equation was computed from the Beer–Lambert law (Equation (2)), which establishes the relationship between the incident light (I0) and the transmitted light (I) through the optical path in UV-Vis measurements.
I = I 0   e α x
Calculations for the incident energy (E) in feasible units (eV) were done based on the relationship that exists between the product of the Planck constant (h) and the photon frequency (ν), which can be rearranged as the ratio between the Webber speed of light constant and the wavelength from the UV-Vis measurements [31], as in Equation (3).
E = h ν = h c λ
From these relationships, an absorption coefficient of α = 2.302 A cm−1 (with A as the absorbance data) was found by adopting an optical path of 1 cm, which is the width of the quartz tube where the light passed through absorbance measurements, and an eV-based incident energy criteria of E = 1240/λ (eV). All the denotations and complete calculations on each of these specific aspects and formulae can be found in the Supplementary Materials (see ESI, Frameworks S1 and S2).
Thermogravimetry (TG) and differential thermal analysis (DTA) curves were obtained using a DTG-60 Shimadzu thermogravimetric analyzer (Shimadzu Corporation, Kyoto, Japan). The measurements were carried out in an α-alumina crucible under a nitrogen (N2) atmosphere with a flow rate of 100 mL·min−1. The temperature range was set from 25 to 900 °C, with a heating rate of 10 °C/min. °C·min−1. The curves were quantitatively analyzed in terms of weight loss and energy release or absorption using the TA60 software version 2.21 (Shimadzu Corporation, Kyoto, Japan). The structure of the complex available in the CIF was submitted to intermolecular contact studies by means of Hirshfeld surfaces analysis using the Crystal Explorer software version 17.5 (University of Western Australia, Perth, Australia) [32]. There were obtained plots for dnorm, shape-index, and curvedness surfaces that depicted bonding in crystal contributing to the crystal packing, as well as the 2D fingerprint plots for each bond composition regarding its % of contribution.

3. Results and Discussion

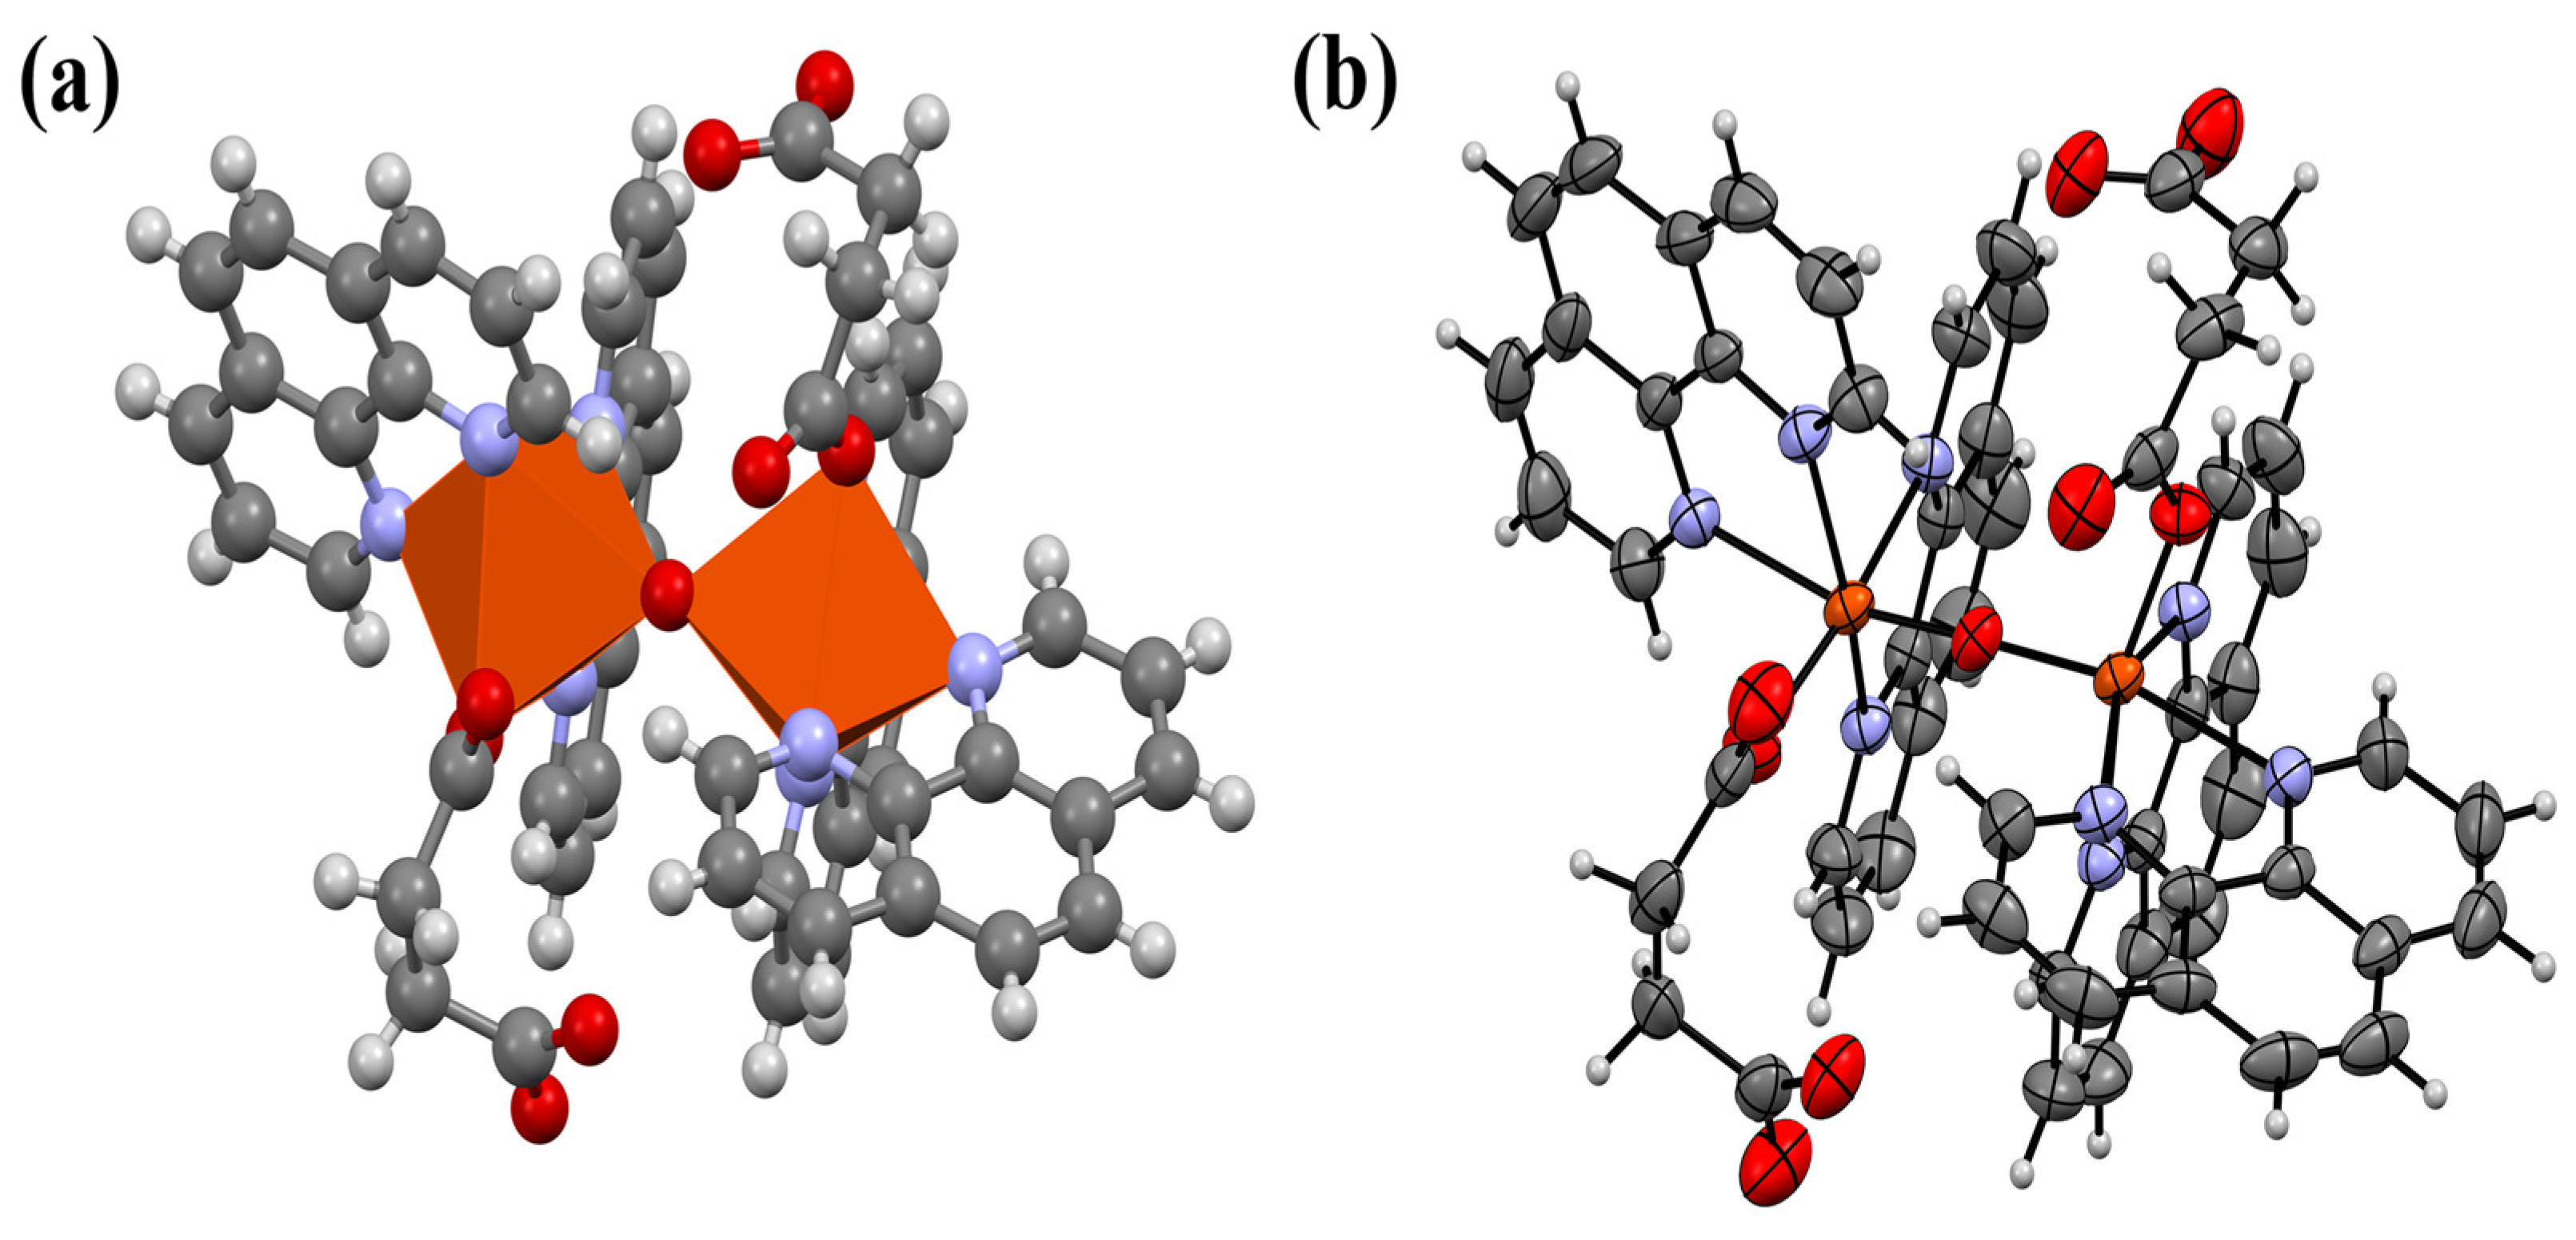
3.1. Structural Analysis

A sample of the crystal with dimensions 0.36 × 0.33 × 0.24 mm3 was chosen for single crystal XRD analysis at 302 K. Diffraction data indicated that the complex crystallizes in the monoclinic system with the C2/c-space group. Crystallographic data and further details on the structure refinement are in Table 1.
It was possible to identify that the unit cell of the crystal has the following lattice parameters: a = 12.7772(10) Å, b = 23.0786(15) Å, c = 18.9982(13) Å, β = 93.047°, with V = 5594.27 Å3 and four molecules per unit cell (Z = 4). The symmetrical form of the molecule for unit cell setting has an empirical formula C56H58Fe2N8O18.9(H2O) and molecular weight of 1242.80 g·mol−1, as well as a calculated density (ρcalc) of 1.48 g.cm−3. The XRD diffraction pattern in Figure 3 exhibits Bragg’s positions associated with the following principal crystalline planes: (1 1 0) at 2θ = 7.94°, (1 1 −1) at 8.92°, (1 1 −2) at 11.94°, (2 0 −2) at 16.31°, (2 0 2) at 17.14°, (2 2 −3) at 20.69°, (2 4 1) at 21.53°, (2 4 −2) at 22.44°, (2 0 4) at 23.94°, (2 2 4) at 25.20°, (3 1 4) at 29.18°, (3 5 −2) at 29.70°, and (2 0 6) at 32.24°. The determination R-factor was found to be near 6.17%, and the goodness-of-fit “G.O.F” is nearly S = 1.08.

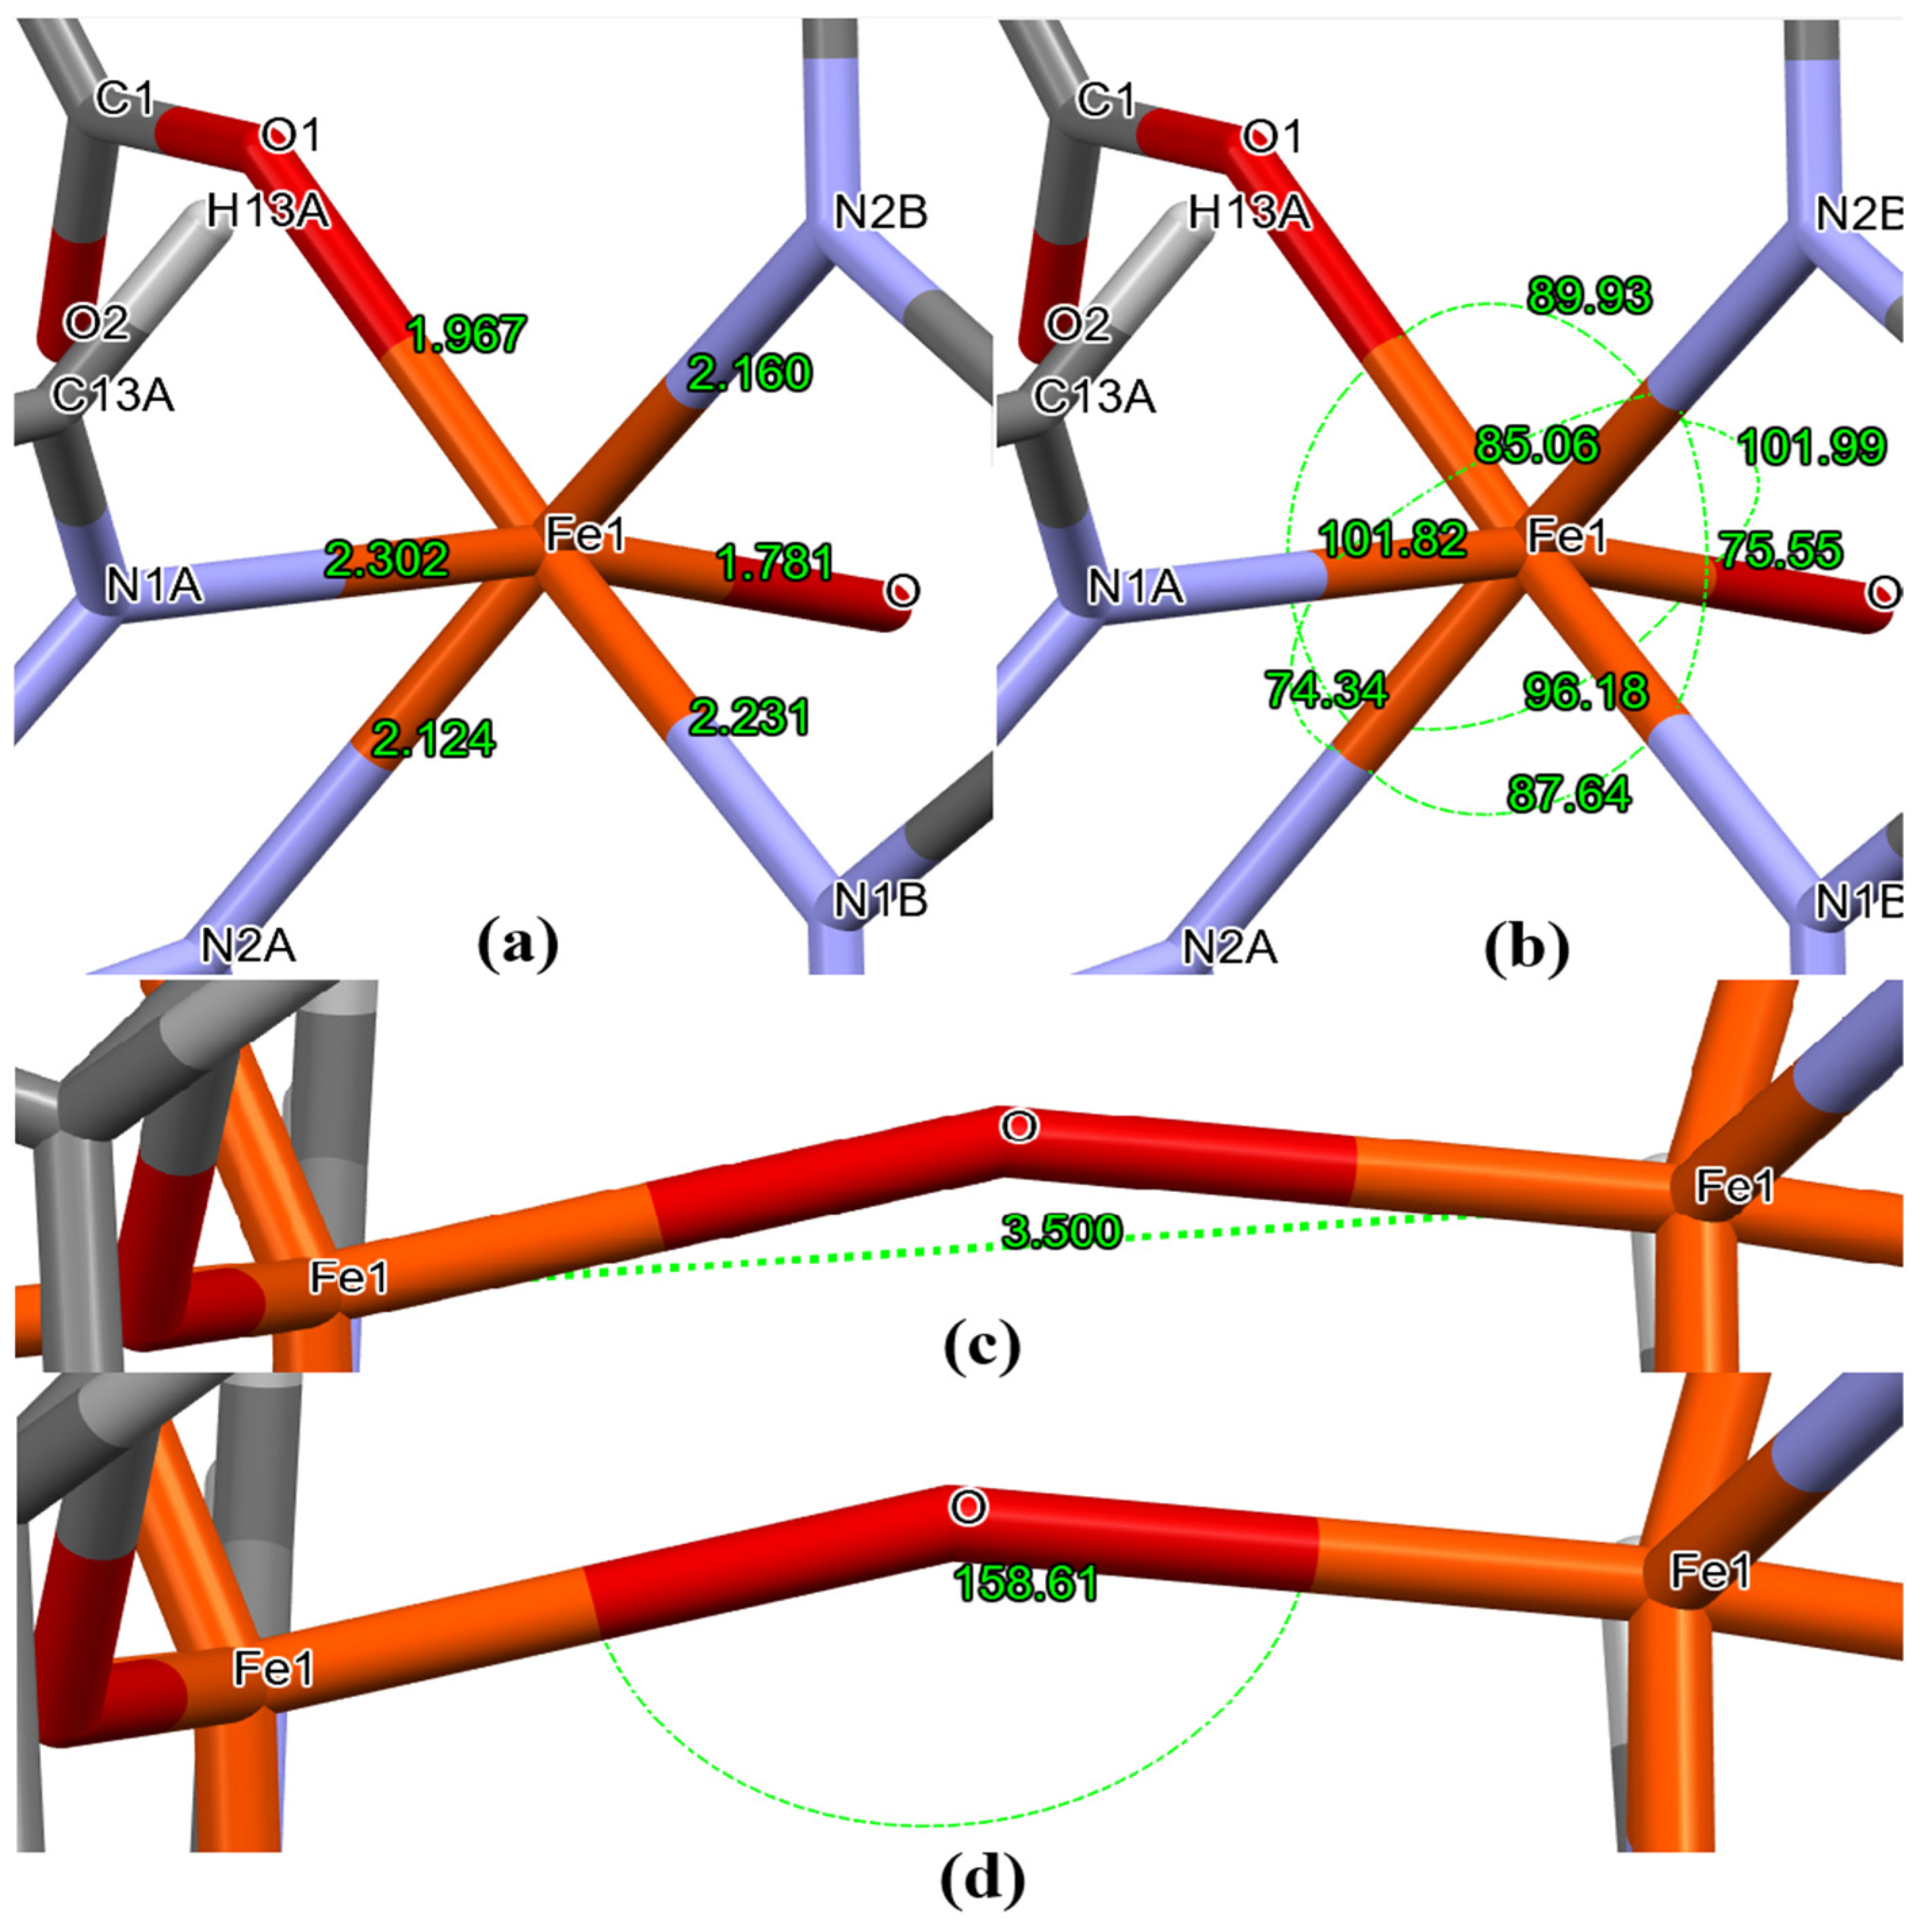
3.2. Insights on Coordination Mechanisms, Crystal Packing and Bonding Aspects

The molecule structure and its ORTEP form drawn at the 50% probability level are pictured in Figure 4. It shows a dinuclear heteroleptic complex with two Fe(III) atoms, i.e., with a d5 configuration, arranging the ligands into geometrical cis isomerism—a characteristic where donor atoms from the ligands occupy scaled pair of vertices simultaneously, such as (1,2), (1,3), (1,4), (1,5), (2,3), (3,4), (4,5), (5,2), (6,2), (6,3), (6,4), or (6,5), and showed a dipole moment, IR activity, and a chelating type of complexation [33].
Specifically, at each Fe center, there are (A) two PHEN molecules coordinated via N-bonds in positions 1 (N) and 10 (N’) due to their lone-pairs of electrons, arranged in adjacent directions and in planar form; (B) one succinate molecule bonded equatorially via one of its ionized carboxyl groups (-COO-), as an effect of the basic reaction medium; and (C) an O atom that bridges one central Fe ion to the other Oh-symmetrical side of the molecule forming a Fe-O-Fe bond, meaning the cleavage of a O2 specie into a µ-oxo bridge. The main H-based intermolecular interactions in the crystal structure were C–H⋯O, C–O⋯H, C–H⋯π, and π⋯π stacking (Table 2), all involved in its crystal packing (see ESI, Fig. S1). The statistics of H bonding from experimental data indicate that most of them occur through π-π stackings to the H atoms of the PHEN rings oriented up and down alternately. Moreover, for each molecule of the complex, the non-coordinated crystallization water molecules, H atoms arranged in the unit cell, and the unpaired O atom from the ionized carboxyl group in SUAC, were all the main characters in the intermolecular interactions throughout the crystalline lattice that makes the system stable.
Among the main bond lengths and angles to the coordination spheres of the complex, as pictured in Figure 5, those observed from XRD data for the Fe and N atoms are the largest and vary between 2.12 Å and 2.30 Å, similarly to other PHEN Fe-centered complexes [34,35]. The length of the O bonding SUAC molecules to the metal cores is 1.97 Å, the 2nd largest non-N bond in the complex, and is similar to other O-bridge linked co-ligands in iron-PHEN complexes reported in the literature [36]. Minimum and maximum dihedral angles observed vary between 74.34° and 101.99°, respectively. The Fe1–O–Fe2 linkage forming a μ-oxo bond is distinctly non-linear, exhibiting a bond angle of 158.61°, while the Fe-μ-O distance of 1.78 Å is comparable to the other iron(III) complexes [37]. Finally, the Fe–Fe distance is 3.50 Å, which is typical for monobridged Fe-O-Fe cores [38].

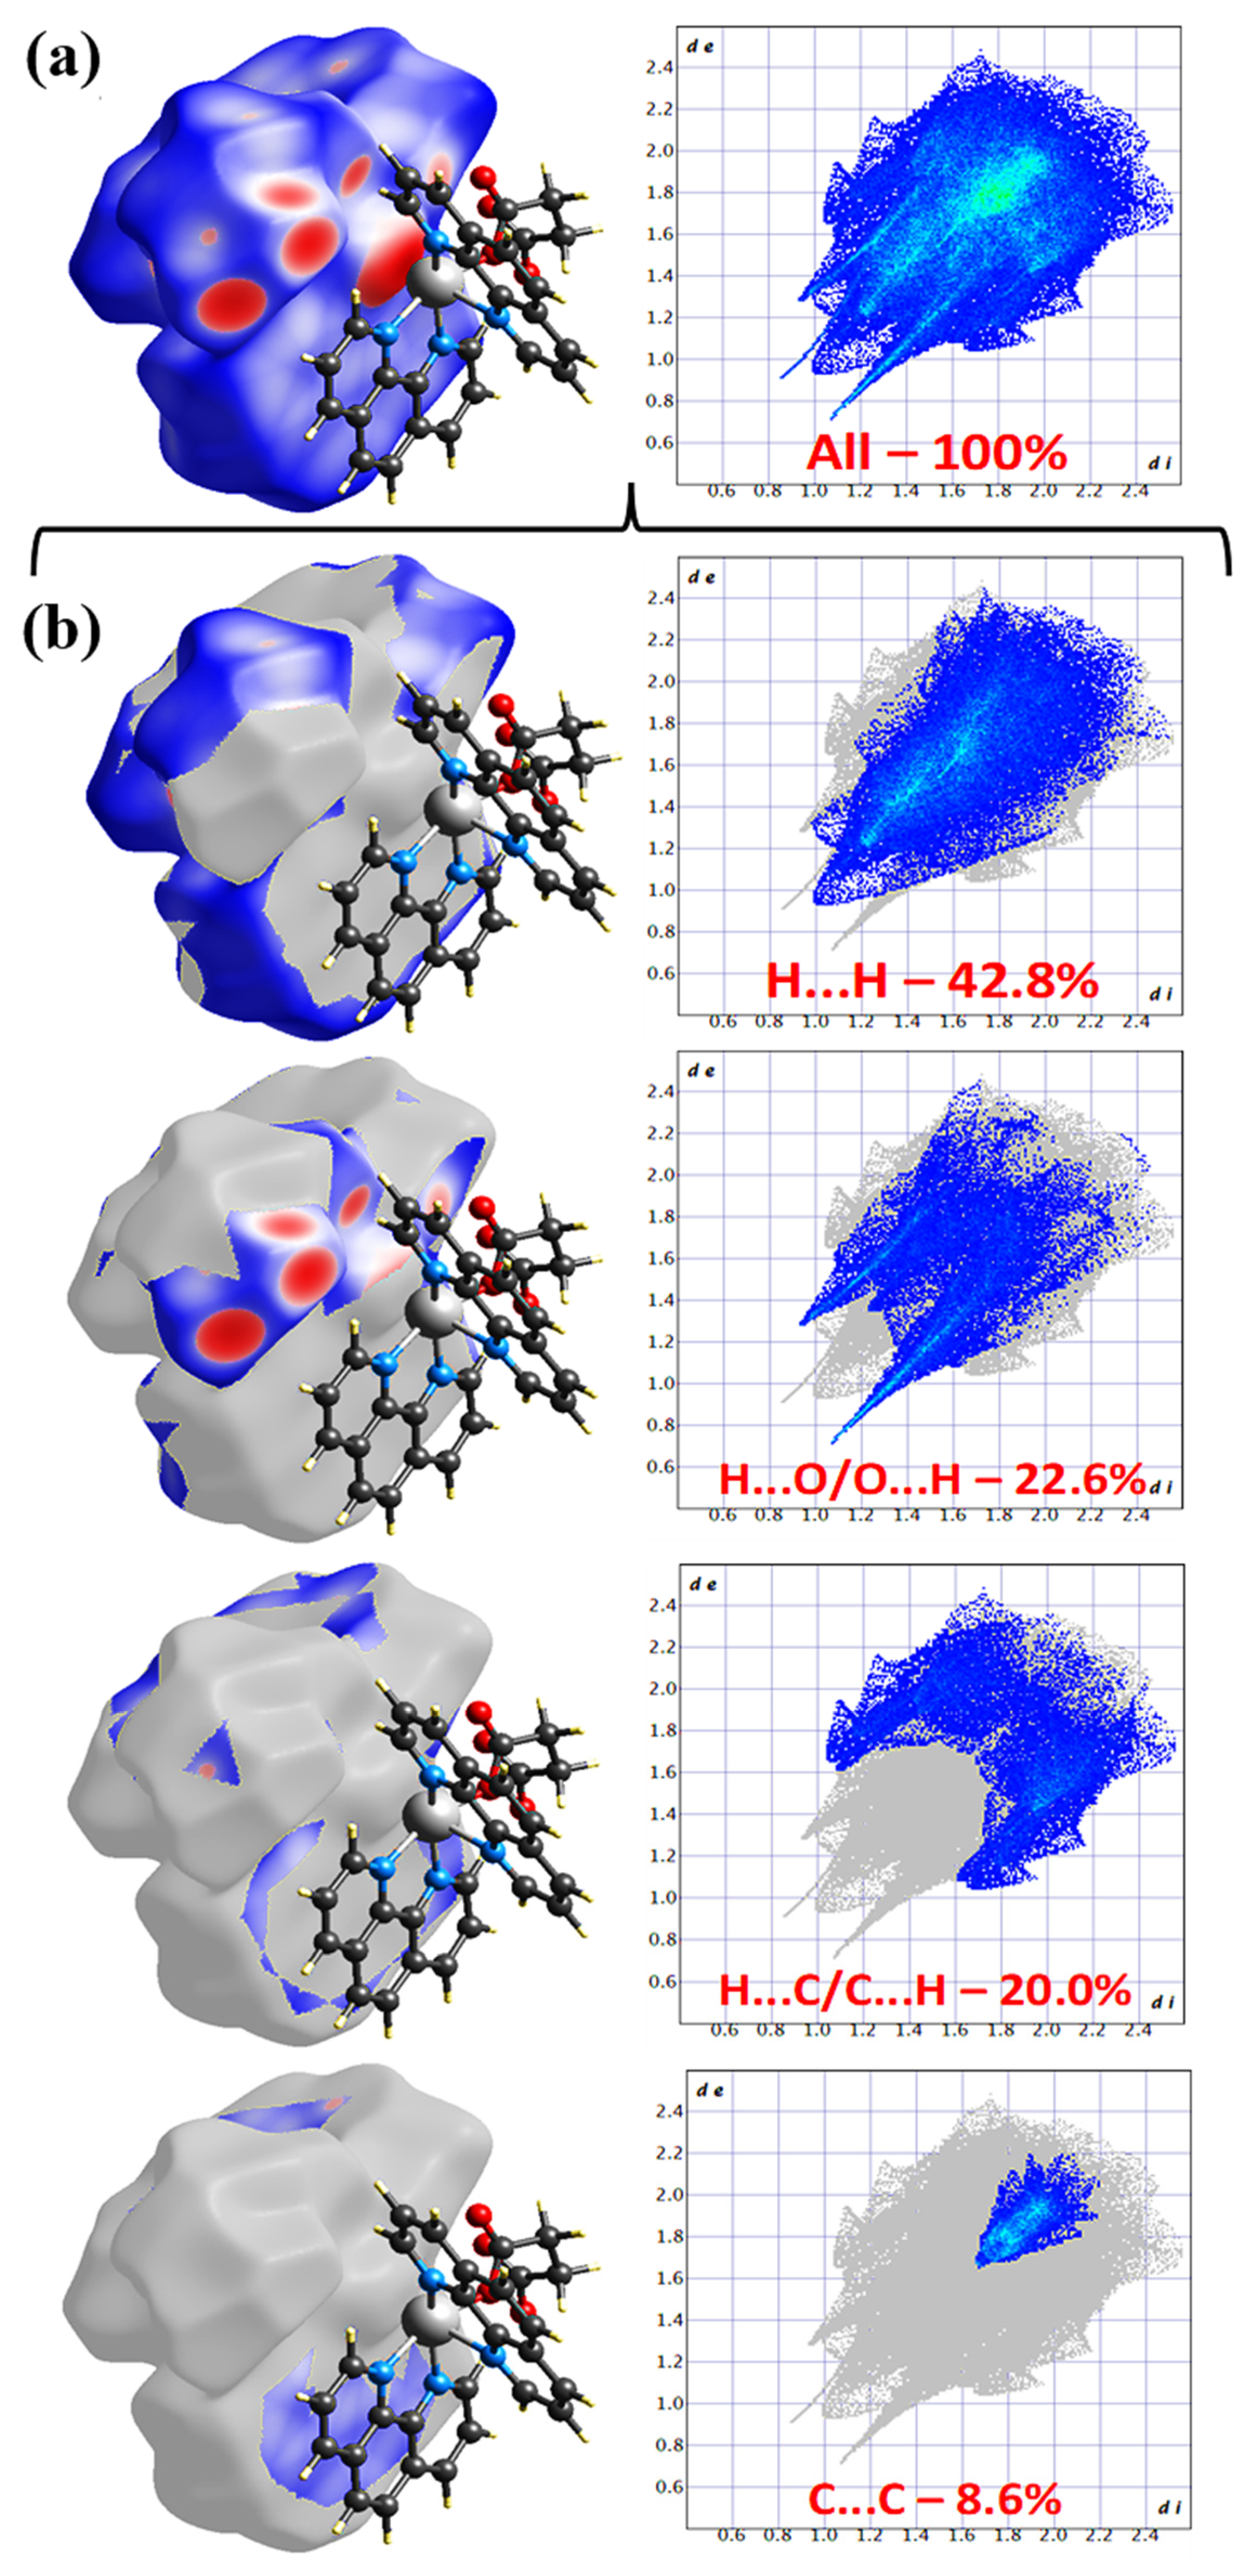
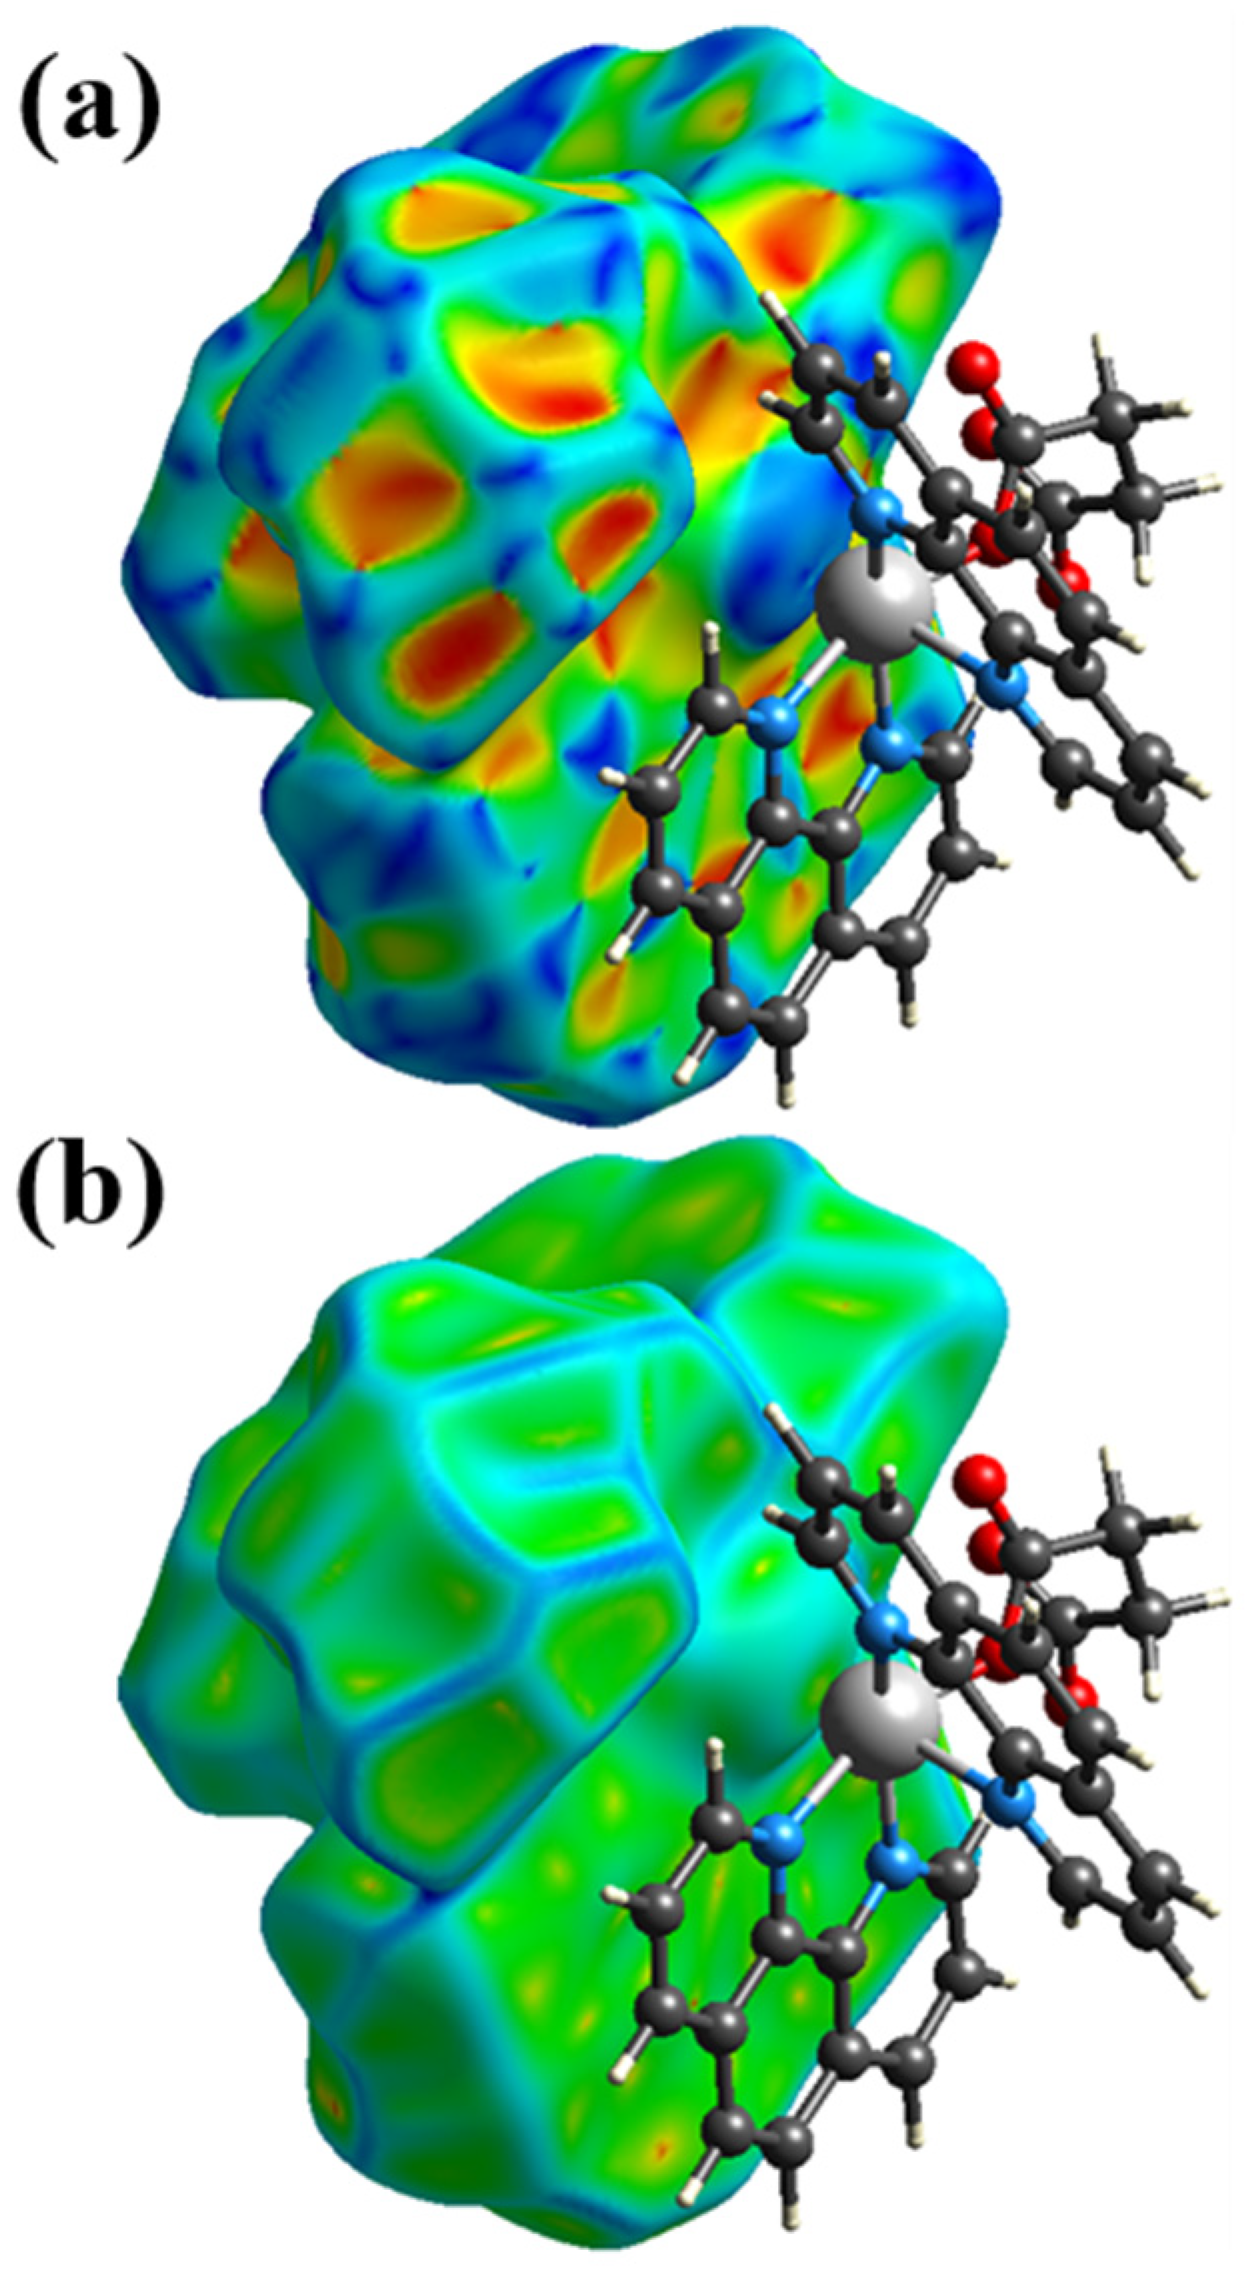
3.3. Hirshfeld Surface Analysis

Hirshfeld surface analysis to quantify intermolecular contact regions on the complex was carried out, plotted in standard high-resolution 3D-normalized contact distances (dnorm) over a fixed scale of colors that varies from −0.973 (red) to 1.424 Å (blue), representing the ratio of the distance between surfaces of two given interacting atoms to the sum of their van der Waals radii. This specific parameter is useful for quantifying the degrees of close contact and any existent overlapping interaction between two or more atoms orbitals [39]. They are also accompanied by respective 2D-fingerprint plots, as pictured in Figure 6.
The largest percentage of interactions is associated with the H⋯H type (42.8%), where a multidirectional amplitude of dark blue points suggests Van der Waals interactions. However, given the nature of the bonding, the graph also shows light blue streaks associated with regions of higher electron density, probably related to π-π stacking interactions between the aromatic rings of PHEN. Intramolecular contacts for this type of interaction were between 1.0 and 2.6 Å, and intermolecular contacts between 0.8 and 2.4 Å. The second-largest percentage is associated with H⋯O/O⋯H interactions (22.6%). Visual aspects of the graph (broad multidirectional distribution of dark blue points, the presence of parallel spikes, and more intense light blue streaks associated with higher electron density) suggest that these interactions result from a mix of strong hydrogen bonds and strong Van der Waals interactions, as well as π-π stacking. These interactions are mostly intramolecular and range between 1.0 and 2.4 Å. The third largest contribution (20.0%) comes from H⋯C/C⋯H interactions, with lengths similarly varying between 1.6 and 2.4 Å, arising from both intermolecular and intramolecular interactions. The symmetrical and distributed aspect of the points indicates a mix of hydrogen bonds and Van der Waals interactions. The fourth-largest contribution is associated with C⋯C interactions (8.6%), and the graph shows these interactions concentrate a high electron density, resulting from π-π stacking. Other contributions in a smaller % were H⋯N/N⋯H (1.5%), Fe⋯O (1.4%), C⋯O/O⋯C (0.9%), N⋯N (0.6%), C⋯N/N⋯C (0.6%), O⋯N/N⋯O (0.5%), and O⋯O (0.4%). The shape and curvature index maps plotted within the ranges from -1 to 1 Å and -4 to 4 Å, respectively, as pictured in Figure 7a,b.
Conceptually, the shape index is a numerical value ranging from −1 to +1 that describes convex and concave forms and local curvatures at a given point on the surface, while a curvature map is useful for understanding further the molecular packing and intermolecular interactions in a crystal or the surface features of a molecular system [40]. As seen in the maps, within the rings of PHEN and along the carbon chain of succinic acid (SUAC), there is a predominance of saddle-shaped curvatures (inward-facing), represented by the color shift from yellow to red. These, in turn, apparently contribute less to the crystalline packing compared to the peripheral regions, as they promote most of the interactions through π stacking and σ bonding to oxygen atoms in the crystalline packing, which are illustrated as outward-curved regions that change from green to blue (highlighted by circled and squared red numbers). The regions where there are oxygen atoms with unpaired electrons, i.e., the ionized carboxyl groups of SUAC, are acting as donors in the formation of these typical outward-curved regions, suggesting susceptibility to electrophilic interactions.

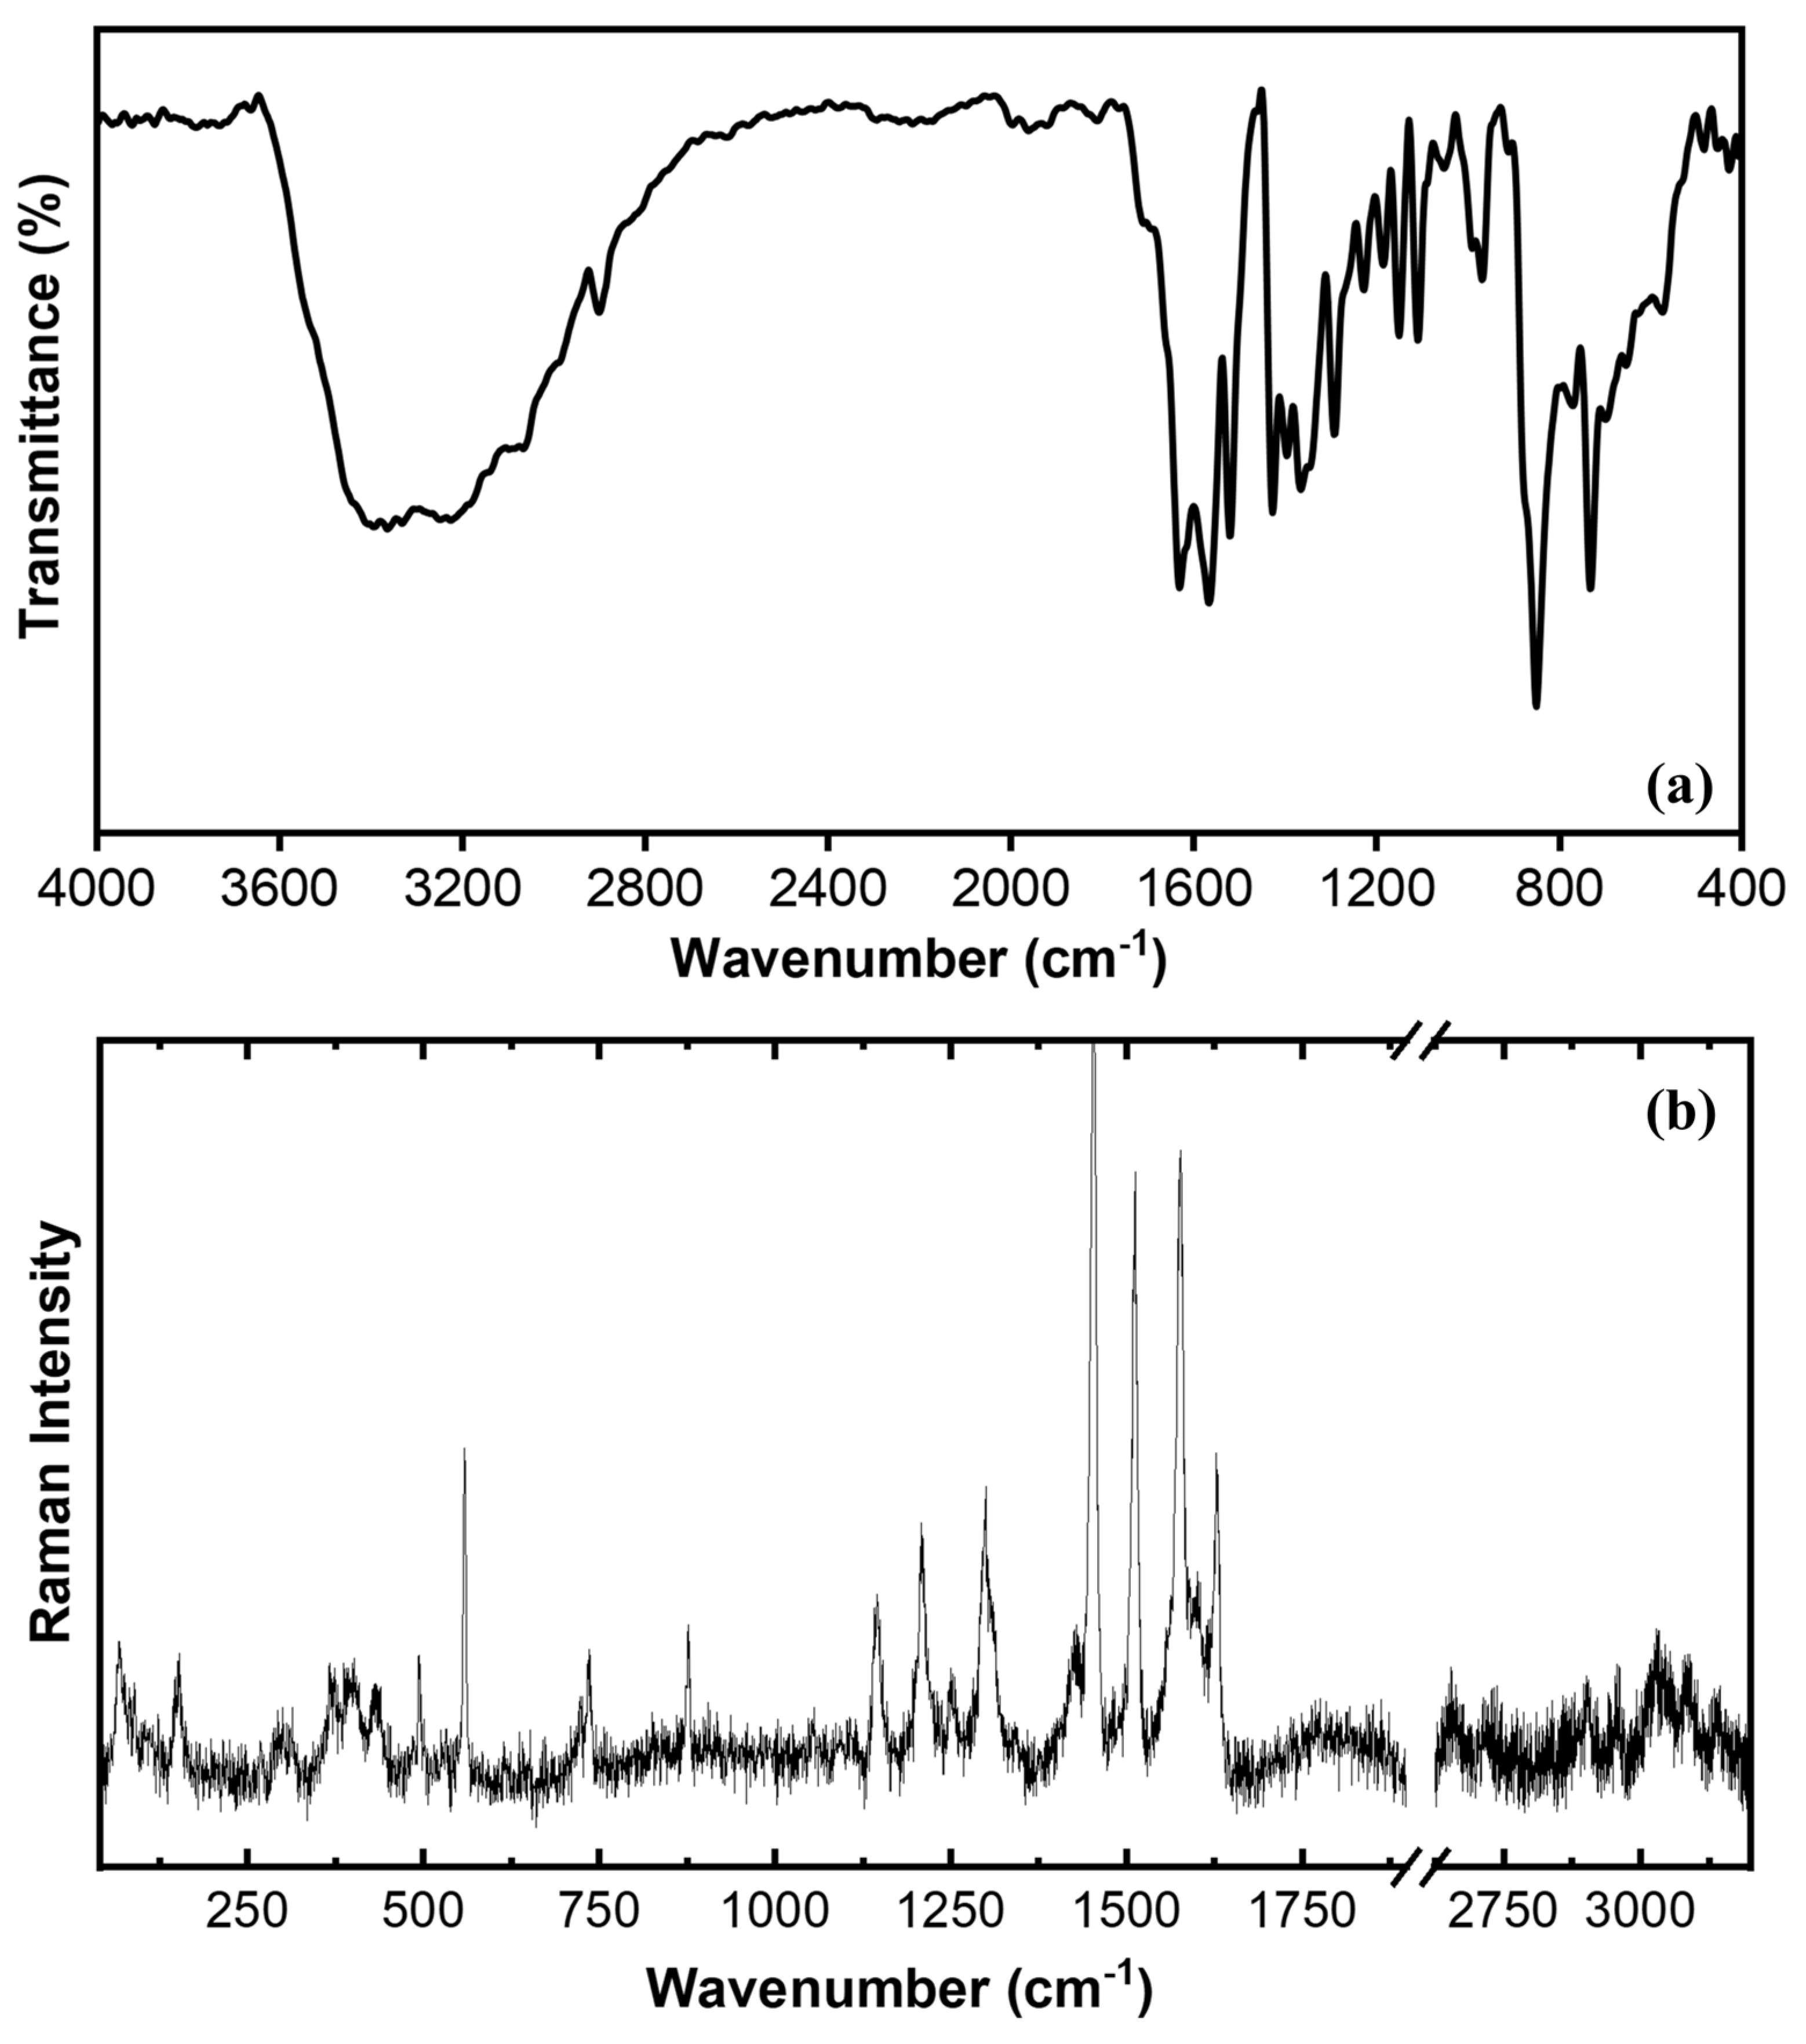
3.4. Vibrational Study

The complex structure comprises 115 atoms and has 4 coordination units forming its crystal unit cell. Hence, the crystal has a total of 460 atoms and 1380 degrees of freedom. As per the single-crystal XRD study, the structure of title complex belongs to the monoclinic system with C/2c-space group. Based on the group theory [41] and Wyckoff’s positions 4e (“x, y, z” symmetry for the O in the Fe-O-Fe bond) and 8f (“1/4, 0, z” symmetry for all the other atoms), it is supposed to have irreducible representation of IR- and Raman-active modes as Γ = 3 A g + 3 B g + 3 A u + 3 B u . Fundamental vibrations related to Raman activity are A g and B g , while IR activity is A u and B u . The 460 atoms in the unit cell occupy 115 sites and has a total representation of Γ t o t a l = 345 A g + 345 B g + 345 A u + 345 B u . By establishing the acoustic modes for such type of space groups as Γ a c o u s t i c = A u + 2 B u , the IR- and Raman-active modes are defined as Γ I R = 344 A u + 343 B u and Γ R a m a n = 345 A g + 345 B g .
As shown in Figure 8a, the low-intensity shoulder-like IR band between 4000 and 3600 cm−1 is probably related to instrumental noise, given that there are no N-H bonds in the complex. Following, the broad IR band between 3600 and 2800 cm−1, specifically around 3300 cm−1, is probably related to O-H vibrations from non-coordinated waters around the complex, as observed from other Fe-related complexes [42,43], which may also be observed C-H and H-C-H stretching vibrations from the SUAC and PHEN.
No significant vibrations were observed between 2700 and 1900 cm−1, even though the small bands around 1800 cm−1 may be related to C=O vibrations. Between 1700 and 1500 cm−1, a sequence of three sharp bands are observed in both IR and Raman spectra and could also relate to vibration of C=O in the carboxylic acids of SUAC co-ligand and vibrations of C=C and H-C=C bonds due to motions from the rings of PHEN [44,45]. From that, it could be inferred that C-H bonds from PHEN rings may be non-coordinatively interacting through π-stacking with water molecules surrounding the complex structure, as also evidenced by the Hirshfeld analysis, and may be directly contributing to the PHEN backbone vibrations [46]. Raman bands in this spectral region also suggest that interactions through σ-type bonds between -COO- and the non-coordinated water molecules may also concomitantly vibrate due to the SUAC backbone [47]. The region between 1500 and 1000 cm−1 of IR spectrum shows strong bands probably related to simultaneous motions of C-O from SUAC co-ligand and C-N from PHEN rings, as well as possible bending vibrations from SUAC, all also seen from 1000 to 1200 cm−1 in the Raman spectrum [48]. The main bands observed within 400–1000 cm−1 region could be attributed to vibrations from the PHEN molecule [48,49], as well as out-of-plane bending C-H vibrations. Vibration modes related to the Fe-coordination atoms may have appeared near the range of 900–980 cm−1 (IR active mode), probably due to the C=C-N vibrations bonding to the Fe center in the coordination environment [50]. Other motions involving the Fe centers in this region could also be related to Fe-O-Fe vibrations around 600 and 900 cm−1 and the O bridge coordinating SUAC [47]. For coordination complexes, the vibration bands below 400–450 cm−1 in both IR and Raman spectra usually relate to motions due to the coordination environment [50], and in the case of the complex, it could be related to vibrations of C=N-Fe-N=C, also to the carbon chains C-C-C-C and C=C-C=C as noticed through the Raman bands between 400 and 500 cm−1. Finally, the low-wavenumber modes noticed below 150 cm−1 in the Raman spectrum are probably associated with lattice vibrations, considered of low energy and often coupled with the vibration of carbon chains throughout the edges of the complex combined with intermolecular hydrogen interactions crucial to the stability of the crystal lattice [51].

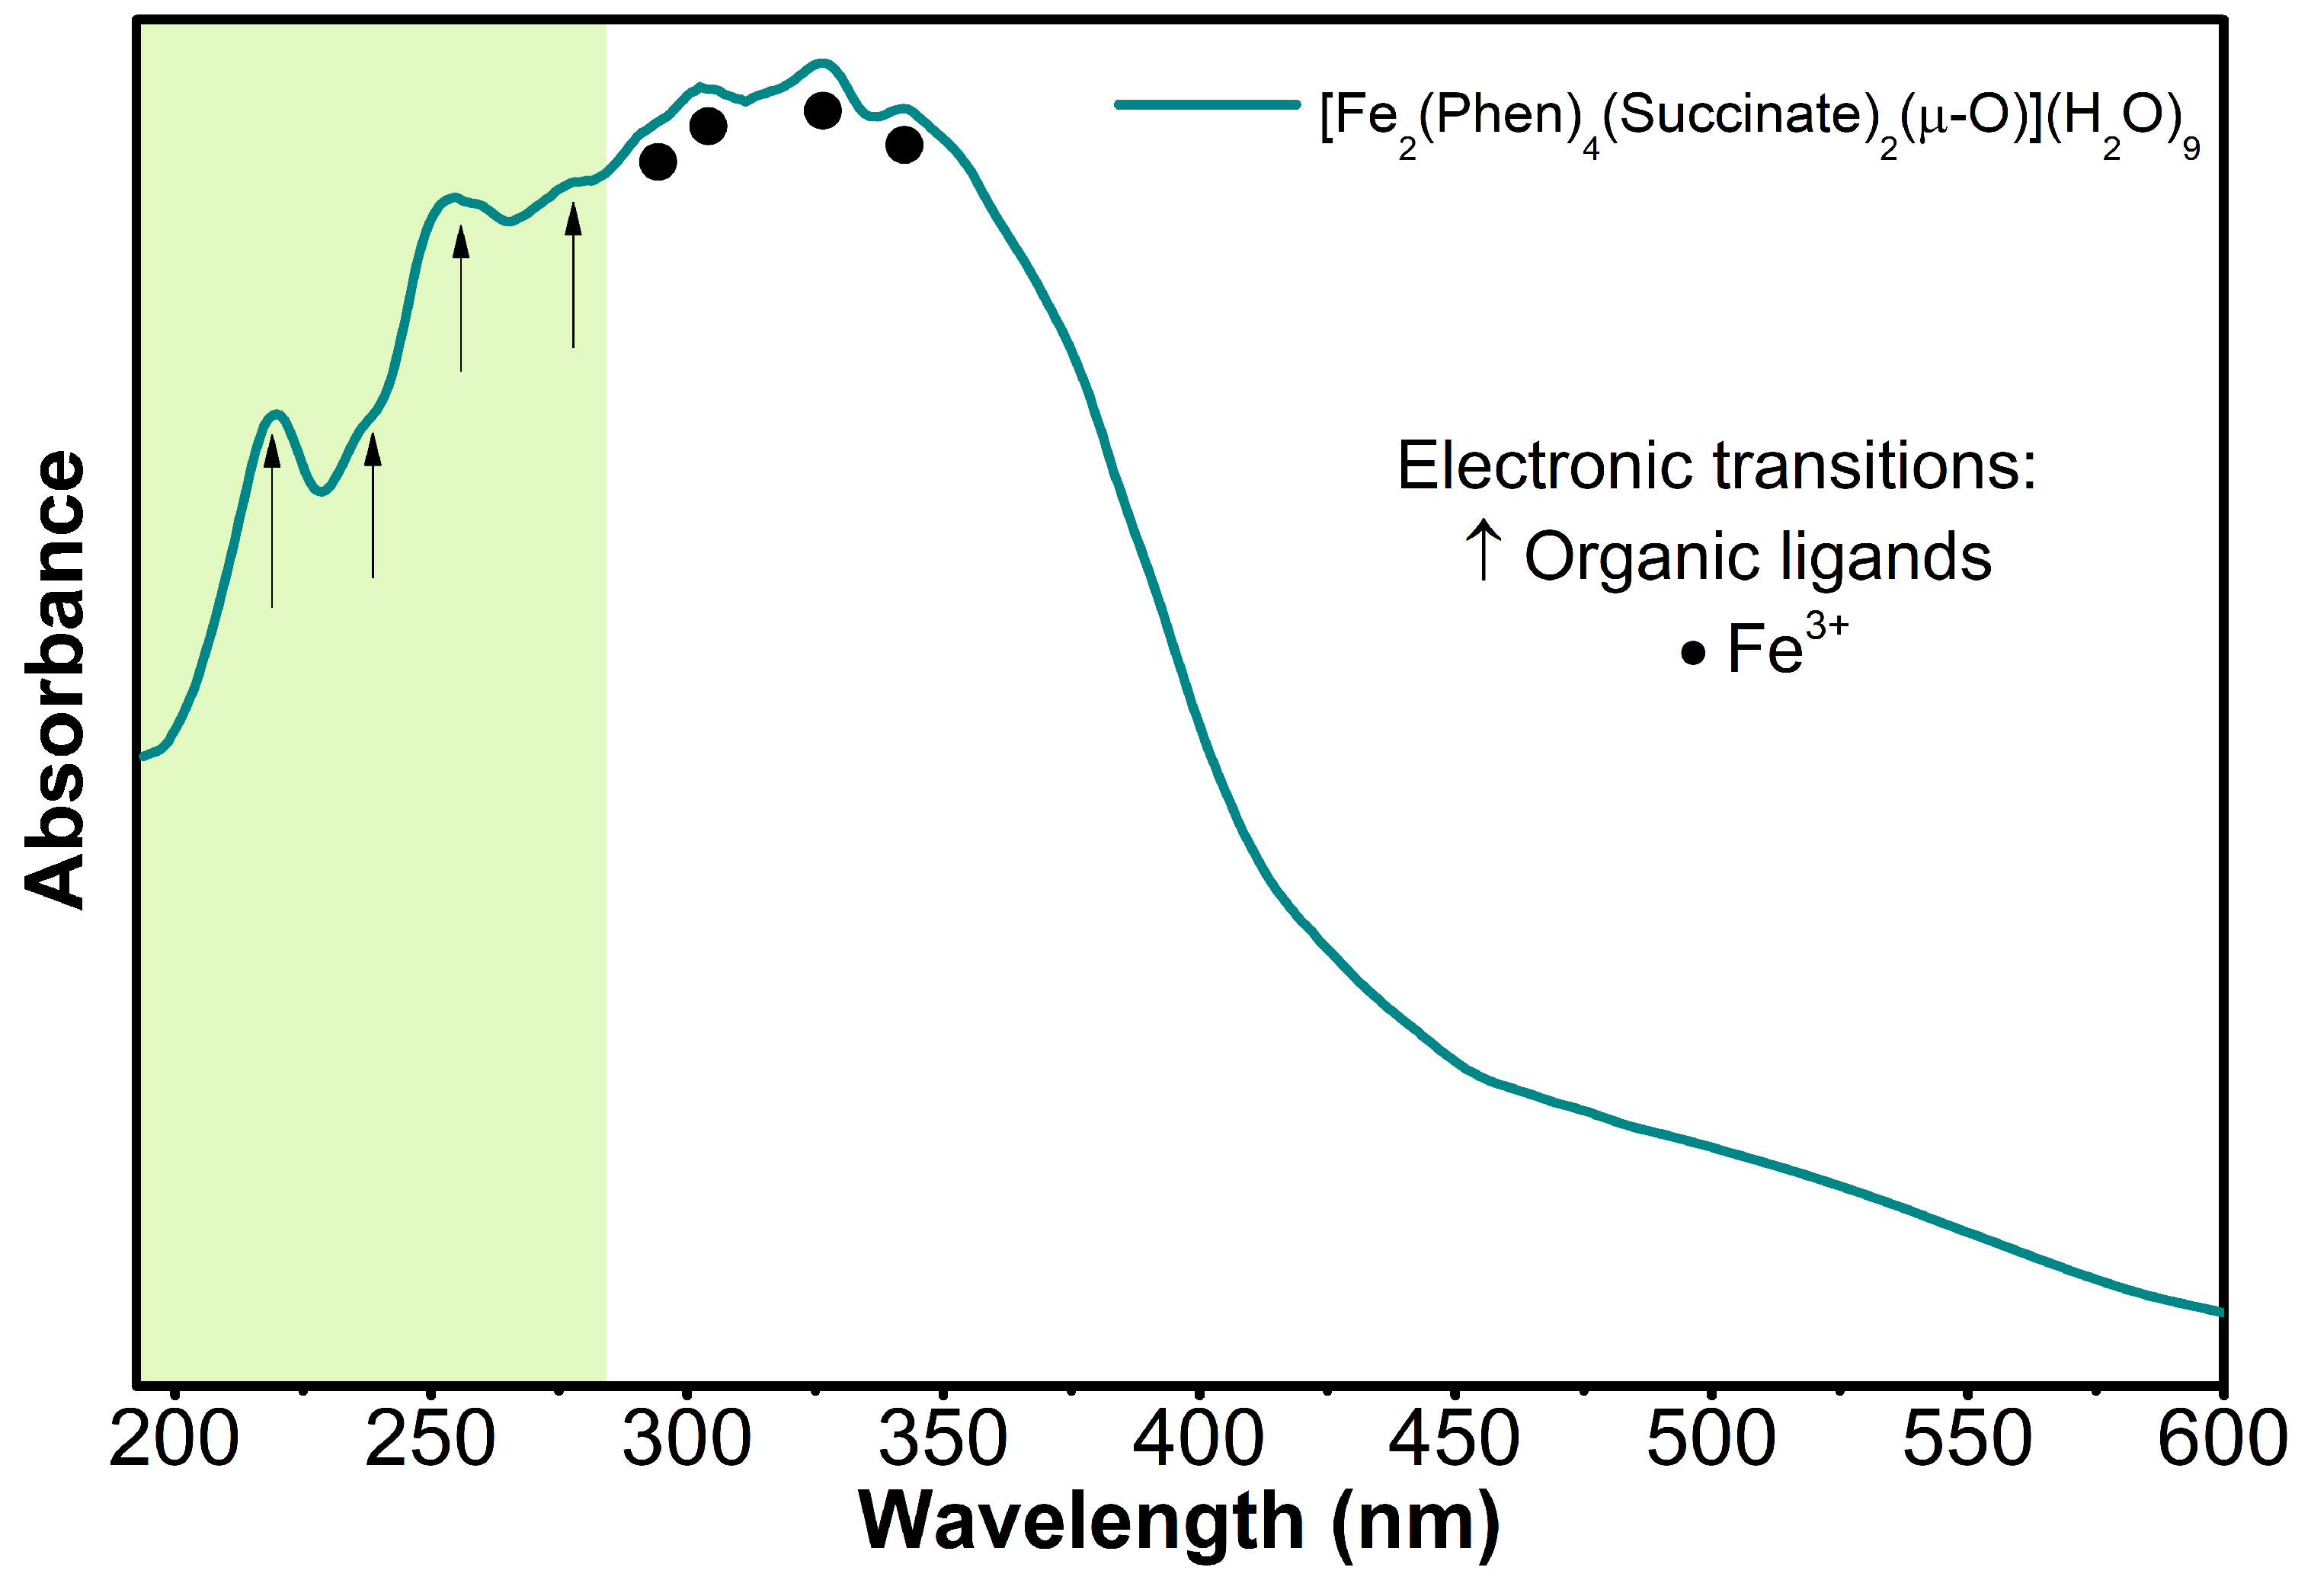
3.5. Electronic Properties

Data collected from experimental UV-Vis analysis are pictured in Figure 9. There were observed significant electronic activities within the range of 190–600 nm, and the maximum wavelength (λmax) value observed from experimental data occurred near 326 nm (extinction coefficient: 1.02 L mol−1 cm−1), which is the usual occurrence for Fe-based complexes [52,53]. Given that the complex is formed by one strong field ligand (PHEN) and two weak field ligands (SUAC and O atom of μ-oxo bridge), it would be expected to have a weak field predominancy around the coordination environment, thus remaining unpaired electrons in d orbitals that result in a greater electron movement and significant changes in electron density around the metals. Applying λmax from the experimental UV-Vis spectrum to the relationship presented in Equation (3) and accounting for the values for h and c seen earlier, the expected crystal field splitting energy (∆o) was estimated in nearly 3.79 × 10⁻¹⁹ J or approximately 2.73 eV.
This value is important for the calculation of crystal field stabilization energy, as shown in Equation (4), which considers relationships involving crystal field theory (CFT), ligand field theory (LFT), and the crystal field splitting and stabilization energies (CFSEs) [54,55], to capture the roles of the ligands in the complexation in the octahedral coordination environment.
F S E = x ( 0.4 O ) + y ( 0.6 O ) + z P
In Equation (4), x means the number of electrons in t2g orbitals, y is the number of electrons in eg orbitals, and z and p, are, respectively, the number of electron pairs and the spin pairing energy penalty against Hund’s rule for a metal atom. In the 3d family, the typical value is 15,000 cm−1 or 179,400 J∙mol−1, if taken the electromagnetic radiation reciprocal wavenumber of the wavelength [52] in cm−1 is 11.96 J∙mol−1. However, since z is equal to 0 (1 electron pair in the spherical field environment minus 1 electron pair in the octahedral environment), the “zP” term can be ruled out. Given that low-spin Fe3+ has 5 electrons in t2g orbitals and 0 electrons in eg orbitals while high-spin Fe3+ has 3 electrons in t2g and 2 electrons in eg, the most stable CFSE therefore indicates its possible spin state. Thus, in this case, the crystal field stabilization energy (estimated in eV—conversion factor: 6.242 × 10¹⁸) for a low-spin state was −4.73 eV, while for a high-spin state, it was 0 eV. This negative CFSE indicates better energy stability in a low-spin configuration for the Fe cores in the complex. It is possibly attributed to the presence of PHEN in majority, which is a predominantly strong-field ligand, seemingly able to create a significant ligand field in the coordination environment of PHENSUACFe [54,55]. Overall, in such types of complexes, the usually observed orbital transitions are related to ligand-to-metal charge transfers, i.e., mostly between Fe cores and the lone pairs of electrons from nitrogen in PHEN, also dd* from the d orbital splitting in the metal ions, σ → σ* and σ* → σ from the C-C and C-H in the benzene rings of PHEN, and π → π* and π* → π from the intraligand charge transfer observed from among the two benzene rings and from the central pyridine ring in the region of the complex, where PHEN molecules are vertically parallel to each other, as well as from the Fe-O-Fe bond [56]. In terms of optical bandgap estimations from UV-Vis data, the application of Tauc and Wood’s equation, as well as the plots depicted in Figure S2 from supplementary material, suggested a maximum optical bandgap value of 2.66 eV that is associated with direct allowed transitions (γ = 2). Other usual values for the electronic transition nature (γ), as presented earlier, reveal optical bandgaps of 1.79 (γ = 1/2), 1.49 (γ = 1/3), and 2.14 eV (γ = 2/3).

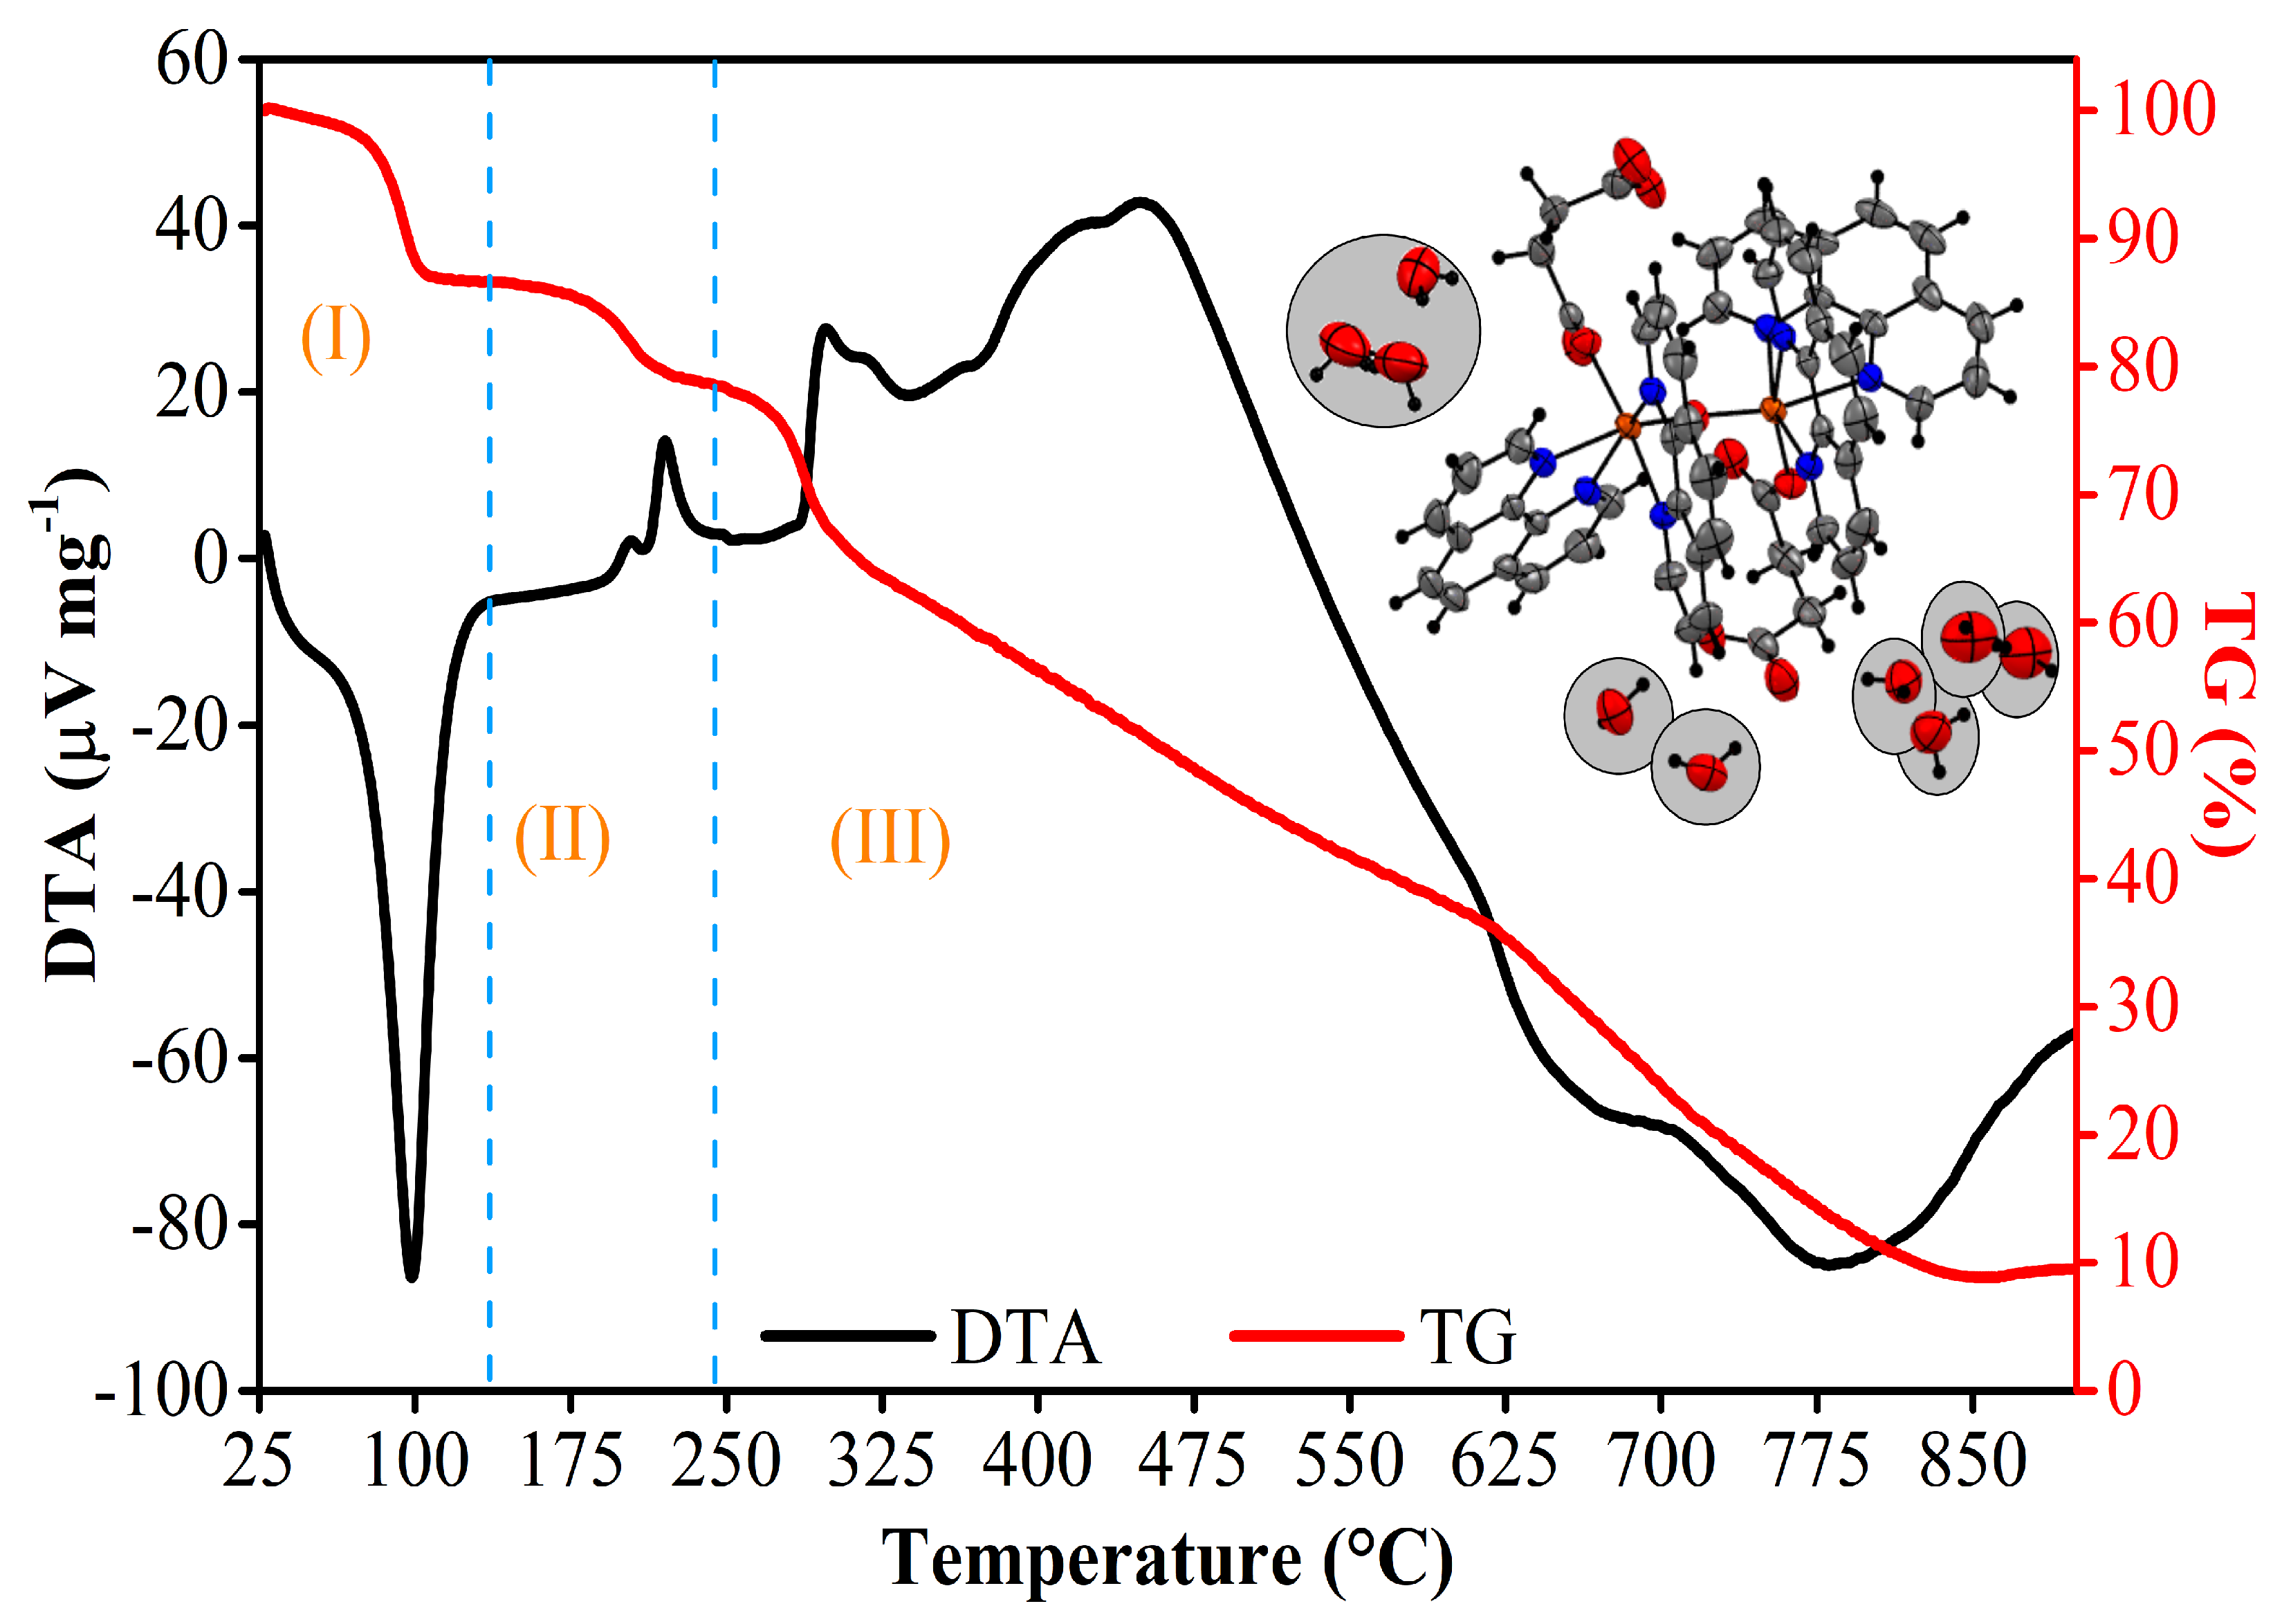
3.6. Thermal Analysis

TG and DTA curves are shown in Figure 10, and thermal data are given in Table 3. As observed from the TG curve, the thermal decomposition of the crystal occurs in 3 main stages. In Stage I, between 25 and 136 °C, there is a mass loss originating from evaporation of the nine non-coordinated H2O molecules that could be distinguished and positioned during the structural determination by single-crystal XRD. It corresponded to 162.14 g∙mol−1 or a mass loss of 13.13%, absorbing approximately 0.61 cal∙mg−1 of heat. In Stage II, occurring between 136 and 242 °C, there is a mass loss of 8.15% (101.29 g∙mol−1) due to the onset of thermal decomposition of the PHEN and SUAC molecules, which indeed tend to occur in the range between 180 and 300 °C [56,57]. The DTA curve for this thermal event shows two slightly prominent exothermic peaks that, together, released about 0.021 cal∙mg−1 of heat. And, in Stage III, from 242 to nearly 900 °C, there is a mass loss of 69.86% (862.22 g∙mol−1) associated with almost complete degradation of the organic components of the crystal and an 8.86% residual mineralized material. This event relates to all three endothermic peaks observed in the DTA curve, which together absorbed 2.57 cal∙mg−1. The two exothermic peaks at higher temperatures refer to the partial oxidation of iron atoms (0.76 cal∙mg−1). Additionally, Table 3 summarizes all thermal events and associated mass losses related to heat variations in the sample, providing a comparison between the degraded molar mass during the experiment and the calculated mass for the complex molecules. This analysis allows precise identification of which molecules are degraded within each temperature range.

4. Conclusions

The novel complex tetrakis(1,10-phenanthroline)-bis(succinate)-(µ2-oxo)-bis(iron(II)) nonahydrate, with the formula [Fe2(Phen)4(Succinate)2(μ-O)](H2O)9, was successfully synthesized, and its crystallographic structure was determined using single-crystal XRD. The complex crystallizes in a monoclinic system, belonging to the C2/c-space group, with four formulas per unit cell. The crystal packing is stabilized by a network of intermolecular interactions, including C–H⋯O, C–O⋯H, C–H⋯π, and π⋯π contacts, as evidenced by Hirshfeld surface analysis. Thermal analysis revealed that the material exhibits good thermal stability within the temperature range of 25–136 °C, undergoing three distinct stages of thermal decomposition. The coordination environment around the iron(II) centers is distorted octahedral, influenced by the mixed-ligand system and crystal field effects, resulting in an Oh-symmetry arrangement. Crystal field splitting and stabilization energy calculations yielded a value of −4.73 eV, suggesting a preference for a low-spin state. UV-Vis spectroscopy supported the occurrence of metal-ligand, ligand-metal, and intraligand charge transfers, with transitions involving σ → σ*, σ* → σ, π → π*, π* → π, and d → d* bonds. The material exhibited a maximum optical band gap of 2.66 eV, indicative of its electronic properties. Vibrational modes analyzed via FT-IR and Raman spectroscopy were consistent with the crystal packing and coordination environment, further corroborating the structural and electronic characteristics of the complex. This study provides valuable insights into the structural, thermal, and electronic properties of the synthesized complex, highlighting its potential applications in materials science and coordination chemistry.

5. Patents

Zavarize, D.G.; Santos, A.O.; Ayala, A.P. Ternary Crystal Derived from 1,10-Phenanthroline, Succinic Acid, and Iron(II,III) Oxide and Its Use. BR10202301457, 2023. National Institute of Industrial Property (INPI), Brazil. Filed: 20 July 2023. Funded by: Federal University of Maranhão (UFMA) and Coordination for the Improvement of Higher Education Personnel (CAPES).

Supplementary Materials

The following supporting information can be downloaded at: https://www.mdpi.com/article/10.3390/pr13051267/s1, Figure S1: Crystal geometry of PHENSUACFe complex Figure S2: Wood and Tauc plots for measurement of the optical bandgap using Tauc’s equation α h ν λ = A ( h ν E g ) at different λ values (2, 1⁄2, 2⁄3, and 1/3) to find the nature of PHENSUACFe electronic transitions, where 2 and 1⁄2 are for direct and indirect allowed transitions (A) and 2⁄3 and 1⁄3 denote direct and indirect forbidden transitions (B); Framework S1: Required calculations for Wood’s and Tauc’s equation with UV-Vis absorbance data for determination of the optical bandgap energy and nature of electronic transitions in the complex; Framework S2: Continuation of required calculations for Wood’s and Tauc’s equation with UV-Vis absorbance data for the determination of optical bandgap energy and the nature of electronic transitions in the complex.

Author Contributions

Conceptualization, D.G.Z., J.G.d.O.N. and K.R.A.; methodology, D.G.Z., J.G.d.O.N., K.R.A., A.P.A., F.F.d.S. and A.O.d.S.; software, D.G.Z. and A.P.A.; validation, J.G.d.O.N., K.R.A., A.P.A., F.F.d.S. and A.O.d.S.; formal analysis, D.G.Z. and J.G.d.O.N.; investigation, D.G.Z., J.G.d.O.N., A.P.A., F.F.d.S. and A.O.d.S.; resources, A.O.d.S.; data curation, D.G.Z., J.G.d.O.N., K.R.A., A.P.A., F.F.d.S. and A.O.d.S.; writing—original draft preparation, D.G.Z., J.G.d.O.N., A.P.A., F.F.d.S. and A.O.d.S.; writing—review and editing, J.G.d.O.N., F.F.d.S. and A.O.d.S.; visualization, D.G.Z.; supervision, J.G.d.O.N. and A.O.d.S.; project administration, A.O.d.S.; funding acquisition, A.O.d.S. All authors have read and agreed to the published version of the manuscript.

Funding

This research was funded by the Coordenação de Aperfeiçoamento de Pessoal de Nível Superior (CAPES), grant number 001; Fundação de Amparo à Pesquisa e ao Desenvolvimento Científico e Tecnológico do Maranhão (FAPEMA), grant number BPD-12643/22; and Conselho Nacional de Desenvolvimento Científico e Tecnológico (CNPq), grant numbers 312926/2020-0 and 317469/2021-5.

Data Availability Statement

The crystal structure information is available at www.ccdc.cam.ac.uk (accessed on 15 March 2025) and in the Cambridge Structural Database under the numbers 2300427 for [Fe2(Phen)4(Succinate)2(μ-O)](H2O)9.

Acknowledgments

All authors thank the Postgraduate Program in Materials Science at the Federal University of Maranhão and the Federal University of Pará.

Conflicts of Interest

The authors declare that they have no known competing financial interests or personal relationships that could have been considered relevant to the work reported in this paper.

References

  1. Wu, F.; Xie, J.; Zhu, Z. 1,10-Phenanthroline: A Versatile Ligand to Promote Copper-Catalyzed Cascade Reactions. Appl. Organomet. Chem. 2020, 34, e5926. [Google Scholar] [CrossRef]
  2. Kunz, D.; Flaig, K.S. The Coordinative Flexibility of Rigid Phenanthroline-Analogous Di(NHC)-Ligands. Coord. Chem. Rev. 2018, 377, 73–85. [Google Scholar] [CrossRef]
  3. Dalal, A.; Nehra, K.; Hooda, A.; Singh, D.; Kumar, P.; Kumar, S.; Malik, R.S.; Rathi, B. Luminous Lanthanide Diketonates: Review on Synthesis and Optoelectronic Characterizations. Inorganica Chim. Acta 2023, 550, 121406. [Google Scholar] [CrossRef]
  4. Binnemans, K.; Lenaerts, P.; Driesen, K.; Görller-Walrand, C. A Luminescent Tris(2-Thenoyltrifluoroacetonato)Europium(Iii) Complex Covalently Linked to a 1,10-Phenanthroline-Functionalised Sol-Gel Glass. J. Mater. Chem. 2004, 14, 191. [Google Scholar] [CrossRef]
  5. von Eschwege, K.G.; Conradie, J. Review of DFT-Simulated and Experimental Electrochemistry Properties of the Polypyridyl Row-1 Mn, Fe & Co, and Group-8 Fe, Ru and Os MLCT Complexes. Electrochem. Commun. 2022, 136, 107225. [Google Scholar] [CrossRef]
  6. Kipgen, L.; Bernien, M.; Tuczek, F.; Kuch, W. Spin-Crossover Molecules on Surfaces: From Isolated Molecules to Ultrathin Films. Adv. Mater. 2021, 33, 2008141. [Google Scholar] [CrossRef]
  7. Butler, S.M.; Jolliffe, K.A. Molecular Recognition and Sensing of Dicarboxylates and Dicarboxylic Acids. Org. Biomol. Chem. 2020, 18, 8236–8254. [Google Scholar] [CrossRef]
  8. Neto, J.G.O.; da Silva Filho, J.G.; Cruz, N.S.; de Sousa, F.F.; Filho, P.F.F.; Santos, A.O. Growth, Structural, Vibrational, DFT and Thermal Studies of Bis(β-Alanine) Nickel(II) Dihydrate Crystals. J. Phys. Chem. Solids 2020, 141, 109435. [Google Scholar] [CrossRef]
  9. Ramos, M.C.; Neto, J.G.D.O.; Nogueira, C.E.S.; Reis, A.S.; Sousa, F.F.D.; Silva, L.M.; Santos, A.O. Structural, Vibrational, Thermal, and Cytotoxic Characterization of Aqua (1,10-Phenanthroline)(L-Serinato) Copper (II) Nitrate Complex Combined with DFT Calculations. Cryst. Res. Technol. 2023, 58, 2300240. [Google Scholar] [CrossRef]
  10. de Oliveira Neto, J.G.; Viana, J.R.; Butarelli, A.L.A.; dos Santos, A.P.A.; Lage, M.R.; dos Santos, A.O. Synthesis, Physicochemical Properties, and Antitumor Cytotoxic Activity of the Mg(II) Coordination Complex Containing 1,10-Phenanthroline and Sulfate Ligands. Inorganica Chim. Acta 2023, 556, 121658. [Google Scholar] [CrossRef]
  11. Engel, E.R.; Engel, E.R.; Scott, J.L. Advances in the Green Chemistry of Coordination Polymer Materials. Green Chem. 2020, 22, 3693–3715. [Google Scholar] [CrossRef]
  12. Fu, W.; Yi, J.; Cheng, M.; Liu, Y.; Zhang, G.; Li, L.; Du, L.; Li, B.; Wang, G.; Yang, X. When Bimetallic Oxides and Their Complexes Meet Fenton-like Process. J. Hazard. Mater. 2022, 424, 127419. [Google Scholar] [CrossRef] [PubMed]
  13. Dutta, D.; Nath, H.; Frontera, A.; Bhattacharyya, M.K. A Novel Oxalato Bridged Supramolecular Ternary Complex of Cu(II) Involving Energetically Significant π-Hole Interaction: Experimental and Theoretical Studies. Inorganica Chim. Acta 2019, 487, 354–361. [Google Scholar] [CrossRef]
  14. Emami, F.; Aliomrani, M.; Tangestaninejad, S.; Kazemian, H.; Moradi, M.; Rostami, M. Copper-Curcumin-Bipyridine Dicarboxylate Complexes as Anticancer Candidates. Chem. Biodivers. 2022, 19, e202200202. [Google Scholar] [CrossRef]
  15. Beheshti, A.; Lalegani, A.; Bruno, G.; Amiri Rudbari, H. Investigating the Effect of Flexible Ligands on the Crystal Engineering of the Iron(II) Coordination Compounds. J. Mol. Struct. 2013, 1051, 244–249. [Google Scholar] [CrossRef]
  16. Malinowski, J.; Zych, D.; Jacewicz, D.; Gawdzik, B.; Drzeżdżon, J. Application of Coordination Compounds with Transition Metal Ions in the Chemical Industry—A Review. Int. J. Mol. Sci. 2020, 21, 5443. [Google Scholar] [CrossRef]
  17. Matsumoto, Y. Energy Positions of Oxide Semiconductors and Photocatalysis with Iron Complex Oxides. J. Solid State Chem. 1996, 126, 227–234. [Google Scholar] [CrossRef]
  18. Que, L.; Tolman, W.B. Biologically Inspired Oxidation Catalysis. Nature 2008, 455, 333–340. [Google Scholar] [CrossRef]
  19. Hauser, A. Ligand Field Theoretical Considerations. Adv. Polym. Sci. 2004, 233, 49–58. [Google Scholar] [CrossRef]
  20. Bousseksou, A.; Molnár, G.; Real, J.A.; Tanaka, K. Spin Crossover and Photomagnetism in Dinuclear Iron(II) Compounds. Coord. Chem. Rev. 2007, 251, 1822–1833. [Google Scholar] [CrossRef]
  21. Olguín, J.; Brooker, S. Spin Crossover Active Iron(II) Complexes of Selected Pyrazole-Pyridine/Pyrazine Ligands. Coord. Chem. Rev. 2011, 255, 203–240. [Google Scholar] [CrossRef]
  22. Roth, H.C.; Schwaminger, S.P.; Schindler, M.; Wagner, F.E.; Berensmeier, S. Influencing Factors in the CO-Precipitation Process of Superparamagnetic Iron Oxide Nano Particles: A Model Based Study. J. Magn. Magn. Mater. 2015, 377, 81–89. [Google Scholar] [CrossRef]
  23. APEX4 Data Collection Software, Version 2021.4-0; Bruker AXS Inc.: Madison, WI, USA, 2021.
  24. SAINT Data Reduction Software; Version 8.36; Bruker AXS Inc.: Madison, WI, USA, 2019.
  25. Sheldrick, G.M. SHELXT—Integrated Space-Group and Crystal-Structure Determination. Acta Crystallogr. Sect. A Found. Crystallogr. 2015, 71, 3–8. [Google Scholar] [CrossRef] [PubMed]
  26. Sheldrick, G.M. A Short History of SHELX. Acta Crystallogr. Sect. A Found. Crystallogr. 2008, 64, 112–122. [Google Scholar] [CrossRef]
  27. Dolomanov, O.V.; Bourhis, L.J.; Gildea, R.J.; Howard, J.A.K.; Puschmann, H. OLEX2: A Complete Structure Solution, Refinement and Analysis Program. J. Appl. Crystallogr. 2009, 42, 339–341. [Google Scholar] [CrossRef]
  28. MacRae, C.F.; Sovago, I.; Cottrell, S.J.; Galek, P.T.A.; McCabe, P.; Pidcock, E.; Platings, M.; Shields, G.P.; Stevens, J.S.; Towler, M.; et al. Mercury 4.0: From Visualization to Analysis, Design and Prediction. J. Appl. Crystallogr. 2020, 53, 226–235. [Google Scholar] [CrossRef]
  29. Farrugia, L.J. ORTEP-3 for Windows—A Version of ORTEP-III with a Graphical User Interface (GUI). J. Appl. Crystallogr. 1997, 30, 565. [Google Scholar] [CrossRef]
  30. Makuła, P.; Pacia, M.; Macyk, W. How To Correctly Determine the Band Gap Energy of Modified Semiconductor Photocatalysts Based on UV-Vis Spectra. J. Phys. Chem. Lett. 2018, 9, 6814–6817. [Google Scholar] [CrossRef]
  31. Tan, H.L.; Abdi, F.F.; Ng, Y.H. Heterogeneous Photocatalysts: An Overview of Classic and Modern Approaches for Optical, Electronic, and Charge Dynamics Evaluation. Chem. Soc. Rev. 2019, 48, 1255–1271. [Google Scholar] [CrossRef]
  32. Turner, M.J.; McKinnon, J.J.; Wolff, S.K.; Gromwood, D.J.; Spackman, P.R.; Jay-alitaka, D.M.A.S. Crystal Explorer, Version 17.5; The University of Western Australia (UWA): Perth, Australia, 2017.
  33. Romańczyk, P.P.; Kurek, S.S. Molecular Electrochemistry of Coordination Compounds—A Correlation Between Quantum Chemical Calculations and Experiment; Springer: Berlin/Heidelberg, Germany, 2019. [Google Scholar] [CrossRef]
  34. Ramezanpour, B.; Mirzaei, M.; Jodaian, V.; Niknam Shahrak, M.; Frontera, A.; Molins, E. Seven and Eight-Coordinate Fe(III) Complexes Containing Pre-Organized Ligand 1,10-Phenanthroline-2,9-Dicarboxylic Acid: Solvent Effects, Supramolecular Interactions and DFT Calculations. Inorganica Chim. Acta 2019, 484, 264–275. [Google Scholar] [CrossRef]
  35. Vlasenko, V.G.; Kubrin, S.P.; Garnovskii, D.A.; Guda, A.A.; Pankin, I.A.; Trigub, A.L. Spin-Crossover in the Iron(II) Complex Based on Dihydro-Bis(Pyrazolyl)Borate and 1,10-Phenanthroline-5,6-Dione. Chem. Phys. Lett. 2020, 739, 136970. [Google Scholar] [CrossRef]
  36. Dimiza, F.; Barmpa, A.; Chronakis, A.; Hatzidimitriou, A.G.; Sanakis, Y.; Papadopoulos, A.N.; Psomas, G. Iron(III) Complexes with Non-Steroidal Anti-Inflammatory Drugs: Structure, Antioxidant and Anticholinergic Activity, and Interaction with Biomolecules. Int. J. Mol. Sci. 2023, 24, 6391. [Google Scholar] [CrossRef] [PubMed]
  37. Hassan, Z.M.; Alattar, R.A.; Abass, S.K.; Mihsen, H.H.; Abbas, Z.F.; Hussain, K.A. Synthesis, characterization and biological activity of mixed ligand (imine of benzidine and 1,10-phenanthroline) complexes with Fe(II), Co(II), Ni(II) and Cu(II) ions. Chem. Chem. Technol. 2022, 16, 15–24. [Google Scholar] [CrossRef]
  38. Avdeeva, V.V.; Kubasov, A.S.; Korolenko, S.E.; Privalov, V.I.; Malinina, E.A.; Kuznetsov, N.T. Iron(II), Cobalt(II), and Nickel(II) Complexes with 1,10-Phenanthroline and 2,2′-Bipyridyl and the Macropolyhedral Borane Cluster [Trans-B20H18]2- as Counterion. Polyhedron 2022, 217, 115740. [Google Scholar] [CrossRef]
  39. Oliveira Neto, J.G.D.; Viana, J.R.; Kamila, R.V.; Luiz, R.A.; Silva, F.L.; Lage, M.R.; Stoyanov, S.R.; Sousa, F.F.D.; Lang, R.; Adenilson, O. Tutton Salt (NH4)2Zn(SO4)2(H2O)6: Thermostructural, Spectroscopic, Hirshfeld Surface, and DFT Investigations. J. Mol. Model. 2024, 30, 339. [Google Scholar] [CrossRef]
  40. de Oliveira Neto, J.G.; Viana, J.R.; Abreu, K.R.; Butarelli, A.L.A.; dos Santos, A.P.A.; Lage, M.R.; de Sousa, F.F.; Souto, E.B.; dos Santos, A.O. Antitumor Neodymium(III) Complex with 1,10-Phenanthroline and Nitrate Ligands: A Comprehensive Experimental-Theoretical Study, in Silico Pharmacokinetic and Cytotoxic Properties. J. Mol. Struct. 2025, 1321, 139757. [Google Scholar] [CrossRef]
  41. Maradudin, A.A.; Vosko, S.H. Symmetry Properties of the Normal Vibrations of a Crystal. Rev. Mod. Phys. 1968, 40, 1–37. [Google Scholar] [CrossRef]
  42. Schöne, S.; Radoske, T.; März, J.; Stumpf, T.; Ikeda-Ohno, A. Synthesis and Characterization of Heterometallic Iron-Uranium Complexes with a Bidentate N-Donor Ligand (2,2′-Bipyridine or 1,10-Phenanthroline). Inorg. Chem. 2018, 57, 13318–13329. [Google Scholar] [CrossRef]
  43. Smith, G.L.; Reutovich, A.A.; Srivastava, A.K.; Reichard, R.E.; Welsh, C.H.; Melman, A.; Bou-Abdallah, F. Complexation of Ferrous Ions by Ferrozine, 2,2′-Bipyridine and 1,10-Phenanthroline: Implication for the Quantification of Iron in Biological Systems. J. Inorg. Biochem. 2021, 220, 111460. [Google Scholar] [CrossRef]
  44. Pereira, W.O.; Neto, J.G.O.; Viana, J.R.; Carvalho, G.G.C.; Santos, A.O. Synthesis, Electronic and Vibrational Properties, Solvation Effects, ADME and Cytotoxic Assay of Aqua -(1,10-phenanthroline)-tyrosinato-copper(II) Nitrate Dihydrate Complex: Experimental and Theoretical Studies. J. Mater. Sci. 2024, 1, 9502–9518. [Google Scholar] [CrossRef]
  45. Rodrigues, J.A.O.; Torres, A.U.; de Sousa, N.A.B.; de Sousa, T.J.D.; Neto, J.G.O.; Reis, A.S.; Lage, M.R.; dos Santos, A.O.; dos Santos, C.C.; de Menezes, A.S.; et al. Synthesis, Characterization, DFT Study, and Antibacterial Activity of a Coordination Complex of Cu(II) with 1,10-Phenanthroline and L-Methionine Ligands. J. Mol. Struct. 2023, 1293, 136197. [Google Scholar] [CrossRef]
  46. de Oliveira Neto, J.G.; Filho, J.G.S.; Bittar, E.M.; Silva, L.M.; de Sousa, F.F.; Domingos, H.V.; Costa-Lotufo, L.V.; Reis, A.S.; dos Santos, A.O. Structural, Thermal, Electronic, Vibrational, Magnetic, and Cytotoxic Properties of Chloro(Glycinato-N,O)(1,10-Phenanthroline-N,N′)-copper(II) Trihydrate Coordination Complex. J. Inorg. Biochem. 2022, 226, 111658. [Google Scholar] [CrossRef] [PubMed]
  47. Nurani, D.A.; Butar, B.C.B.; Krisnandi, Y.K. Synthesis and Characterization of Metal Organic Framework Using Succinic Acid Ligand with Cobalt and Iron Metals as Methylene Blue Dye Adsorbent. In IOP Conference Series: Materials Science and Engineering, Proceedings of the 4th International Symposium on Current Progress in Functional Materials, Bali, Indonesia, 6–7 November 2019; IOP Publishing Ltd.: Bristol, UK, 2020; Volume 902. [Google Scholar] [CrossRef]
  48. Tigineh, G.T.; Sitotaw, G.; Workie, A.; Abebe, A. Synthesis, Characterization and in Vitro Antibacterial Studies on Mixed Ligand Complexes of Iron(III) Based on 1,10-Phenanthroline. J. Korean Chem. Soc. 2021, 65, 203–208. [Google Scholar] [CrossRef]
  49. Ouyang, Z.J.; Mo, X.Y.; Ye, J.Q.; Yu, X.X.; Huang, S.Y.; Liu, X.L.; Chen, W.B.; Gao, S.; Dong, W. High Temperature Anionic Fe(Iii) Spin Crossover Behavior in a Mixed-Valence Fe(Ii)/Fe(Iii) Complex. Dalt. Trans. 2021, 50, 5960–5967. [Google Scholar] [CrossRef]
  50. Azad, U.P.; Turllapati, S.; Rastogi, P.K.; Ganesan, V. Tris(1,10-Phenanthroline)Iron(II)-Bentonite Film as Efficient Electrochemical Sensing Platform for Nitrite Determination. Electrochim. Acta 2014, 127, 193–199. [Google Scholar] [CrossRef]
  51. Šima, J.; Makáňová, J. Photochemistry of Iron (III) Complexes. Coord. Chem. Rev. 1997, 160, 161–189. [Google Scholar] [CrossRef]
  52. Singh, J.; Srivastav, A.N.; Sinh, N.; Singh, A. Stability Constants of Metal Complexes in Solution. In Stability and Applications of Coordination Compounds; Srivastav, A.N., Ed.; IntechOpen: London, UK, 2020; Volume 1, pp. 1–18. [Google Scholar] [CrossRef]
  53. Starikov, A.G.; Starikova, A.A.; Chegerev, M.G.; Minkin, V.I. Computational Modeling of Spin-Crossover in Mixed-Ligand Binuclear Iron and Cobalt Complexes with 5,6-Bis(Salicylideneimino)-1,10-Phenanthroline. Russ. J. Coord. Chem. Khimiya 2019, 45, 105–111. [Google Scholar] [CrossRef]
  54. Droghetti, A.; Alfè, D.; Sanvito, S. Assessment of Density Functional Theory for Iron(II) Molecules across the Spin-Crossover Transition. J. Chem. Phys. 2012, 137, 124303. [Google Scholar] [CrossRef]
  55. Kepp, K.P. The Electronic Determinants of Spin Crossover Described by Density Functional Theory. In Challenges and Advances in Computational Chemistry and Physics; Springer: Berlin/Heidelberg, Germany, 2019; Volume 29, pp. 1–33. [Google Scholar] [CrossRef]
  56. Krishnan, S.; Raj, C.J.; Robert, R.; Ramanand, A.; Jerome Das, S. Growth and Characterization of Succinic Acid Single Crystals. Cryst. Res. Technol. 2007, 42, 1087–1090. [Google Scholar] [CrossRef]
  57. Braun, D.E.; Schneeberger, A.; Griesser, U.J. Understanding the Role of Water in 1,10-Phenanthroline Monohydrate. CrystEngComm 2017, 19, 6133–6145. [Google Scholar] [CrossRef]
Figure 1. Reaction path for the synthesis of complex represented by (3), where (1), (2) and (3) represent the intermediary steps and resulting compounds during synthesis.
Processes 13 01267 g001
Figure 2. Image of crystals obtained using the slow solvent evaporation method.
Processes 13 01267 g002
Figure 3. XRD pattern of the crystal and (inset) of the a-axis perspective of its unit cell.
Processes 13 01267 g003
Figure 4. Molecular structure of the coordination complex: (a) as per crystallographic positioning and (b) ORTEP-3 drawn at the 50% probability level (C = dark grey, H = light grey, N = light purple, Fe = orange, and O = red).
Processes 13 01267 g004
Figure 5. Main bond lengths (a,c) and angles (b,d) at coordination centers of the coordination complex.
Processes 13 01267 g005
Figure 6. Three-dimensional normalized contact distances and respective 2D fingerprint plots of the total (a) and partial (b) main interactions in the crystal packing of the complex.
Processes 13 01267 g006
Figure 7. Hirshfeld surface mapped according to the function: (a) shape index and (b) curvedness.
Processes 13 01267 g007
Figure 8. FT-IR (a) and Raman (b) spectra of the crystal samples.
Processes 13 01267 g008
Figure 9. Experimental UV-Vis spectrum obtained from crystal samples.
Processes 13 01267 g009
Figure 10. Thermal decomposition of the powdered crystal sample from TG and DTA curves analysis and (inset) and illustration of the complex with highlighted non-coordinated waters (I, II and III mean the stages of thermal decomposition).
Processes 13 01267 g010
Table 1. Crystallographic information and the refinement data for the crystal.
CCDC Deposition Number2300427
Chemical Formula *C56H58Fe2N8O18·9(H2O)
Mr (g∙mol−1)1242.80
a (Å)12.7772 (10)
b (Å)23.0786 (15)
c (Å)18.9982 (13)
α = γ (°)90
β (°)93.047 (3)
V3)5594.3 (7)
Z4
Radiation TypeMoKα
µ (mm−1)0.601
Crystal Size (mm3)0.36 × 0.33 × 0.24
Data Collection
DiffractometerBruker D8 Venture
Absorption CorrectionIntegration (SADAB)
Tmin, Tmax0.981, 0.993
N° of Measured, Independent and Observed [I > 2σ(I)] reflections97,690, 10,259, 3420
Rint, Rsigma0.0425, 0.0265
(sin θ/λ)max−1)0.588
Refinement
R[F2 > 2σ (F2)], wR(F2), S [all data]0.0617, 0.1219, 1.075
N° of Reflections10,259
N° of Parameters399
H-atom treatmentRiding Model
Δρmax, Δρmin (e Å−3)0.43, −0.47
* Based on the symmetrical unit of the molecule for the purpose of unit cell calculations.
Table 2. Main intermolecular H-based bonds and angles in the crystal packing of the complex.
BondsDistances (Å)Angles (°)
D–H⋯AD–HH⋯AD⋯AD–H⋯A
C4–O3⋅⋅⋅H2WB (i)0.581.351.94135.0
C4–O4⋅⋅⋅H1WB (ii)0.581.361.94166.5
C4–O4⋅⋅⋅H1WA (iii)0.621.442.06165.4
C13A–H13A⋅⋅⋅H3WA (iv)0.631.462.0984.6
C4–O3⋅⋅⋅H3WB (v)0.631.482.11114.6
C11B–H11B⋅⋅⋅H2A (x)0.711.662.3772.0
C2–H2A⋅⋅⋅H1WA (iii)0.721.682.39161.7
C12A–O2⋅⋅⋅H12A (vii)0.731.712.44145.2
C2B–H2BA⋅⋅⋅O2W (viii)0.741.732.47124.3
C3A–H3A⋅⋅⋅O4W (ix)0.761.762.5255.6
C1–O2⋅⋅⋅H5WB (iv)0.781.822.60168.8
C13A–H13A⋅⋅⋅O3W (iv)0.811.882.6982.5
C8B–H8B⋅⋅⋅O5W (vi)0.811.892.6974.9
Symmetry codes: (i) x, 1 − y, 1/2 + z, (ii) 1 − x, y, 3/2 − z, (iii) −1/2 + x, 3/2 − y, 1/2 + z, (iv) x, y, z, (v) −x, y, 3/2 − z, (vi) 1/2 − x, −1/2 + y, 3/2 − z, (vii) 1/2 − x, 3/2 − y, 1 − z, (viii) 1 − x, 1 − y, 1 − z, (ix) −x, 1 − y, 1 − z, (x) x, y, z. Bond errors: 0.0009–0.0019 Å. Angles errors: 0.0012–0.0018°.
Table 3. Events fragmentation in TG and DTA thermal analyses for the complex.
GeneralDTATG
Frag.StageTemp (°C)Weight LossMolar Mass
(g∙mol−1)
Exp.Calc. *
9 H2OI
(25–136 °C)
80 (↓)13.3%
0.49 mg
162.14170.28
C12H6N2O2
+
C4H6O4
II
(136–242 °C)
205 (↑)
222 (↑)
8.15%
0.30 mg
101.29181.70
C12H6N2O2
+
C4H6O4
+
FeO
III
(242–855 °C)
298 (↑)
341 (↓)
455 (↑)
671 (↓)
783 (↓)
69.86%
2.58 mg
868.22890.82
Total Molecular Mass (g∙mol−1)1132.691242.80
* Calc. Molar mass of the complex determined by single crystal XRD. ↓ Endothermic. ↑ Exothermic.
Disclaimer/Publisher’s Note: The statements, opinions and data contained in all publications are solely those of the individual author(s) and contributor(s) and not of MDPI and/or the editor(s). MDPI and/or the editor(s) disclaim responsibility for any injury to people or property resulting from any ideas, methods, instructions or products referred to in the content.

