Abstract
Colour is a key parameter in the evaluation of food products. Accurate colour measurement enables us to maintain their consistent quality. The aim of this study was to compare three colour measurement methods. The food products used for the study were French fries, the colour of which was checked after defined frying times. Their colour was measured using a professional Minolta C-5 spectrophotometer (Konica Minolta Sensing Europe B.V., Nieuwegein, The Netherlands) as well as a low-cost SparkFun SEN-15050 spectrophotometer (SparkFun Electronics, Niwot, CO, USA) and a readily available HP SkanJet 4850 scanner (Hewlett Packard, Palo Alto, CA, USA). The images obtained were analysed using free ImageJ software ver. 1.54. The results indicate that low-cost spectrophotometers used in the Internet of Things (IoT) systems and colour measurement methods based on vision techniques are suitable for less precise but fast measurements and, in such cases, can successfully replace the expensive and often bulky devices.
1. Introduction
Colour is one of the key attributes affecting human perception of food quality. Consumers, when choosing products, pay attention to their appearance, especially colour. This is why colour control in the food industry is extremely important, not only from an aesthetic standpoint but also as an indicator of freshness, ripeness, or quality of food processing [1,2]. Precise colour measurement in the food industry helps to maintain high product quality, optimise production processes, and build trust among consumers. Various methods of colour measurement can be employed, depending on the required accuracy, product specificity, and applications. Traditional methods of colour assessment are based on human visual assessment, but it is a subjective approach, and prone to errors resulting from the type of lighting or fatigue or individual differences in colour perception. This is why the food industry applies more and more advanced, objective measurement techniques, mostly colourimetric and spectrophotometric. A colourimeter measures separately the three primary colours: red (R), green (G), and blue (B), which are responsible for colour perception by the human eye. Colourimeters enable us to take quick and relatively cheap measurements, but their accuracy is limited, especially in the case of more complex colours or products, when colour depends on texture and turbidity. Spectrophotometers are more advanced, allowing detailed colour measurements in the full spectrum of visible light, in a non-destructive way [3]. They split light into various wavelengths and measure light transmission or reflection by the sample in the whole spectrum. Consequently, spectrophotometers can provide us with more accurate and detailed information about colour. They are particularly useful for products with diverse and complex shades, such as processed fruit, drinks, sauce, or meat.
The food industry commonly employs standard colour evaluation systems, such as CIELab. This is a three-dimensional colour model, which expresses colour as three values: L* (perceptual lightness), a* (green–red), and b* (blue–yellow). It is regarded as one of the most accurate models for colour evaluation of food products and is used in many sectors: from the dairy industry to fruit and vegetable processing. Another popular system is CIE XYZ, which describes colour on the basis of three coordinates—X, Y, and Z—but the CIELab system provides a more intuitive approach to the measurements [4].
Thanks to technological progress, measurement systems are more and more advanced. Currently used devices enable automation of the measurements and integration with production management systems, which allows real-time colour monitoring and control. Multispectral cameras and vision systems enable us to perform even more detailed analyses on production lines, which in turn make it possible to react quickly to any deviations from the norm. Vision systems are currently commonly used in food processing. Conventional applications of such systems in agriculture and the food industry include geometric analysis [5,6], classification [7], colour measurement [8], toxin detection [9], and monitoring of the frying process [10].
This study aimed to compare three methods for monitoring colour changes in French fries during frying. Colour measurements were taken with a professional spectrophotometer (Minolta C-5), a cheap spectrophotometer (SparkFun SEN-15050), and a scanner (HP ScanJet 4850) with ImageJ software for digital image analysis.
2. Materials and Methods
Raw frozen French fries were used in the experiment. They were fried in canola oil in a 4-litre Deep Fryer Mastercook, where the oil was heated to 185 °C. Each time, 30–35 elongated pieces of potato were used. Measurements were taken after frying for 0.5, 1, 1.5, 2, 2.5, 3, 3.5, 4, 4.5, 5, 5.5, 6, 6.5, 7, 7.5, 8, 9, 10, 11, 12, 13, 14, 15, 16, 17, 18, 19, 20 min, but also at time 0 (before frying = raw frozen pieces of potato).
2.1. Measurements Taken with the Minolta C-5 Spectrophotometer (Konica Minolta Sensing Europe B.V., Nieuwegein, The Netherlands)
After every treatment, we took 5 samples composed of 4 randomly selected French fries. Each sample on a glass Petri dish was placed on the top port of the spectrophotometer. For each sample, the mean of 5 measurements was recorded.
2.2. Measurements Taken with the SparkFun SEN-15050 Spectrophotometer (SparkFun Electronics, Niwot, CO, USA)
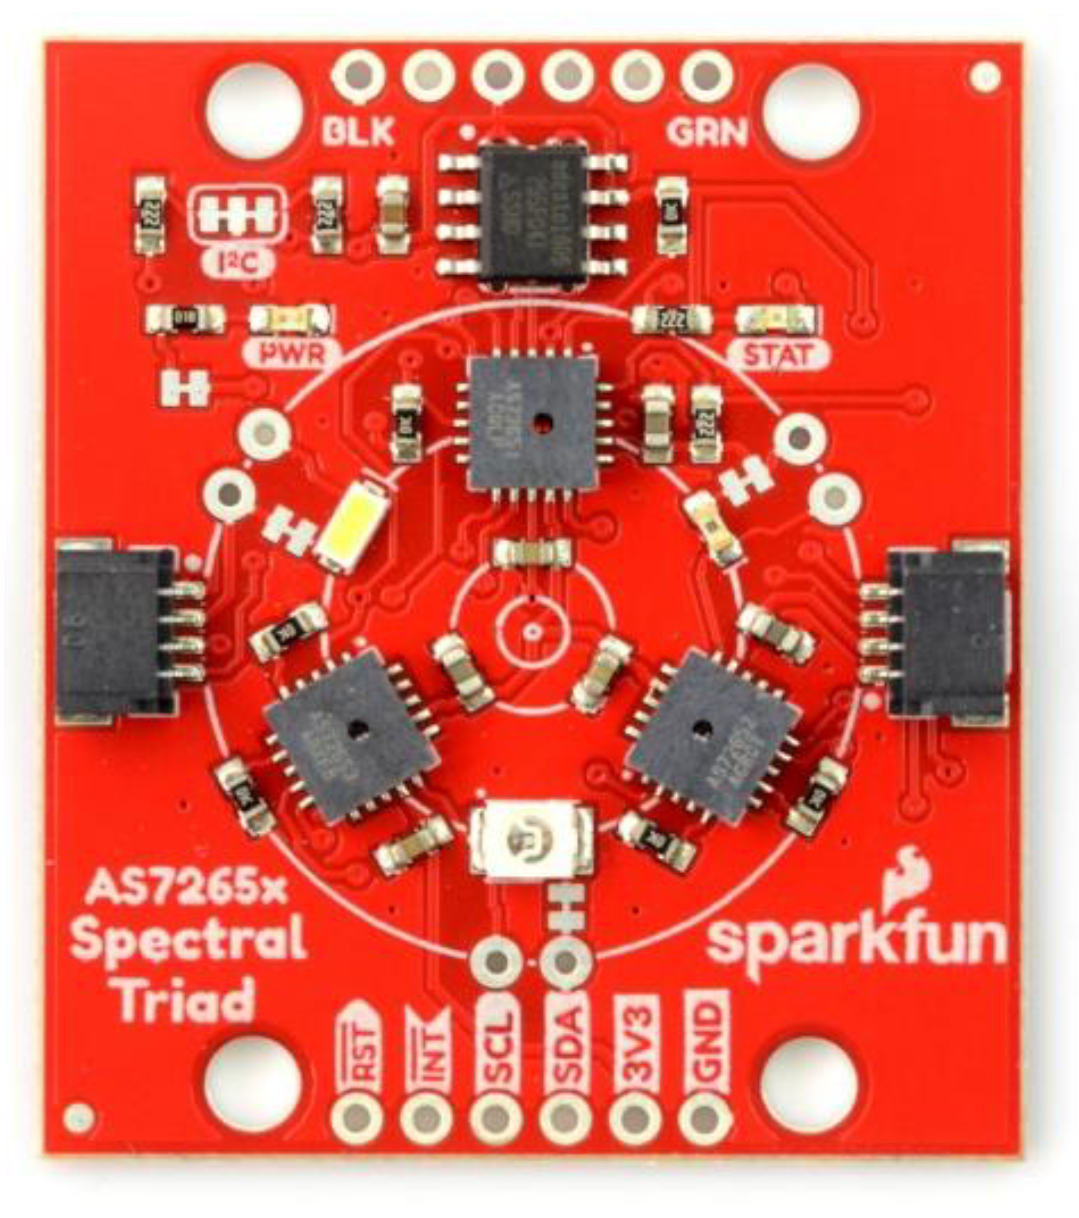
The AS7265x chipset consists of 3 sensor devices: AS72651 (ams-OSRAM AG, Premstaetten, Austria) with master capability, AS72652 (ams-OSRAM AG, Premstaetten, Austria), and AS72653 (ams-OSRAM AG, Premstaetten, Austria) (Figure 1). The multispectral sensors can be used for spectral identification in a range from visible to near-infrared (NIR). Each device has 6 independent on-device optical filters whose spectral response is defined in the range from 410 nm to 940 nm, with a full width at half maximum (FWHM) of 20 nm. AS72651, combined with AS72652 (spectral response from 560 nm to 940 nm) and AS72653 (spectral response from 410 nm to 535 nm), form an AS7265x 18-channel multi-spectral sensor chipset [11].

Figure 1.
Spectrophotometer SparkFun SEN-15050, with a multi-spectral sensor chipset AS7265x.
The spectrophotometer was placed on a stand and directed vertically towards the measurement table lighted with an LED bulb (PHILIPS A67, colour 4000K, power 17.5 W—PHILIPS, Amsterdam, The Netherlands). The measurements were timed by a Raspberry Pi 3B computer (Raspberry Pi Foundation, Cambridge, UK) with software that switched on the sensor every 3 s. The fries were tightly arranged on white paper (without spaces between them), and the paper was moved 1 cm every time when the computer signalled a finished measurement and readiness for another one. In this way, colour was measured in 20 areas with French fries.
2.3. Measurements Taken with the HP Scan Jet 4850 Scanner and ImageJ Software for Digital Image Analysis (Hewlett Packard, Palo Alto, CA, USA)
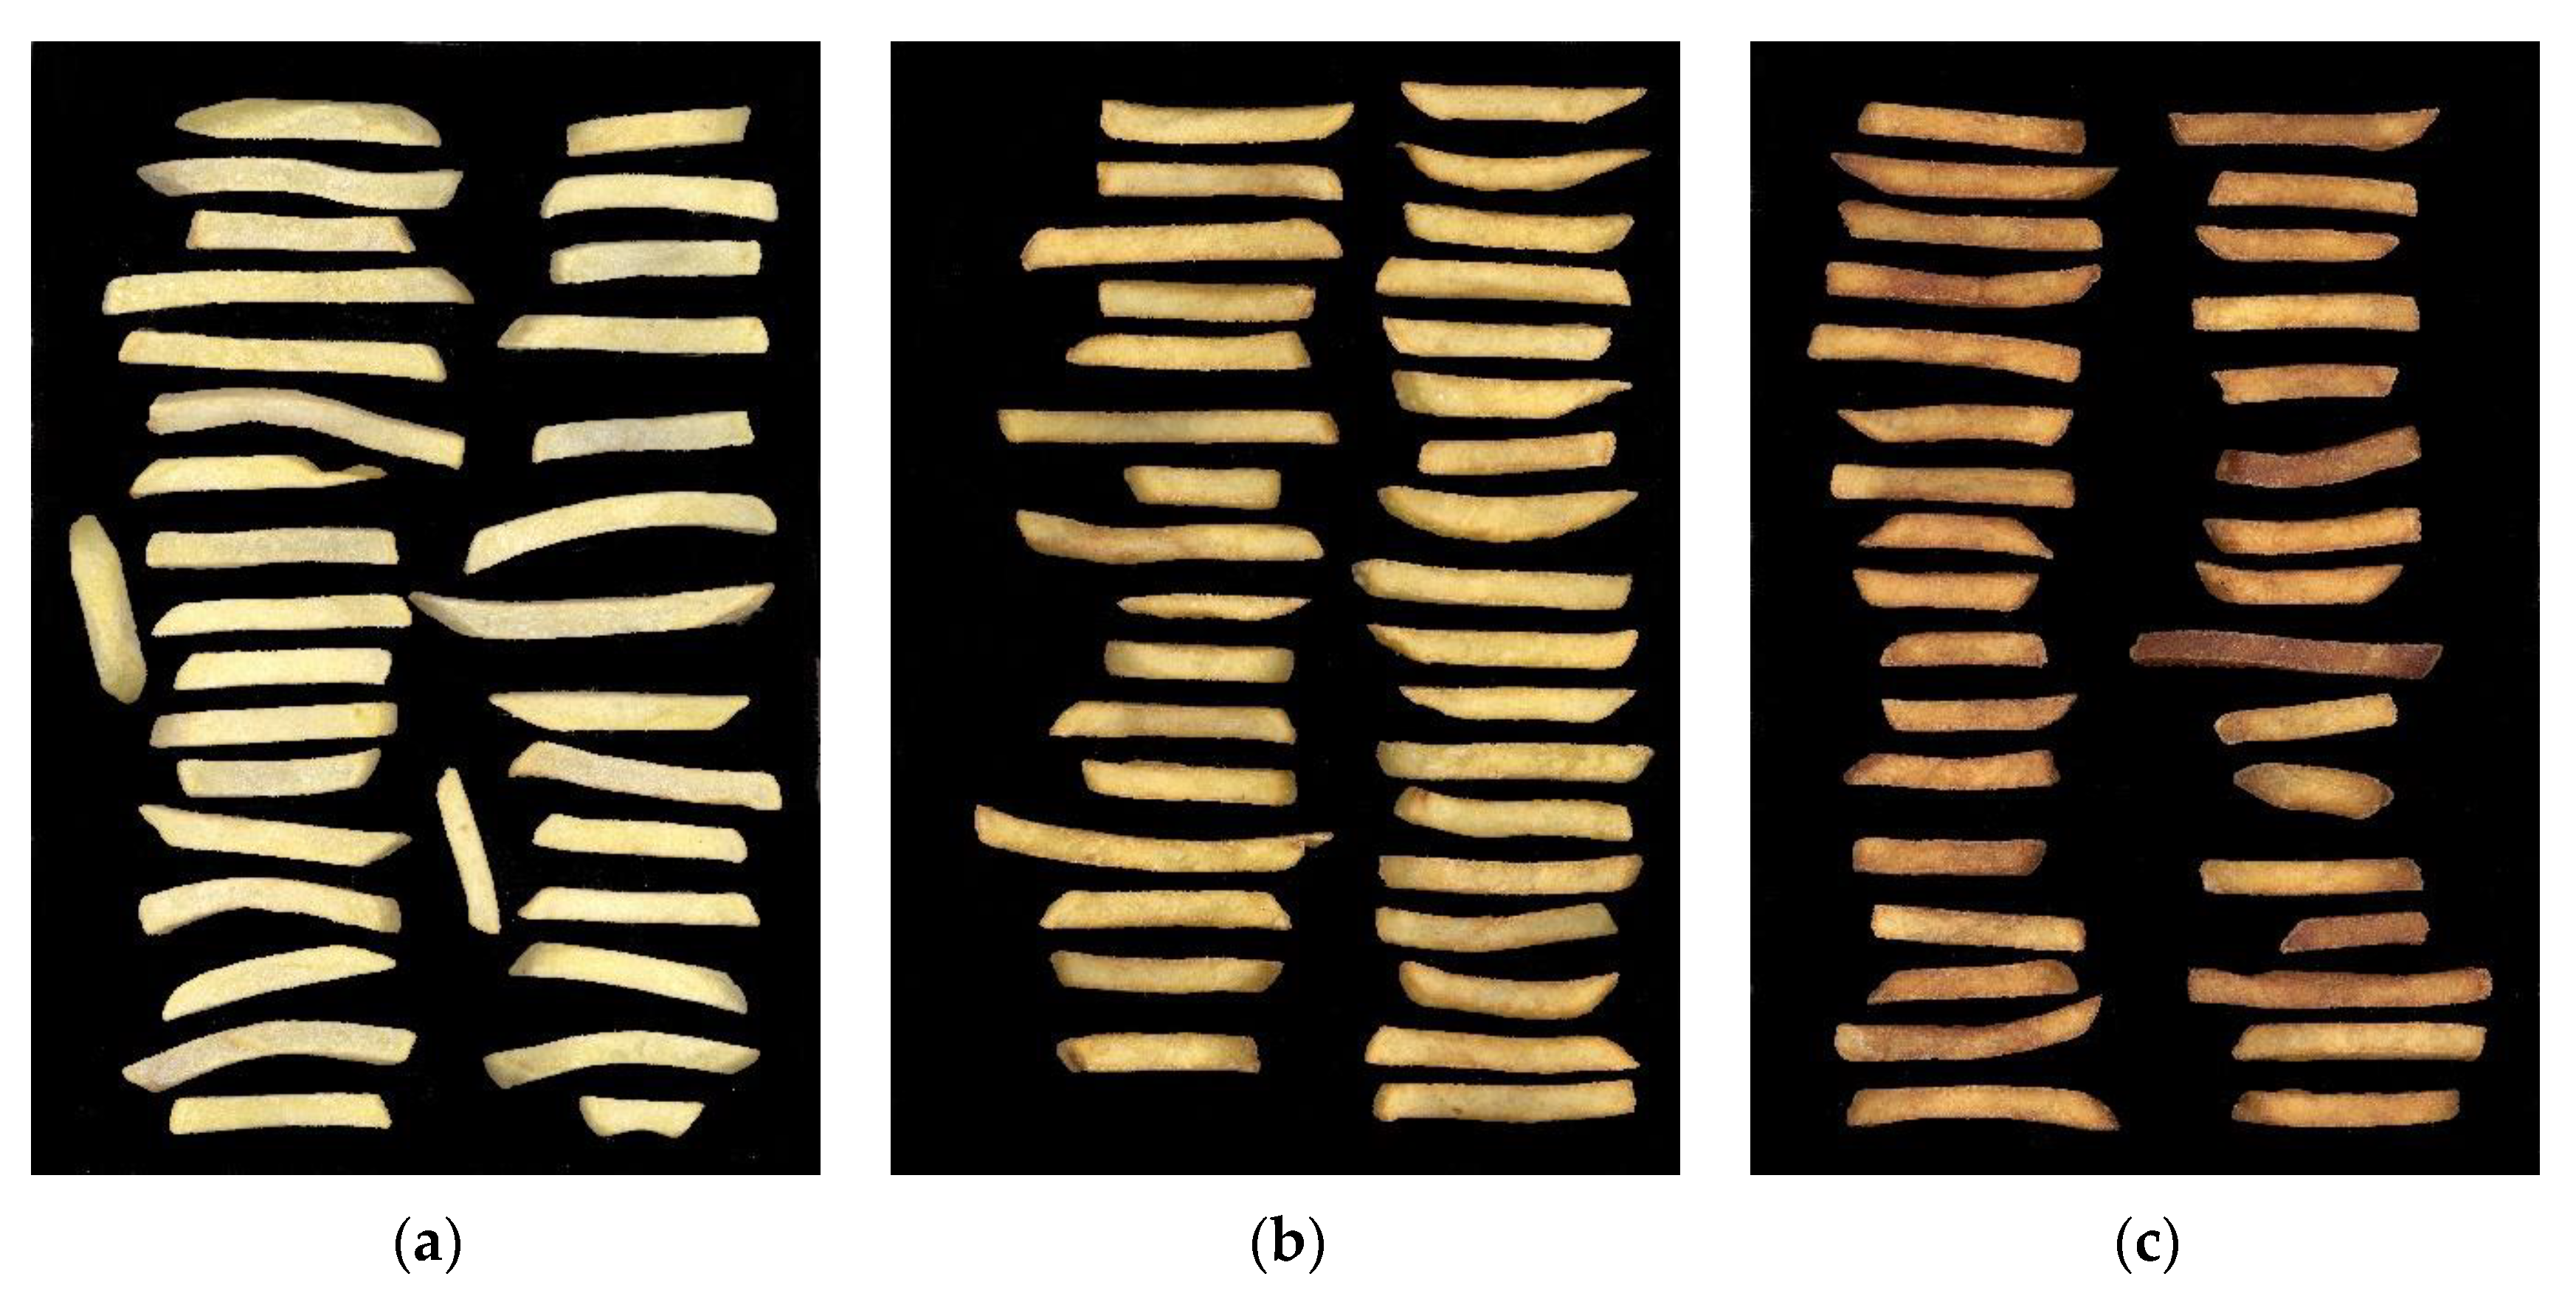
Images were collected and analysed by the HP ScanJet 4850 scanner (Hewlett Packard, Palo Alto, CA, USA) linked with a computer, which recorded the images on its disc for their further processing by ImageJ software. After each treatment, all the fries were placed on the scanner (Figure 2).
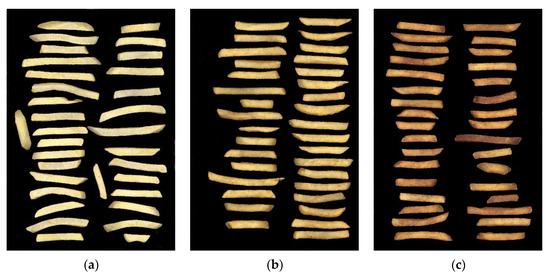
Figure 2.
Images of French fries taken by the HP ScanJet 4850 scanner: (a) 0 min (before frying); (b) fried for 5 min; (c) fried for 20 min.
2.4. Digital Image Analysis
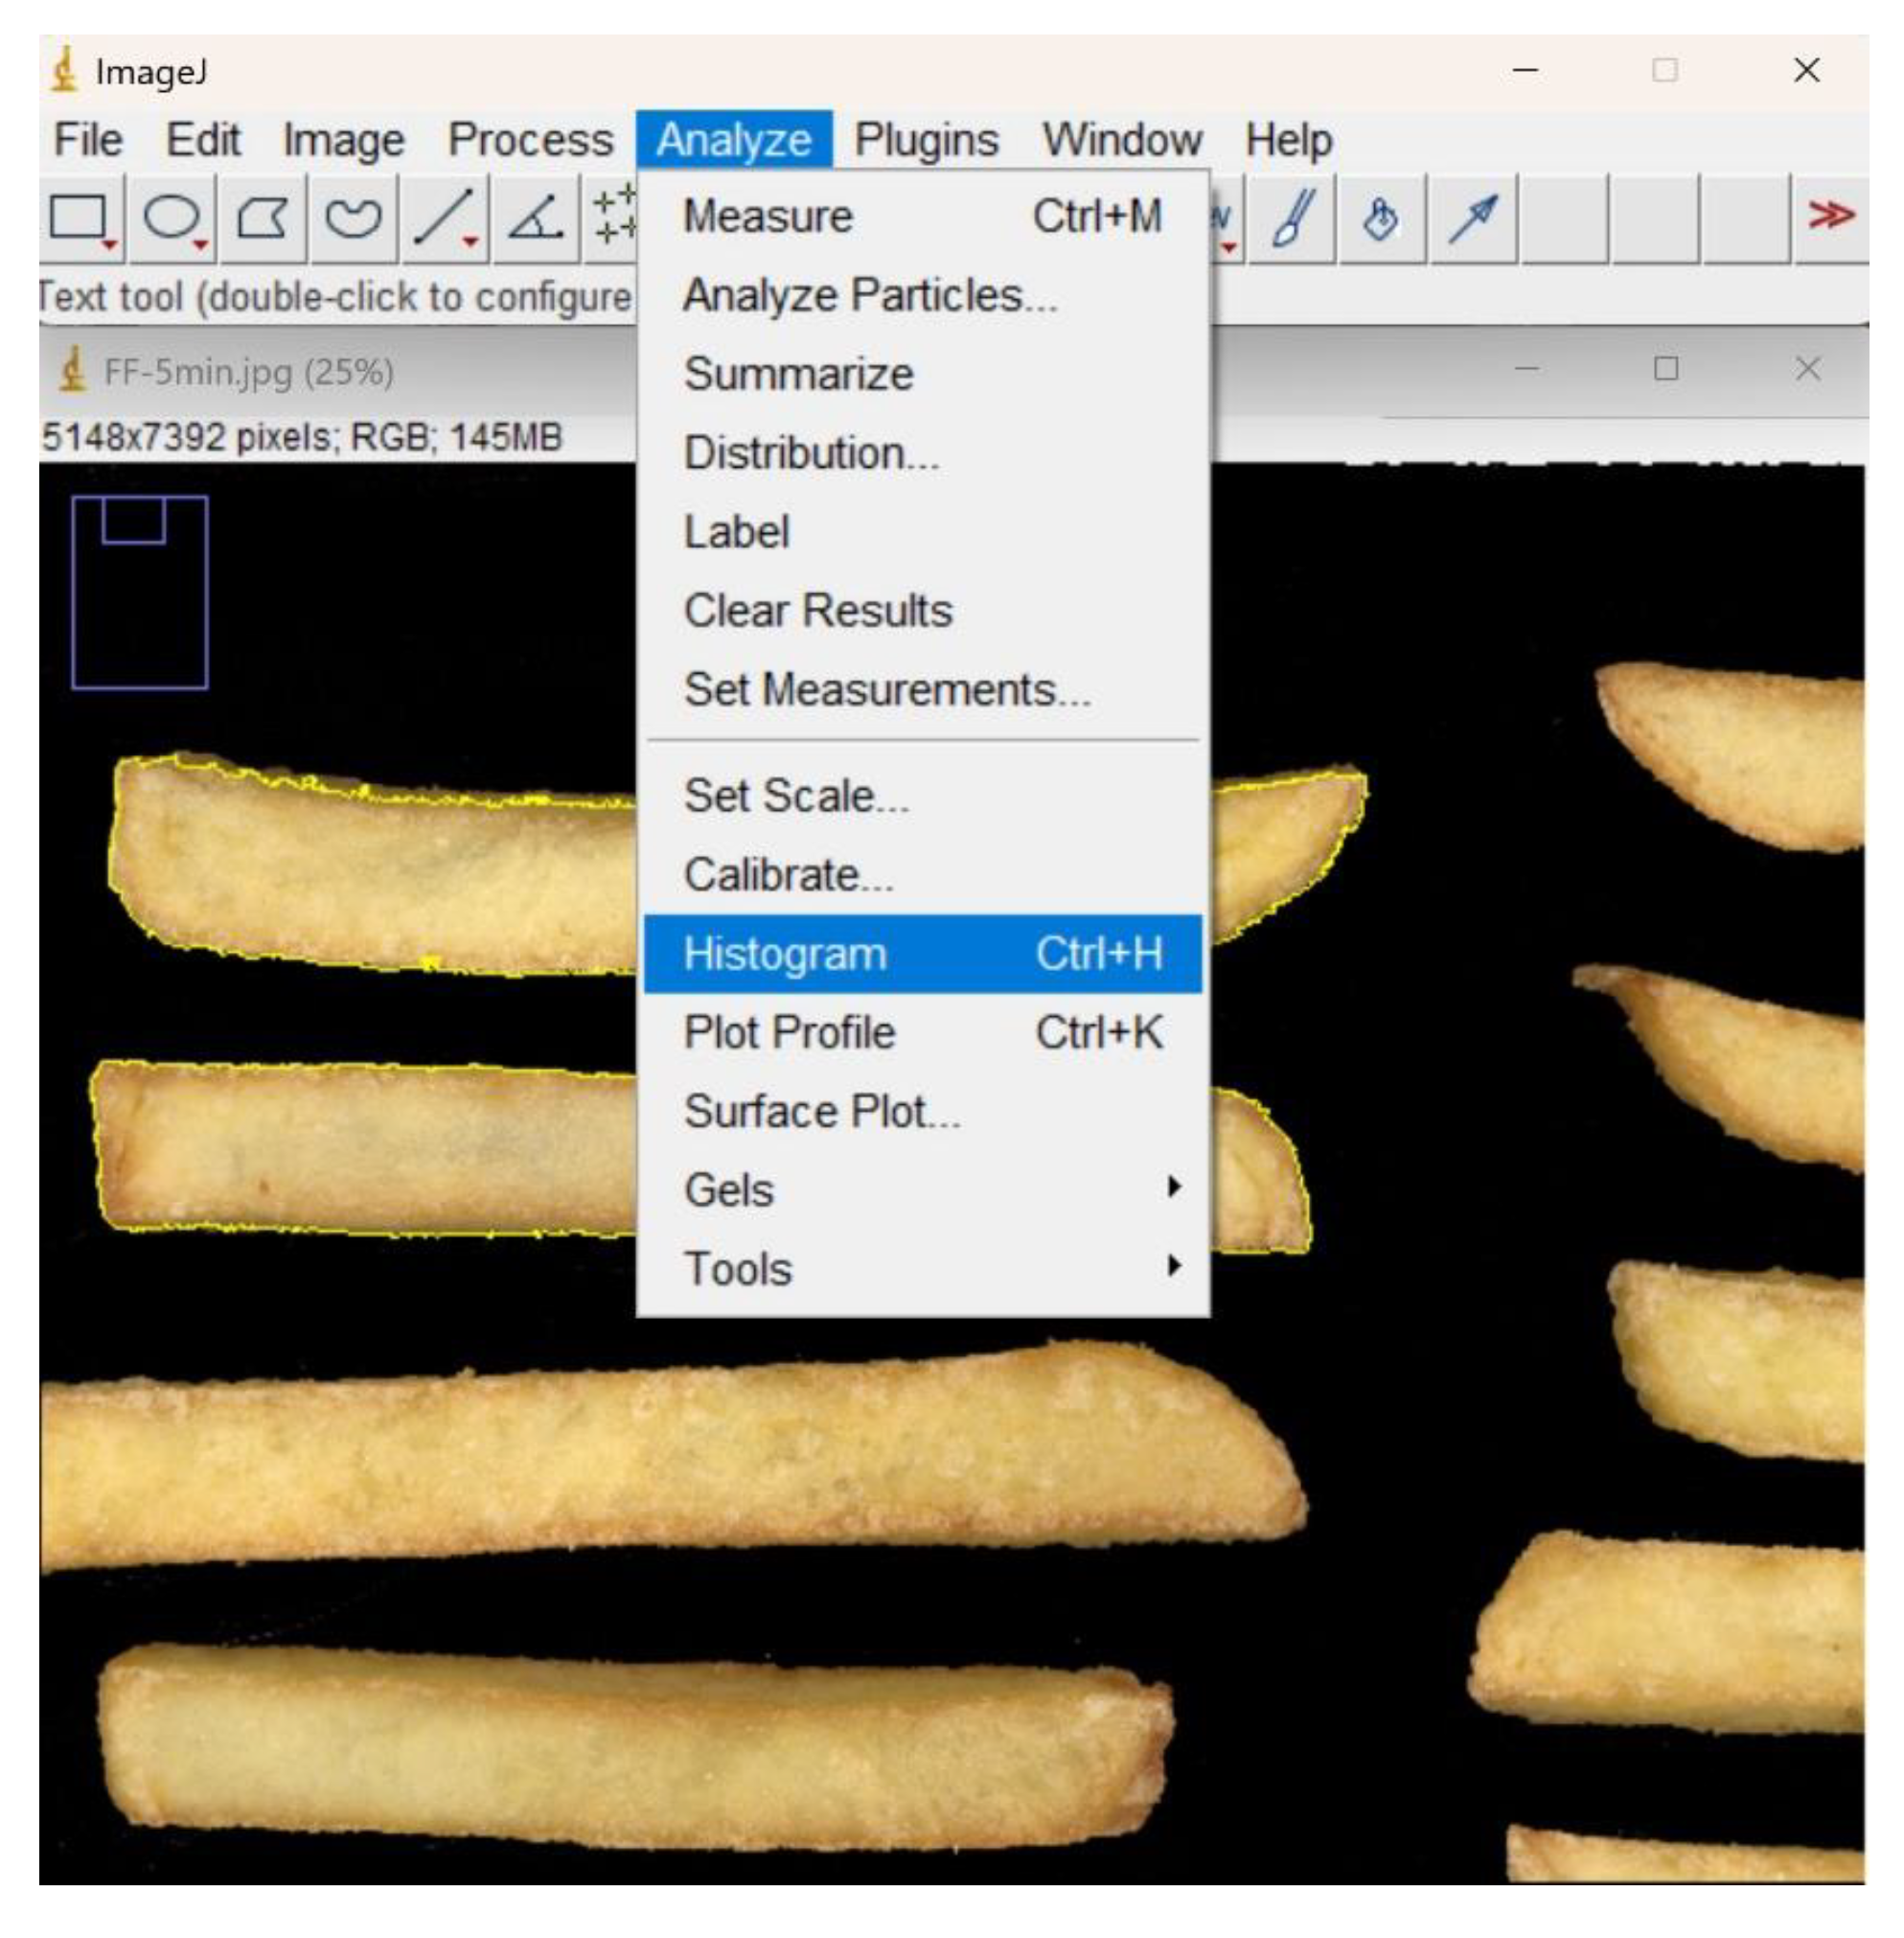
Each image of French fries was analysed using ImageJ software. After opening an image of the potato pieces from one treatment (for a given time), the contours of each piece were marked with the wand tool, so that the whole piece was within the yellow contour. Appropriate settings of the wand tool and the high contrast between the fries and the black background allowed the software to mark precisely the contour of each fry (Figure 3).
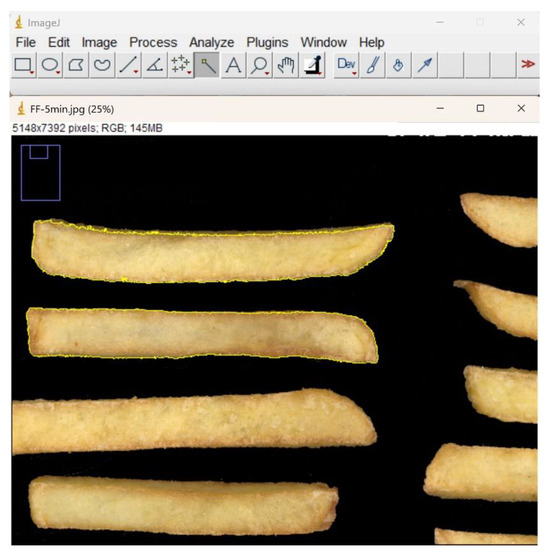
Figure 3.
ImageJ software with an open analysed image and the generated yellow contours of French fries.
Next, the option “Analyze->Histogram” was chosen from the menu (Figure 4).

Figure 4.
Choosing the option “Histogram” in ImageJ software.
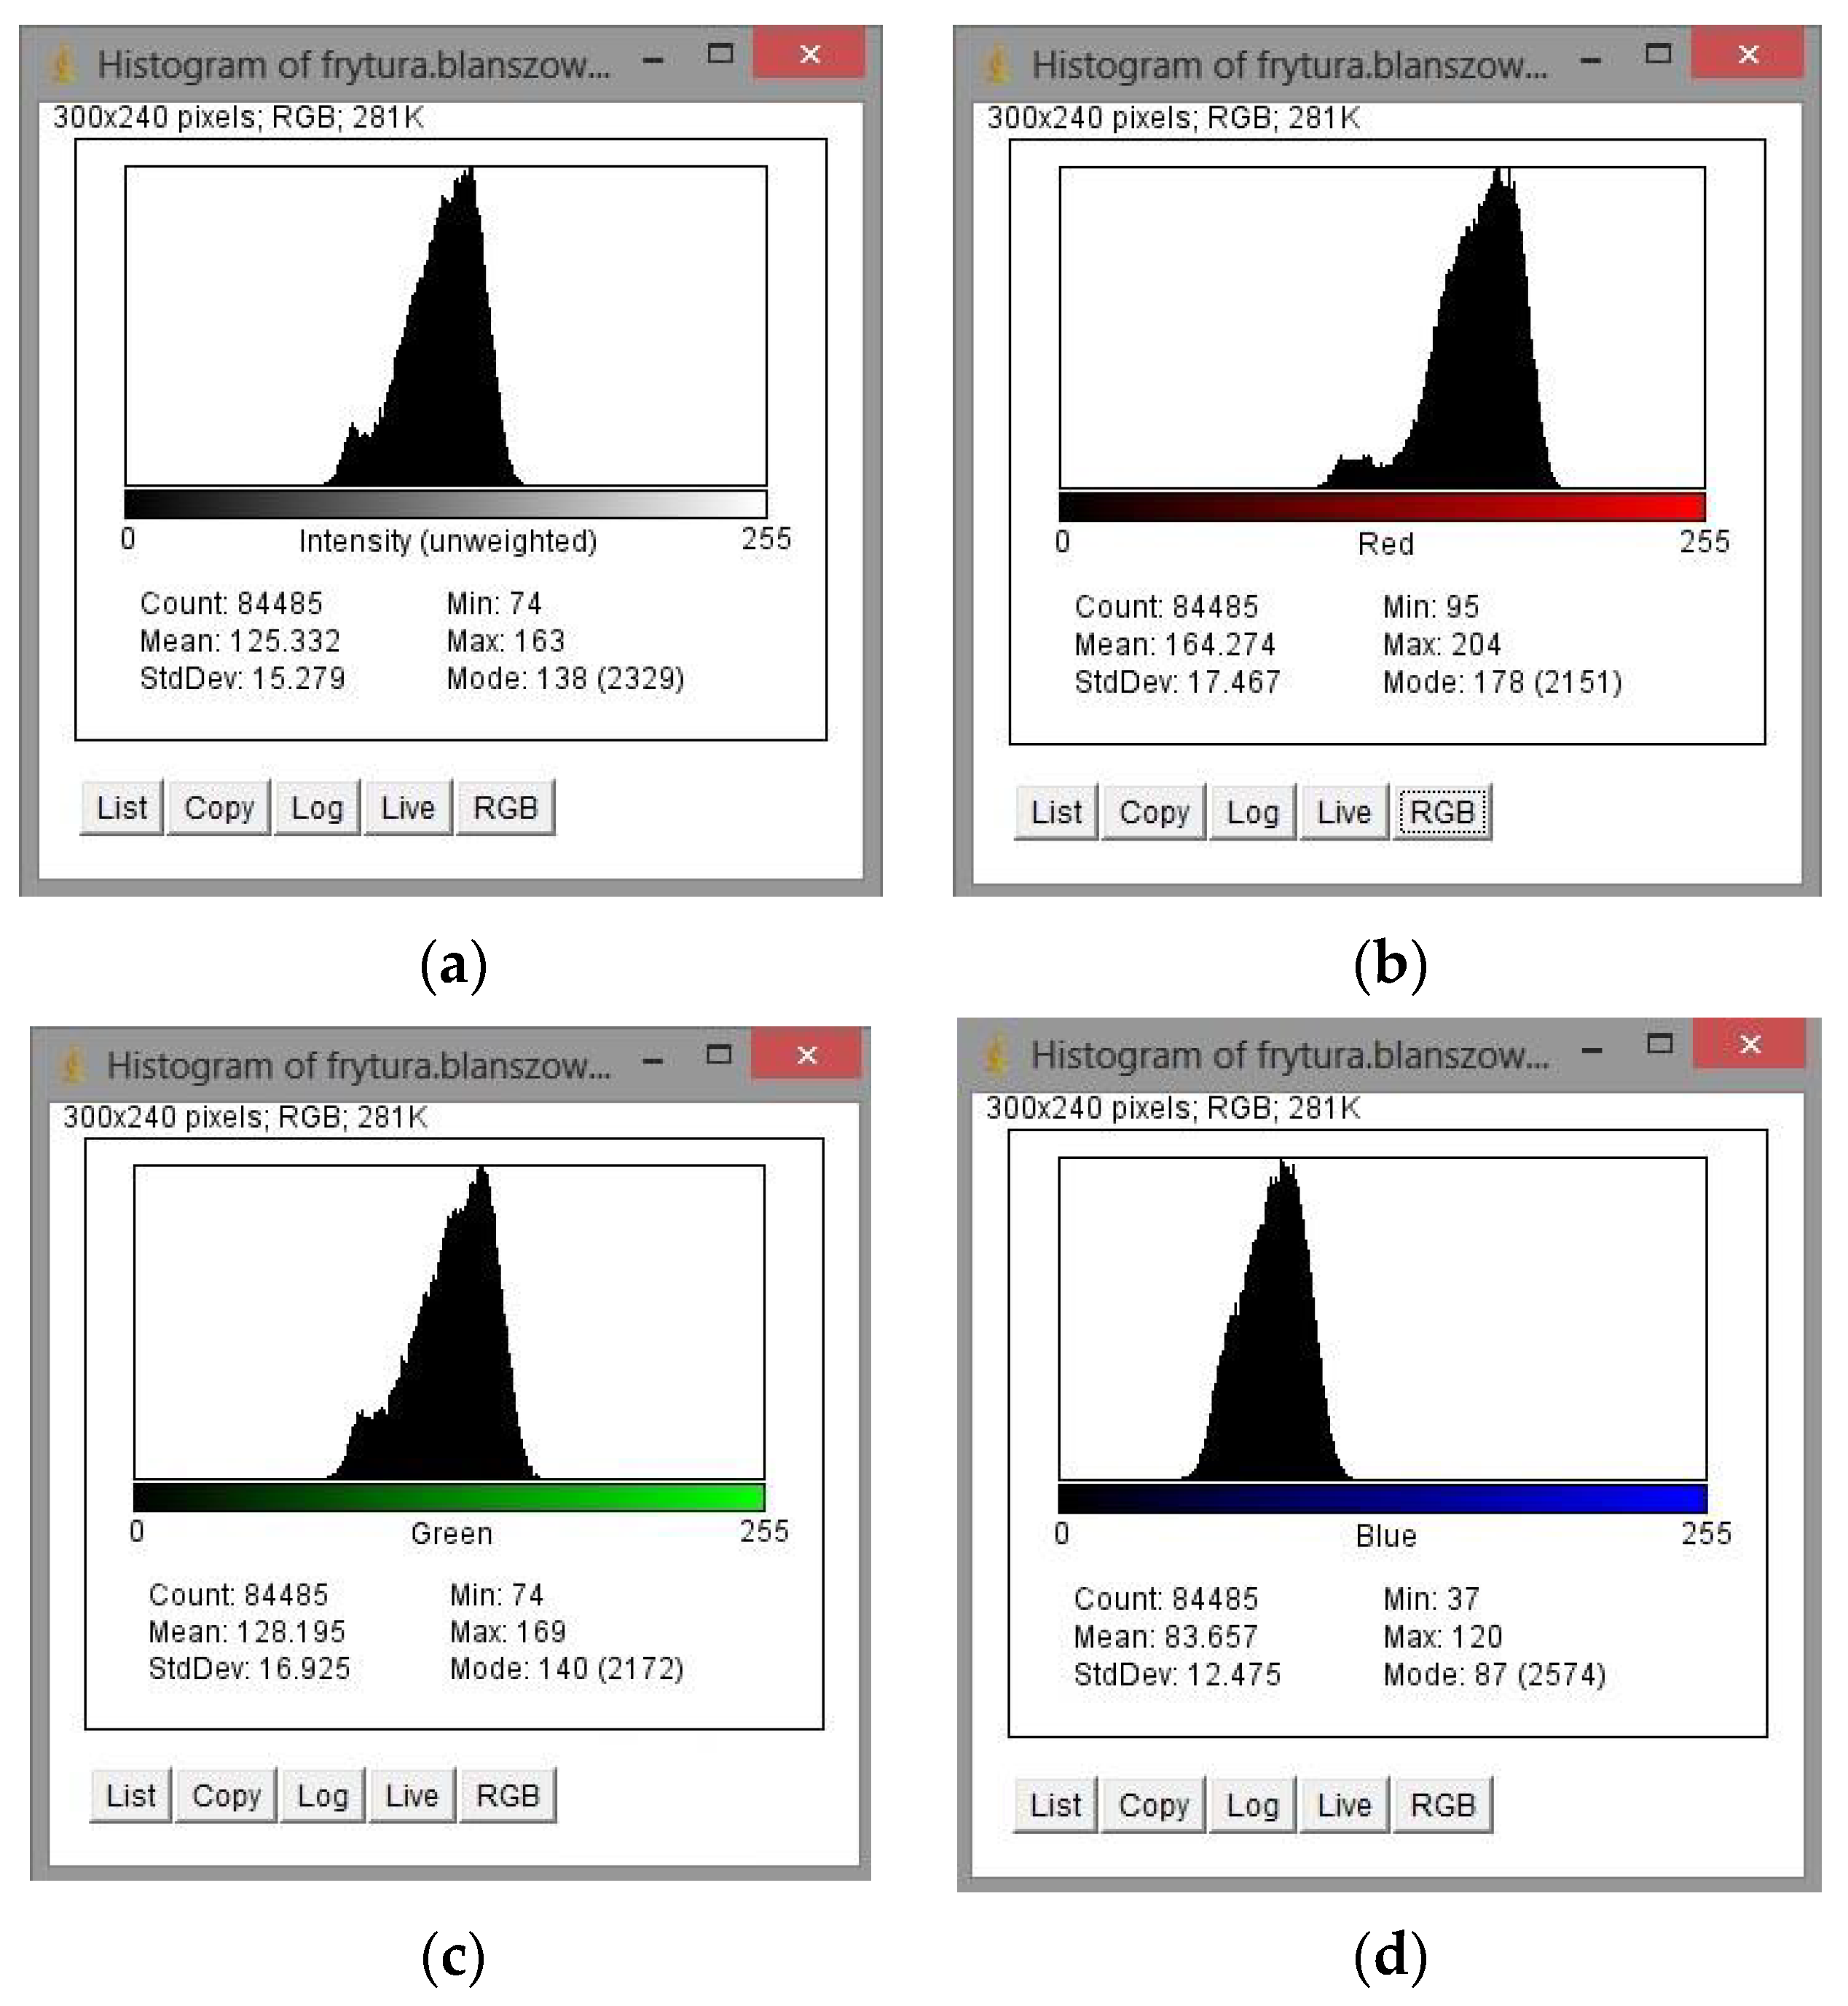
After clicking, a histogram of lightness appears. The X axis shows the possible values of lightness of a black-and-white image, while the Y axis shows the number of pixels with each lightness level. After clicking the option “RGB”, the corresponding values for red, green, and blue colours are read and recorded (Figure 5).
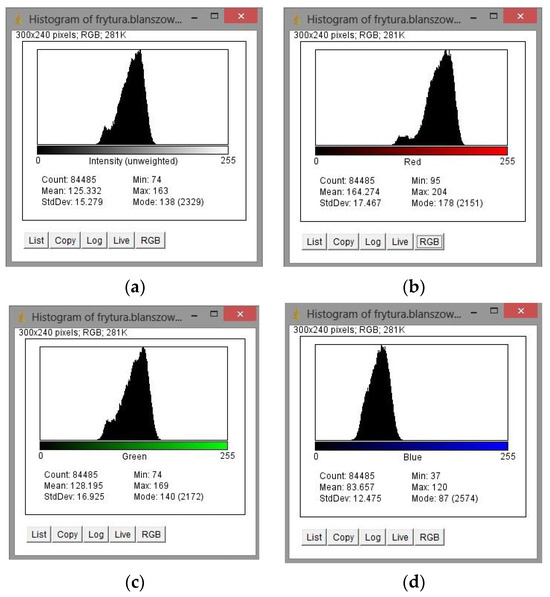
Figure 5.
Histograms of (a) lightness; and primary colours: (b) red; (c) green; (d) blue; generated by ImageJ software.
3. Results and Discussion
3.1. Measurements Taken with the Minolta C-5 Spectrophotometer (Konica Minolta Sensing Europe B.V., Nieuwegein, The Netherlands)
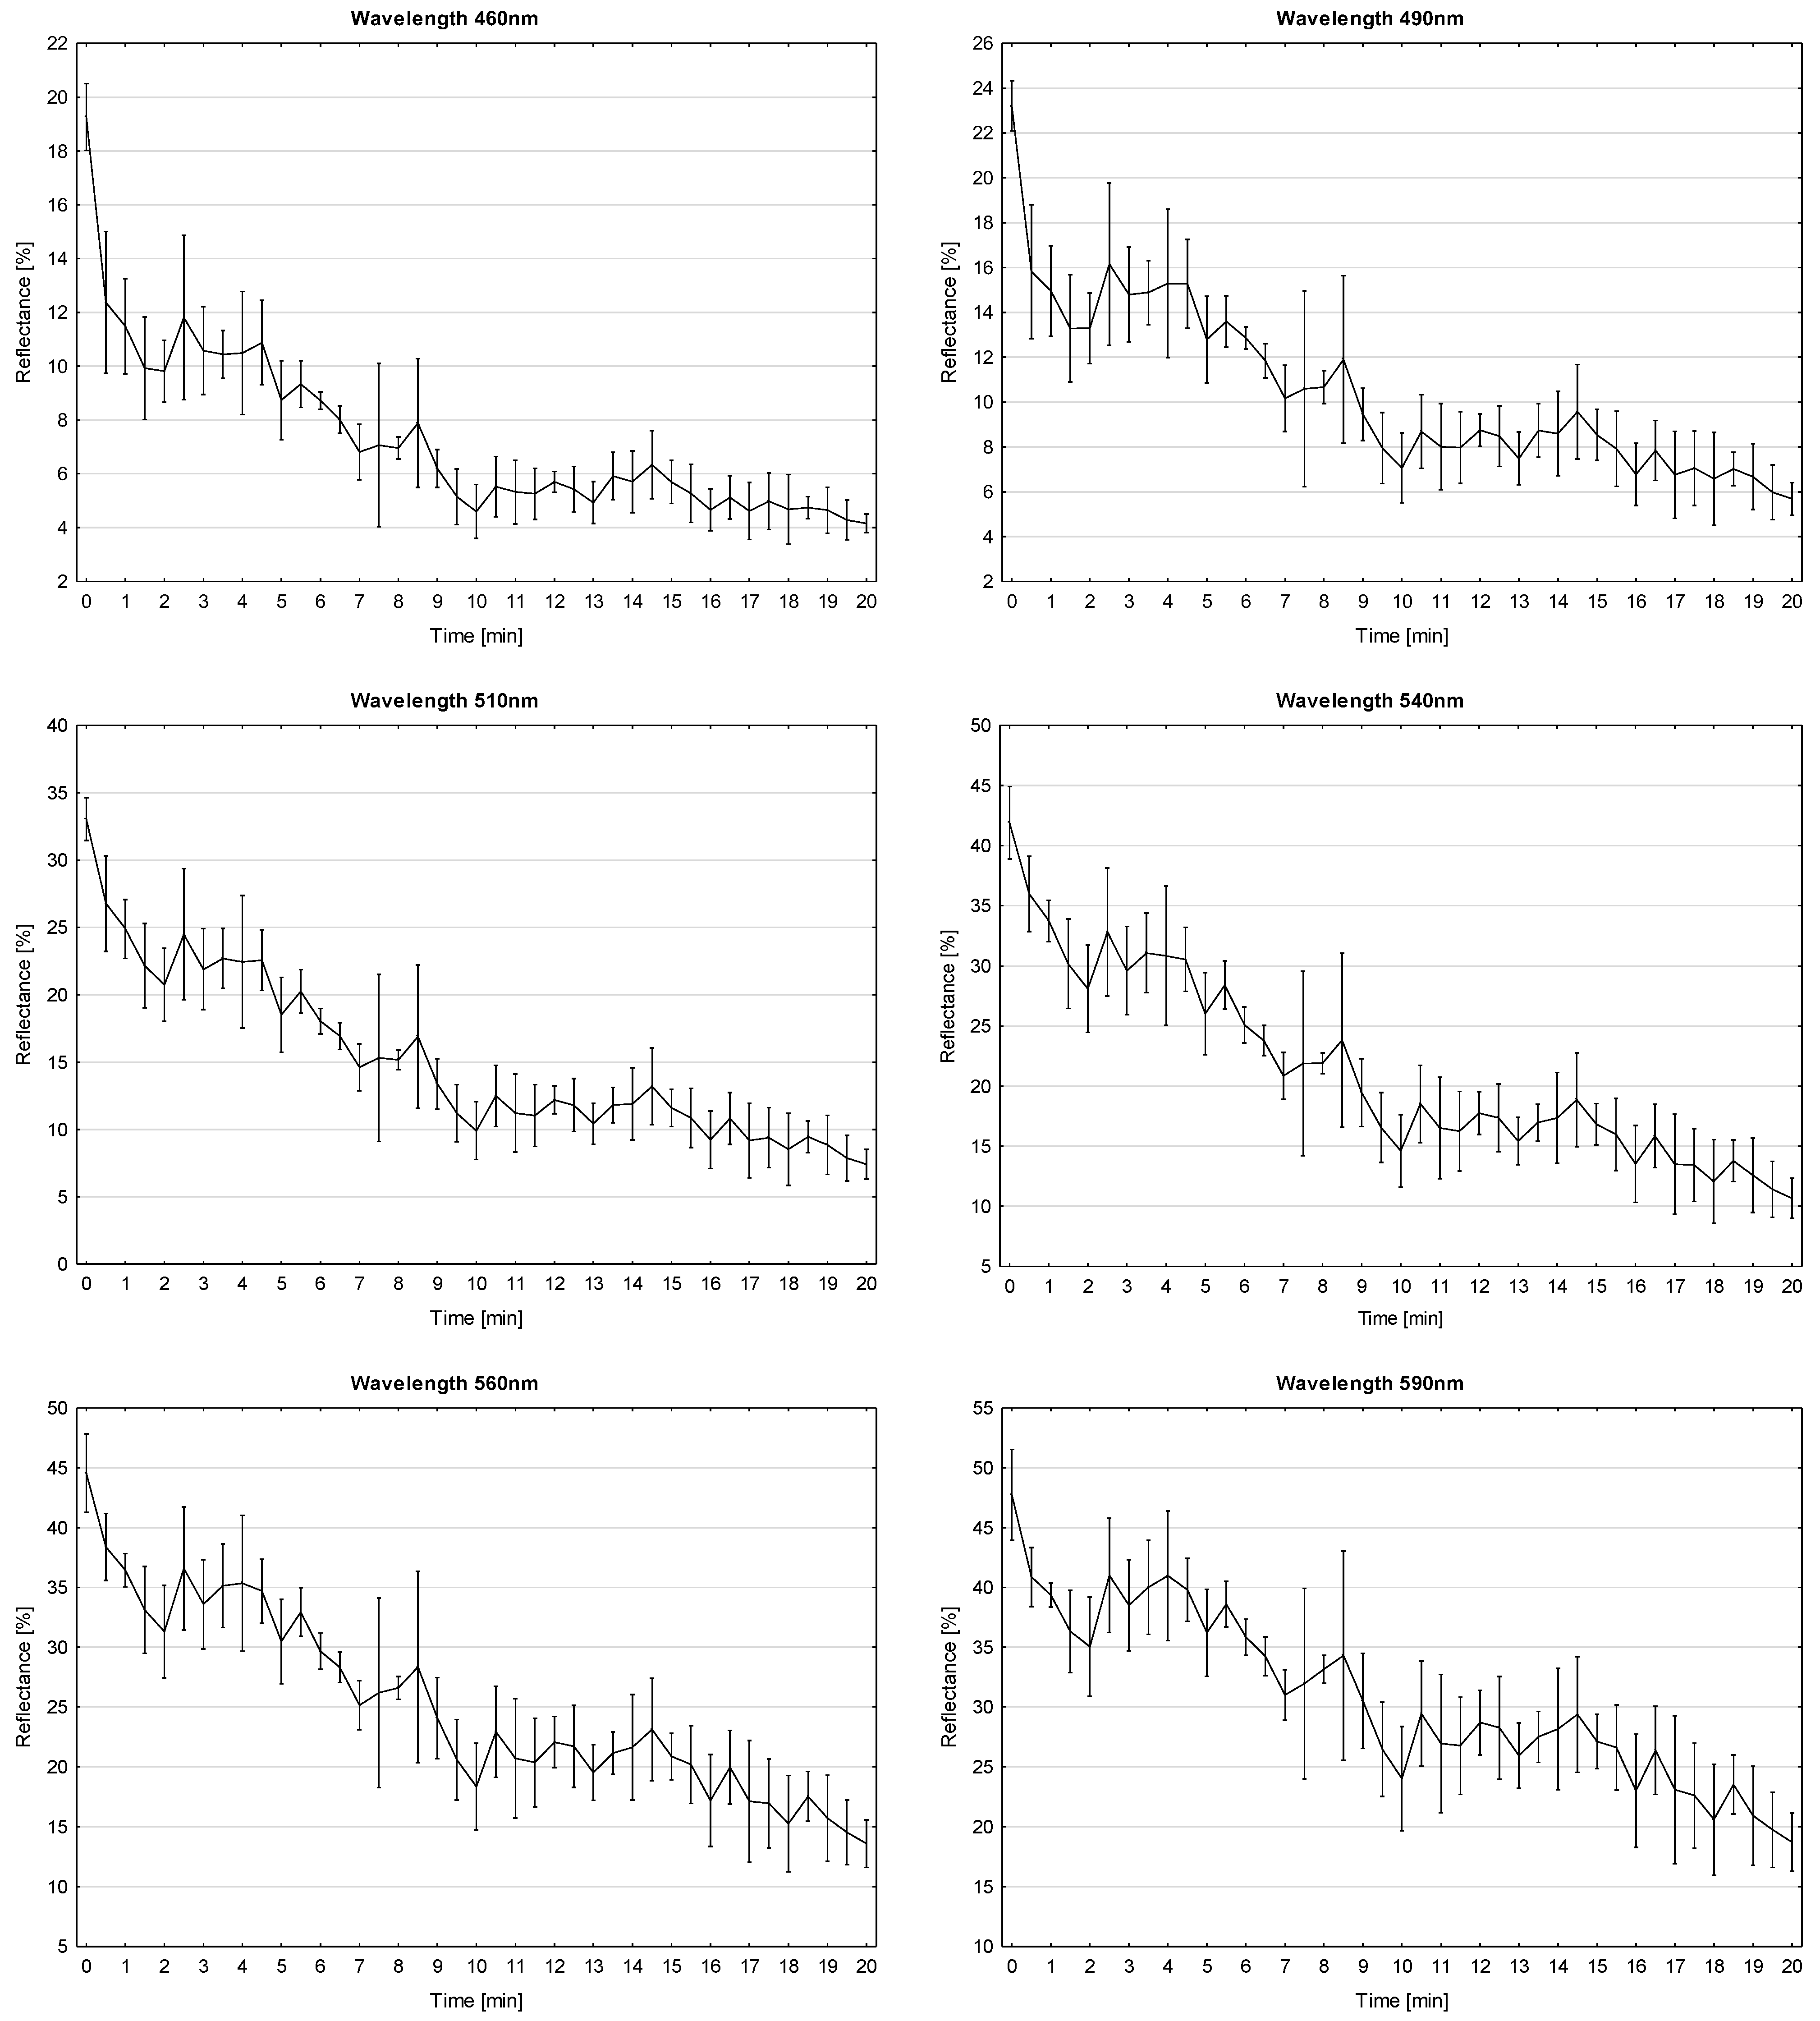
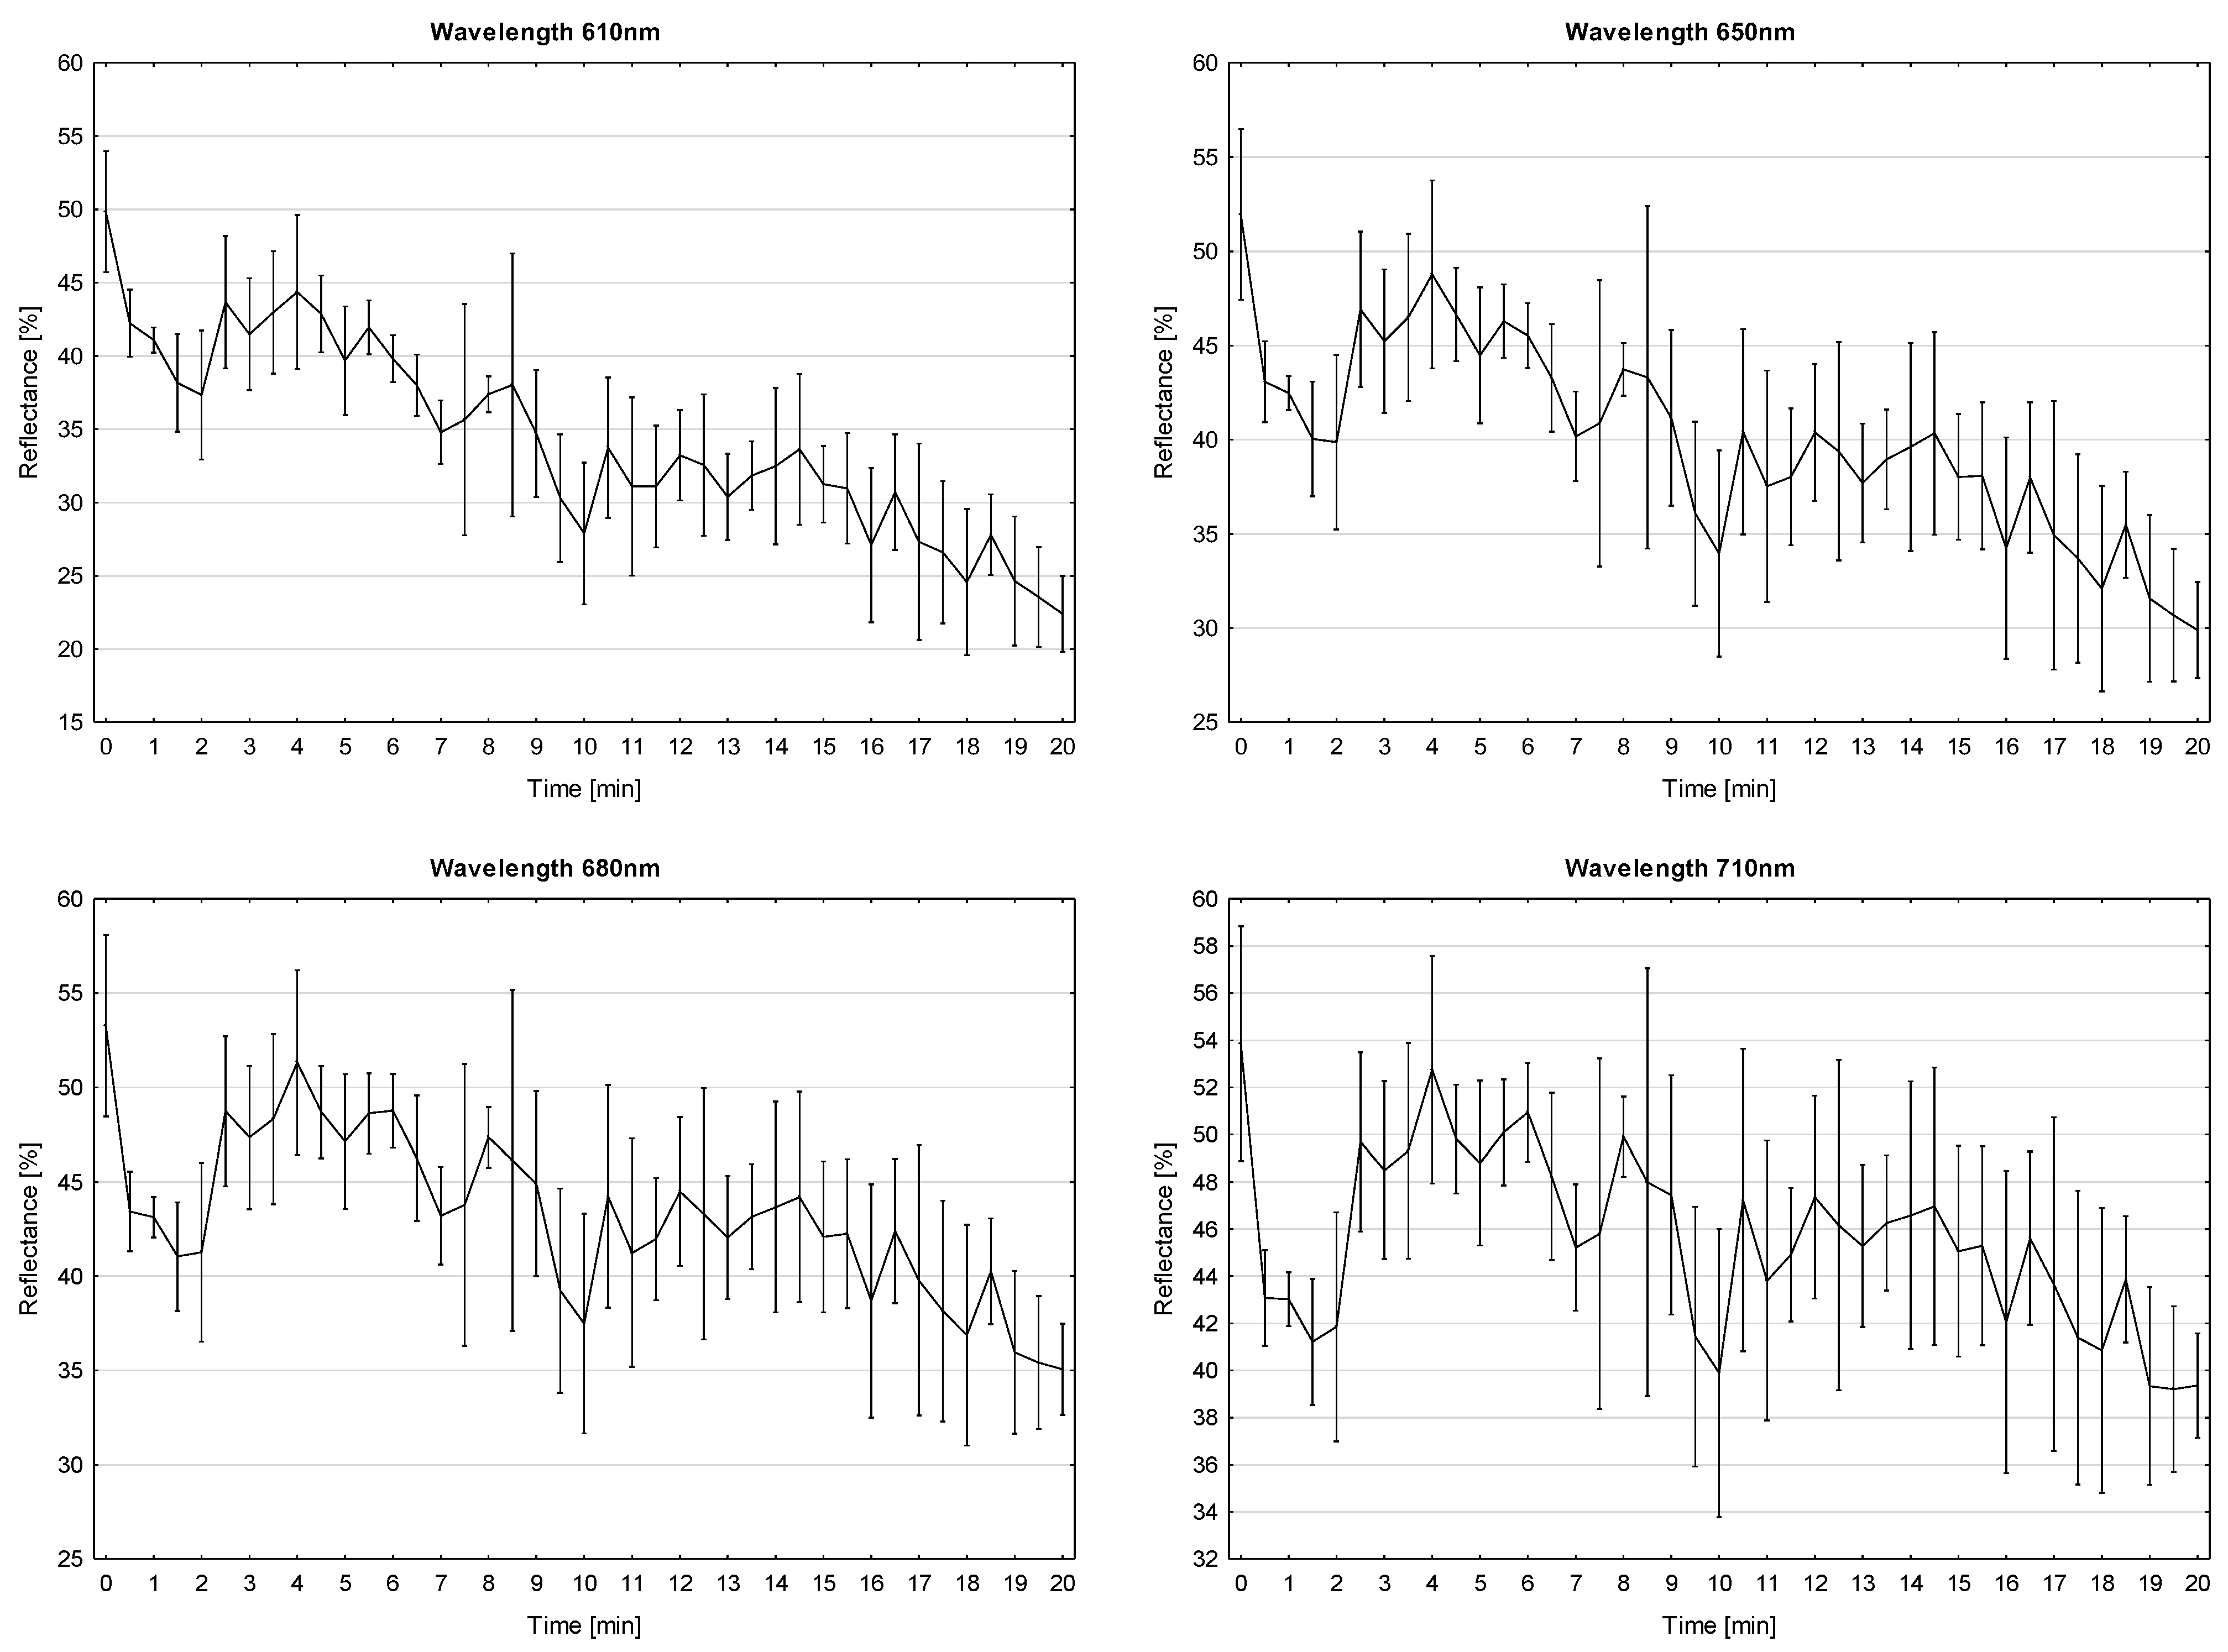
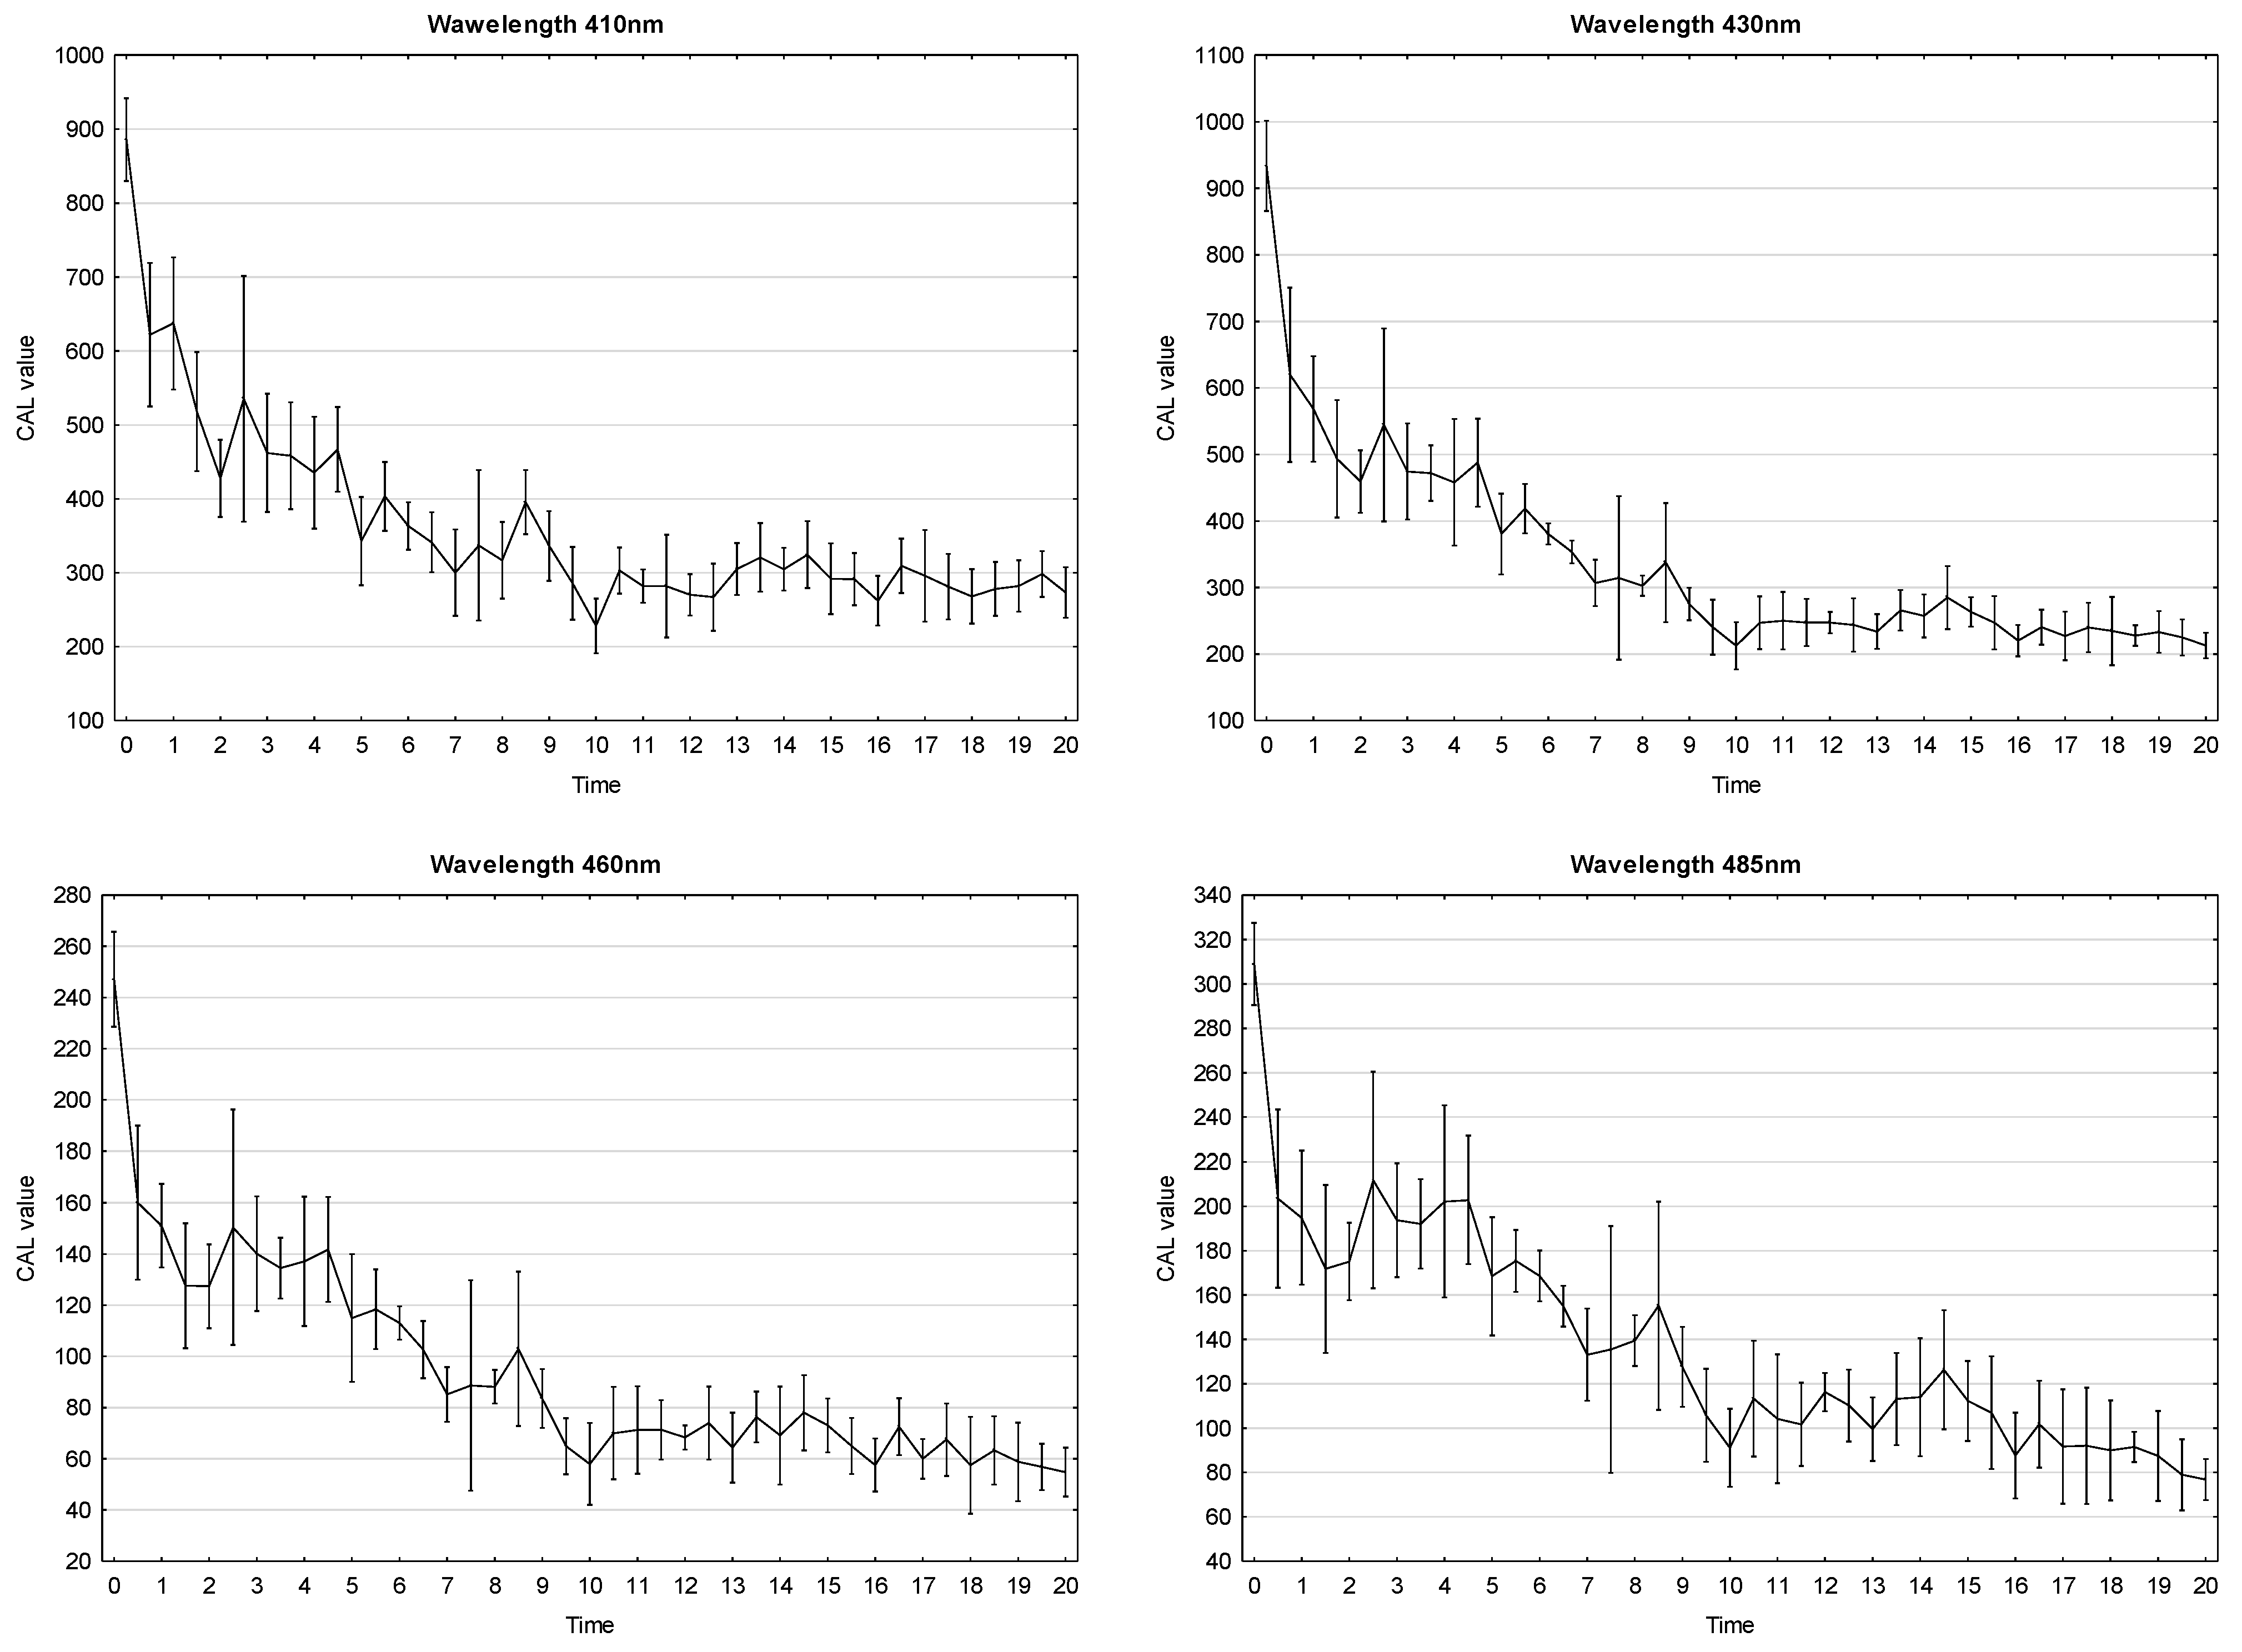
We compared the results of measurements of colour taken with Minolta C-5 for 12 wavelengths (Figure 6). This equipment performs a spectral analysis for wavelengths from 360 nm to 740 nm, in 10 nm steps. The graphs present reflectance values for very close or the same wavelengths as those used in the SparkFun spectrophotometer, depending on the time of frying the potato pieces.
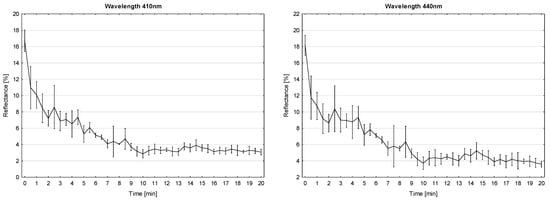
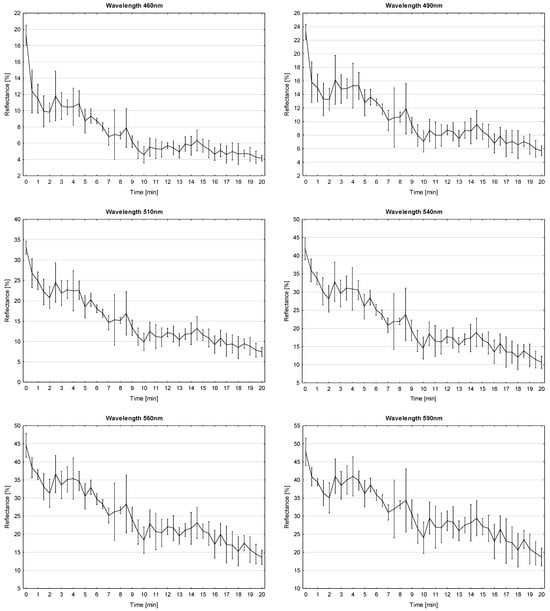
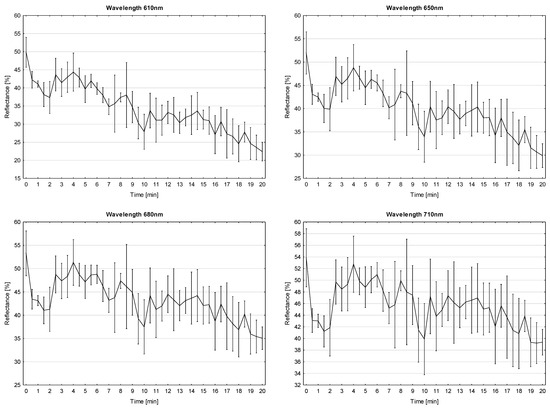
Figure 6.
Influence of the time of frying the potato pieces on reflectance for various wavelengths (measurements taken with the Minolta C-5 spectrophotometer). Error bars denote standard deviations.
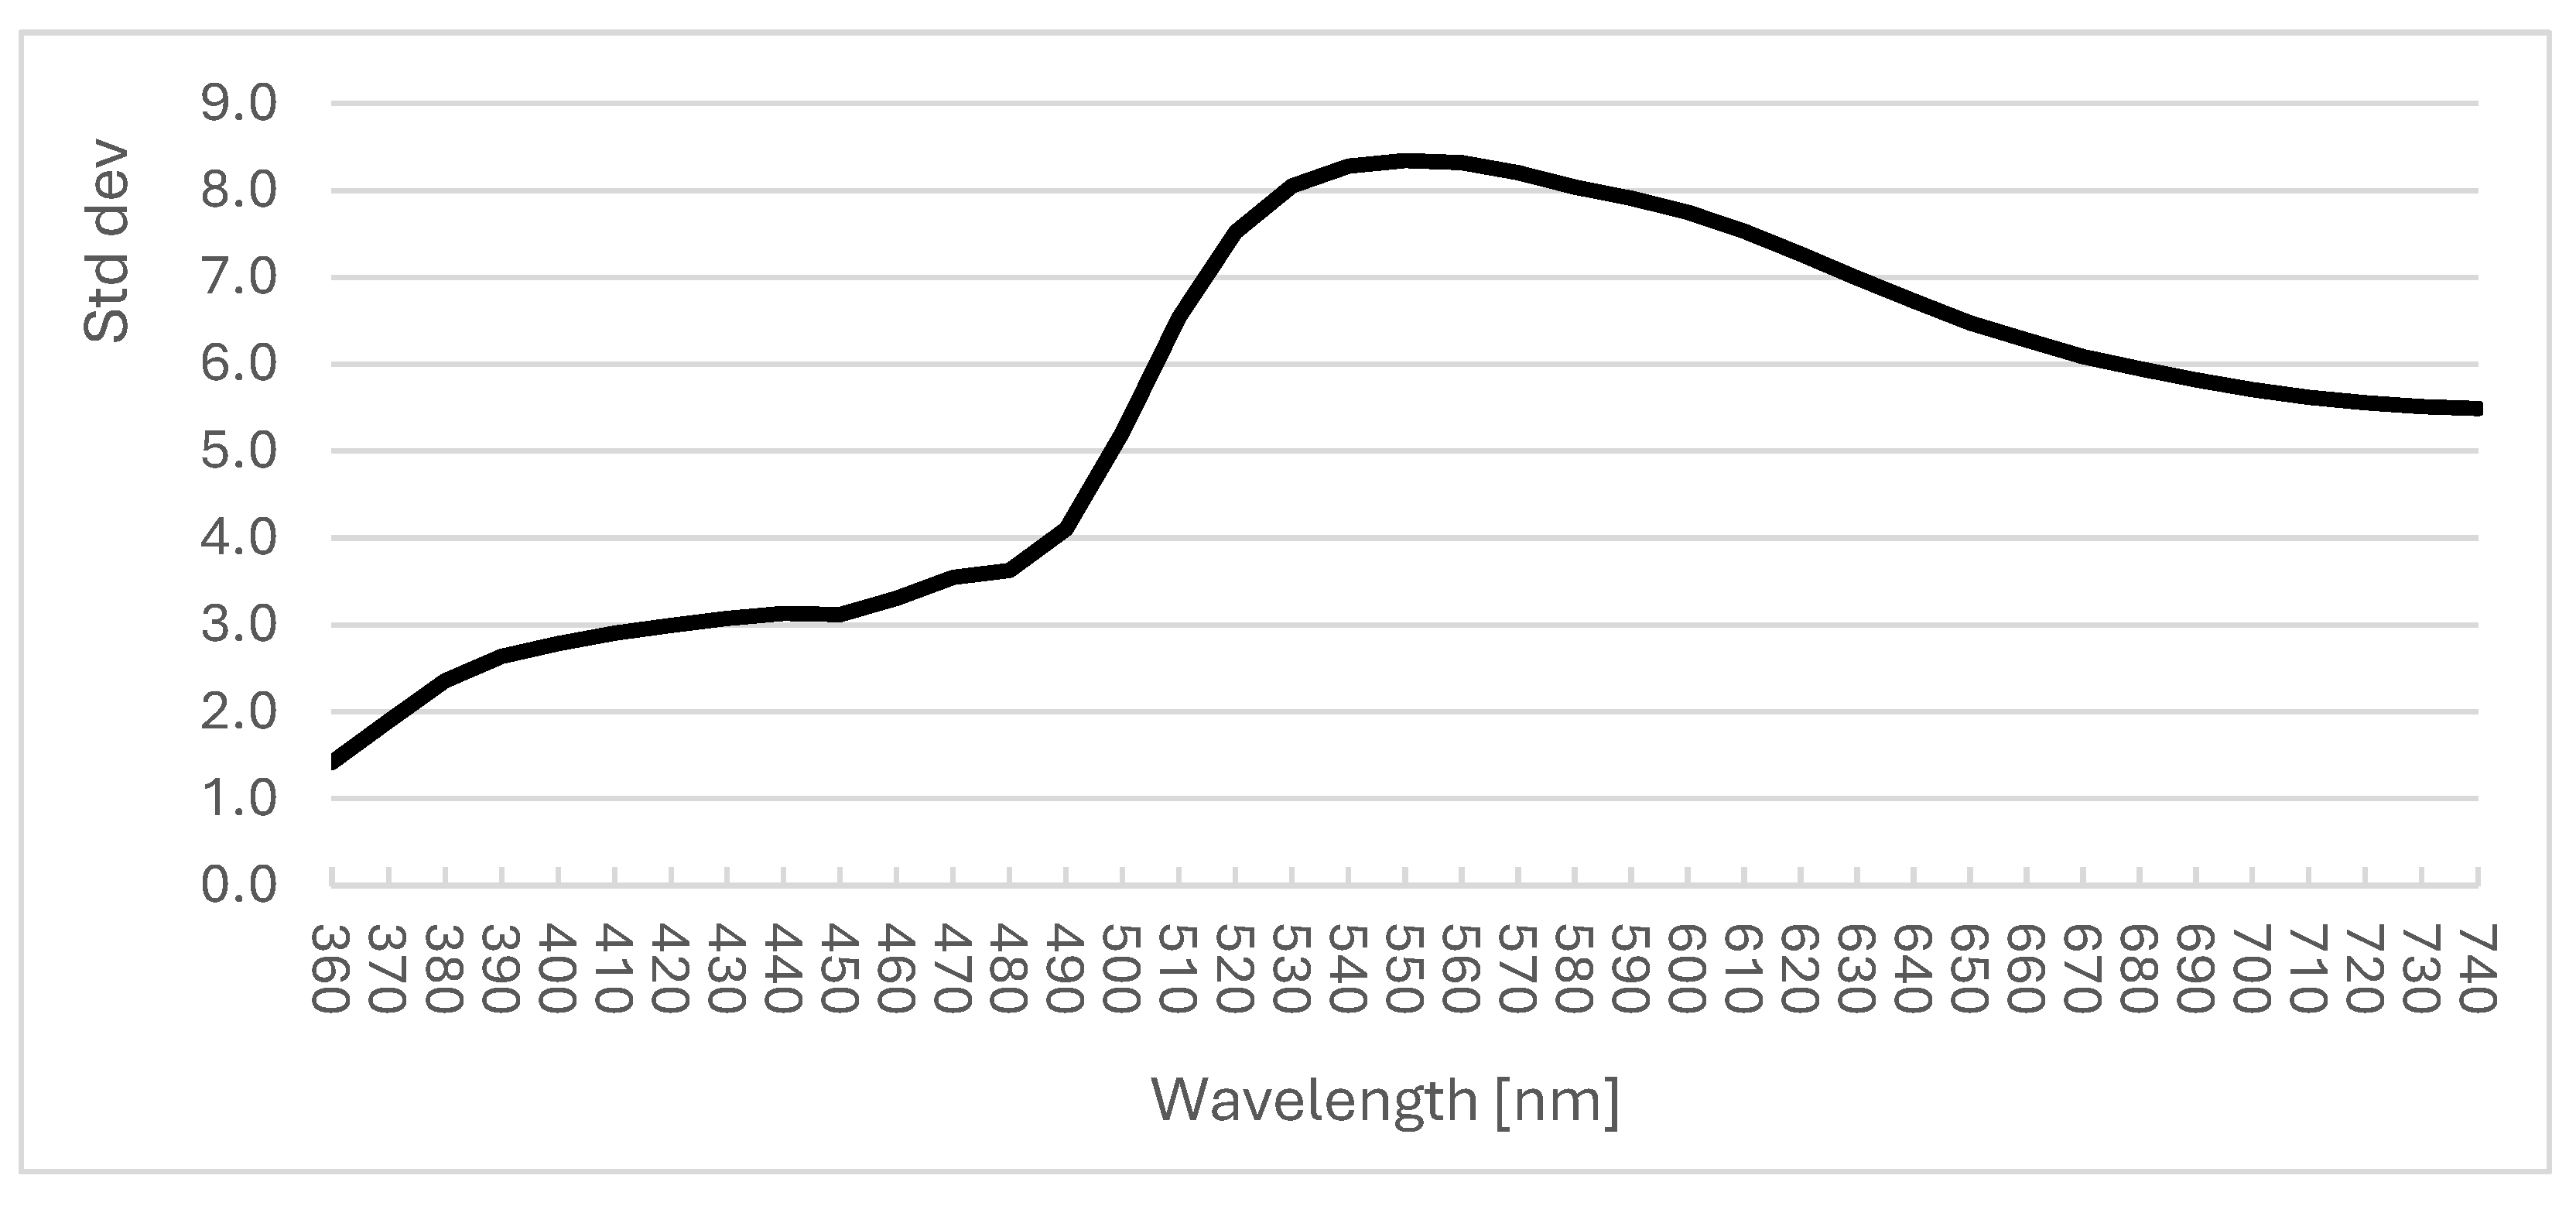
The analysis shows that for violet, blue, and green (wavelength values between 410 nm and 510 nm), the values of reflectance were low, starting from about 20% after no treatment and declining to about 4% during frying. When the colour was closer to yellow and red during frying, reflectance values fluctuated, from 55% to 20–30%. The standard deviation of reflectance varied depending on wavelength (Figure 7).
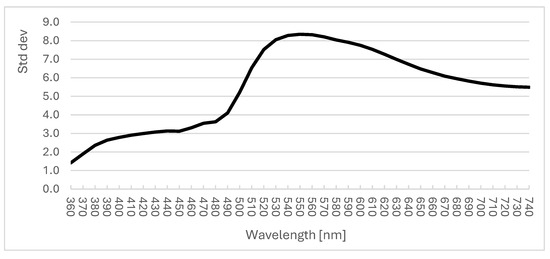
Figure 7.
Changes in standard deviation of reflectance measurements depending on wavelength in the Minolta C-5 spectrophotometer (mean values of standard deviations of measurements during frying from 0 to 20 min).
The calculated standard deviations result from the varying rate of changes in colour of the fried potato pieces in various periods, depending on their size and shape. They also indicate a high repeatability of measurement results. The highest standard deviations were recorded at wavelengths of 540–550 nm, which correspond to green colour, but relatively high values were also observed at larger wavelengths. However, in the latter case, values of reflectance were relatively high (yellow and red colour) and ranged from 50% to 25% during frying.
3.2. Measurements Taken with the SparkFun SEN-15050 Spectrophotometer (SparkFun Electronics, Niwot, CO, USA)
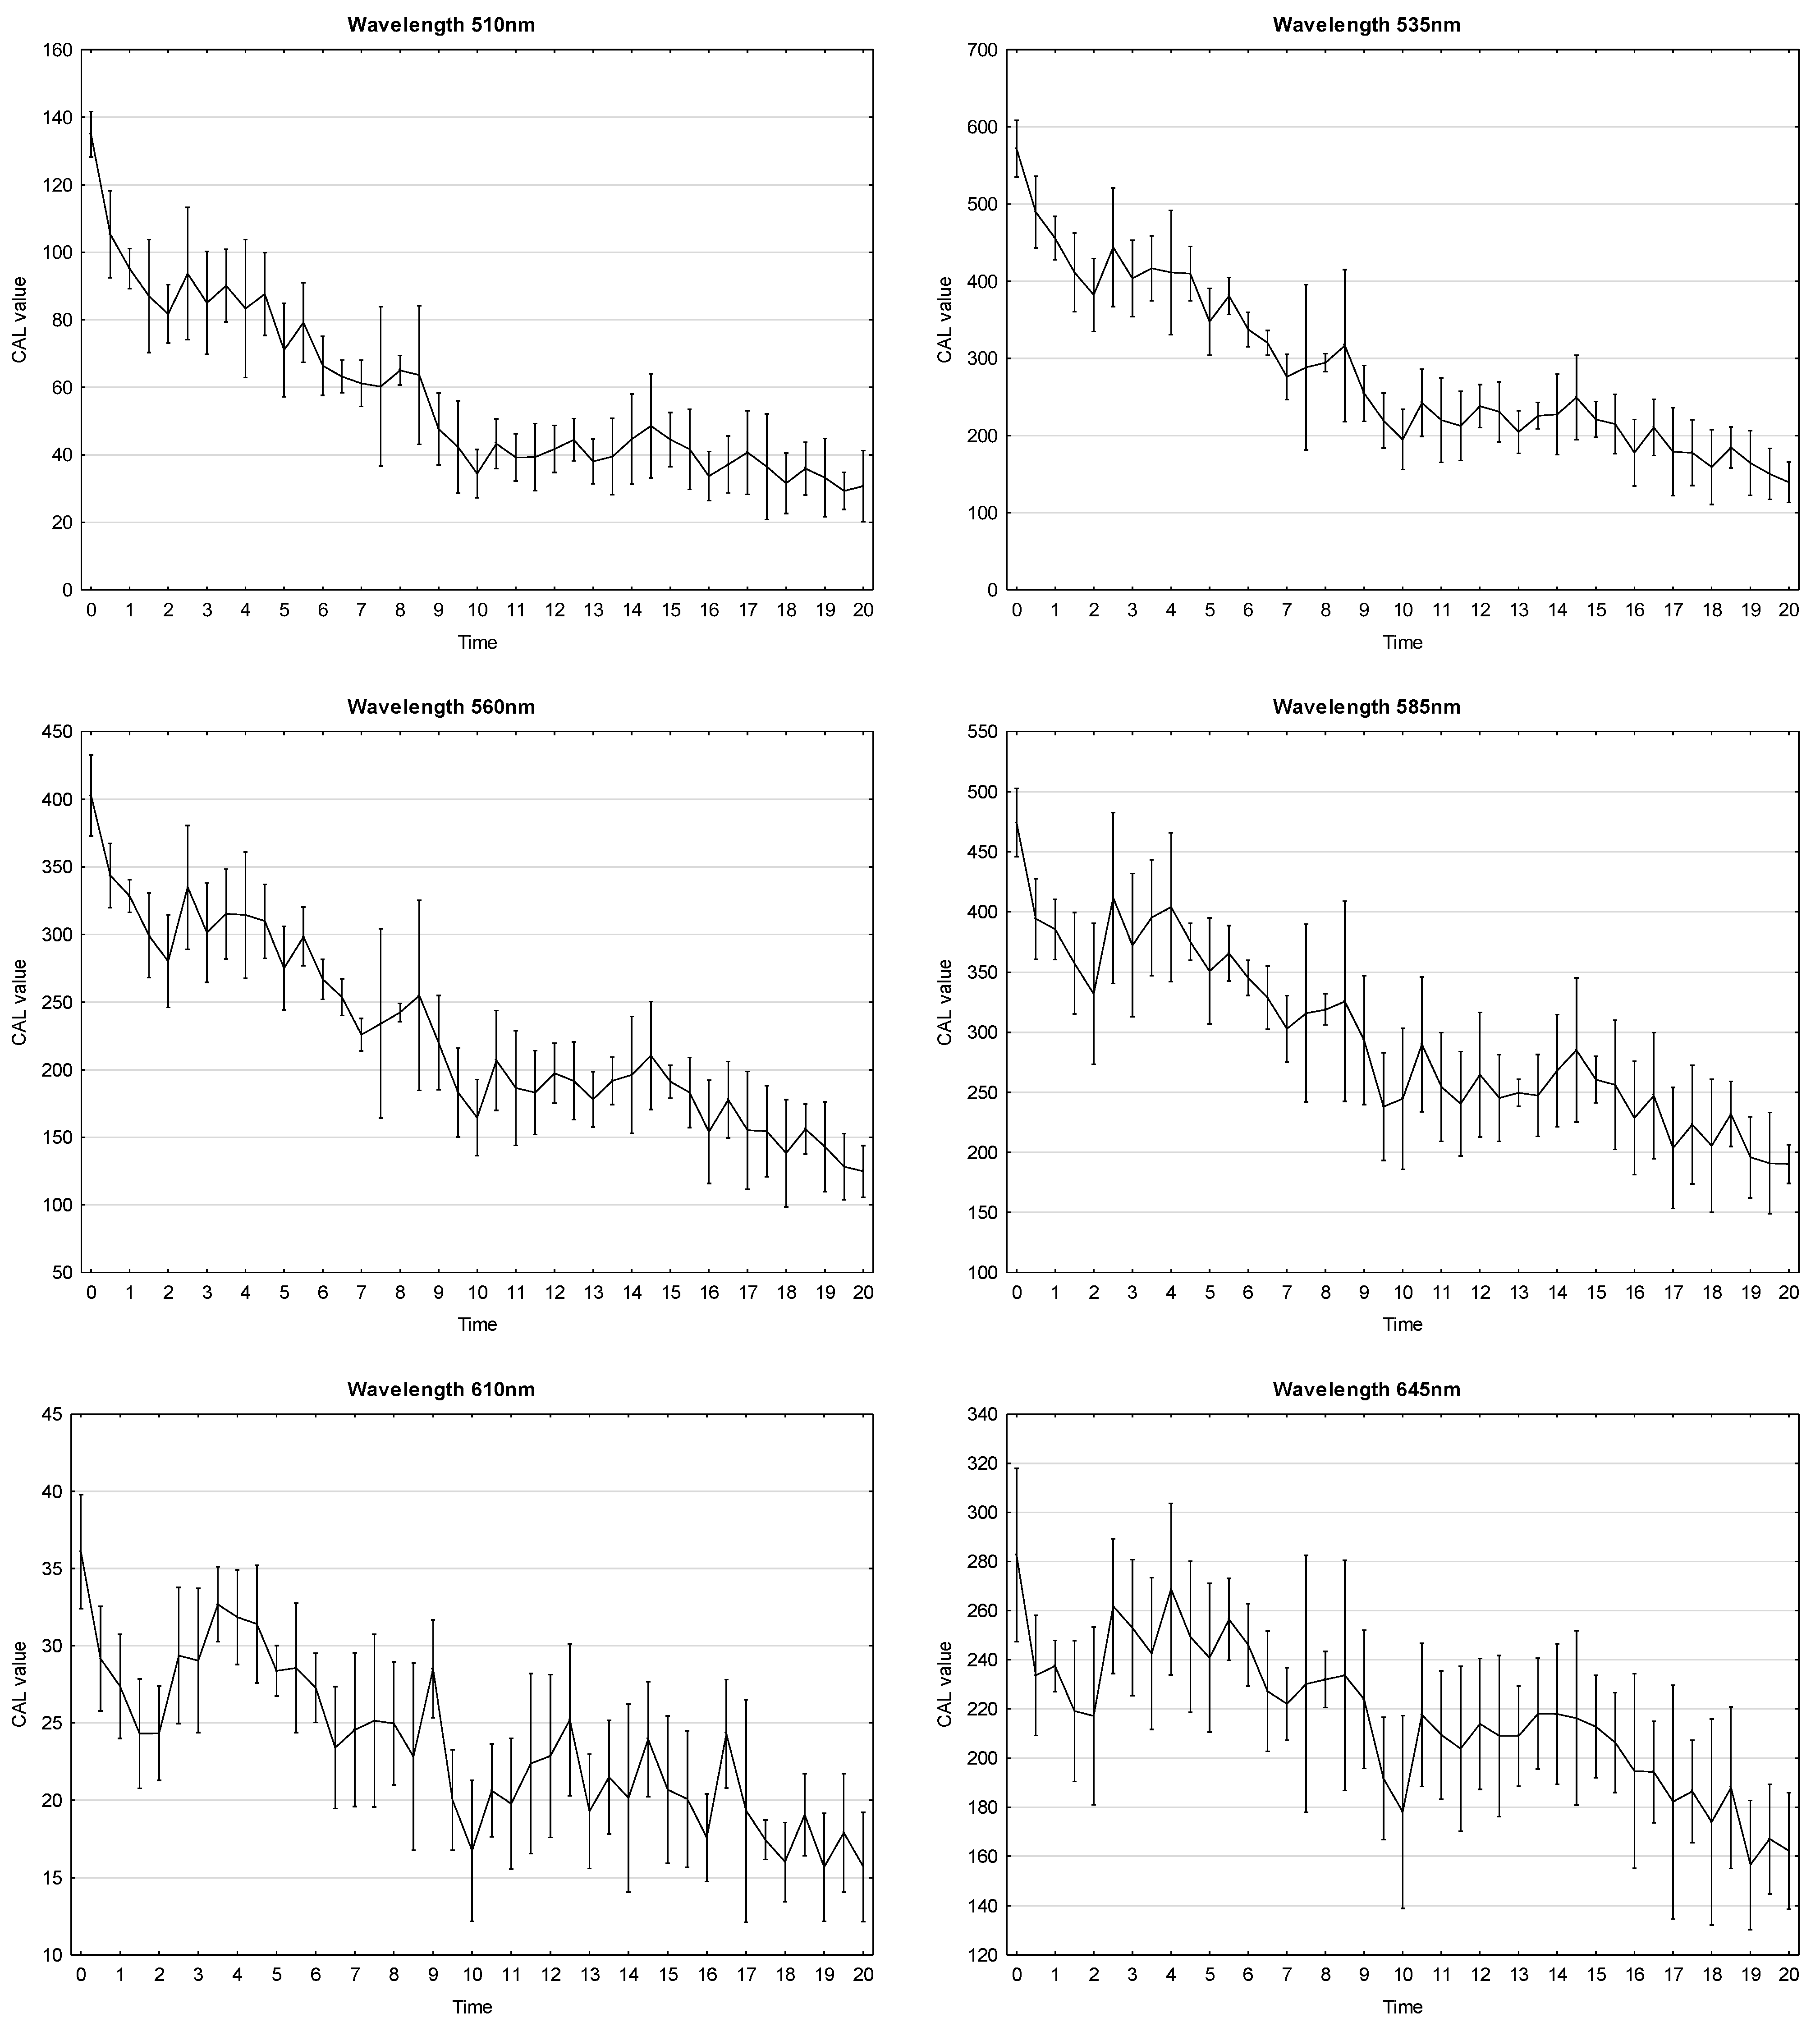
We compared the results of measurements taken with the cheap spectrophotometer SparkFun SEN-15050, using AS7265x sensors, at various wavelengths (Figure 8).
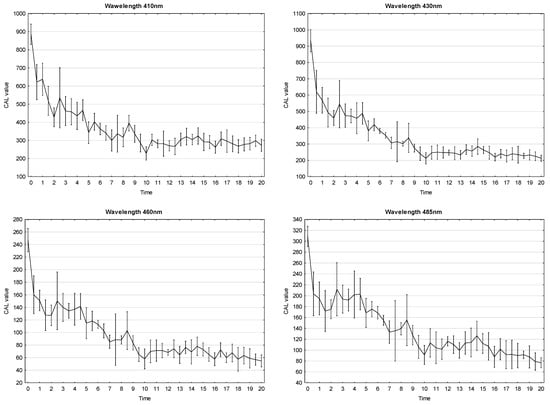
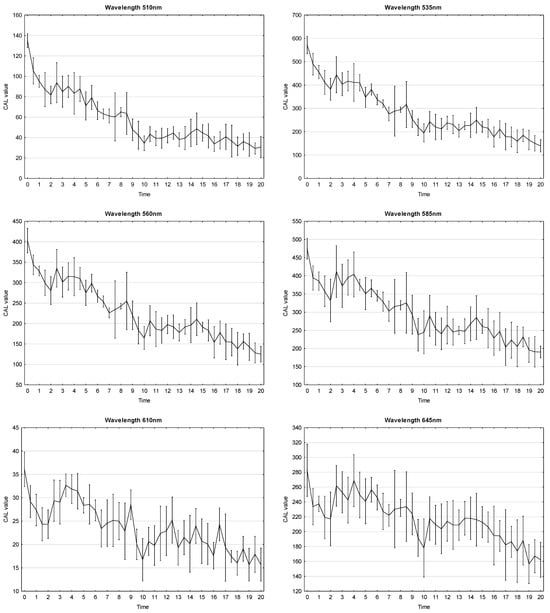
Figure 8.
Influence of the time of frying the potato pieces on factory pre-calibrated values (CAL value) for various wavelengths (measurements taken with the SparkFun SEN-15050 spectrophotometer). Error bars denote standard deviations.
The AS7265x sensors in the SparkFun SEN-15050 spectrophotometer were factory pre-calibrated at various wavelengths. It has three diodes that emit light similar to that of the sources of calibration, but their intensity was too low to light the measured samples of French fries. This is why, during the measurements, we used continuous lighting with an LED bulb (colour 4000K). Our analysis of the measurement results indicates that the equipment must be recalibrated to the applied source of light. Additionally, the manufacturer recommends that users perform normalisation of the calibrated readings so that they can be converted into values of reflectance. The cheap spectrophotometers based on AS7265x sensors are already used in prototypical measuring equipment [12,13,14]. It should be noted that in spite of the use of cheap sensors, the readings for individual wavelengths were similar to those taken by the Minolta spectrophotometer. Unfortunately, the repeatability of measurements was much lower. The standard deviation of reflectance varied remarkably depending on wavelength (Figure 9).
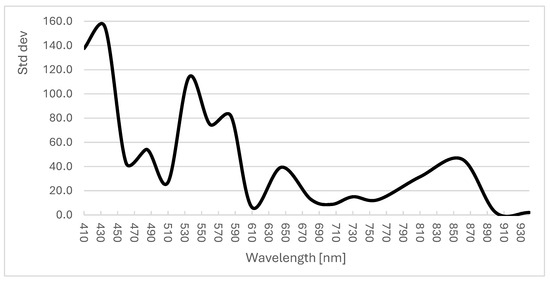
Figure 9.
Changes in standard deviation of reflectance measurements depending on wavelength in the SparkFun SEN-15050 spectrophotometer (mean values of standard deviations of measurements during frying from 0 to 20 min).
Values of standard deviation were high and characterised by large fluctuations, which probably resulted from the factory pre-calibrated measurement range of the sensor. For 410 nm and 430 nm, the readings varied from 280 to 900 units, while standard deviations ranged from 140 to 160 units. For 460 nm and 485 nm, the readings varied from 60 to 300 units, while the standard deviations were from 40 to 50 units, respectively. More and more often, cheap spectrophotometric sensors are calibrated with other measurements with the use of machine learning methods, which increases the accuracy of their measurement results [15].
3.3. Measurements Taken with the HP Scan Jet 4850 Scanner (Hewlett Packard, Palo Alto, CA, USA) and ImageJ Software (ver.1.54) for Digital Image Analysis
Scanners record images as 24-bit RGB images, so each primary colour is represented by 8 bits. ImageJ software, using a tool for analysis of any 24-bit image, determines the presence of individual primary colours in each pixel and next rates their intensity using 8 bits, so the decimal readings range from 0 to 255. Next, the software presents a histogram of intensity of pixels for each primary colour and calculates the mean value, the mode, and the standard deviation (see Figure 5).
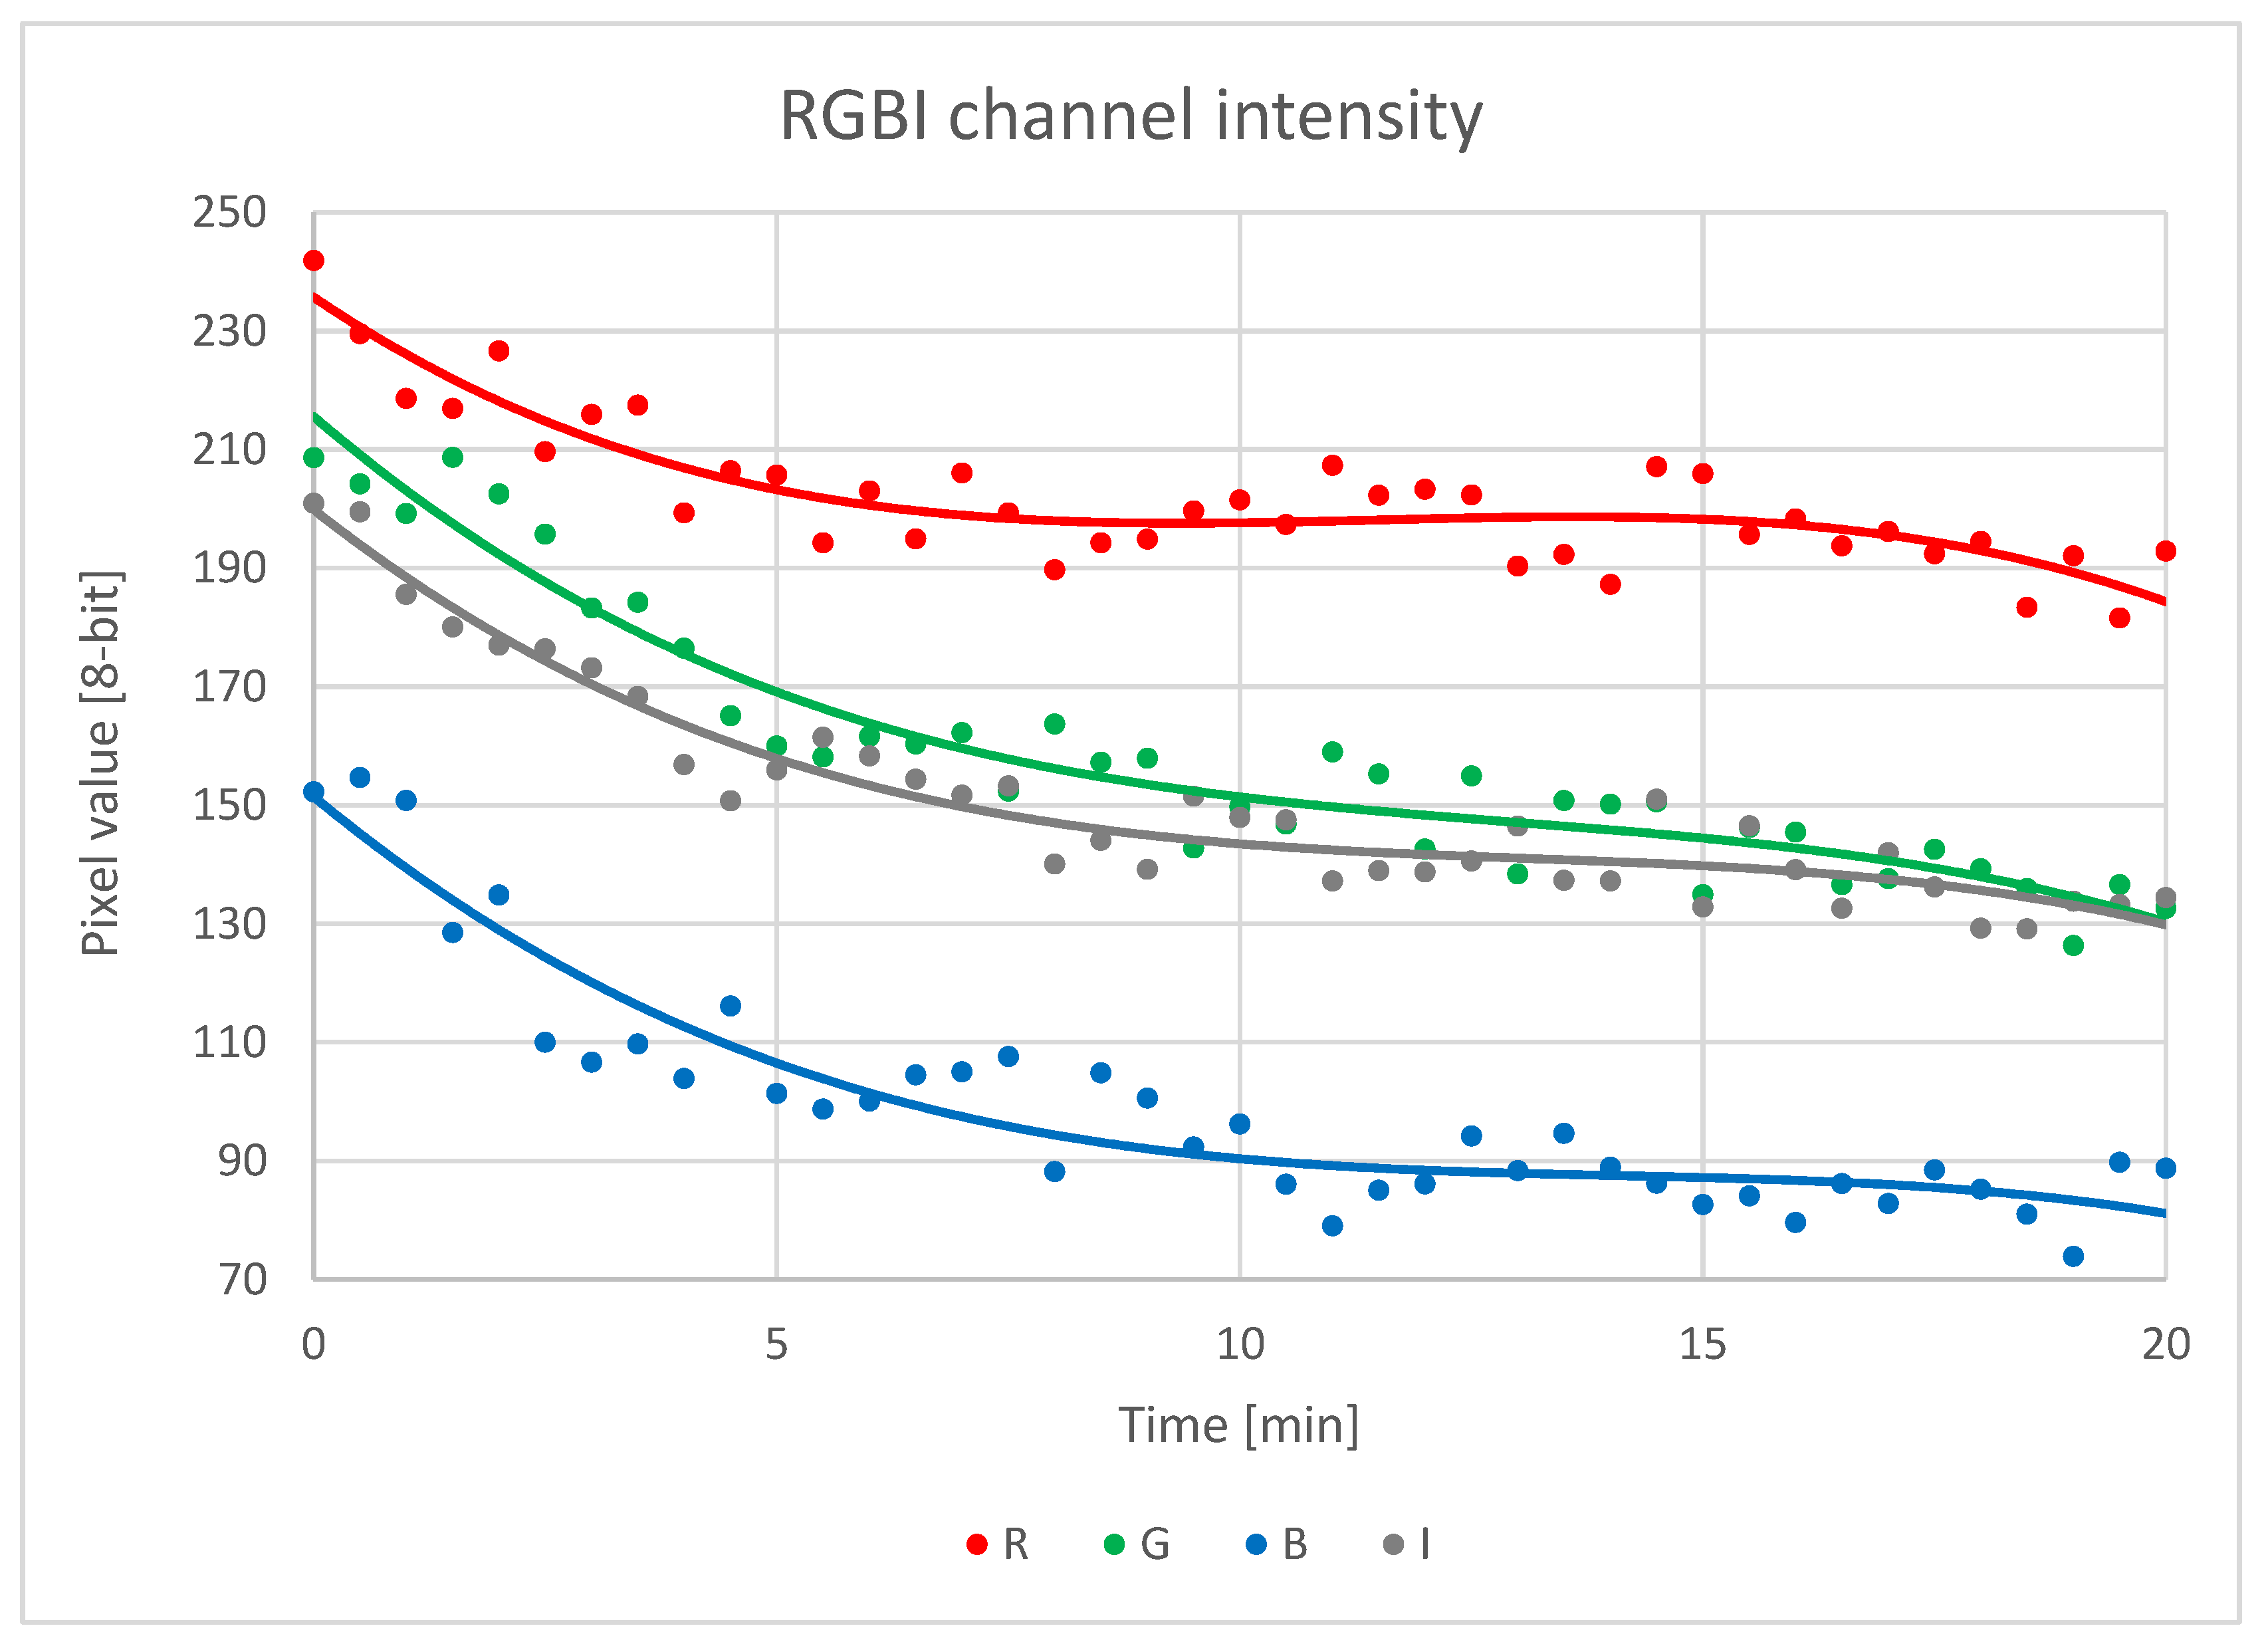
When analysing the digital images with ImageJ software, first the contours of all the fries were marked and next the software measured lightness and intensity of each primary colour component of the image: red (R), green (G), and blue (B). Mean values of intensity of primary colour components varied depending on the time of frying (Figure 10).
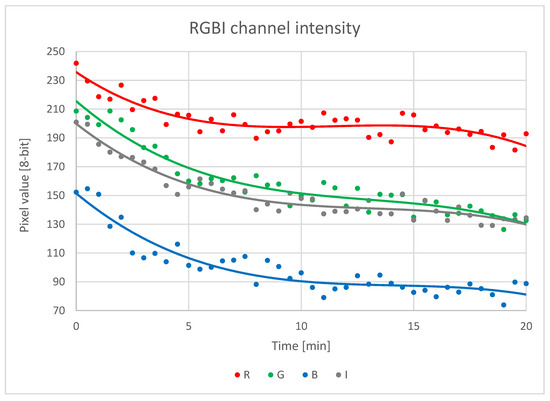
Figure 10.
Changes in intensity of primary colour components (RGB) and lightness of the image (I) depending on the time of frying.
To compare the results of scanning of French fries and digital image analysis, we converted the RGB scale into the XYZ scale, and next, the XYZ scale into the CIELab scale. The calculations were performed using the Python (ver. 3.12) programming language and the Numpy and Pandas libraries. In the calculations, we applied mathematical equations available online [16,17,18]. Thanks to these transformations, it was possible to compare these measurement results with the measurements taken with the Minolta C-5 spectrophotometer, which automatically uses the CIELab scale (Figure 11).
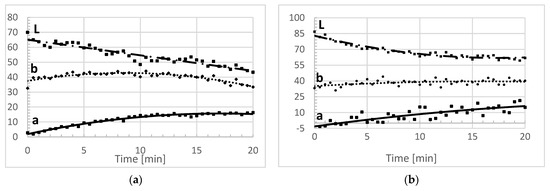
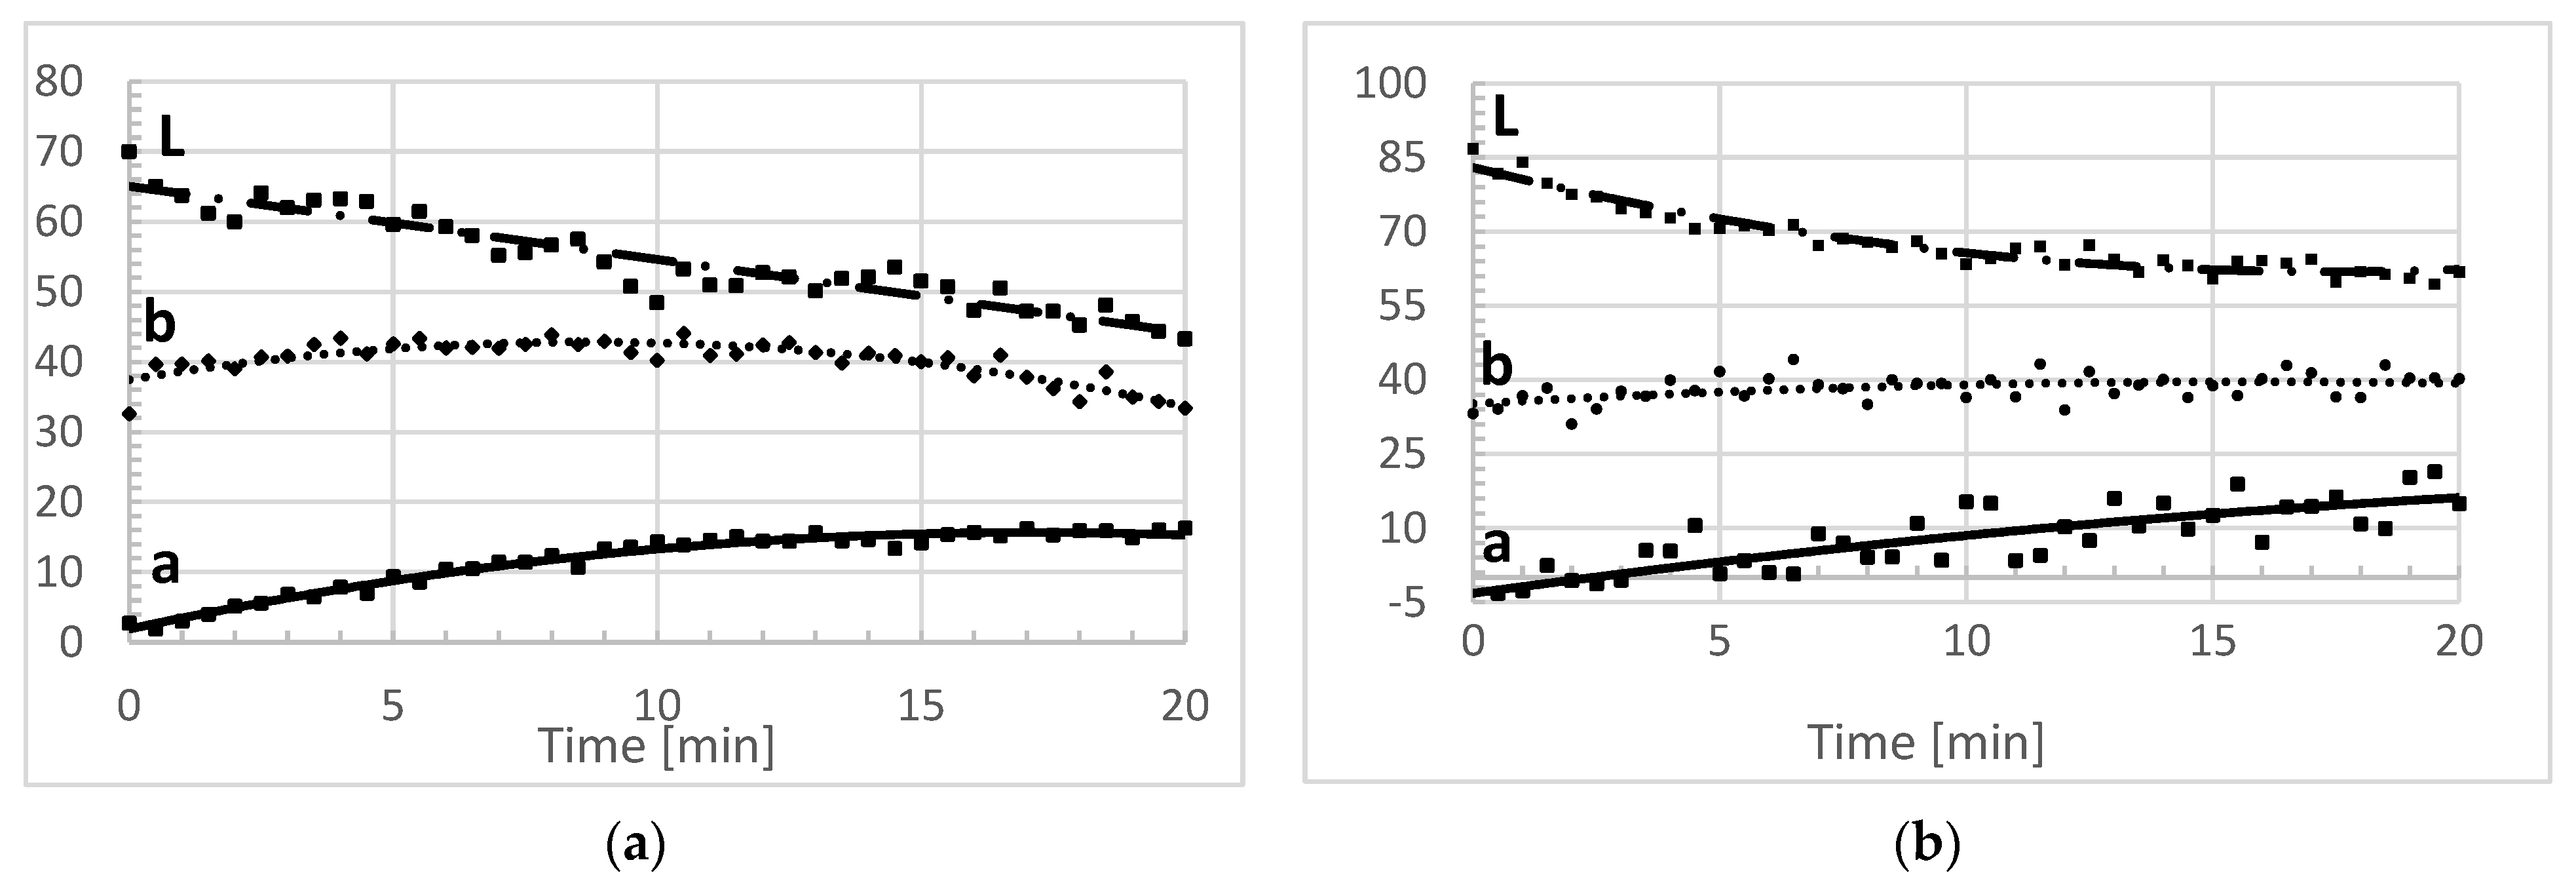
Figure 11.
Measurement results on the CIELab scale: (a) Minolta C-5; (b) HP ScanJet 4850 and ImageJ.
Variable L denotes lightness and varies from 0 to 100. The lightness curve generated by the Minolta spectrophotometer was nearly rectilinear and decreased from 70 at time 0 (before frying) to about 45 after frying for 20 min. When using the scanner, the changes in lightness were curvilinear, and its values decreased from 85 at time 0 to about 57 after frying for 20 min. In the case of variable a* (green–red), extreme values were similar in both methods, but the scanner measurement results were more scattered, and the decline was nearly rectilinear, in contrast to the curvilinear changes in the case of the Minolta spectrophotometer. Similar differences were observed in the case of variable b* (blue–yellow). The differences do not necessarily mean that the measurements taken using the scanner are less accurate. In the Minolta spectrophotometer, only up to four tightly arranged French fries can be measured at one time, compared to 30–35 on the scanner, while visually, we can see that the fries do not change colour synchronously, as some of them turn darker more quickly than others. However, measurements of colours (variables a* and b*) were less accurate when using the scanner than when using the professional Minolta C-5 spectrophotometer. In spite of the lower accuracy compared to professional spectrophotometers, vision systems with software for digital image analysis are used more and more often [19]. Their measurements are less time-consuming, do not need to be taken to a laboratory, can cover a larger area of the product [20], and can be employed in the Internet of Things (IoT).
4. Conclusions
Cheap spectrophotometers and vision systems are suitable for less precise but faster measurements. The possibility of using them in IoT systems and of their installation at any measurement point in production halls has remarkable benefits, as compared with the expensive and often large equipment, which cannot be installed in production halls. Machine vision excels in the quantitative measurement of a structured scene due to its speed, accuracy, and repeatability. For instance, on a production line, an MV system can inspect hundreds or even thousands of parts per minute [21]. Studies show that machine vision software can be implemented to replace or supplement the scoring of a trained panel and instrumental quality [22,23]. The results of different studies indicate that the integration of computer vision with machine learning models presents an effective approach for assessing the colour quality [24]. Moreover, both the fast measurement systems (based on cheap spectrophotometric sensors or on a vision system with software for digital image analysis) can be first calibrated precisely to the measured material, allowing greater accuracy of the measurements. Currently, some studies also concern the creation of machine learning models, which can calibrate the cheap measuring devices to perform measurements of given food products [25].
Author Contributions
Conceptualization, T.B. and H.B.; methodology, T.B. and H.B.; software, T.B.; validation, M.B., M.P. and H.B.; investigation, H.B.; resources, M.P.; data curation, H.B.; writing—original draft preparation, H.B., M.P., E.R.; writing—review and editing, M.B.; visualization, T.B. All authors have read and agreed to the published version of the manuscript.
Funding
This research received no external funding.
Data Availability Statement
The raw data supporting the conclusions of this article will be made available by the authors on request.
Acknowledgments
Partial translation of our manuscript into English by Sylwia Ufnalska, is gratefully acknowledged.
Conflicts of Interest
The authors declare no conflicts of interest.
References
- Abdullah, M.Z.; Guan, L.C.; Lim, K.C.; Karim, A.A. The applications of computer vision and tomographic radar imaging for assessing physical properties of food. J. Food Eng. 2004, 61, 125–135. [Google Scholar] [CrossRef]
- Du, C.; Sun, D. Recent developments in the applications of image processing techniques for food quality evaluation. Trends Food Sci. Technol. 2004, 15, 230–249. [Google Scholar] [CrossRef]
- Nicolaï, B.M.; Defraeye, T.; De Ketelaere, B.; Herremans, E.; Hertog, M.L.A.T.M.; Saeys, W.; Torricelli, A.; Vandendriessche, T.; Verboven, P.; Ketelaere, B.D.; et al. Nondestructive measurement of fruit and vegetable quality. Annu. Rev. Food Sci. Technol. 2014, 5, 285–312. [Google Scholar] [CrossRef]
- León, K.; Mery, D.; Pedreschi, F.; León, J. Color measurement in L∗a∗b∗ units from RGB digital images. Food Res. Int. 2006, 39, 1084–1091. [Google Scholar] [CrossRef]
- Igathinathane, C.; Pordesimo, L.O.; Batchelor, W.D. Major orthogonal dimensions measurement of food grains by machine vision using ImageJ. Food Res. Int. 2009, 42, 76–84. [Google Scholar] [CrossRef]
- Boruczkowski, T.; Boruczkowska, H.; Drożdż, W.; Miszczak, M.; Leszczyński, W. Use of ImageJ software for assessment of mechanical damage to starch granules. Processes 2022, 10, 630. [Google Scholar] [CrossRef]
- Moallem, P.; Serajoddin, A.; Pourghassem, H. Computer vision-based apple grading for golden delicious apples based on surface features. Inf. Process. Agric. 2017, 4, 33–40. [Google Scholar] [CrossRef]
- Goñi, S.M.; Salvadori, V.O. Colour measurement: Comparison of colourimeter vs. computer vision system. Food Meas. 2017, 11, 538–547. [Google Scholar] [CrossRef]
- Wu, Q.; Xie, L.; Xu, H. Determination of toxigenic fungi and aflatoxins in nuts and dried fruits using imaging and spectroscopic techniques. Food Chem. 2018, 252, 228–242. [Google Scholar] [CrossRef]
- Daugaard, S.B.; Adler-Nissen, J.; Carstensen, J.M. New vision technology for multidimensional quality monitoring of continuous frying of meat. Food Control 2010, 21, 626–632. [Google Scholar] [CrossRef]
- Available online: https://cdn.sparkfun.com/assets/c/2/9/0/a/AS7265x_Datasheet.pdf (accessed on 4 November 2024).
- Tran, N.T.; Fukuzawa, M. A portable spectrometric system for quantitative prediction of the soluble solids content of apples with a pre-calibrated multispectral sensor chipset. Sensors 2020, 20, 5883. [Google Scholar] [CrossRef] [PubMed]
- Sulistyo, S.B.; Sudarmaji, A.; Kuncoro, P.H.; Haryanti, P. Design and performance test of portable spectrometer using AS7265x multispectral sensor for detection of adulterated cane sugar in granulated coconut sugar. AIP Conf. Proc. 2023, 2586, 060016. [Google Scholar]
- Jiang, Y.; Zhang, D.; Yang, L.; Cui, T.; He, X.; Wu, D.; Dong, J.; Li, C.; Xing, S. Design and experiment of non-destructive testing system for moisture content of in-situ maize ear kernels based on VIS-NIR. J. Food Compos. Anal. 2024, 133, 106369. [Google Scholar] [CrossRef]
- Srinivasagan, R.; Mohammed, M.; Alzahrani, A. TinyML-Sensor for Shelf Life Estimation of Fresh Date Fruits. Sensors 2023, 23, 7081. [Google Scholar] [CrossRef] [PubMed]
- Available online: http://www.brucelindbloom.com (accessed on 4 November 2024).
- Available online: https://www.mathworks.com/help/images/ref/rgb2xyz.html (accessed on 4 November 2024).
- Xu, Z.; Han, Y.; Zhao, D.; Li, K.; Li, J.; Dong, J.; Shi, W.; Zhao, H.; Bai, Y. Research Progress on Quality Detection of Livestock and Poultry Meat Based on Machine Vision, Hyperspectral and Multi-Source Information Fusion Technologies. Foods 2024, 13, 469. [Google Scholar] [CrossRef]
- Watkins, K.; Hastie, M.; Ha, M.; Hepworth, G.; Warner, R. Machine Vision Requires Fewer Repeat Measurements than Colorimeters for Precise Seafood Colour Measurement. Foods 2024, 13, 1110. [Google Scholar] [CrossRef]
- Pedreschi, F.; León, J.; Mery, D.; Moyano, P. Development of a computer vision system to measure the color of potato chips. Food Res. Int. 2006, 39, 1092–1098. [Google Scholar] [CrossRef]
- Ettalibi, A.; Elouadi, A.; Mansour, A. AI and Computer Vision-based Real-time Quality Control: A Review of Industrial Applications. Procedia Comput. Sci. 2024, 231, 212–220. [Google Scholar] [CrossRef]
- Bornhorst, E.R.; Luo, Y.; Park, E.; Zhou, B.; Turner, E.R.; Teng, Z.; Trouth, F.; Simko, I.; Fonseca, J.M. In Search of Optimum Fresh-Cut Raw Material: Using Computer Vision Systems as a Sensory Screening Tool for Browning-Resistant Romaine Lettuce Accessions. Horticulturae 2024, 10, 731. [Google Scholar] [CrossRef]
- Bosakova-Ardenska, A. Recent Trends in Computer Vision for Cheese Quality Evaluation. Eng. Proc. 2024, 60, 12. [Google Scholar] [CrossRef]
- Li, J.; Li, Q.; Luo, W.; Zeng, L.; Luo, L. Rapid Color Quality Evaluation of Needle-Shaped Green Tea Using Computer Vision System and Machine Learning Models. Foods 2024, 13, 2516. [Google Scholar] [CrossRef] [PubMed]
- Sagita, D.; Mardjan, S.S.; Purwandoko, P.B.; Widodo, S. Low-cost IoT-based multichannel spectral acquisition systems for roasted coffee beans evaluation: Case study of roasting degree classification using machine learning. J. Food Compos. Anal. 2024, 133, 106478. [Google Scholar] [CrossRef]


Disclaimer/Publisher’s Note: The statements, opinions and data contained in all publications are solely those of the individual author(s) and contributor(s) and not of MDPI and/or the editor(s). MDPI and/or the editor(s) disclaim responsibility for any injury to people or property resulting from any ideas, methods, instructions or products referred to in the content. |
© 2025 by the authors. Licensee MDPI, Basel, Switzerland. This article is an open access article distributed under the terms and conditions of the Creative Commons Attribution (CC BY) license (https://creativecommons.org/licenses/by/4.0/).