Article

Influence of Chromium Content in Alloys on Corrosion in Saline Water Saturated with Supercritical CO2

by
Haofei Sun
1,
Minkang Liu
2,
Yimin Zeng
2,* and
Jing Liu
1,*
1
Department of Chemical and Materials Engineering, University of Alberta, 9211-116 Street NW, Edmonton, AB T6G 1H9, Canada
2
Natural Resources Canada, CanmetMATERIALS, Hamilton, ON L8P 0A5, Canada
*
Authors to whom correspondence should be addressed.
Processes 2025, 13(5), 1334; https://doi.org/10.3390/pr13051334
Submission received: 28 March 2025 / Revised: 21 April 2025 / Accepted: 22 April 2025 / Published: 27 April 2025
(This article belongs to the Special Issue Development of Corrosion-Resistant Materials)

Abstract

:
Amid growing global efforts toward carbon capture, utilization, and storage (CCUS), this study investigates the influence of chromium (Cr) content in candidate construction alloys on their corrosion modes and kinetics in supercritical CO2 (s-CO2)-saturated saline water at 8 MPa and 50 °C. The results indicate that alloys with a Cr concentration of over approximately 9 wt.%, including P91, 316L, and Alloy 800, exhibit a satisfactory corrosion performance in this environment. During exposure to s-CO2-saturated saline water, a non-protective FeCO3 layer forms on all tested alloys. For alloys containing more than 2 wt.% Cr, an inner Cr-enriched layer concurrently grows and acts as a barrier to resist environmental attack. The integrity of the inner and outer corrosion layers becomes more compact and uniform on alloys with at least 9 wt.% Cr. Pitting is unlikely to occur on candidate alloys used for s-CO2 storage or enhanced oil recovery.

1. Introduction

The adoption of economy-wide decarbonization targets for 2050 has stimulated intensive efforts in the development and deployment of carbon capture, utilization, and storage (CCUS) technology for various industrial applications [1,2]. Among them, a prominent example is the integration of CO2-enhanced oil recovery (EOR) with CCUS, which involves capturing CO2 from large emitters, transporting it as supercritical CO2 (s-CO2), and utilizing it in direct EOR operations [3,4,5]. In a CCUS chain, long-term, safe CO2 transportation and EOR application are two crucial concerns to avoid catastrophic risks and significant capital loss due to the existing corrosion and stress corrosion cracking challenges for primary constructional materials. For effective CO2 pipeline transport, the transported CO2 streams with corrosive impurities (such as H2O, O2, SO2, NOx, etc.) are compressed above their critical point (7.4 MPa, 31 °C) to maintain a single-phase flow for optimum efficiency [6,7]. The density and viscosity of s-CO2 at these conditions highlight its suitability for pipeline transmission. For instance, the density and viscosity of s-CO2 at 50 °C and 10 MPa are 395 kg/m3 and 0.03 cP, respectively [8,9]. The general process of s-CO2 transportation, storage, and utilization systems is to collect CO2 from large industrial emitters, transport it under s-CO2, and re-use it for specific field EOR operations [10,11].
Based on the dominant reactions, corrosion in these s-CO2 environments are divided into two categories: the s-CO2-rich phase in pipeline and upper-level EOR well environments, and the s-CO2-saturated aqueous phase (i.e., H2O-rich phase) in localized pipeline condensation areas and lower-level EOR and storage systems [12]. In the past years, considerable studies have been conducted to clarify the effects of aggressive impurities on corrosion in the s-CO2-rich phase [2,13,14,15]. Corrosion damage is expected to be more severe in the s-CO2-saturated aqueous phase compared to the s-CO2-rich phase, and only a few investigations have been performed in this area [16]. Moreover, most studies on the s-CO2-saturated H2O-rich phase mainly focused on low-alloyed steels, as shown in Appendix A, Table A1. Furthermore, except for water and s-CO2, the constructional alloys used to inject CO2 into saline aquifer reservoirs encounter saline water (SW) with high concentrations of chloride, possibly experiencing both active general and localized corrosion (pitting) attacks [8,9,17,18]. Unfortunately, previous studies on carbon steels (CSs) and low Cr steels indicated that they are unsuitable for engineering applications due to their high corrosion rates (CRs) in s-CO2-saturated saline water [11,19].
There are several key factors controlling corrosion in the s-CO2-saturated H2O-rich phase: alloy chemistry and structures, temperature, pressure, environmental aggressive agents, etc. Firstly, previous studies imply that the suitable materials of construction (MOC) should have a certain amount of alloying elements (such as Cr and Mo) to effectively resist environmental attacks. For instance, carbon steels exhibit high CRs (7 and 13 mm/y, respectively) in the s-CO2-saturated 3.5 wt.% NaCl solution at 80 °C and 9.5 MPa [16,20], while austenitic stainless steels have excellent corrosion resistance (less than 0.02 mm/y) under similar conditions [21,22]. Secondly, the influence of temperature on corrosion in the s-CO2-saturated H2O-rich phase is different from that observed in condensed acidic solutions [23]. The CRs of X65 are higher at lower temperatures (50–80 °C) than at higher temperatures (110–130 °C) after 168 h of exposure [24,25]. Similarly, Li et al. reported that the CR of X65 decreased from 1.47 mm/y at 50 °C to 0.93 mm/y at 100 °C in 8 MPa s-CO2-saturated H2O [26]. Thus, the corrosion in the temperature range of 50–80 °C needs to be carefully addressed to avoid potential underestimations. Thirdly, increasing s-CO2 pressure leads to a decrease in the pH value of the s-CO2-saturated H2O-rich phase, consequently introducing a more acidic condition [26]. Interestingly, at the pressure range from 7.4 to 10 MPa, previous studies indicated that the presence of impurities (such as H2S) had a more noticeable impact on the CRs of carbon steels compared to pressure change [27]. However, above 10 MPa, the pressure influence cannot be ignored [10,28,29]. Finally, the corrosion performance of alloys in the s-CO2-saturated H2O-rich phase is affected by the presence of different cations and anions. For example, accelerated pitting kinetics might be attributed to the co-precipitation of Ca2+ and Mg2+ ions with FeCO3 [30]. Compared to Mg2+, Ca2+ demonstrated a much greater propensity to co-precipitate with FeCO3, thus resulting in more severe pit propagation. Moreover, Cl is a notorious agent to trigger pitting and even the stress corrosion cracking of steels in aqueous solutions [26].
In saline water environments, limited information is available to determine the appropriate MOCs for cost-competition construction and long-term safe operation. Herein, this study aims to investigate the effect of the Cr content in alloys on corrosion modes and rates by exposing commercial candidate alloys with various Cr contents in s-CO2-saturated saline water (SW) to fill the knowledge gaps. High-pressure autoclave testing, weight loss measurement, and microscopic characterization of as-formed corrosion products on the alloys were conducted to reveal the corrosion mechanisms of these alloys in the s-CO2-saturated H2O-rich phase, and partially support the industrial applications of CCUS technology.

2. Experimental Procedure

2.1. Testing Materials and Solution Preparation

Various candidate commercial alloys with a Cr content ranging from 0.28 to 19.2 wt.%, including X80 (European equivalent grade #L555MB), P91 (UNS #K91560), and 316L (UNS #S31603) steels made by EVRAZ North America (Regina, SK, Canada), 2Cr (GR2) and 5Cr (GR5) purchased from ArcelorMittal (Contrecoeur, QC, Canada), and Alloy 800 (UNS #N08800) produced by CAMBRIDGE (Cambridge, ON, Canada) respectively, were selected in this study. Their chemical compositions, which were measured using a photoelectric direct-reading spectrometer (Bruker, Billerica, MA, USA) and carbon sulfur analyzer (LECO Corporation, St. Joseph, MI, USA), are listed in Table 1. All specimens were prepared via the process of grinding the exposed surfaces sequentially with a series of SiC abrasive papers up to 600 grit, cleaning with deionized (DI) water, dehydrating them in alcohol, and finally drying in compressed air. A 3.5 wt.% NaCl solution was utilized as the exposed H2O-rich phase, which was continuously purged with CO2 for 2 h before the autoclave experiments to eliminate dissolved oxygen.

2.2. Autoclave Corrosion Experiments and Post-Experiment Characterization

The setup for the autoclave corrosion experiments is schematically shown in Figure 1, which comprises a s-CO2 supply system, a s-CO2 pump, an autoclave (316 stainless steel, 1 L capacity), a real-time temperature controller, and a gas disposal line. All experiments were controlled at a total pressure of 8 MPa and 50 °C for 96 h. As displayed in Figure 1, the specimens were immersed in the H2O-rich phase (i.e., s-CO2-saturated 3.5 wt.% NaCl solution) to simulate the CO2 injection environment.
To avoid potential contamination, each type of alloy was evaluated separately. Specifically, four specimens were experimented/tested for each alloy, of which the first three samples were used for corrosion rate calculations, and the remaining one was for the post-experiment characterization of the formed corrosion products. Before an experiment, the initial weight of specimens was measured using an analytical balance with a precision of 0.00001 g. The freshly prepared specimens were accommodated on Teflon holders (Figure 1), and 250 mL of s de-aerated NaCl solution was added to the autoclave. The autoclave was then immediately sealed, and residual air inside was removed by purging with CO2 for 2 h. Following that, the autoclave was heated up to the target temperature of 50 °C. Liquid CO2 was subsequently injected into the autoclave to reach the desired total pressure of 8 MPa through a s-CO2 pump. Note that s-CO2 was introduced only at the beginning of the experiment in this study and was not renewed during the experiment. All experiments were performed under static conditions. After 96 h, the autoclave was turned off, and the corroded specimens were removed for subsequent weight loss measurements and microscopic examinations. Note that 96 h duration was selected based on our comprehensive literature review, which indicates that an exposure time of at least 96 h for immersion experiments is needed to reach a steady state [10]. The corrosion products formed on the first 3 samples were removed using a pickling solution (composed of 3.5 g hexamethylene tetramine, 500 mL HCl and deionized water to make a 1 L solution) at room temperature, following the cleaning procedures outlined in ASTM Standard G1-03 [31]. The weight of specimens after removing the corrosion products was measured again to determine the weight loss. All weight loss measurements were repeated three times to ensure the result’s accuracy. Assuming a uniform thickness loss across each sample surface, the corrosion rate (CR, mm/y) was calculated using Equations (1) and (2):
W = W o W f  
where W f is the final weight; W o is the initial weight in g. According to ASTM Standard G31-21 [32], the corrosion rate, CR, in mm/y, was calculated as:
C R = ( K × W ) / A × t × ρ  
where t is the time of exposure in hours, A is the exposed surface area in cm2, W is the mass loss in g, ρ is the density in g/cm3, and K is a constant 8.76 × 10⁴ for mm/y.
To identify the surface corrosion product grown on tested samples without cleaning, an X-ray diffractometer (XRD, Ultima IV, Rigaku, Tokyo, Japan) with a Cu X-ray source and a scanning speed of 1°/step and a scanning electron microscope (SEM, Tescan Vega3, Tescan, Kohoutovice, Czech Republic) equipped with an energy-dispersive X-ray spectroscopy (EDS) detector were employed. After the surface characterization, the corroded steels with a Cr content ≤ 5 wt.% were embedded in epoxy and cut to expose the cross-sectional areas of corrosion layers for SEM examinations. As shown below, the corrosion rates of P91 and SS316 fall within the transition range. The cross-sections of corrosion layers on the two steels were prepared by using the focused ion beam (FIB) milling technique and then analyzed using transmission electron microscopy (TEM, JEOL JEM-ARM200cF S/TEM, JEOL, Akishima, Tokyo, Japan). Note that before FIB operation, a very thin Pt layer was coated on the tested samples to protect the formed corrosion layers on the steels and to make the layer conductive. The microscope was equipped with a cold field-emission gun (cFEG) and a probe spherical aberration corrector. To ensure the reliability of the results, the EDS analyses obtained through SEM and TEM were repeated five times.

3. Results

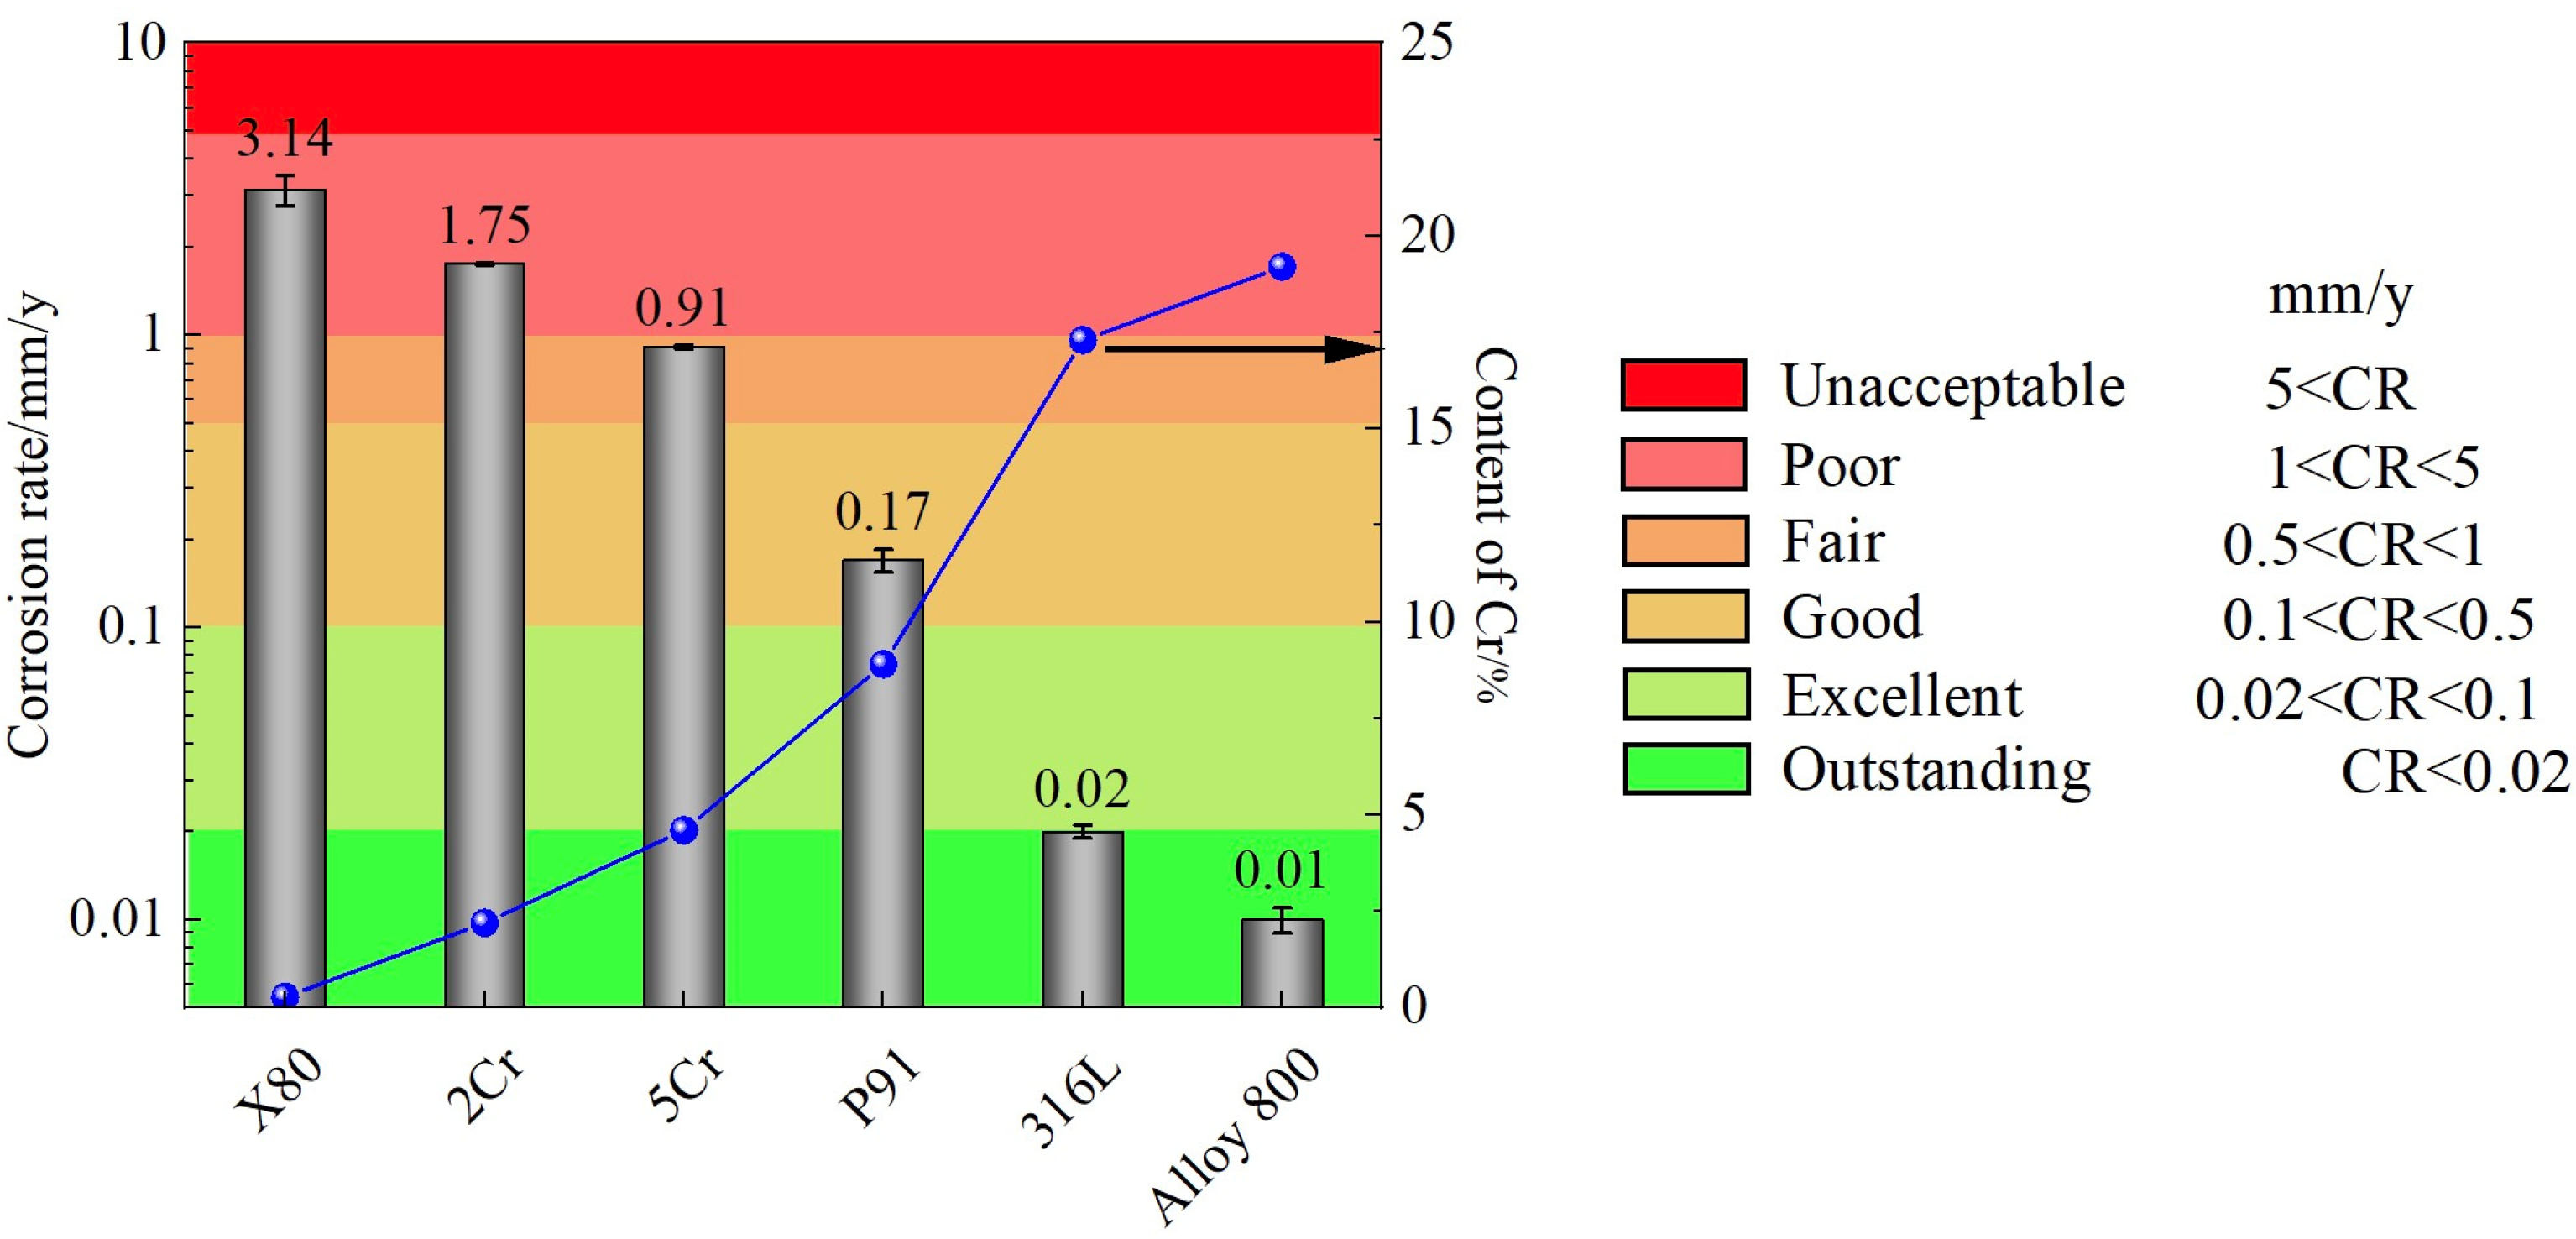
3.1. Average Corrosion Rates of Alloys

Figure 2 presents the corrosion rates of various alloys in the s-CO2-saturated SW at 50 °C and 8 MPa with a 96 h immersion time based on weight loss measurements. As shown, X80 steel suffered the highest corrosion rate of 3.14 mm/y, while 2Cr and 5Cr steels had corrosion rates of 1.75 and 0.91 mm/y, respectively. As reported, X65 shows a corrosion rate of 1.5 mm/y in the same experimental condition after 96 h [26], and X70 shows a corrosion rate of 7 mm/y at 70 °C and 9.5 MPa after 96 h [16]. For these low Cr steels, the introduction of Mo (≤1%) is unlikely to remarkably improve their corrosion resistance in the s-CO2-saturated NaCl solution. Further increase in Cr concentration in Fe-based steels led to a noticeable drop in the corrosion rate. The average corrosion rate of P91 steel specimens, which have a higher Cr content of 8.9 wt.%. and contents of 0.1 wt.% Ni and 0.9 wt.% Mo, was found to be around 0.17 mm/y, indicating the vital role of Cr content in boosting corrosion resistance in the s-CO2 environment. For the austenitic stainless steel (SS316L) and Ni-based alloy (Alloy 800) with a Cr content above 17 wt.%, their corrosion rates were less than 0.02 mm/y and consistently decreased with increasing Cr content, further confirming the critical role of Cr content in the alloys on corrosion resistance in the environment. Similarly, Gao et al. found that P110, 3Cr, and 316L have corrosion rates of 10, 2.2, and 0.018 mm/y in the 3.5% NaCl solution at 80 °C and 10 MPa after 240 h [21], which indicates the effect of Cr. As the two alloys (SS316L and Alloy 800) contain a certain amount of Ni, FIB and SEM/TEM characterizations were conducted on tested SS316L samples to clarify whether the presence of Ni in alloys could also contribute to corrosion resistance improvement. Furthermore, as illustrated in Figure 2, based on the standards [33], corrosion rates less than 0.02 mm/y are outlined as outstanding, 0.02–0.1 mm/y as excellent, 0.1–0.5 mm/y as good, 0.5–1 mm/y as fair, 1–5 mm/y as poor, and greater than 5 mm/y as unacceptable. Therefore, the above results indicate the MOC materials suitable for s-CO2 permanent storage or EOR need to have at least 9 wt.% Cr to meet the long-term application requirements.

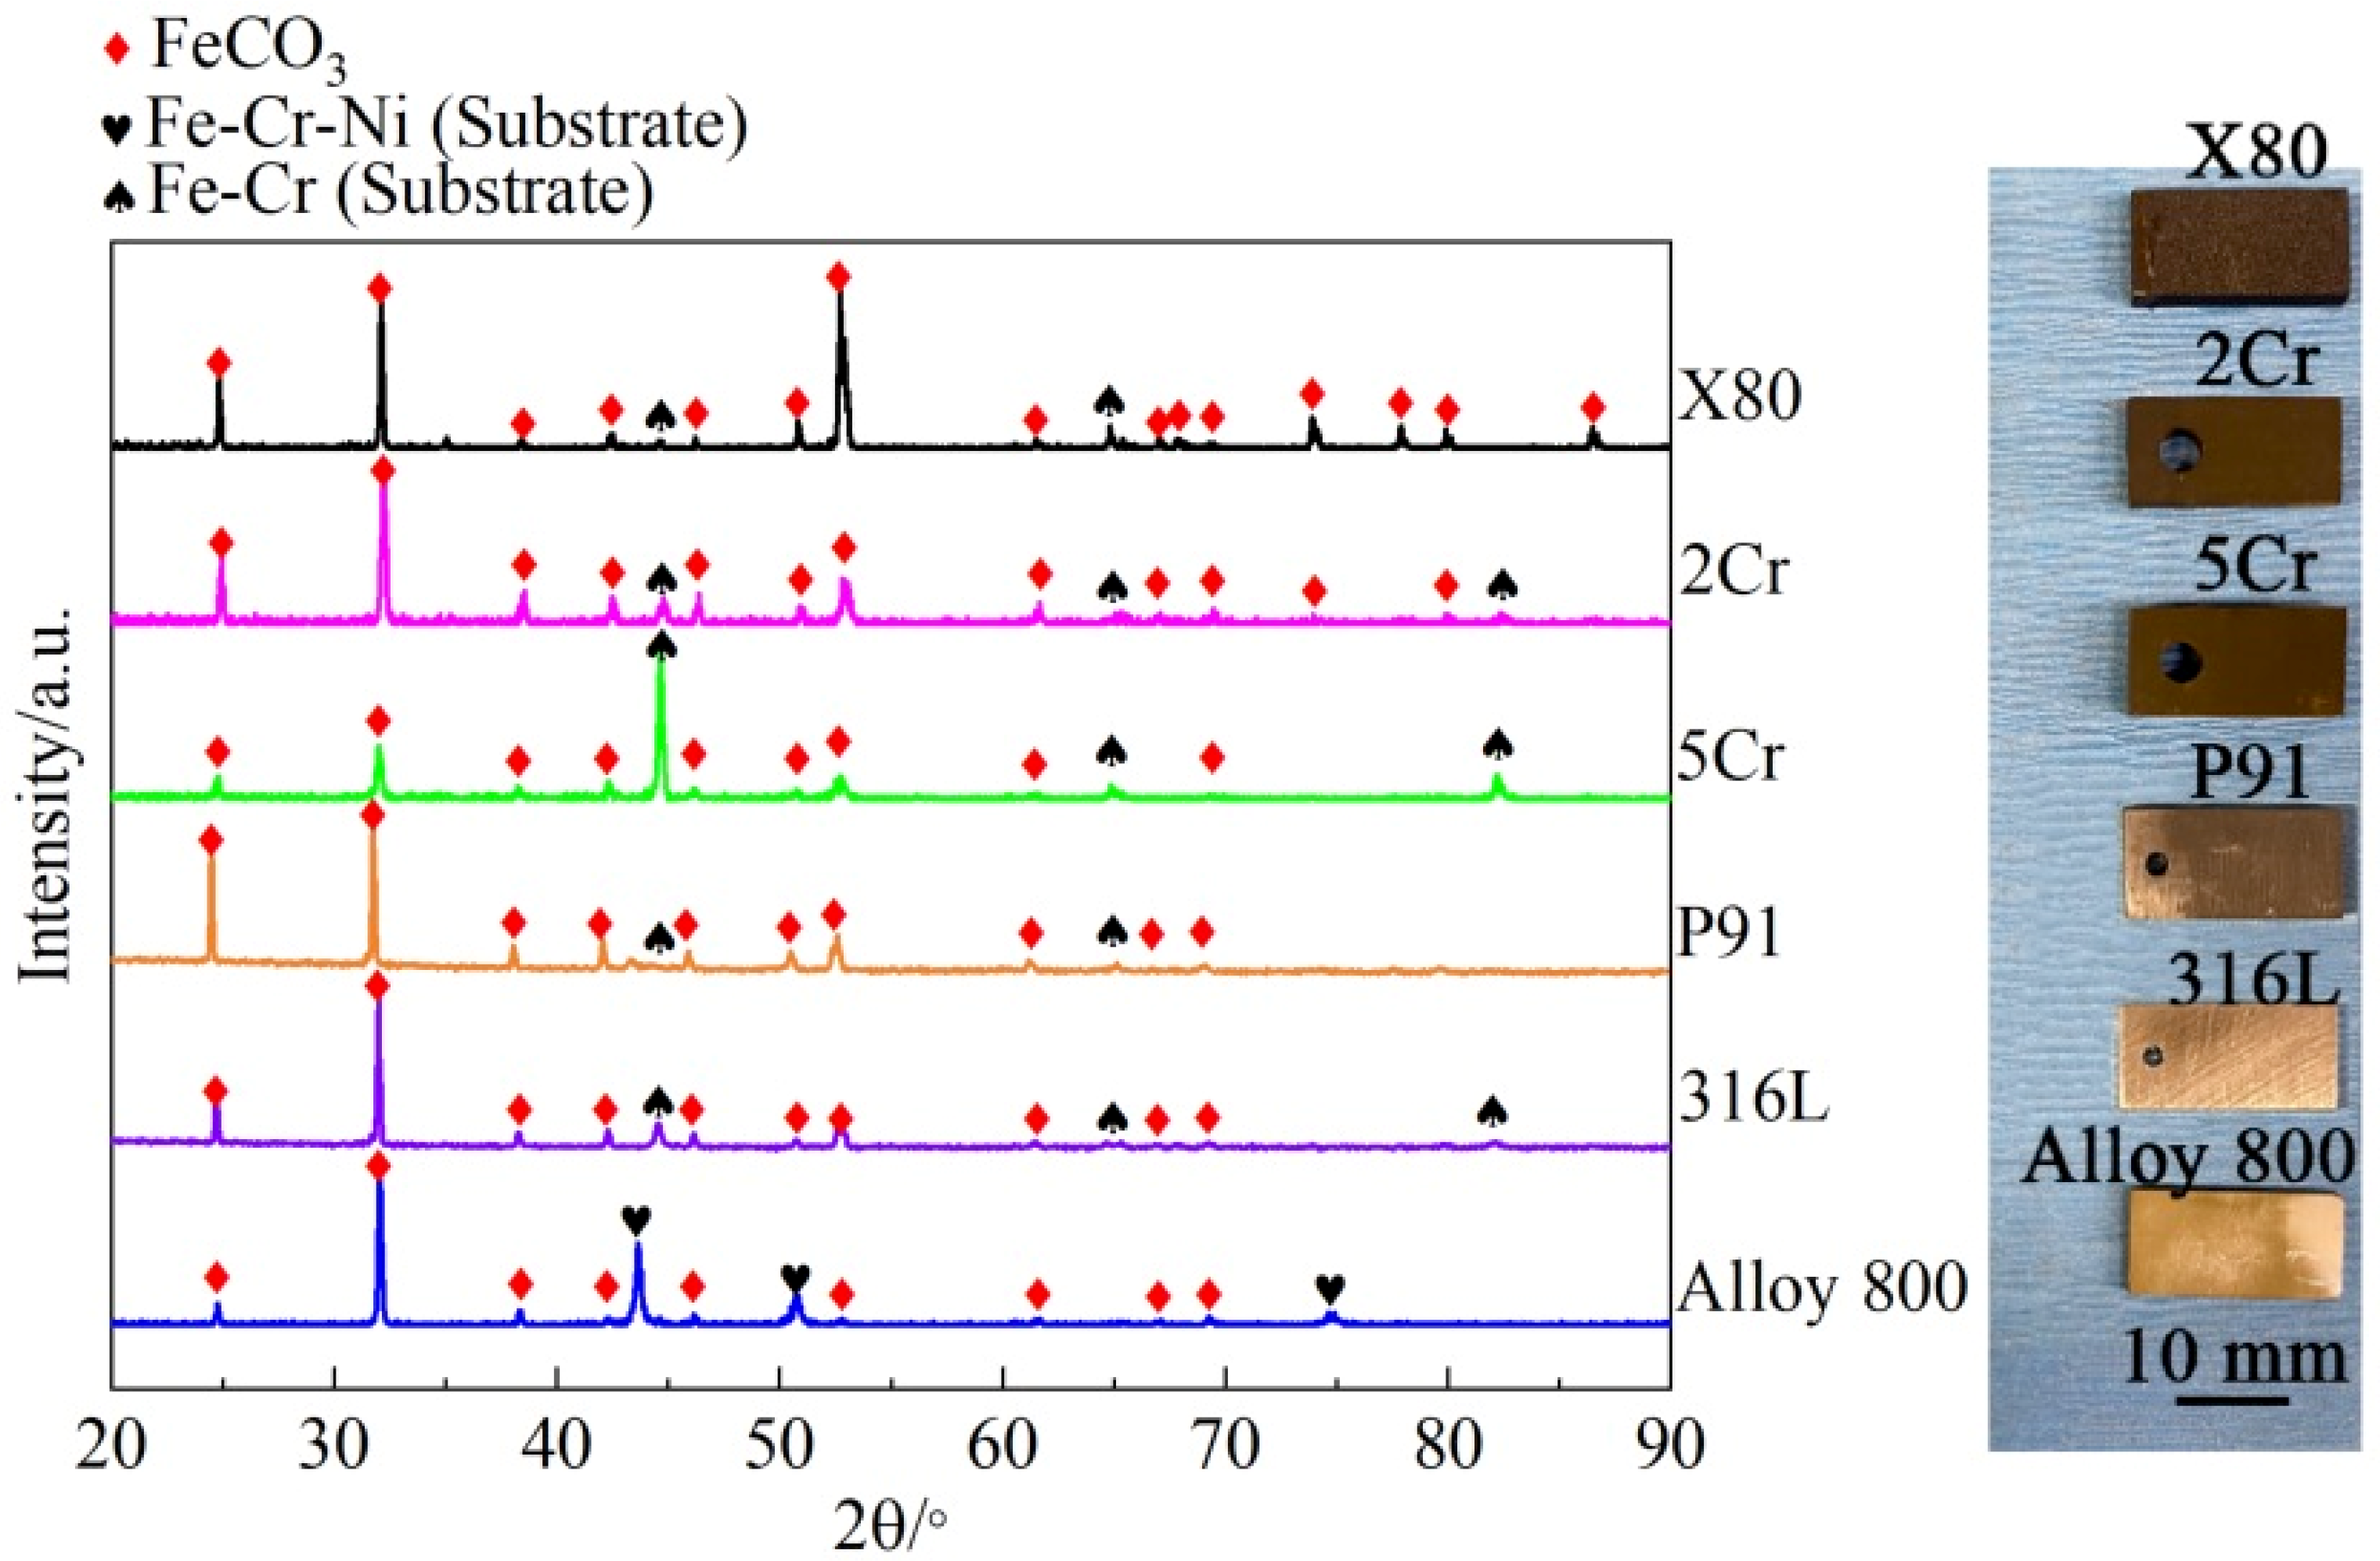
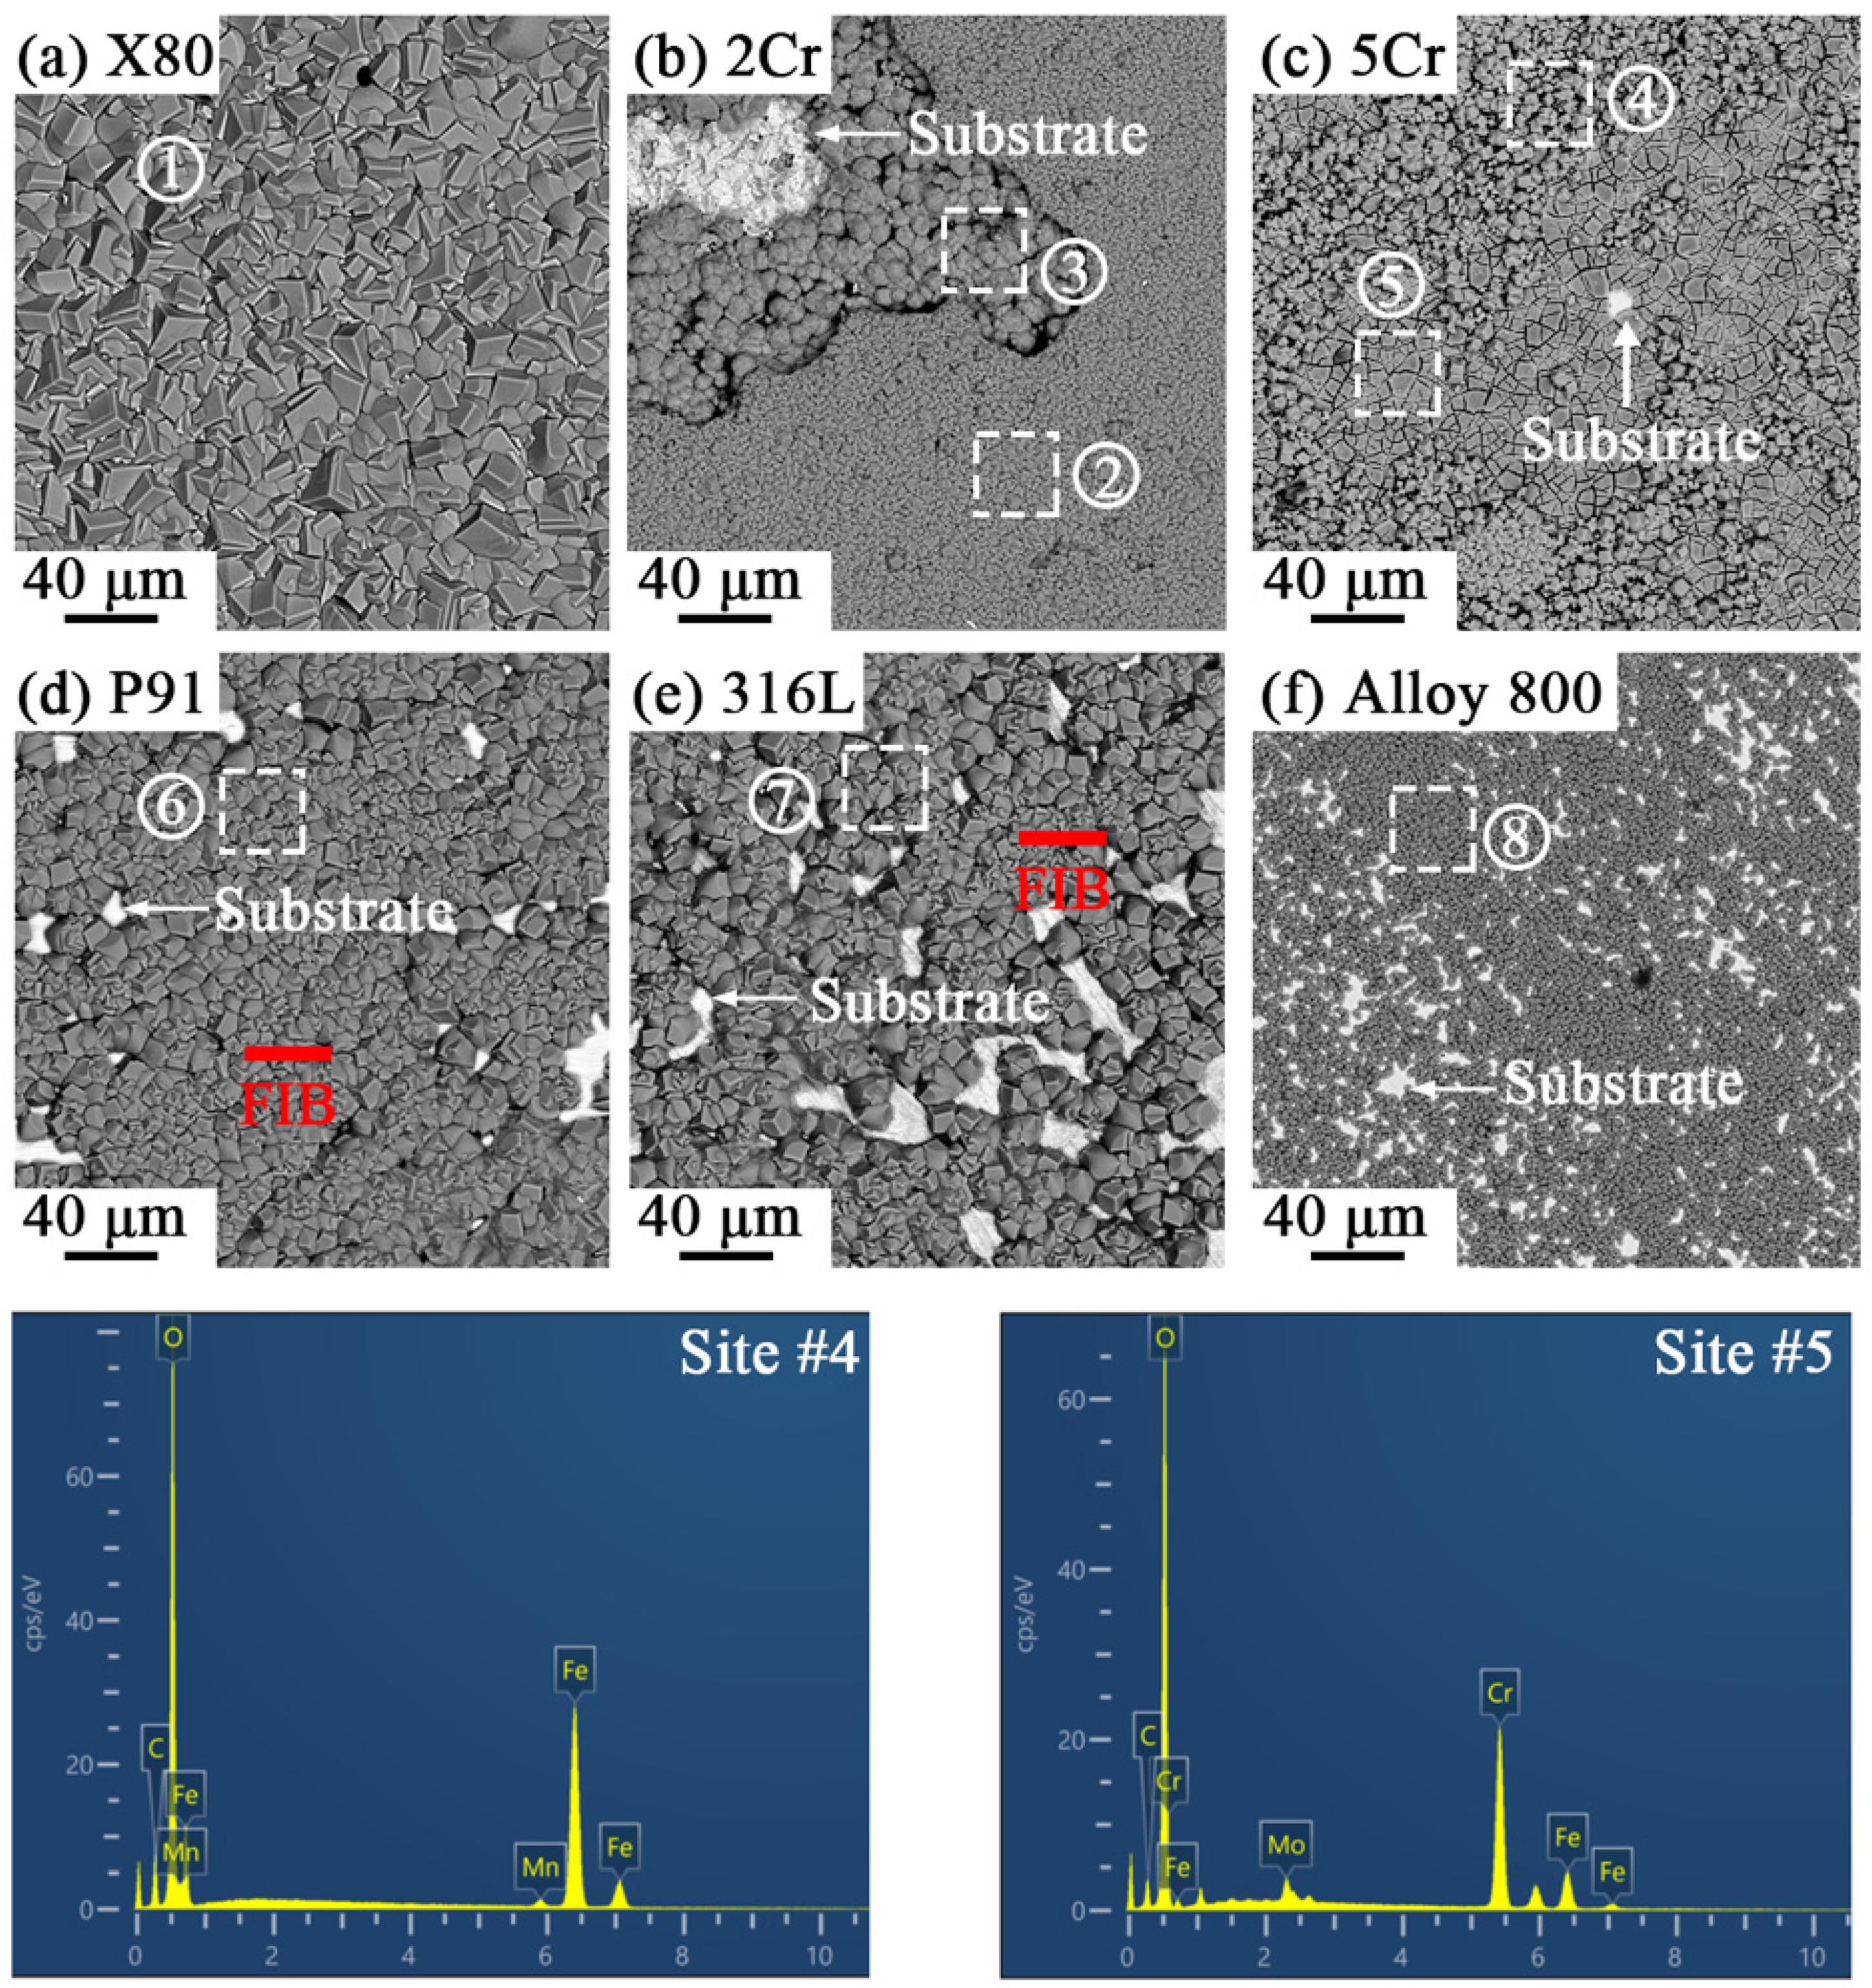
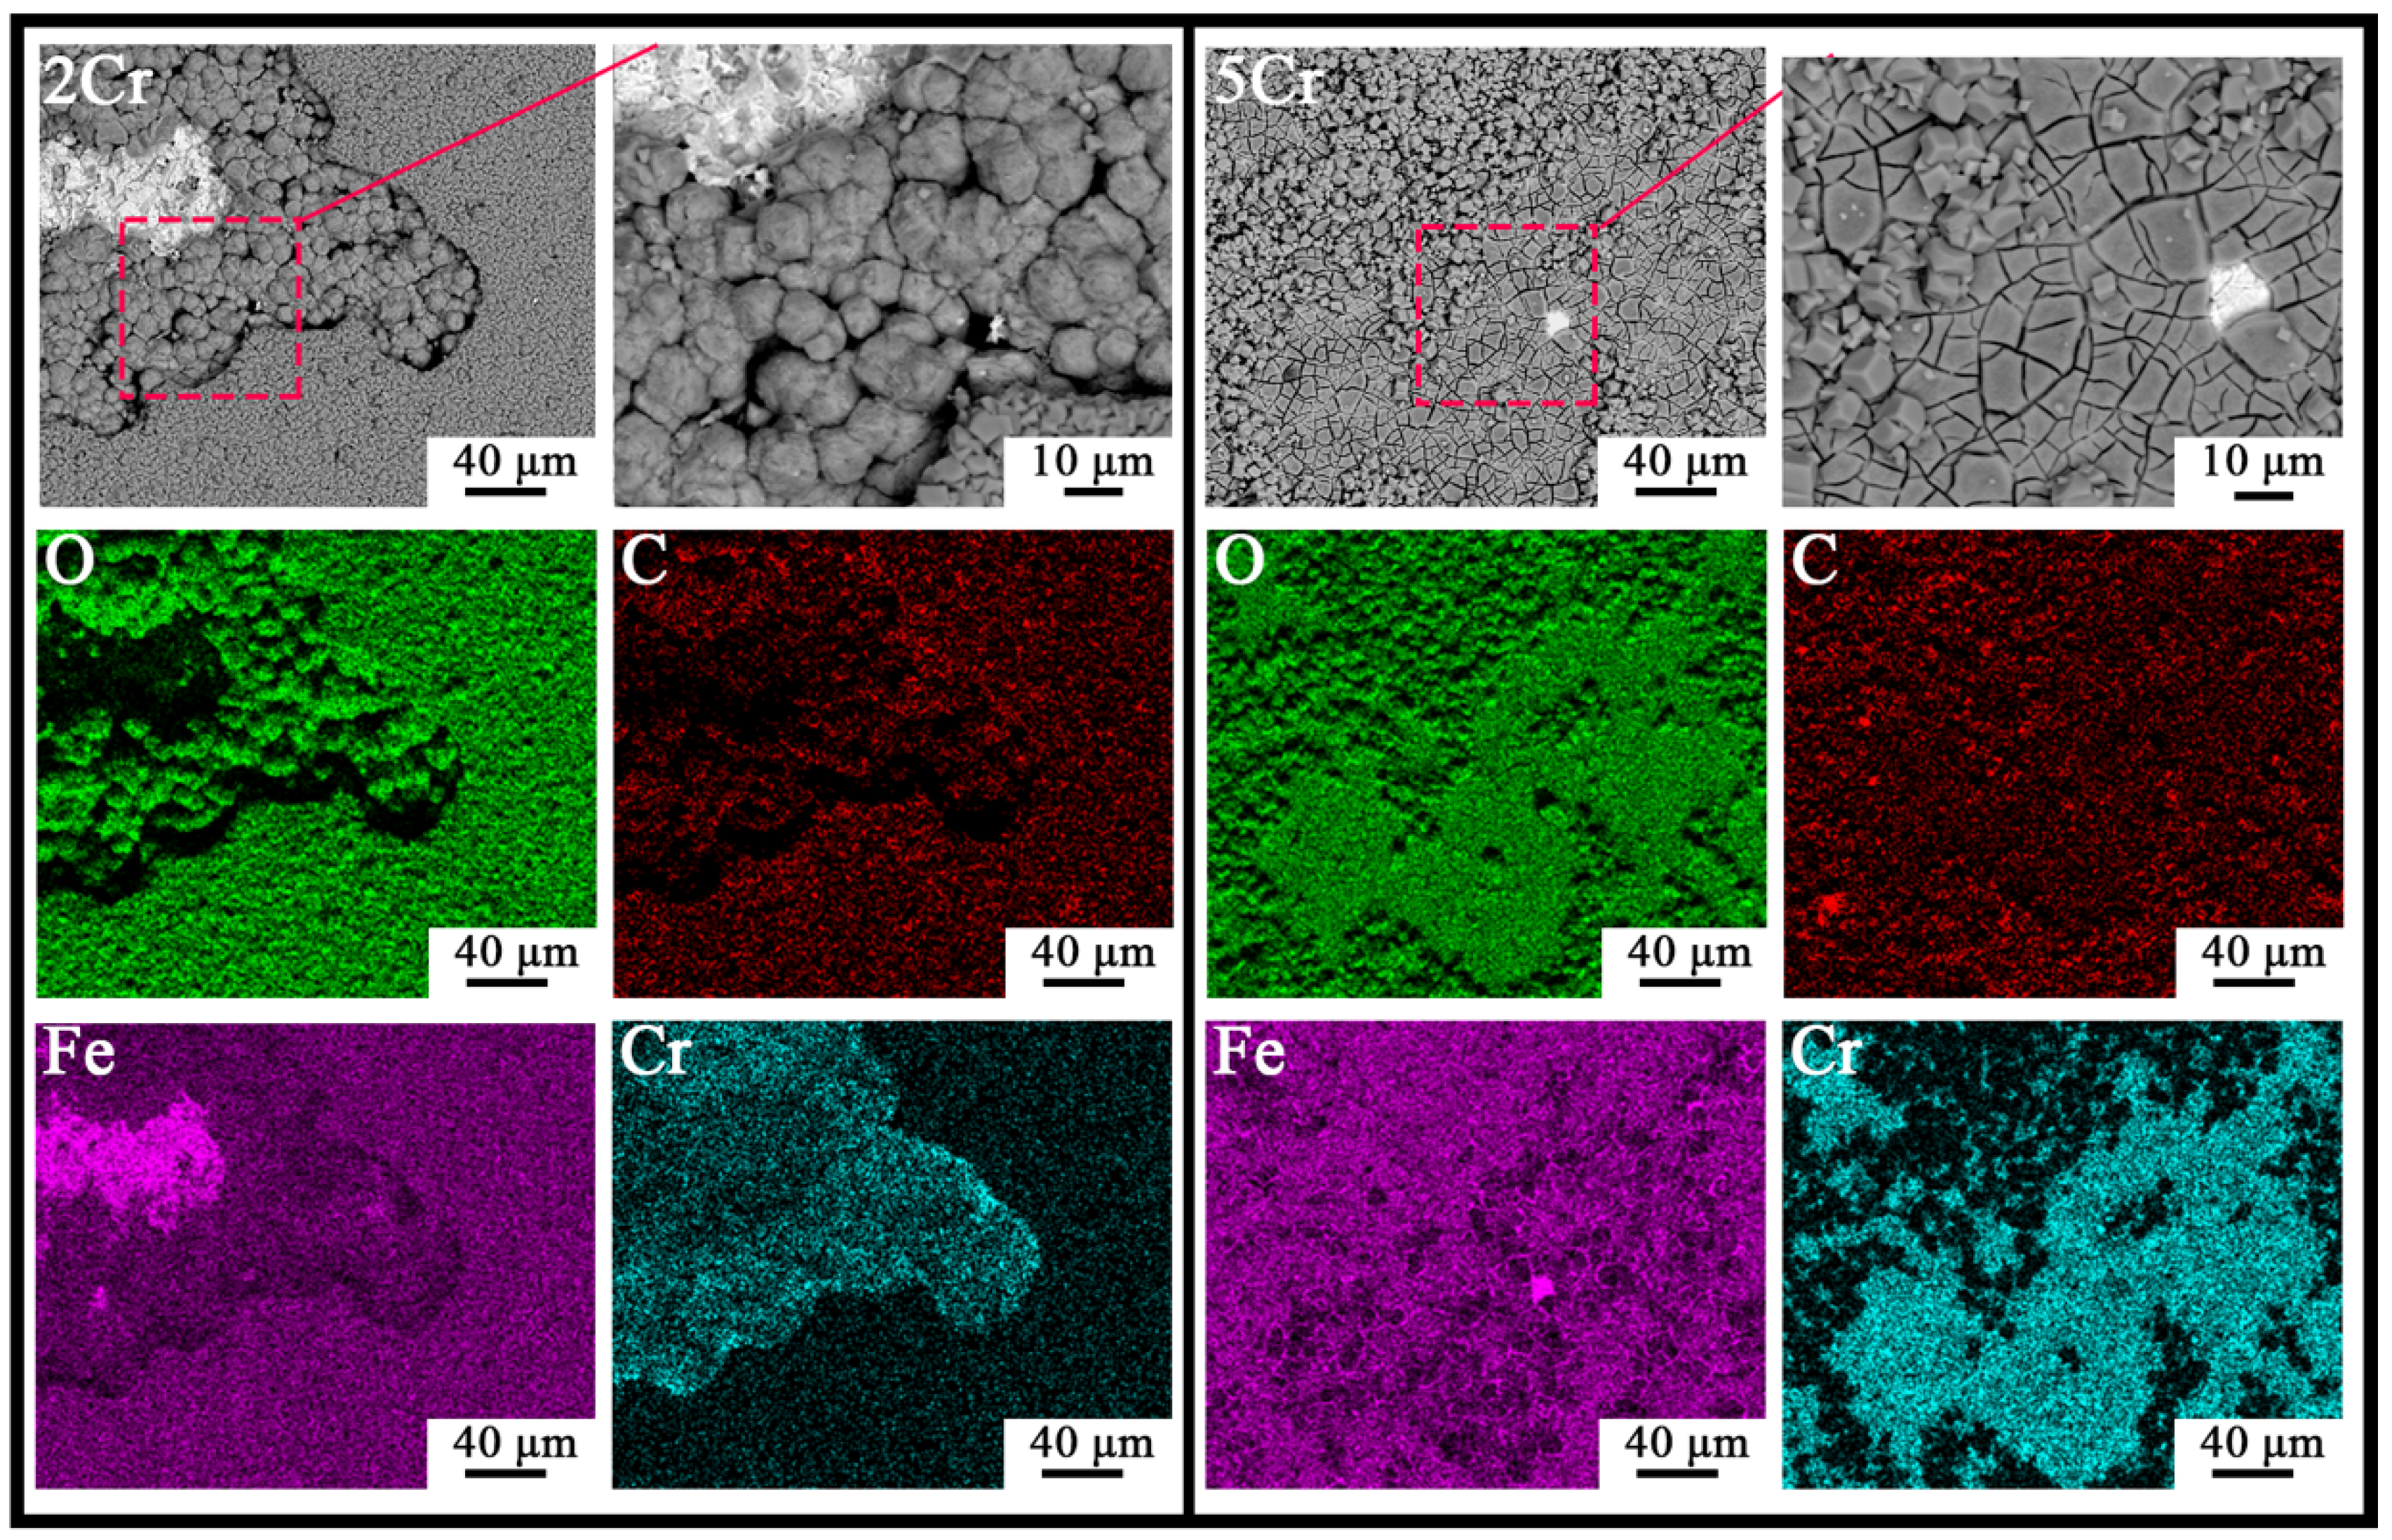
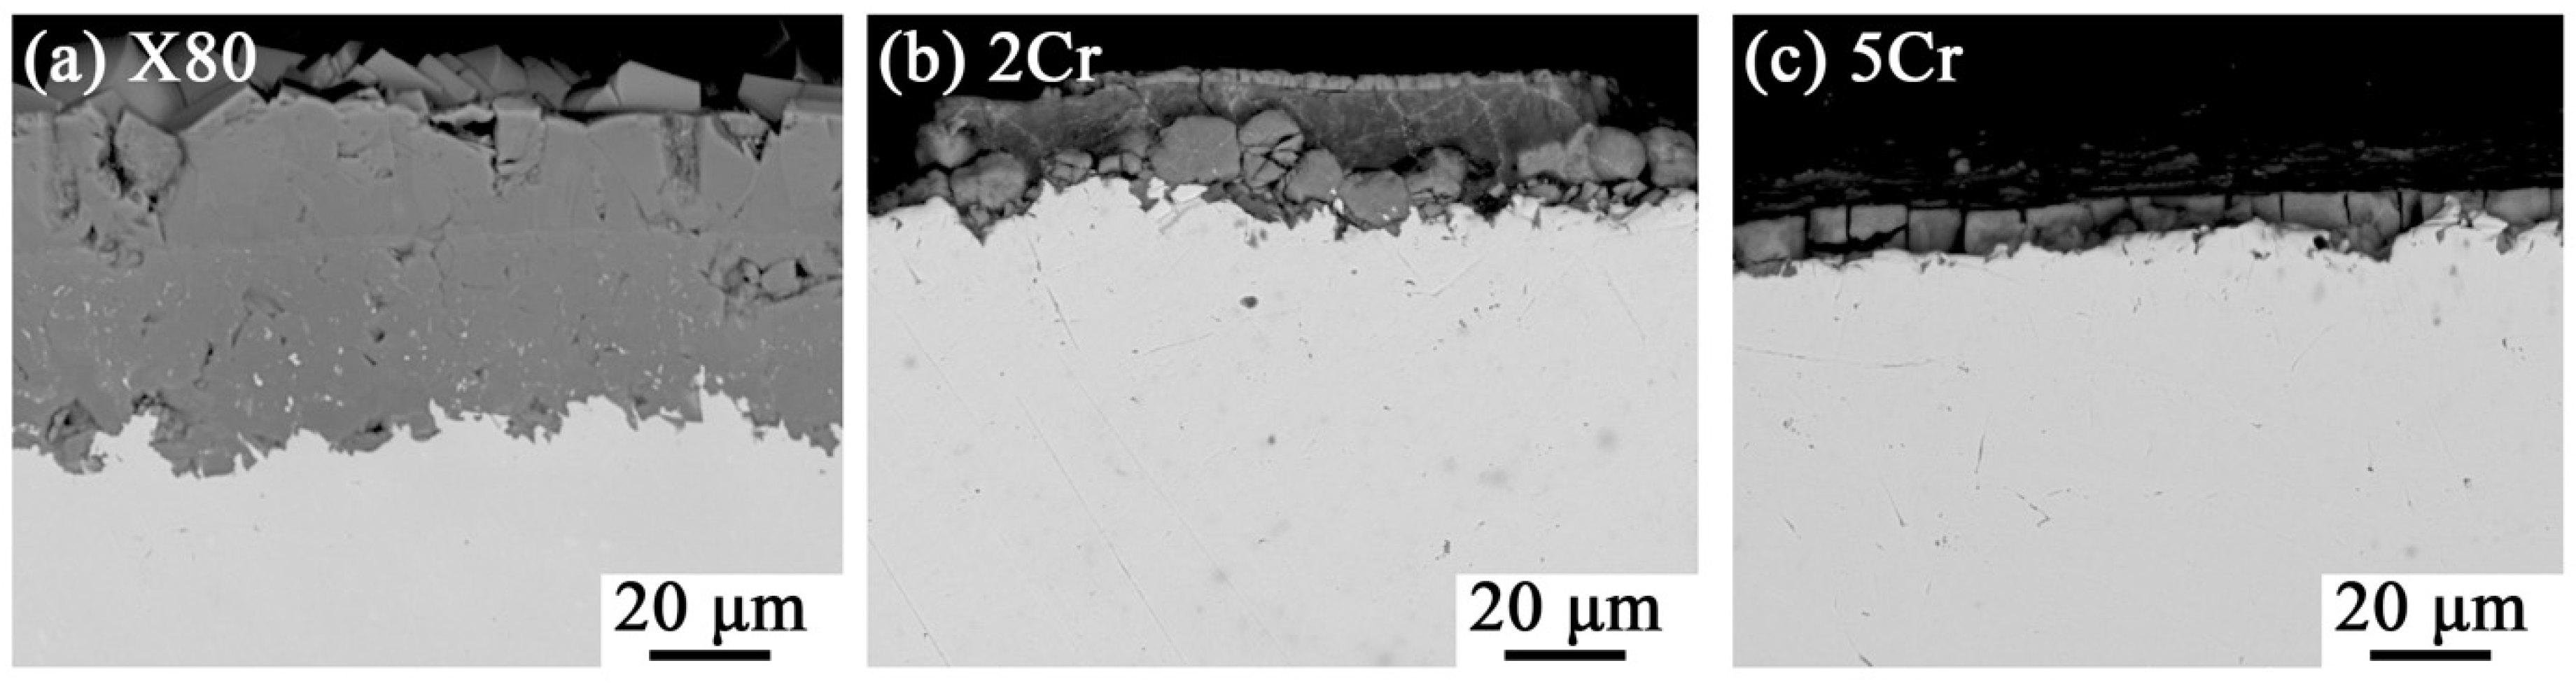
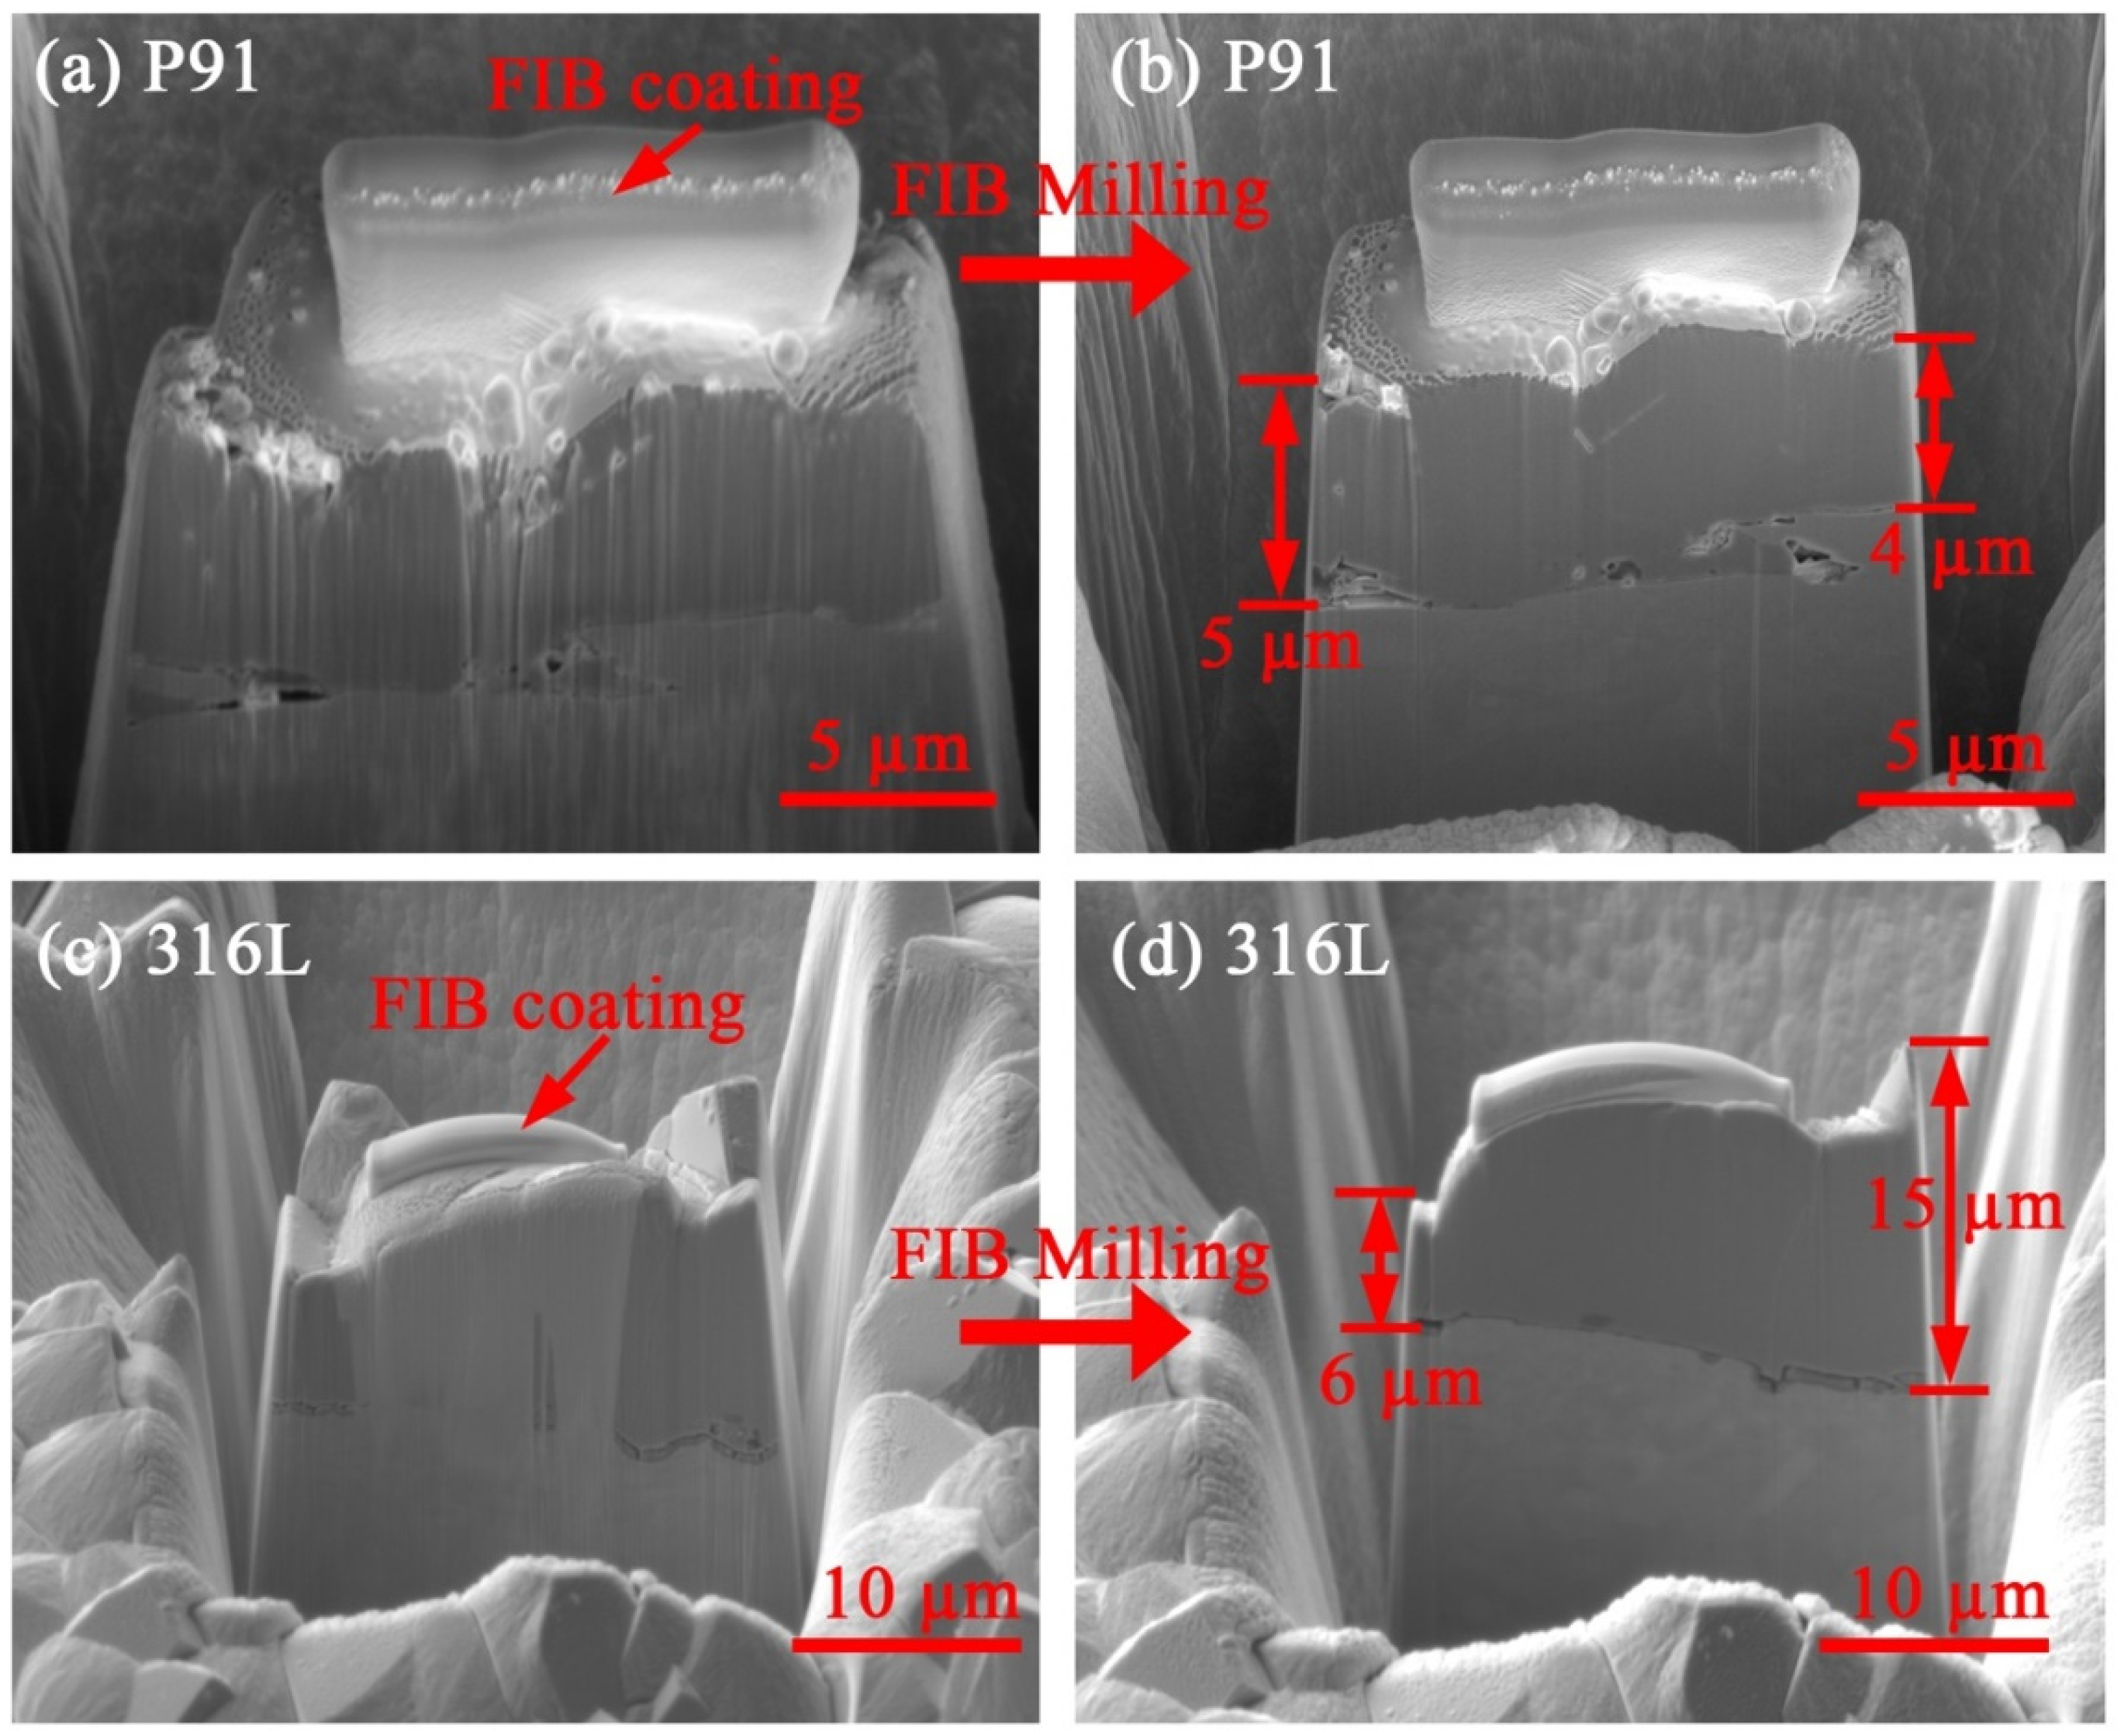
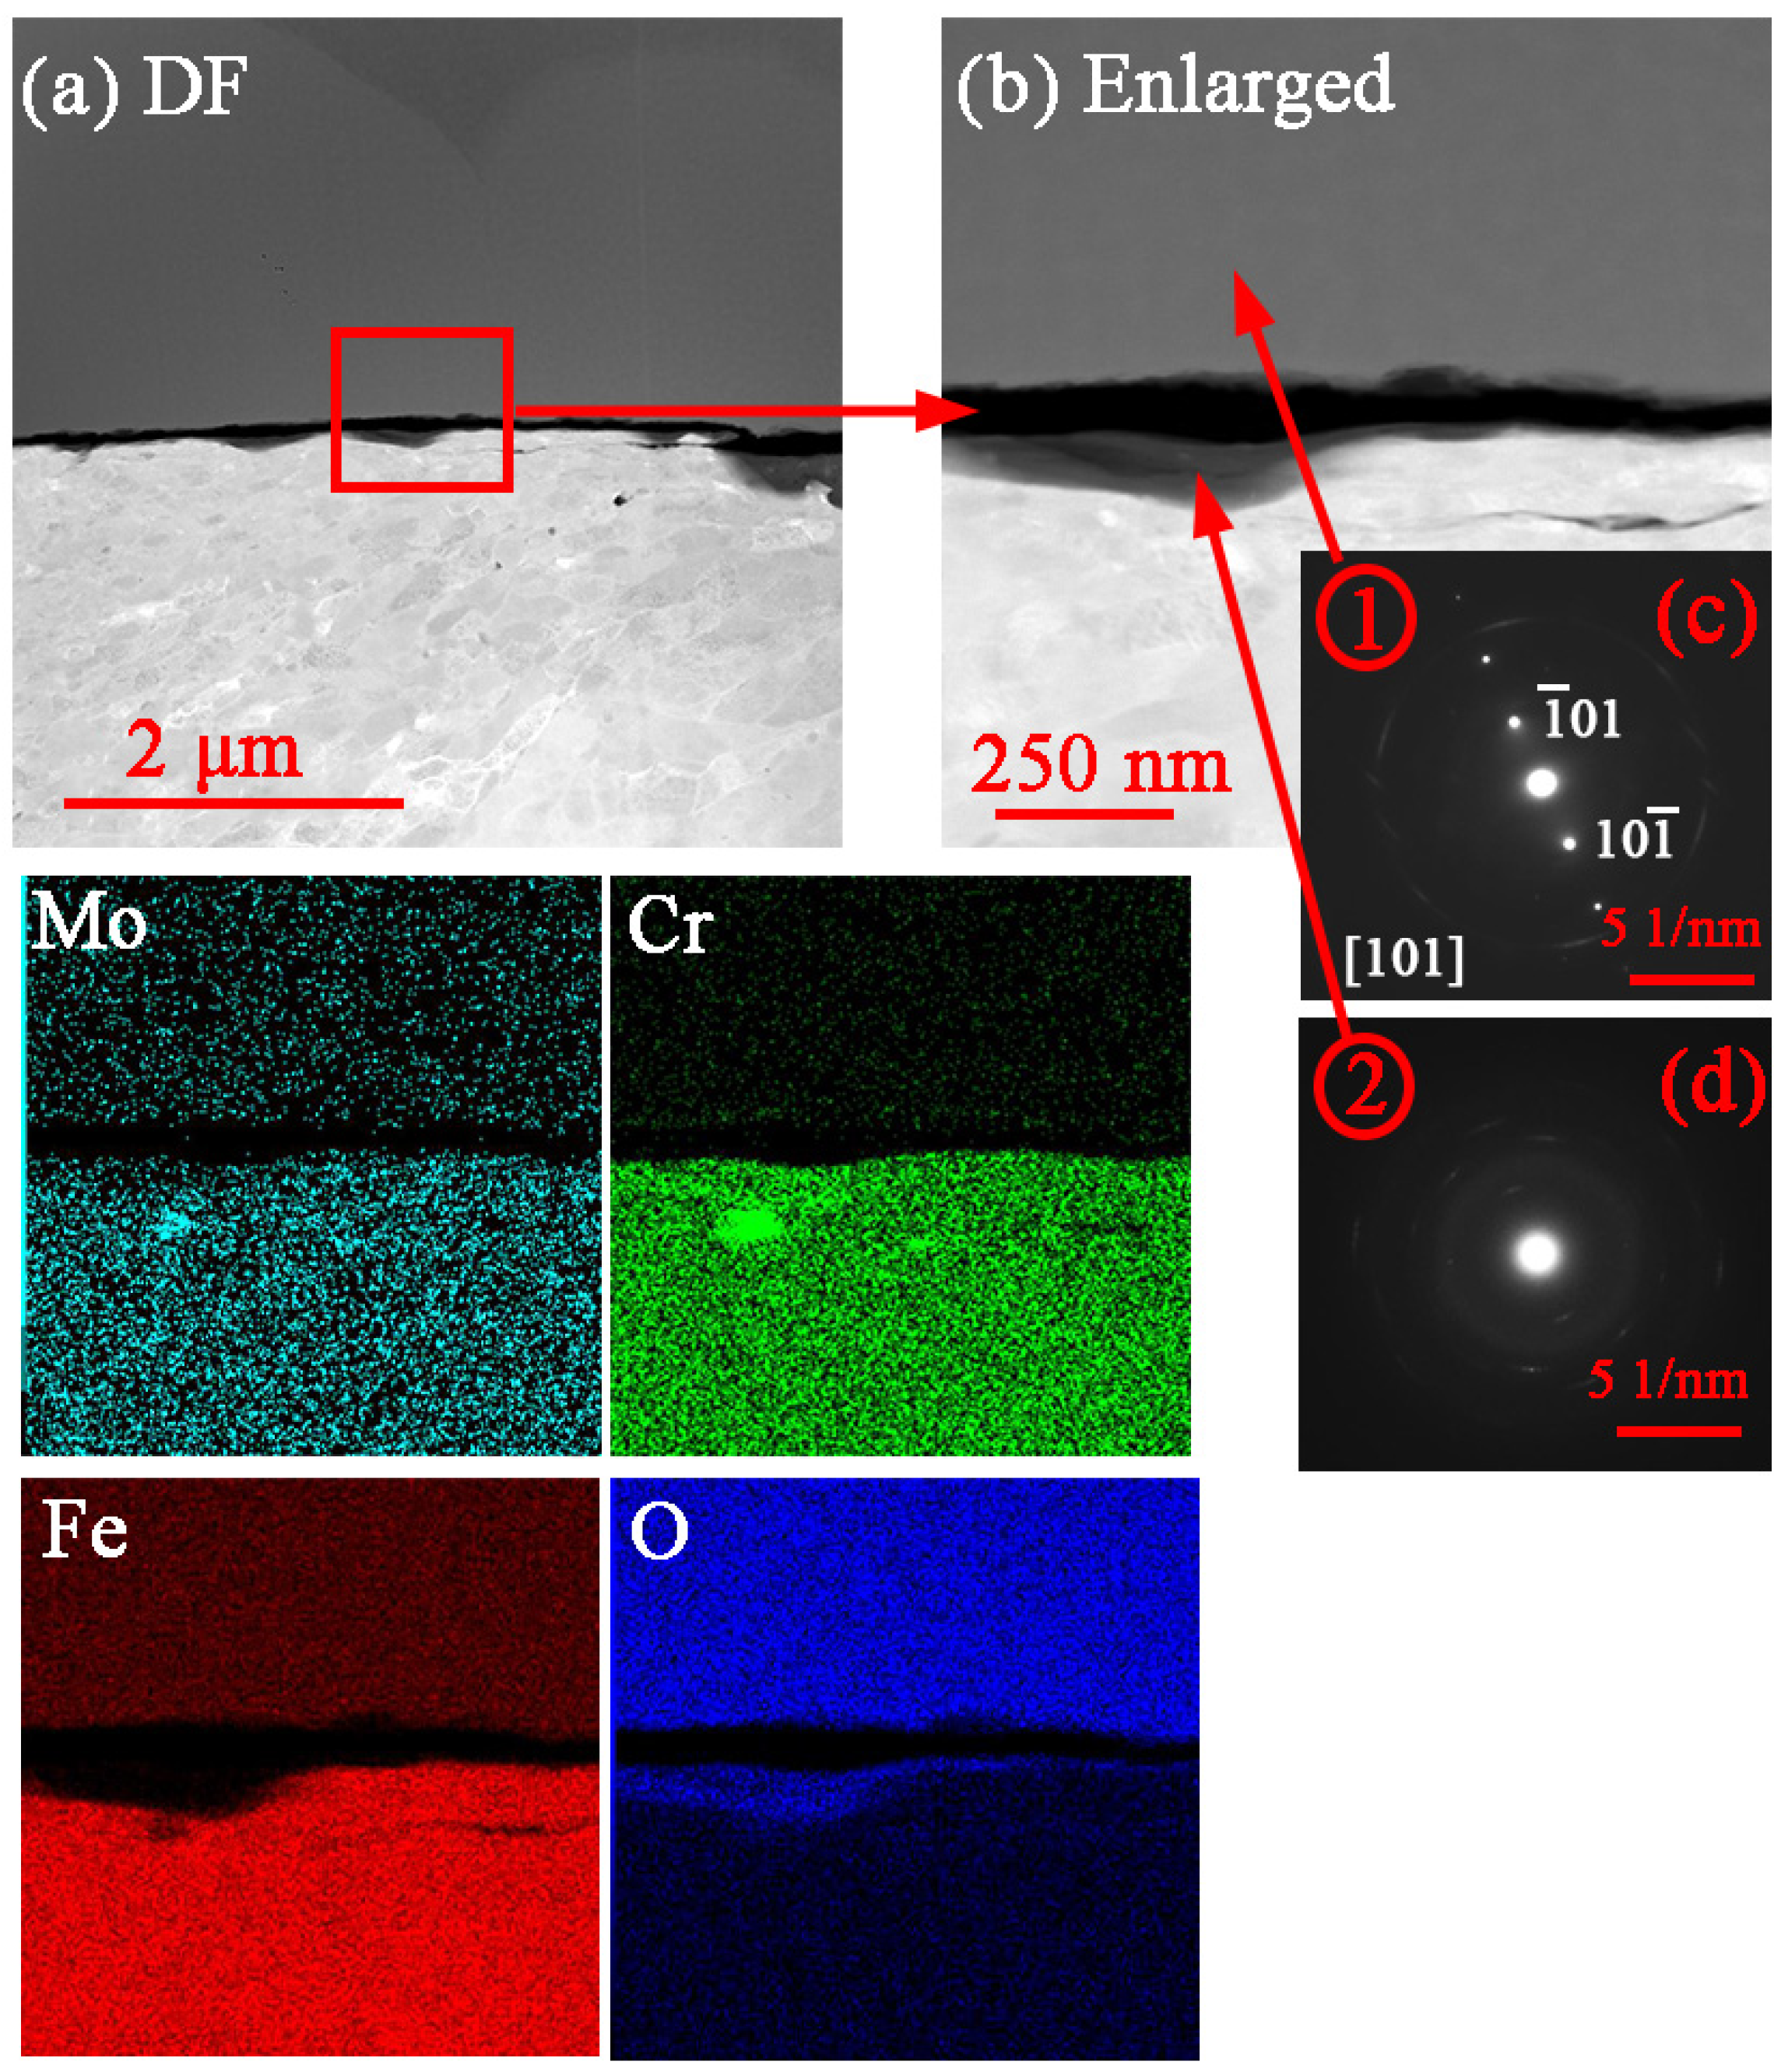
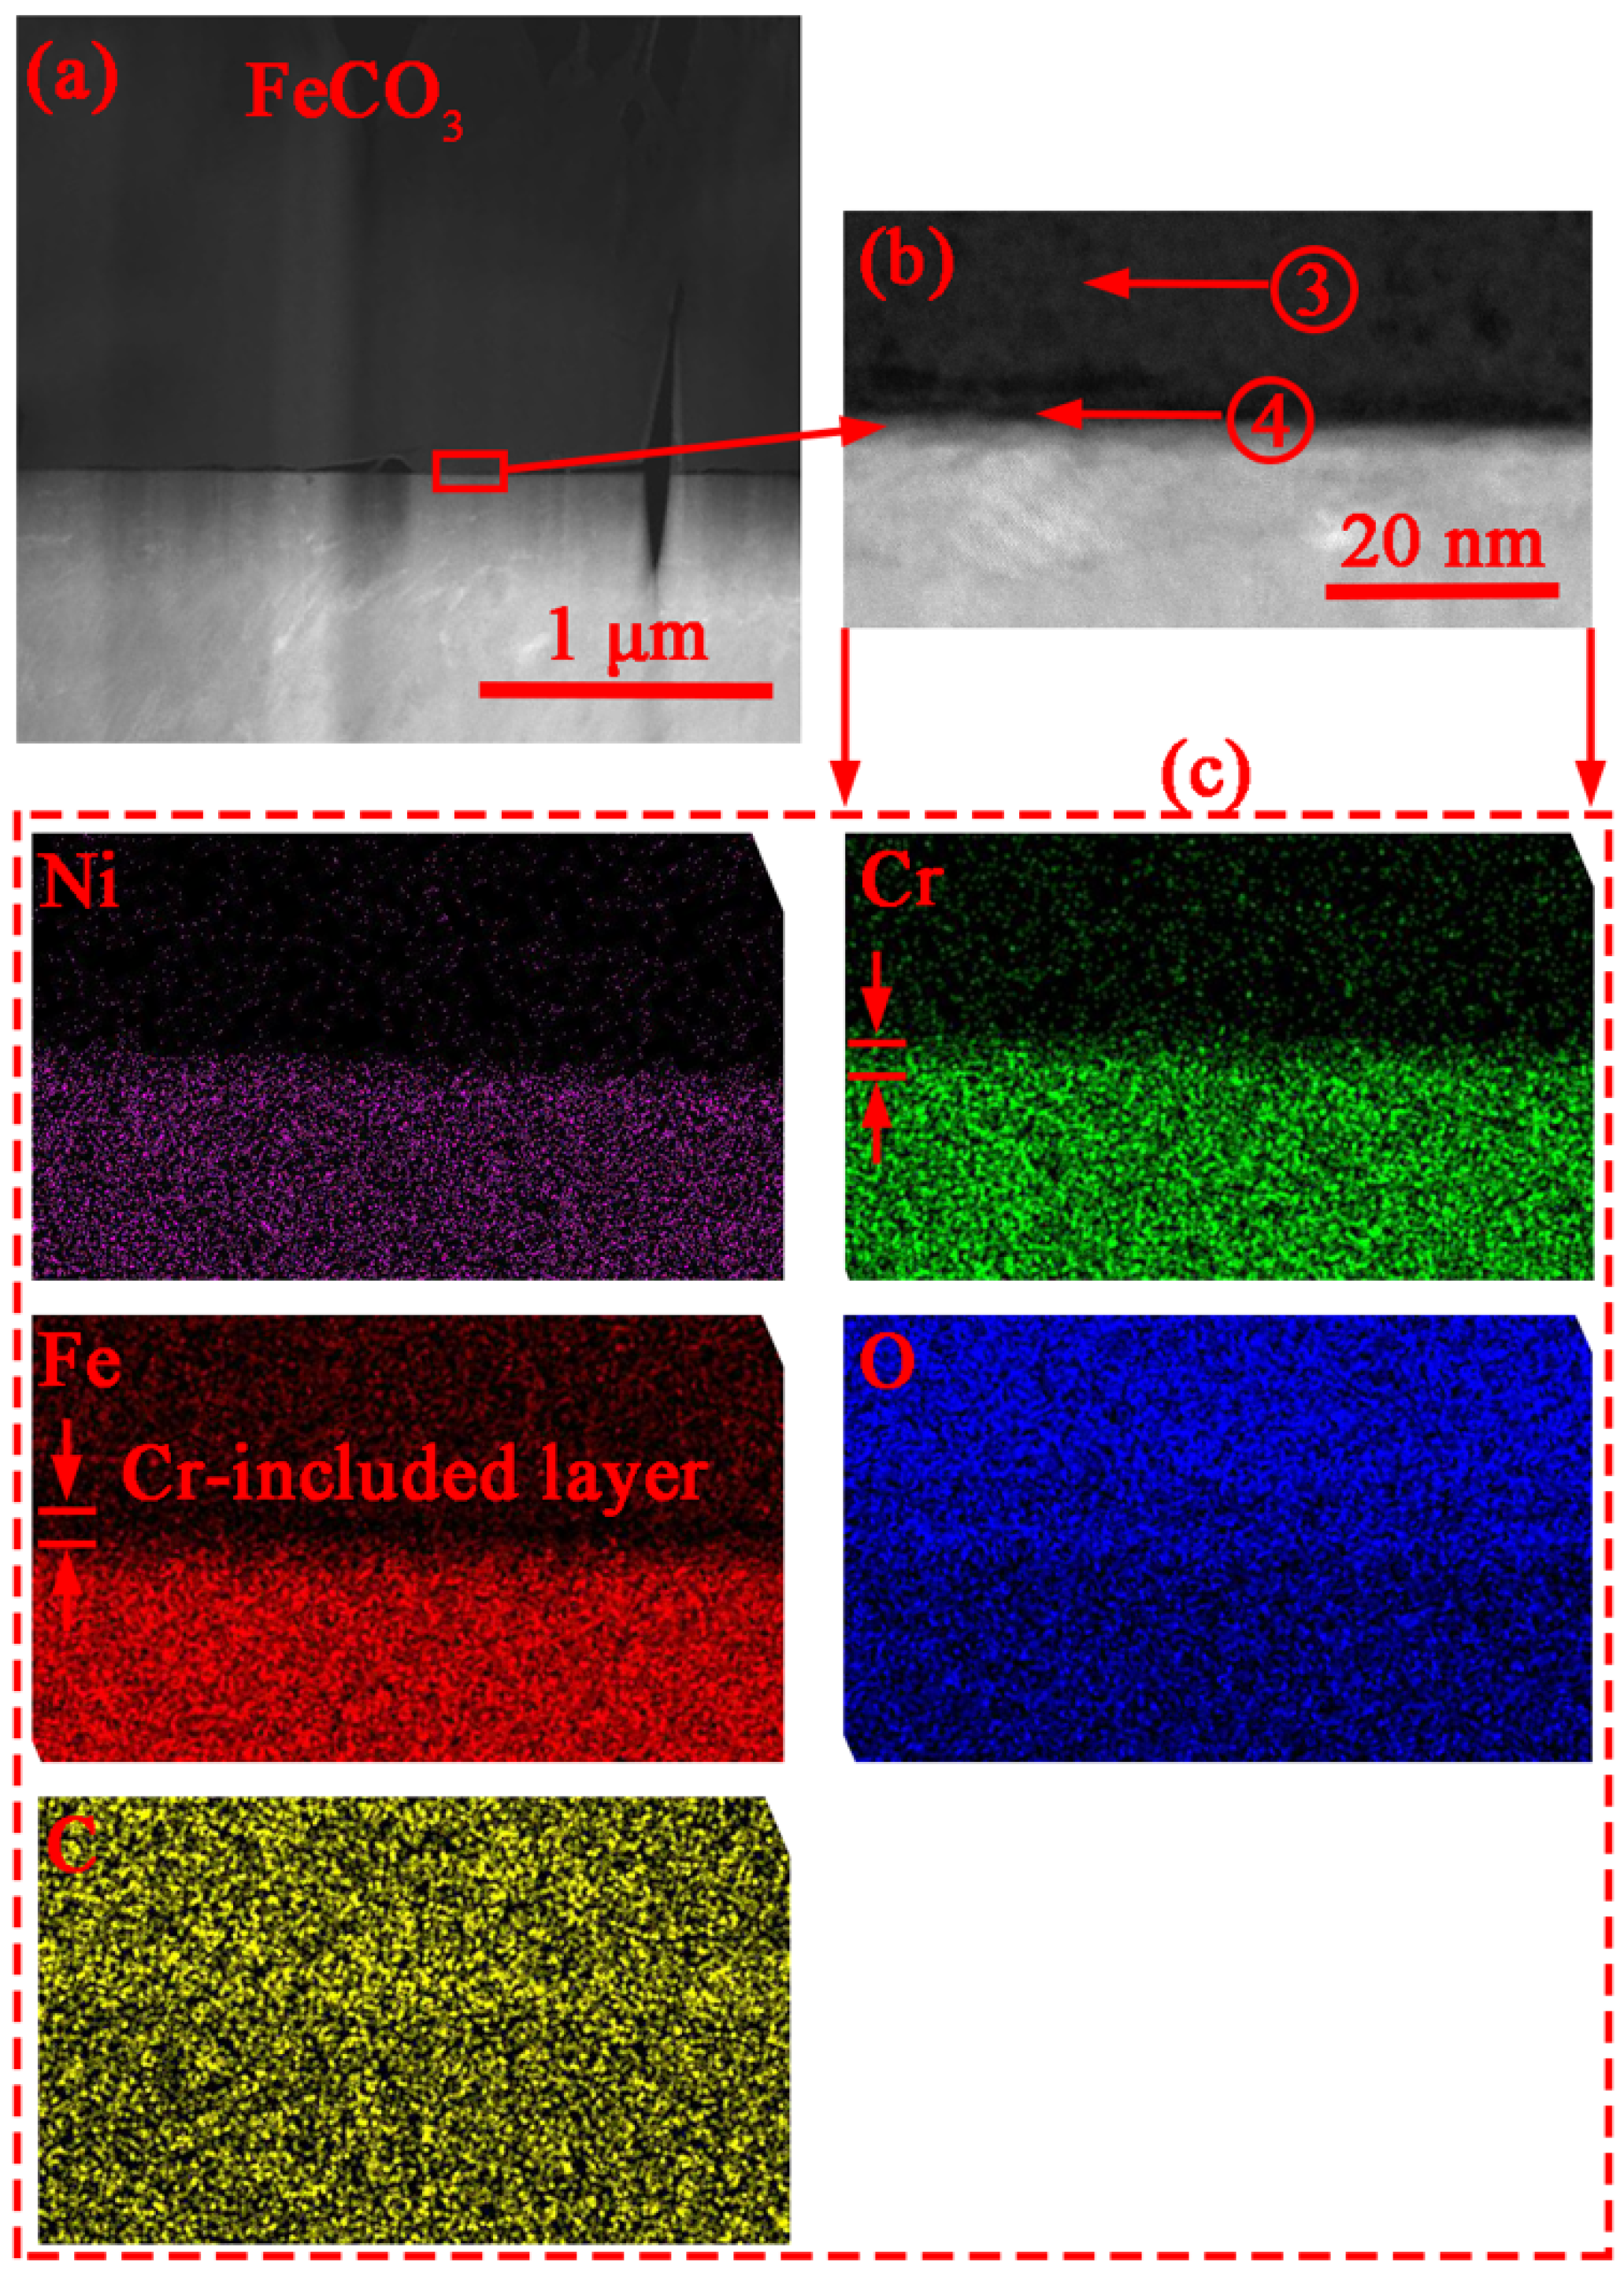
3.2. Corrosion Product Characterization

Figure 3 shows the photographic images and XRD spectra of all the alloys after being exposed to s-CO2-saturated SW at 50 °C and 8 MPa for 96 h. Compared with freshly prepared specimens with a metallic color, the dark color presented on X80, 2Cr, and 5Cr steels suggested the formation of thick corrosion layers on their surface. Unlike them, P91 exhibited a lighter dark color on its surface, implying the presence of a thinner corrosion layer on its surface. For the alloys with a higher Cr content, their surface color was brighter compared to P91. To identify the phase compositions of the formed corrosion products, XRD analyses were conducted, and the collated XRD spectra are shown in Figure 3. The results indicate that corrosion products formed on these alloys are mainly composed of iron carbonate (FeCO3, ICDD PDF No. 29-0696), along with their respective substrates.
Based on the above results, the corroded surfaces of the samples in the s-CO2-saturated SW were subjected to further SEM/EDS examinations on elemental distribution mapping. The backscattered electron (BSE) images obtained are presented in Figure 4. X80 formed a dense corrosion layer, while corrosion layer spalling and/or microcrack formation occurred on 2Cr and 5Cr surfaces. With an increase in the Cr content, the surface morphologies of corroded P91 and 316L were different from the low-Cr steels as relatively uniform and small crystalline products were presented on them. For Alloy 800 with a Cr content close to 20%, a very thin and compact layer was grown on its surface after exposure. To analyze the elemental variation and distinguish the corresponding phases as shown in the XRD spectra (see Figure 3), point-scanning EDS analyses were carried out at specific sites marked on the SEM images, and the results are listed in Table 2 (Sites #1 to #8). To improve the accuracy of the results, the element composition of each area was collected five times. Figure 4 presents the EDS spectra for sites #4 and #5, illustrating the process of characterizing elemental composition. The uniform layer (site #1) on the surface of X80 is composed of Fe, C, and O, consistent with the XRD results. Similar to X80, the outer corrosion layer on 2Cr (site #2) and 5Cr (site #4) also consisted of Fe, C, and O. But their inner corrosion layer (sites #3 and 5) had Cr, and the concentration of the Cr cation in the layer likely increased with an increase in the Cr content in the bulk steels. A similar two-layer structure was also found on a 3Cr steel after being exposed to a NaCl solution saturated with 0.8 MPa CO2 for 32 h, where the outer layer was FeCO3 and the inner layer was a mixture of amorphous FeCO3 and Cr(OH)3 [34]. These results suggest that the corrosion process of low-Cr (≤5 wt.%) steels in CO2 or a high-pressure s-CO2-saturated NaCl solution might be dominated by the same mechanism. The results in Figure 3 and Figure 4 also indicate that the inner Fe/Cr layer might be much thinner compared to the outer FeCO3 layer on the steels. For the alloys (P91, 316L, and Alloy 800) with a higher Cr content, the EDS results for sites #6, 7, and 8 show the surface corrosion layers on these alloys are mainly composed of Fe, C, and O, consistent with the XRD results.
As corrosion layer spalling and microcracking occurred on 2Cr and 5 Cr steels, EDS mapping analyses were also conducted on the two steels, and the results are presented in Figure 5. The O element is likely similar for both the outer and inner layers, but Cr occurs in the inner layer. Upon comparing the enlarged SEM images in Figure 5, it was observed that the two steels had a relatively dense Cr-included inner layer, but the outer FeCO3 layer grown on 5Cr steel was somewhat looser than that on 2Cr steel.
As the above characterization results are insufficient to reveal the role of Cr content in the alloys on corrosion resistance improvement, cross-sectional examinations of corroded samples were performed to reveal the potential multiple-layer depth information. As stated above, the cross-sectional samples of X80, 2Cr, and 5Cr steels, after being exposed to the s-CO2-saturated SW for 96 h, were prepared using cold mounting with epoxy and the saw-cutting method. Figure 6 illustrates the SEM cross-sectional results of the three steels. A single, dense, FeCO3 layer with an average thickness of approximately 70 μm was grown on X80 steel. On the other hand, the cross-sectional morphology of 2Cr indicated that two distinct layers were presented with a total thickness of about/approximately 25 μm. The average thickness of the inner Cr-included layer was around 10 μm. In the case of 5Cr, the poor adhesion of the outer-layer FeCO3 on the surface resulted in only the inner layer being left, and visible with a thickness of ~5 μm. These cross-sectional results are in agreement with the surface analyses shown in Figure 4 and Figure 5. Moreover, these observations as well as the obtained corrosion rates (see Figure 2) suggest that the three low-Cr alloys would experience active corrosion in the s-CO2-containing environment, and their long-term corrosion rates are likely to remain at high levels, close to those obtained from 96 h of testing.
Based on the SEM examination on cross-sections of alloys (P91, SS316L, and Alloy 800) with a Cr content higher than 9%, only a single corrosion product of FeCO₃ was detected, different from that formed on 2Cr and 5Cr alloys. Consistent with the corrosion rate results, there is a threshold Cr content (~9%) above which the alloys have sufficient resistance to s-CO2 environmental attacks. Thus, the tested samples of P91 (close to the threshold) and SS316L (above the threshold) were selected for FIB/TEM characterization to further clarify the role of alloying elements, particularly Cr, on corrosion in the s-CO2-saturated saline water environment. Figure 7 shows the SEM images taken during the FIB operation to produce cross-sectional samples for TEM examinations. A uniform and compact double-layer structure formed on the two steels after exposure. Compared with P91, the outer corrosion layer (FeCO3) formed on SS 316L was thicker, but the inner Cr-included layer became thinner. Note that microvoids and cracks were artificially introduced and observed on the sectional areas during the FIB operation, which could be attributed to volume expansion-induced stress accumulation within formed corrosion layers and the mismatch of mechanical properties among the two layers and substrate.
Figure 8 shows the cross-sectional TEM analysis results for the P91 sample. The TEM DF image (Figure 8a) of P91 confirms a thin layer is present between the outer FeCO3 layer and substrate, and the corresponding EDS mapping results (see Figure 8 and Table 3) show the existence of Cr cations within the layer. As the thin Cr-included layer was partially peeled off during FIB operation, the Cr content within the layer could be higher than that listed in Table 3. Moreover, the selected-area electron diffraction (SAED) results reveal that the outer layer (Figure 8c) is crystalline FeCO3 and the Cr-included inner layer is an amorphous structure (Figure 8d). Furthermore, only a trace amount of Ni cation was observed along the formed corrosion layer, suggesting that the alloying element, Ni, in the steel was unlikely involved in the corrosion process in the testing environment. In addition, Mo cations were found to be uniformly distributed within the outer FeCO3 and inner Cr-rich layers instead of local accumulation within the Cr-rich layer, further confirming that the addition of a small amount of Mo (≤1%) to Fe-based steels could not lead to a remarkable improvement of their corrosion resistance in such a specific s-CO2-related environment. As former studies reported that the presence of Mo may suppress the chemical dissolution of formed Cr-rich oxides and enhance their resistance to pitting [35,36], further investigation is needed to explore the performance of Fe-based steels with a higher Mo content and clarify the role of Mo in corrosion in s-CO2 environments.
The dark-phase (DF) image reveals the outer FeCO3 layer on the surface, consistent with the above surface characterization results. Upon enlarging the interface between the FeCO3 layer and substrate, a thin secondary layer is visible at the interface (Figure 9b), and corresponding EDS mapping analyses show that this is a Cr-included layer, which can act as a major barrier to resist an attack from s-CO2-saturated SW. Localized chemical compositions of regions 3 and 4 were collected and are provided in Table 3, in which region 3 consists of Fe, C, and O, and region 4 contains certain amounts of Cr cations. In general, the TEM results are consistent with the corrosion rates identified on P91, SS316L, and Alloy 800, indicating that they are suitable for next-phase long-term corrosion kinetic assessments to determine whether their corrosion rates follow linear, parabolic, or exponential laws with time.

4. Discussion

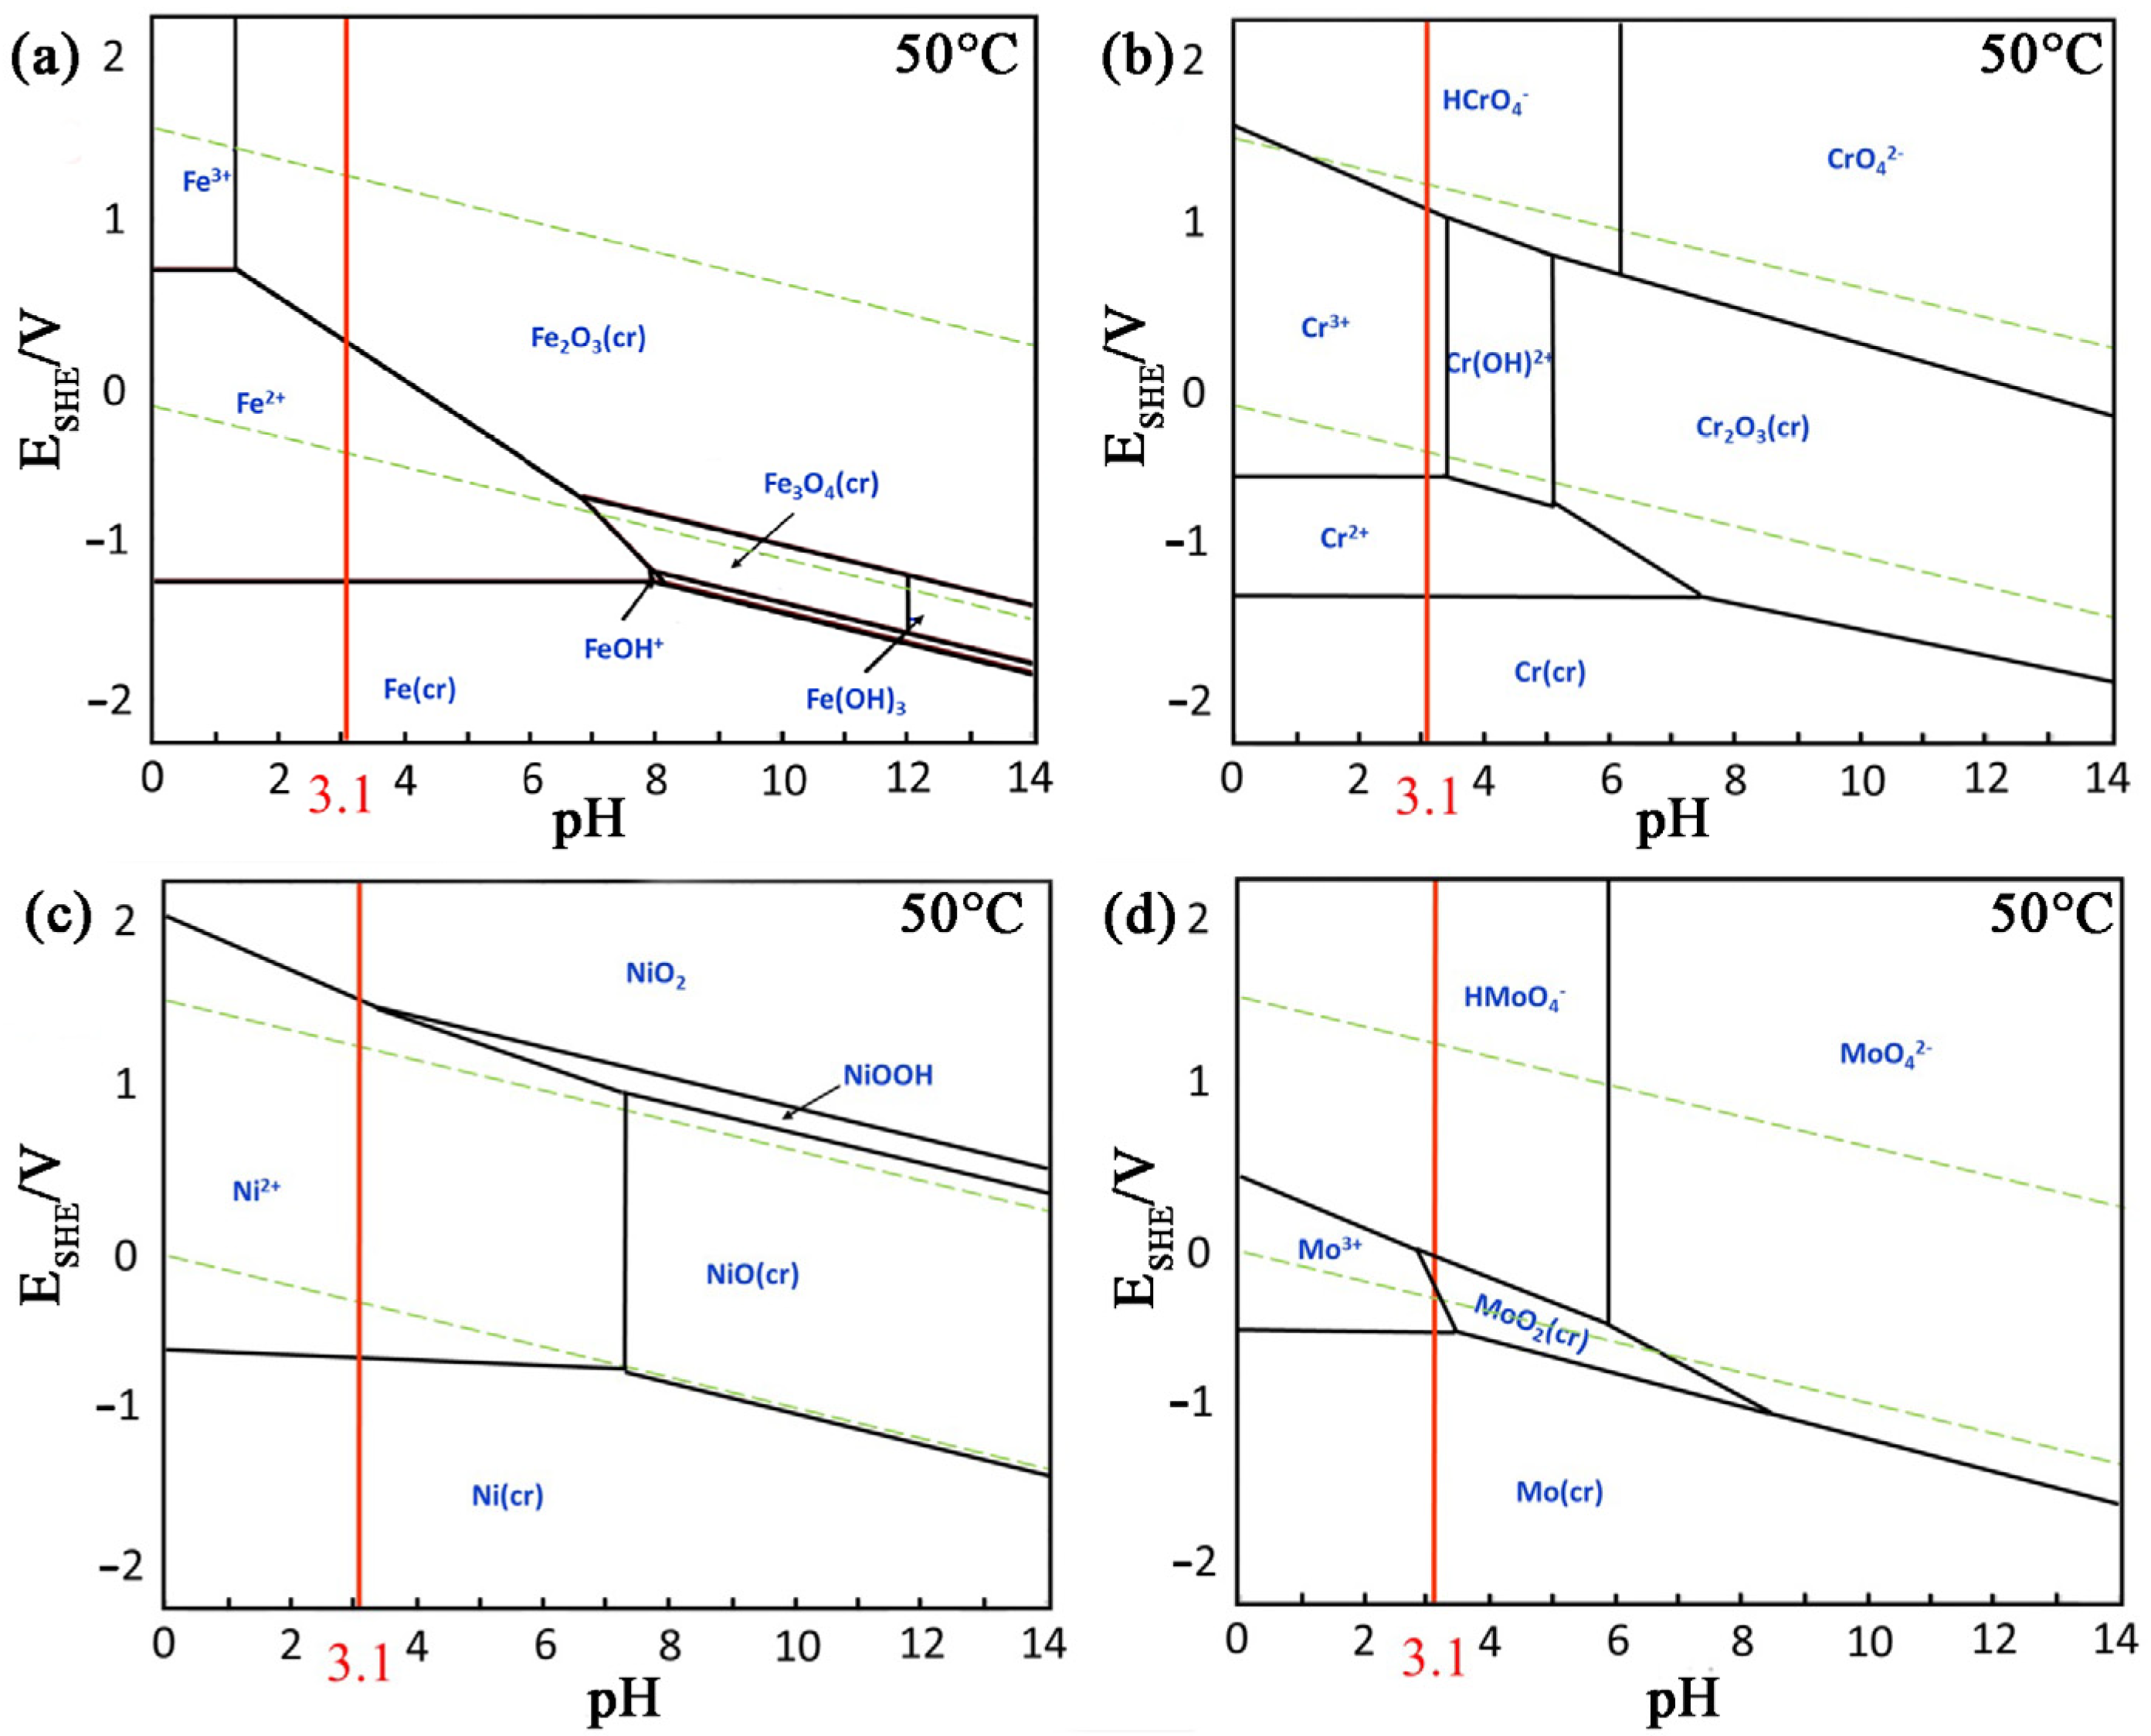
4.1. Thermodynamic Calculation of the Tested Alloy

In the s-CO2-saturated SW solution, the dissolution of CO2 into 3.5% NaCl through reactions (3)–(5) leads to the formation of an acidic environment containing H+, HCO3, and CO32−.
C O 2 + H 2 O H 2 C O 3
H 2 C O 3 H + + H C O 3
H C O 3 H + + C O 3 2
According to the previous studies [28,37], increasing s-CO2 pressure leads to higher acidity levels, and the pH value of the SW solution in this study is around 3.1. In the s-CO2-saturated NaCl solution, the corrosion process of an alloy is dominated by electrochemical reactions as follows [28].
Anodic reactions [38]:
M M n + + n e
Cathodic proton reduction [39,40]:
2 H + + 2 e H 2 ( p H < 4 )
As shown in Table 1, four alloying elements, including Fe, Cr, Ni, and Mo, are major contributors to the corrosion performance of alloys tested in this study. Based on the data retrieved from a public thermodynamic database at room temperature and commercial chemical software Hydra-Medusa V. 1, the electrochemical potential of an alloy element to form a specific compound in the s-CO2-saturated NaCl solution at 50 °C was calculated, and the corresponding Pourbaix diagram of this alloy was constructed. Detailed information about the Pourbaix diagram’s construction can be found in our recent publications [41,42]. Figure 10 presents the established Pourbaix diagrams of the four alloying elements in the testing solution. At a pH of 3.1, only Mo could form a stable oxide (MoO2) instead of Fe, Ni, or Cr. Thermodynamically, Fe, Ni, or Cr suffers active corrosion, while Mo likely experiences passivation in such an acidic s-CO2 environment. However, as shown in Figure 2, the corrosion rates of the alloys decrease with increasing Cr content in them, indicating that the corrosion processes are controlled by the formation and chemical dissolution of the carbonates and/or oxides of these alloying elements in the alloys in the s-CO2 SW at 50 °C. In addition, based on the testing results (see Figure 2 and Figure 8) and thermodynamic prediction (Figure 10d), it is likely that there is a critical Mo content in the alloys, below which the addition of Mo only has a marginal effect on their corrosion resistance improvement in s-CO2-saturated aqueous solutions.

4.2. Formation and Dissolution of Carbonate and Oxide

The above post-mortem characterization of corroded samples shows that FeCO3 layers are formed on all the tested alloys. It is thus necessary to clarify FeCO3 formation. As Fe is unlikely passivated in s-CO2 SW, FeCO3 formation likely involves the active dissolution of Fe, followed by FeCO3 precipitation. The electrochemical reactions involved in FeCO3 precipitation include [43]:
F e 2 + + C O 3 2 F e C O 3
F e 2 + + 2 H C O 3 F e ( H C O 3 ) 2
F e ( H C O 3 ) 2 F e C O 3 + C O 2 + H 2 O
Supersaturation (S) is a critical driver of FeCO3 precipitation involving nucleation and particle growth processes [44]. S is defined as S = ( a F e 2 + · a C O 3 2 ) / K s p [45], where a F e 2 + and a C O 3 2 (in mol/L) are the ferrous and carbonate ion activities, respectively, and K s p (in mol2/L2) is the solubility product associated with FeCO3. At lower S values, particle growth is predominant; higher values favor nucleation, leading to amorphous or nano-crystalline film formation [34]. In this study, the S value is supposed to be high for low-Cr steel (<3 wt.%.) and low for steels/alloys with a Cr value larger than 3 wt.%. Except for those, the pH can also remarkably affect the morphology and integrity of FeCO3 films. With a decrease in pH, the critical Fe2+ concentration required to exceed FeCO3 solubility significantly increased [46,47]. For example, reducing the pH from 6 to 5 and then from 5 to 4 increases Fe2+ solubility by 100 times and 5 times, respectively [44]. A study on X65 steel in a 3.5 wt.% NaCl solution at 50 °C found that decreasing the pH from 7.5 to 3.8 resulted in the replacement of a protective crystalline FeCO3 layer with non-protective amorphous FeCO3 film [48]. Different from this report, the results in this study show that a thick, non-protective, but crystalline, FeCO3 layer was formed on all the tested alloys. The difference could be attributed to the presence of high concentrations of HCO3 and CO32− enhancing the nucleation and growth of FeCO3 crystals in the s-CO2 environment.
The formation of a non-protective FeCO3 layer on the alloys may also be related to environmental temperature. It is suggested that, at low temperatures (<80 °C), controlling the solution’s pH above 6 is necessary for the formation of a protective film [49]. For X70 steel, it was found that a compact and protective FeCO3 layer could be formed only in the solutions with a pH range of 5.5–6.5 at temperatures ≥ 75 °C [50]. It is worth noting that the solubility of CO2 in a brine solution exhibits a negative correlation with temperature, indicating the pH value of the solution increases with the temperature [51]. These observations are consistent with our findings that a protective FeCO3 layer cannot be formed on the alloys with different alloying elements in the s-CO2-saturated NaCl solution at 50 °C. Therefore, the corrosion-resistance improvement of the alloys, as shown in Figure 2, is due to the formation of an inner (Fe, Cr) oxide layer.
Thermodynamically, Fe, Cr, and Mo could form their oxides in an aqueous solution at 50 °C, as predicted in Table 4. Once formed, they would experience chemical dissolution in the acidic s-CO2 SW. Compared to Fe oxides, the Cr-included layer and Cr oxide exhibit lower dissolution rates in an acidic solution [52,53,54]. With an elongated testing duration, a Cr-included inner layer would inevitably be formed on the alloy containing the Cr element, accompanied by the precipitation of a non-protective FeCO3 layer. Compared to FeCO3 and Fe oxide, the (Fe, Cr) oxide layer can act as a better barrier to: (1) reduce outward metal cations and inward oxygen anions mitigation within the corrosion layer [55], and (2) retard the electron transfer from the interface of corrosion layer/substrate to the interface of the corrosion layer/solution [10]. Increasing the Cr3+ content in the (Fe, Cr) oxide can lead to the formation of a more protective layer, as expected. Former studies on hot aqueous solutions indicated that only the alloys with a Cr content > 25 wt.% can form and maintain a thin and compact Cr2O3 layer [56,57]. These factors result in corrosion rates decreasing with increasing Cr content in the alloys, as shown in Figure 2. Another interesting observation is that the presence of Cr can also influence the adhesion between FeCO3 and (Fe, Cr) oxide. For the alloys with a Cr content ≤ 5 wt.%, the formed inner (Fe, Cr) oxide layer has poor adhesion with substrate or outer FeCO3 layer (see SEM results in Figure 4). Microstructural analyses of SEM images in Figure 5 show that 2Cr steel forms a less cohesive amorphous layer topped by a dense FeCO3 layer, whereas 5Cr steel features the opposite: a dense amorphous layer topped by a less-cohesive FeCO3 layer. However, further increasing the Cr content above 8.9% can noticeably improve the adhesive property of the inner (Fe, Cr) layer with both the substrate and FeCO3 layer, as demonstrated by FIB-SEM sample images in Figure 7. Ni cations were not detected within the corrosion scales, suggesting that the improved performance of these alloys is primarily due to their Cr content, accompanied by unrevealed indirect benefits from Ni. This will help achieve the compact and protective integrity of the formed corrosion layer and effectively resist s-CO2 environmental attacks. Although the selection of these alloys with a Cr content > 9% inevitably leads to a relatively high capital investment, the long-term successful operation of the system core components can significantly reduce the operation cost to an even lower value compared to that of low-Cr alloys with poor corrosion resistance in s-CO2 environments. Note that the price increased by the partial replacement of Fe with Cr in the constructional alloys will be much lower than the cost to replace core components during the service [58].
In addition, Cl is a notorious agent that triggers and propagates localizing pitting. Many studies have reported that Cl ion can be preferentially adsorbed and accumulated at oxide defects to replace O2− for the formation of highly soluble metal–anion complexes [59]. However, in this study, pitting did not occur on the tested alloys. This can be due to: (1) the relatively high chemical dissolution of the corrosion layer suppressing the localized accumulation of Cl with corrosion layers. (2) Cl-induced pitting being inhibited by HCO3. HCO3 was found to act as a pitting inhibitor against chloride pitting in an aqueous solution for Fe-based steels and Ni-based alloys [23,60]. (3) The influence of Cl on s-CO2 solubility in aqueous solutions. It was found that the solubility of CO2 decreases with increasing NaCl concentration in the solution [61].

5. Conclusions

This study investigated the corrosion of seven commercial alloys in saline water (3.5 wt.% NaCl) in an 8 MPa s-CO2 environment at 50 °C over 96 h. The key findings are summarized as follows:
(1)
Corrosion rates consistently decrease with increasing Cr content in Fe-Cr and Fe-Cr-Ni alloys. There is a critical Cr content (~9 wt.%), above which the alloys exhibit a satisfactory corrosion performance for s-CO2 permanent storage or enhanced oil recovery in saline water reservoirs.
(2)
During exposure to the s-CO2 saline water environment, a non-protective FeCO3 layer forms on the constructional alloys, likely via a precipitation mechanism due to environmental acidity and the presence of high amounts of HCO3 and CO32−. For alloys with more than 2 wt.% Cr, an inner Cr-enriched layer forms between the outer FeCO3 layer and the substrate, acting as the main barrier controlling the corrosion process in the s-CO2 saline water. The properties of the inner Cr-containing layer significantly improve with increasing bulk Cr content above ~9 wt.%.
(3)
In the s-CO2 saline water environment, pitting is unlikely to occur on candidate construction alloys due to the solution’s acidity and the presence of bicarbonate ions, even though the Cl ion concentration reaches up to 3.5 wt.%.
(4)
Alloys with a Cr content above 9% are suitable candidates for next-phase long-term corrosion kinetic evaluations. Given the complicate chemistry of s-CO2 storage environments, it is highly recommended to assess their performance in s-CO2-saturated solutions with typical ions (such as, Ca2⁺, Mg2⁺, or S2⁻ presented in the reservoirs) at higher temperatures, as the testing temperature (50 °C) in this study is the lower end of the 50–80 °C operation range under s-CO2 storage.

Author Contributions

Conceptualization, Y.Z. and J.L.; Methodology, Y.Z.; Software, M.L.; Validation, M.L.; Formal analysis, H.S. and M.L.; Investigation, H.S. and J.L.; Writing—original draft, H.S.; Writing—review & editing, H.S., M.L., Y.Z. and J.L.; Supervision, J.L.; Project administration, J.L.; Funding acquisition, Y.Z. and J.L. All authors have read and agreed to the published version of the manuscript.

Funding

This study is supported by the Natural Resource Canada Clean Energy Production and CO2 Capture, Utilization and Storage (CCUS) programs, and Natural Sciences and Engineering Research Council of Canada (NSERC).

Data Availability Statement

The original contributions presented in this study are included in the article. Further inquiries can be directed to the corresponding authors.

Conflicts of Interest

The authors declare no conflict of interest.

Appendix A

Table A1. Summary of studies for corrosion in the S-CO2-saturated H2O-rich phase.
MaterialT
/°C
P
/MPa
NaClTime/hRate
/mm/y
Refs.
X70809.53.5 wt.%0.5119Gao 2015 [16]
X70809.5749.5
X70809.51257.4
X70809.52437
X70809.5967
X70809.51685
X70809.53841.5
X6580103.5 wt.%2408.46Gao 2016 [27]
X65 1801024015.48
P110 280103.5 wt.%24010Gao 2016 [21]
3Cr 280102402.2
316L 280102400.018
P110809.53.5 wt.%0.584.2Gao 2018 [20]
P110809.51248
P110809.55014.4
P110809.59613.0
P110809.51686.12
P110809.53841.8
X65601035,249 ppm Cl620Hua 2018 [30]
X6560102414
X656010487.5
X656010963.8
X6560101.0 wt.%610.8Hua 2020 [62]
1Cr6010610.5
3Cr6010610.1
5Cr601066.8
X6560101921.5
1Cr60101921.9
3Cr60101922.0
5Cr60101922.1
N808083.0 wt.%145Zhang 2021 [63]
N808081229
N808082420
N808084814
N80808968
N808081686
X65 35083.5 wt.%1.521Sun 2021 [12]
X65 3508244
X65 3508722.4
X65508DI965.0Li 2024 [26]
X655083.5 wt.%961.5
X65758961.0
X651008960.9
Note: 1, 2, 3 are gas conditions. 1, with 50 ppmv H2S; 2, with saturated H2S; 3, with 10,000 ppmv of O2, SO2, and H2S, respectively.

References

  1. EEA. EN01 Energy Related Greenhouse Gas Emissions; European Environment Agency: Copenhagen, Denmark, 2011.
  2. Onyebuchi, V.; Kolios, A.; Hanak, D.; Biliyok, C.; Manovic, V. A systematic review of key challenges of CO2 transport via pipelines. Renew. Sustain. Energy Rev. 2018, 81, 2563–2583. [Google Scholar] [CrossRef]
  3. Gaurina-Međimurec, N.; Pašić, B. Design and mechanical integrity of CO2 injection wells. Rud. Geol. Naft. Zb. 2011, 23, 1–8. [Google Scholar]
  4. Melzer, L.S. Carbon Dioxide Enhanced Oil Recovery (CO2 EOR): Factors Involved in Adding Carbon Capture, Utilization and Storage (CCUS) to Enhanced Oil Recovery; Center for Climate and Energy Solutions: Washington, DC, USA, 2012. [Google Scholar]
  5. Kuuskraa, V.A.; Godec, M.L.; Dipietro, P. CO2 utilization from “Next Generation” CO2 enhanced oil recovery technology. Energy Procedia 2013, 37, 6854–6866. [Google Scholar] [CrossRef]
  6. Jung, W.; Nicot, J.P. Impurities in CO2-Rich mixtures impact CO2 pipeline design: Implications for calculating CO2 transport capacity. In Proceedings of the SPE International Conference on CO2 Capture, Storage, and Utilization, New Orleans, LA, USA, 10–12 November 2010; p. SPE-139712-MS. [Google Scholar]
  7. Wetenhall, B.; Race, J.; Downie, M. The effect of impurities on a simplified CCS network. In Proceedings of the PSIG Annual Meeting, Prague, Czech Republic, 16–19 April 2013; p. PSIG-1306. [Google Scholar]
  8. Global-CCS-Institute. The Global Status of CCS; Global CCS Institute: Melbourne, Australia, 2017. [Google Scholar]
  9. Lucci, A.; Demofonti, G.; Tudori, P.; Spinelli, C.M. CCTS (Carbon Capture Transportation & Storage) transportation issues. In Proceedings of the Twenty-first International Offshore and Polar Engineering Conference, Maui, HI, USA, 19–24 June 2011; p. ISOPE-I-11-162. [Google Scholar]
  10. Sun, H.; Wang, H.; Zeng, Y.; Liu, J. Corrosion challenges in supercritical CO2 transportation, storage, and utilization—A review. Renew. Sustain. Energy Rev. 2023, 179, 113292. [Google Scholar] [CrossRef]
  11. Cui, G.; Yang, Z.; Liu, J.; Li, Z. A comprehensive review of metal corrosion in a supercritical CO2 environment. Int. J. Greenh. Gas Control 2019, 90, 102814. [Google Scholar] [CrossRef]
  12. Sun, C.; Liu, J.; Sun, J.; Lin, X.; Wang, Y. Probing the initial corrosion behavior of X65 steel in CCUS-EOR environments with impure supercritical CO2 fluids. Corros. Sci. 2021, 189, 109585. [Google Scholar] [CrossRef]
  13. Xiang, Y.; Xu, M.; Choi, Y.-S. State-of-the-art overview of pipeline steel corrosion in impure dense CO2 for CCS transportation: Mechanisms and models. Corros. Eng. Sci. Technol. 2017, 52, 485–509. [Google Scholar] [CrossRef]
  14. Sim, S.; Cole, I.; Choi, Y.-S.; Birbilis, N. A review of the protection strategies against internal corrosion for the safe transport of supercritical CO2 via steel pipelines for CCS purposes. Int. J. Greenh. Gas Control 2014, 29, 185–199. [Google Scholar] [CrossRef]
  15. Barker, R.; Hua, Y.; Neville, A. Neville, Internal corrosion of carbon steel pipelines for dense-phase CO2 transport in carbon capture and storage (CCS)—A review. Int. Mater. Rev. 2016, 62, 1–31. [Google Scholar] [CrossRef]
  16. Wei, L.; Pang, X.; Liu, C.; Gao, K. Formation mechanism and protective property of corrosion product scale on X70 steel under supercritical CO2 environment. Corros. Sci. 2015, 100, 404–420. [Google Scholar] [CrossRef]
  17. Yevtushenko, O.; ßler, R.B. Water Impact on Corrosion Resistance of Pipeline Steels in Circulating Supercritical CO2 with SO2- and NO2-Impurities; NACE Corrosion: Houston, TX, USA, 2014; NACE-2014-3838. [Google Scholar]
  18. Pfennig, A.; Kranzmann, A. Effect of CO2 and pressure on the stability of steels with different amounts of chromium in saline water. Corros. Sci. 2012, 65, 441–452. [Google Scholar] [CrossRef]
  19. Huang, S.; Worthington, D.L.; Asta, M.; Ozolins, V.; Ghosh, G.; Liaw, P.K. Liaw, Calculation of impurity diffusivities in α-Fe using first-principles methods. Acta Mater. 2010, 58, 1982–1993. [Google Scholar] [CrossRef]
  20. Wei, L.; Gao, K.; Li, Q. Corrosion of low alloy steel containing 0.5% chromium in supercritical CO2-saturated brine and water-saturated supercritical CO2 environments. Appl. Surf. Sci. 2018, 440, 524–534. [Google Scholar] [CrossRef]
  21. Wei, L.; Pang, X.; Gao, K. Corrosion of low alloy steel and stainless steel in supercritical CO2/H2O/H2S systems. Corros. Sci. 2016, 111, 637–648. [Google Scholar] [CrossRef]
  22. Collier, J.; Papavinasam, S.; Li, J.; Shi, C.; Liu, P.; Gravel, J.P. Effect of impurities on the corrosion performance of steels in supercritical carbon dioxide: Optimization of experimental procedure. In Proceedings of the Corrosion Conference and Expo 2013, Orlando, FL, USA, 17–21 March 2013; p. NACE-2013-2357. [Google Scholar]
  23. Li, K.; Zeng, Y.; Luo, J. Condensed phase corrosion of P91 and DSS 2205 steels at advanced oxygen-fired pressurized fluidized bed combustion plants. Mater. Corros. 2020, 72, 757–771. [Google Scholar] [CrossRef]
  24. Zhang, Y.; Pang, X.; Qu, S.; Li, X.; Gao, K. The relationship between fracture toughness of CO2 corrosion scale and corrosion rate of X65 pipeline steel under supercritical CO2 condition. Int. J. Greenh. Gas Control 2011, 5, 1643–1650. [Google Scholar] [CrossRef]
  25. Zhang, Y.; Pang, X.; Qu, S.; Li, X.; Gao, K. Discussion of the CO2 corrosion mechanism between low partial pressure and supercritical condition. Corros. Sci. 2012, 59, 186–197. [Google Scholar] [CrossRef]
  26. Li, M.; Gross, A.; Taylor, B.; Zhang, H.; Liu, J. Effects of Cl-ion and temperature variations on steel corrosion in supercritical CO2 saturated aqueous environments. Process. Saf. Environ. Prot. 2024, 187, 1446–1453. [Google Scholar] [CrossRef]
  27. Wei, L.; Pang, X.; Gao, K. Effect of small amount of H2S on the corrosion behavior of carbon steel in the dynamic supercritical CO2 environments. Corros. Sci. 2016, 103, 132–144. [Google Scholar] [CrossRef]
  28. Li, K.; Zeng, Y. Advancing the mechanistic understanding of corrosion in supercritical CO2 with H2O and O2 impurities. Corros. Sci. 2023, 213, 110981. [Google Scholar] [CrossRef]
  29. Nešić, S. Key issues related to modelling of internal corrosion of oil and gas pipelines—A review. Corros. Sci. 2007, 49, 4308–4338. [Google Scholar] [CrossRef]
  30. Hua, Y.; Shamsa, A.; Barker, R.; Neville, A. Protectiveness, morphology and composition of corrosion products formed on carbon steel in the presence of Cl, Ca2+ and Mg2+ in high pressure CO2 environments. Appl. Surf. Sci. 2018, 455, 667–682. [Google Scholar] [CrossRef]
  31. G1-03; Standard Practice for Preparing, Cleaning, and Evaluating Corrosion Test Specimens. ASTM International: West Conshohocken, PA, USA, 2003.
  32. G31-21; Standard Guide for Laboratory Immersion Corrosion Testing of Metals. ASTM International: West Conshohocken, PA, USA, 2021.
  33. Denny, A.J. Principles and Prevention of Corrosion; Prentice Hall: Hoboken, NJ, USA, 1996. [Google Scholar]
  34. Guo, S.; Xu, L.; Zhang, L.; Chang, W.; Lu, M. Corrosion of alloy steels containing 2% chromium in CO2 environments. Corros. Sci. 2012, 63, 246–258. [Google Scholar] [CrossRef]
  35. Pardo, A.; Merino, M.; Coy, A.; Viejo, F.; Arrabal, R.; Matykina, E. Pitting corrosion behaviour of austenitic stainless steels—Combining effects of Mn and Mo additions. Corros. Sci. 2008, 50, 1796–1806. [Google Scholar] [CrossRef]
  36. Muwila, A. The Effect of Manganese, Nitrogen and Molybdenum on the Corrosion Resistance of a Low Nickel (<2 wt%) Austenitic Stainless Steel. Ph.D. Thesis, Wits University, Johannesburg, South Africa, 2006. [Google Scholar]
  37. Morland, B.H.; Svenningsen, G. Pitfalls and Artefacts in Corrosion Experiments with Dense Phase CO2; NACE Corrosion: Houston, TX, USA, 2021; p. D121S051R004. [Google Scholar]
  38. Xiang, Y.; Xie, W.; Ni, S.; He, X. Comparative study of A106 steel corrosion in fresh and dirty MEA solutions during the CO2 capture process: Effect of NO3. Corros. Sci. 2020, 167, 108521. [Google Scholar] [CrossRef]
  39. Sun, J.; Zhang, G.; Liu, W.; Lu, M. The formation mechanism of corrosion scale and electrochemical characteristic of low alloy steel in carbon dioxide-saturated solution. Corros. Sci. 2012, 57, 131–138. [Google Scholar] [CrossRef]
  40. Bardal, E. Corrosion and Protection; Springer: Berlin/Heidelberg, Germany, 2004. [Google Scholar]
  41. Liu, M.; Zeng, Y.; Luo, J.-L. Roles of major alloying elements in steels and alloys on corrosion under biomass hydrothermal liquefaction (HTL) conversion. Corros. Sci. 2023, 218, 111148. [Google Scholar] [CrossRef]
  42. Liu, M.; Zeng, Y.; Luo, J.-L. Impacts of catalyst, inorganic and organic corrodants on corrosion under batch-mode catalytic biomass hydrothermal liquefaction conversion. Corros. Sci. 2022, 204, 110409. [Google Scholar] [CrossRef]
  43. Ezuber, H.M. Influence of temperature and thiosulfate on the corrosion behavior of steel in chloride solutions saturated in CO2. Mater. Des. 2009, 30, 3420–3427. [Google Scholar] [CrossRef]
  44. Dugstad, A. Fundamental Aspects of CO2 Metal Loss Corrosion, Part I: Mechanism. In Proceedings of the Corrosion Conference and Expo 2015, Dallas, TX, USA, 15–19 March 2015. [Google Scholar]
  45. Garside, J. Advances in the Characterization of Crystal Growth; AIChE Symposium Series; American Institute of Chemical Engineers (AIChE): New York, NY, USA, 1984; pp. 23–38. [Google Scholar]
  46. Ueda, M.; Takabe, H. Effect of Environmental Factor and Microstructure on Morphology of Corrosion Products in CO2 Environments; NACE Corrosion: Houston, TX, USA, 1999; p. NACE-99013. [Google Scholar]
  47. Dugstad, A.; Lunde, L.; Videm, K. Parametric Study of CO2 Corrosion of Carbon Steel; NACE International: Houston, TX, USA, 1994. [Google Scholar]
  48. Pessu, F.; Barker, R.; Neville, A. The Influence of pH on Localized Corrosion Behavior of X65 Carbon Steel in CO2-Saturated Brines. Corrosion 2015, 71, 1452–1466. [Google Scholar] [CrossRef]
  49. Van Hunnik, E.; Hendriksen, E.; Pots, B.F. The Formation of Protective FeCO3 Corrosion Product Layers in CO2 Corrosion; NACE Corrosion: Houston, TX, USA, 1996; p. NACE-96006. [Google Scholar]
  50. Nazari, M.H.; Allahkaram, S.; Kermani, M. The effects of temperature and pH on the characteristics of corrosion product in CO2 corrosion of grade X70 steel. Mater. Des. 2010, 31, 3559–3563. [Google Scholar] [CrossRef]
  51. Ahmadi, P.; Chapoy, A. CO2 solubility in formation water under sequestration conditions. Fluid Phase Equilibria 2018, 463, 80–90. [Google Scholar] [CrossRef]
  52. Jolivet, J.; Chaneac, C.; Tronc, E. Iron oxide chemistry. From molecular clusters to extended solid networks. Chem. Commun. 2004, 35, 481–483. [Google Scholar]
  53. Rai, D.; Sass, B.M.; Moore, D.A. Moore, Chromium (III) hydrolysis constants and solubility of chromium (III) hydroxide. Inorg. Chem. 1987, 26, 345–349. [Google Scholar] [CrossRef]
  54. Pedeferri, P.; Ormellese, M. Corrosion Science and Engineering; Springer: Berlin/Heidelberg, Germany, 2018. [Google Scholar]
  55. Liu, M.; Zeng, Y.; Luo, J.-L. Influence of Major Operating Parameters (Temperature, Pressure, and Flow Rate) on the Corrosion of Candidate Alloys for the Construction of Hydrothermal Liquefaction Biorefining Reactors. Energy Fuels 2022, 36, 3134–3153. [Google Scholar] [CrossRef]
  56. Xiao, Q.; Jang, C.; Kim, C.; Kim, H.; Chen, J.; Lee, H.B. Corrosion behavior of stainless steels in simulated PWR primary water: The effect of composition and matrix phases. Corros. Sci. 2020, 177, 108991. [Google Scholar] [CrossRef]
  57. Zeng, Y.; Guzonas, D. Corrosion Assessment of Candidate Materials for Fuel Cladding in Canadian SCWR. JOM 2016, 68, 475–479. [Google Scholar] [CrossRef]
  58. Presuel-Moreno, F.; Scully, J.; Sharp, S. Literature Review of Commercially Available Alloys That Have Potential as Low-Cost Corrosion Resistant Concrete Reinforcement. Corrosion 2010, 66, 086001-1. [Google Scholar] [CrossRef]
  59. Parangusan, H.; Bhadra, J.; Al-Thani, N. A review of passivity breakdown on metal surfaces: Influence of chloride- and sulfide-ion concentrations, temperature, and pH. Emergent Mater. 2021, 4, 1187–1203. [Google Scholar] [CrossRef]
  60. Takasaki, S.; Yamada, Y. Effects of temperature and aggressive anions on corrosion of carbon steel in potable water. Corros. Sci. 2007, 49, 240–247. [Google Scholar] [CrossRef]
  61. Wasik, D.O.; Polat, H.M.; Ramdin, M.; Moultos, O.A.; Calero, S.; Vlugt, T.J.H. Vlugt, Solubility of CO2 in Aqueous Formic Acid Solutions and the Effect of NaCl Addition: A Molecular Simulation Study. J. Phys. Chem. C 2022, 126, 19424–19434. [Google Scholar] [CrossRef] [PubMed]
  62. Hua, Y.; Mohammed, S.; Barker, R.; Neville, A. Comparisons of corrosion behaviour for X65 and low Cr steels in high pressure CO2-saturated brine. J. Mater. Sci. Technol. 2020, 41, 21–32. [Google Scholar] [CrossRef]
  63. Li, Y.; Zhu, G.; Hou, B.; Zhang, Q.; Zhang, G. A numerical model based on finite element method for predicting the corrosion of carbon steel under supercritical CO2 conditions. Process. Saf. Environ. Prot. 2021, 149, 866–884. [Google Scholar] [CrossRef]
Figure 1. Schematic illustration of the corrosion experiment system.
Processes 13 01334 g001
Figure 2. Corrosion rates of alloys with increasing Cr content exposed to s-CO2-saturated SW at 50 °C and 8 MPa after 96 h.
Processes 13 01334 g002
Figure 3. Photographic images and XRD patterns of the alloys after being corroded in 8 MPa s-CO2-saturated SW at 50 °C for 96 h.
Processes 13 01334 g003
Figure 4. BSE images of different alloys after being exposed to s-CO2-saturated SW for 96 h, (a) X80, (b) 2Cr, (c) 5Cr, (d) P91, (e) 316L, and (f) Alloy 800.
Processes 13 01334 g004
Figure 5. EDS mapping results of 2Cr and 5Cr steels after being exposed to s-CO2-saturated SW for 96 h.
Processes 13 01334 g005
Figure 6. Cross-sectional BSE images of alloys exposed to s-CO2-saturated SW, (a) X80, (b) 2Cr, and (c) 5Cr.
Processes 13 01334 g006
Figure 7. SEM images taken during the FIB operation on P91 and SS 316L samples after s-CO2-saturated SW exposure.
Processes 13 01334 g007
Figure 8. Cross-sectional TEM analyses of P91: (a) DF image, (b) enlarged interface EDS mapping images, and (c,d) selected-area electron diffraction (SAED) images of regions 1 and 2.
Processes 13 01334 g008
Figure 9. Cross-sectional TEM analyses of corroded 316L: (a) dark-phase (DF) image; (b,c) enlarged interface EDS mapping image.
Processes 13 01334 g009
Figure 10. Established Pourbaix diagrams of (a) Fe, (b) Cr, (c) Ni, and (d) Mo in an aqueous solution at 50 °C.
Processes 13 01334 g010
Table 1. Bulk chemical compositions (wt.%) of alloys tested in this study.
AlloysChemical Composition (wt.%)
CrNiFeSiMnCAlOthers
X800.28-Bal.0.171.830.04-0.3Mo
2Cr2.20.1Bal.0.210.40.10.021.0Mo
5Cr4.60.1Bal.0.330.30.10.050.5Mo
P918.90.1Bal.0.30.40.10.030.9Mo
316L17.38.3Bal.0.41.00.02-0.2Mo
Alloy 80019.231.2Bal.0.80.80.060.2-
Table 2. Average EDS elemental composition (at. %; metal cation basis) of the corresponding sites marked in Figure 4.
AlloysSite # Average Composition (at. %)Products
OFeCrNiC
X80159.6 ± 2.617.6 ± 4.4--22.4 ± 1.8FeCO3
2Cr257.9 ± 3.519.5 ± 4.9--22.0 ± 2.2FeCO3
360.9 ± 1.914.5 ± 2.92.7 ± 0.4-21.2 ± 0.6-
5Cr461.5 ± 1.012.1 ± 1.7--25.6 ± 1.7FeCO3
560.9 ± 1.09.5 ± 0.710.8 ± 0.7-18.8 ± 0.5-
P91658.7 ± 1.319.3 ± 3.0--22.0 ± 1.7FeCO3
316L763.5 ± 2.419.0 ± 4.8--17.5 ± 2.4FeCO3
Alloy 800861.6 ± 0.818.6 ± 3.7--19.8 ± 2.9FeCO3
Table 3. Average EDS elemental composition (at. %) from the corresponding regions numbered in Figure 8 and Figure 9.
Region #Chemical Composition (at. %)
OFeCrC
12218-60
22113858
32223-55
420151055
Table 4. Calculated Gibbs energy of formation of Fe, Cr, Ni, and Mo oxide with saline water at 50 °C.
ReactionGibbs Energy at 50 °C (kJ/mol)
2Fe + 3H2O = Fe2O3 + 3H2−34.911
2Cr + 3H2O = Cr2O3 + 3H2−347.030
Ni + H2O = NiO + H223.862
Mo + 2H2O = MoO2 + 2H2−61.229
Disclaimer/Publisher’s Note: The statements, opinions and data contained in all publications are solely those of the individual author(s) and contributor(s) and not of MDPI and/or the editor(s). MDPI and/or the editor(s) disclaim responsibility for any injury to people or property resulting from any ideas, methods, instructions or products referred to in the content.

