Article

Study on the Impact of Drilling Fluid Rheology on Pressure Transmission Within Micro-Cracks in Hard Brittle Shale

1
School of Petroleum Engineering, China University of Petroleum, Beijing 102249, China
2
Oil and Gas Survey, China Geological Survey, Beijing 100083, China
3
The Second Institute of Hydrogeology and Engineering Geology, Shandong Provincial Bureau of Geology & Mineral Resources, Dezhou 253072, China
4
Chinese Academy of Geological Sciences, Beijing 100037, China
5
China Mechanical Engineering College, Xi’an Shiyou University, Xi’an 710065, China
*
Authors to whom correspondence should be addressed.
Processes 2025, 13(5), 1339; https://doi.org/10.3390/pr13051339
Submission received: 29 March 2025 / Revised: 20 April 2025 / Accepted: 25 April 2025 / Published: 27 April 2025
(This article belongs to the Section Energy Systems)

Abstract

:
The instability of wellbore in hard and brittle shale formations is a key bottleneck constraining the safety and efficiency of drilling engineering. Traditional studies focused on drilling fluid density, particle plugging, and chemical inhibition; however, there is a lack of in-depth analysis on the precise control mechanism of wellbore stability by the rheological properties of drilling fluids. Specifically, while traditional methods are limited in addressing mechanical instability in hard brittle shales with pre-existing micro-fractures, rheological control offers a potential solution by influencing pressure transmission within these fractures. To address this research gap, this study aims to reveal the influence of drilling fluid rheological parameters (specifically viscosity and yield point) on the pressure transmission behavior of the micro-fracture network in hard and brittle shale and to clarify the intrinsic mechanism by which rheological properties stabilize the wellbore. Micro-structure analysis confirmed interconnected micro-fractures (0.5–30 μm). A micro-fracture flow model and simulations evaluated viscosity and yield point effects on pressure transmission. A higher viscosity significantly increased the pressure drop (ΔP) near the wellbore, with limited transmission distance effects. The yield point was minimal. The study reveals that optimizing rheology, particularly increasing viscosity, can suppress pore pressure, reduce collapse pressure, and improve stability. The findings support rheological parameter optimization for safer, economical drilling. In terms of rheological parameter optimization design, this study suggests emphasizing the increase in drilling fluid viscosity to effectively manage wellbore stability in hard brittle shale formations.

1. Introduction

Under the dual strategic demands of global energy transition and energy security, shale gas, as a clean, efficient, and abundantly reservoired unconventional natural gas resource, has become a crucial development direction in the global energy sector [1]. Especially against the backdrop of deep and ultra-deep shale gas reservoirs increasingly becoming the main exploration and development targets, hard and brittle shale formations, due to their widespread distribution and vast resource potential, are considered key to enhancing shale gas reserves and production [2,3]. However, the inherent complex geological characteristics and engineering challenges of hard and brittle shale formations, particularly the issue of wellbore instability, have become the primary bottleneck constraining the efficient and economic development of shale gas [4,5]. Wellbore instability manifests in various forms, including well collapse, sloughing, diameter reduction, and stuck drill pipe, which severely impact the safety and efficiency of drilling operations. Moreover, it increases drilling costs, prolongs well construction cycles, and may even result in well abandonment, leading to significant economic losses and potential environmental risks [6,7]. Therefore, effectively addressing the wellbore stability issues in hard and brittle shale formations is crucial for the sustainable development of the shale gas industry.
Traditional wellbore stability technologies primarily focus on controlling drilling fluid density, optimizing mud sealing performance, and enhancing chemical inhibition capabilities [8,9]. These methods can address certain types of wellbore instability to some extent, but their effectiveness is often limited in hard and brittle shale formations. The limitations arise because hard and brittle shales are mechanically weak due to pre-existing micro-fractures, and chemically inert, reducing the effectiveness of traditional methods. Hard and brittle shales typically have high contents of brittle minerals such as quartz and feldspar, while clay mineral content is relatively low, resulting in high rock strength, strong brittleness, and well-developed natural fractures and micro-cracks [5,10]. These rock properties make hard and brittle shales more sensitive to external disturbances and more prone to mechanical instability during drilling. Simply increasing drilling fluid density to balance formation pressure not only may induce formation fracturing issues [11,12] but also, for hard and brittle shales with low chemical activity, the hydration swelling effect of chemical inhibition is not significant, making it difficult to effectively improve wellbore stability [13,14]. Therefore, while traditional methods like density control and chemical inhibition are useful for wellbore stability in general shale formations, they are less effective in hard and brittle shales where mechanical instability along micro-fractures is the dominant failure mechanism. This necessitates exploring alternative approaches like rheological control.
In recent years, the rheological properties of drilling fluids, as a key engineering parameter, have gradually drawn researchers’ attention for their mechanisms of influence on wellbore stability [15,16]. The rheological characteristics of drilling fluids, such as viscosity, yield value, and dynamic shear force, not only directly affect the flow behavior of drilling fluids, pressure transmission efficiency, cutting-carrying capacity, and hydraulic fracturing effects [17], but may also indirectly influence the effective stress state of wellbore rock, pore pressure distribution, and strength characteristics by altering the pattern and rate of drilling fluid filtrate invasion into the formation and its interaction with the formation rock [18,19]. Especially in hard and brittle shale formations, the widely developed network of micro-fractures constitutes the primary channel for drilling fluid filtrate invasion and formation fluid migration [20,21]. These micro-fractures not only reduce the macroscopic mechanical strength of the shale but also provide a rapid and complex pathway for pressure transmission by drilling fluids, making the pore pressure response of the surrounding rock near the wellbore more rapid and sensitive [22,23]. Preliminary studies suggest that rheological parameters of drilling fluids, such as viscosity and yield value, may significantly influence the seepage rules of drilling fluids in micro-fractures, the range and speed of pressure transmission, and thus affect the distribution of effective stresses around the wellbore and the risk of instability [24,25]. For example, high-viscosity drilling fluids may slow down the propagation speed of pressure waves and reduce the degree of stress concentration at fracture tips, thereby inhibiting fracture extension and improving wellbore stability to some extent [26,27]. Additionally, the viscoelasticity of drilling fluids is also considered relevant to wellbore stability; viscoelastic drilling fluids can form gel strength when static, which helps support the wellbore and reduce fluid invasion [28]. Field practices have also shown that optimizing the rheological parameters of drilling fluids can effectively reduce the rate of wellbore enlargement and improve wellbore stability [29]. Furthermore, some studies have begun to focus on the potential of rheological control of drilling fluids modified with nanoparticles to enhance the stability of shale wellbores [30]. Beyond nanoparticle modification, broader approaches to rheological control, including conceptual design and methodology for water-based drilling fluids in extreme conditions, are also being explored [31]. Reviews of rheological modifiers in drilling fluids further highlight the ongoing research and importance of this field [32]. However, systematic and in-depth quantitative research and theoretical models are still lacking on how the rheological properties of drilling fluids can be finely tuned to control the complex pressure transmission processes within the micro-fracture networks of hard and brittle shales, as well as how such control ultimately affects the macroscopic stability of the wellbore [33,34,35,36,37,38,39,40]. In particular, the mechanisms by which rheological properties influence pressure transmission at the micro-scale remain unclear.
Given the research status and engineering demands, this study aims to quantitatively reveal, through numerical simulation, the mechanisms by which the rheological properties of drilling fluids (particularly viscosity and yield value) influence the pressure transmission patterns within the micro-fracture networks of hard and brittle shales. Furthermore, this research seeks to explore the potential effects of viscoelastic drilling fluids and nano-modified drilling fluids on pressure transmission and wellbore stability. Nano-modified drilling fluids offer potential advantages such as enhanced shale stability through improved plugging of micro-fractures, reduced fluid loss, and improved rheological properties even at low concentrations of additives. The findings of this study are intended to provide significant theoretical guidance and technical support for the development of novel, high-efficiency drilling fluids for hard and brittle shales, the optimization of drilling fluid rheological parameters, and the enhancement of wellbore stability in hard and brittle shale formations under complex geological conditions. Ultimately, this research aims to serve the safe and efficient development of shale gas and the strategic goals of energy sustainability.

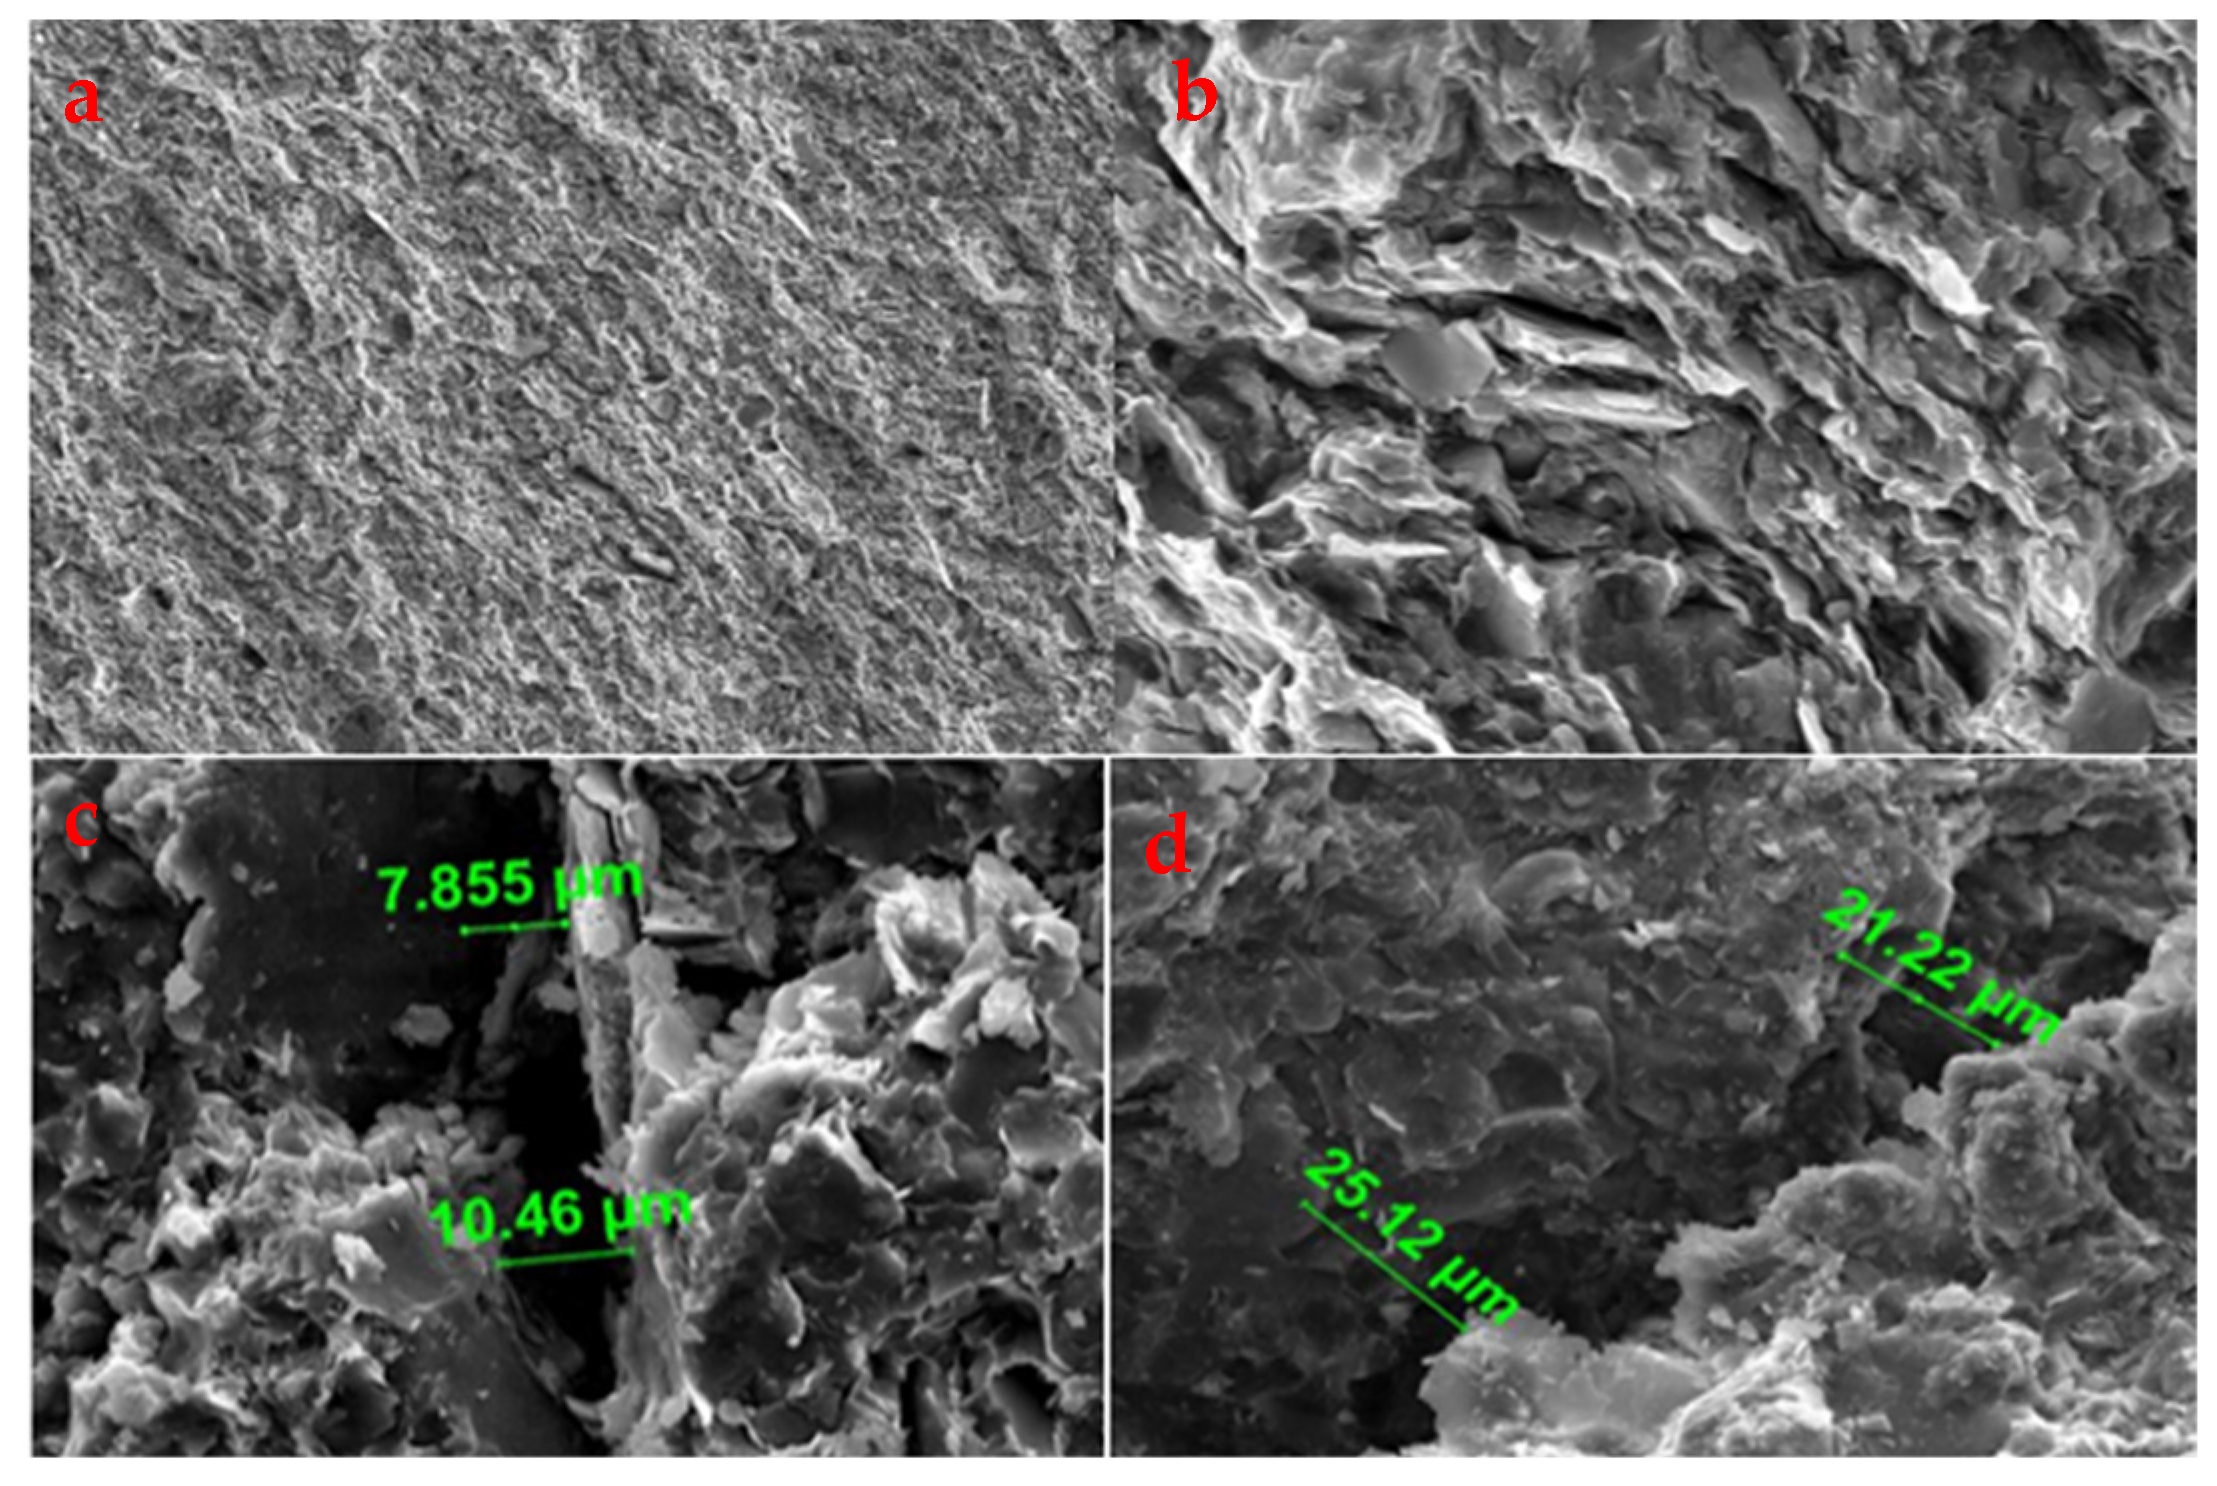
2. Microscopic Structural Characteristics of Hard Brittle Mud Shale

In this study, we conducted an electron microscope scanning experiment using the ZEISS Sigma 500 field emission scanning electron microscope (FESEM) equipment produced by Zeiss (Figure 1) on core samples from Basin A, and the results revealed the following: hard brittle mud shales exhibit significant structural characteristics at the micro-scale. Figure 1a shows a low magnification (300×) image revealing densely packed mineral particles, indicating macroscopic compactness. Figure 1b displays a high magnification (8000×) image, showing a clear flake-like loose structure with randomly distributed micro-fractures and pores (0.5–30 μm). Under low magnification, mineral particles are densely packed, reflecting their macroscopic compactness; while under high magnification, a clear flake-like loose structure is observed, accompanied by many micro-fractures and pores (0.5–30 μm), which are randomly distributed. These unique micro-structural features indicate that hard brittle mud shales internally contain natural weak zones. These zones are highly susceptible to becoming the initiation points for micro-fractures under external stress or chemical disturbances. Especially during the invasion of drilling fluid, the fluid infiltrates along micro-fractures, and the stress concentration effect at the crack tip further accelerates the extension and interconnection of micro-fractures. This may eventually lead to the formation of macroscopic fracture networks, directly related to wellbore instability. Therefore, the wellbore stability of hard brittle mud shales is not only closely related to the inherent micro-structural characteristics of the rock but also significantly influenced by the rheological properties of the drilling fluid itself. To quantitatively evaluate the impact of drilling fluid rheology on hard brittle mud shales, this study will investigate the degree of pressure transmission under the action of drilling fluid through numerical simulation.

3. Numerical Simulation Methods

3.1. Flow Model in Fractures

Hard brittle mud shales are characterized by ultra-low porosity and ultra-low permeability, with pore structures primarily at the nano-meter scale, and they universally contain many micro-fractures. These micro-fractures serve as the primary flow channels for drilling fluid in hard brittle mud shale formations, and the influence of formation pressure is also mainly transmitted through these micro-fractures. The flow of drilling fluid into the micro-fractures is primarily driven by hydraulic pressure difference, and its flow behavior follows the Navier–Stokes (N-S) equation. Since there is a difference of more than six orders of magnitude between the length and width of the fractures, this study uses a one-dimensional continuity equation to describe the flow within the fractures. Assuming that the drilling fluid enters the fracture and displaces the formation fluid in a piston-like manner, there will be two regions within the entire fracture: the drilling fluid pressure zone and the formation fluid pressure zone, with a clear interface between the two phases of fluid (as shown in Figure 2). To simplify the model, the following assumptions are made:
(1)
The fracture geometry remains unchanged during the drilling fluid invasion, and fracture extension is neglected.
(2)
The drilling fluid displaces the formation fluid in a piston-like manner with a clear interface.
(3)
Fluid flow within the fracture is one-dimensional.
Based on these assumptions, the corresponding mathematical model is established.

3.1.1. Pressure Distribution in the Drilling Fluid Area

(1) Equation of motion:
Drilling fluid is a plastic fluid with corresponding yield stress values, and its steady flow equation is as follows:
v = K d f μ d f p x γ ( p x > γ ) v = 0 ( p x γ )
where ν–Drilling fluid flow rate, m/s;
μ d f —Drilling fluid viscosity, Pa·s;
γ —Pressure gradient corresponding to fluid overcoming yield stress, 10 MPa/m;
Kdf—Pressure gradient proportionality coefficient of drilling fluid, 10 MPa/m.
Equation of drilling fluid infiltration velocity to fracture surface:
v s d f = 0.136 ( P P 0 ) K s C L ϕ s μ d f t 1 2
where P0—Formation pore pressure, MPa;
CL—Elastic Compressibility Coefficient of Liquid, MPa−1;
Ks—Stratum permeability, D;
ϕs—Stratum porosity.
This equation is derived from Darcy’s Law, representing fluid flow into porous media driven by pressure gradients [41].
(2) Equation of State:
The compressibility coefficient of rocks is slim relative to liquids, so we assume that the drilling fluid is compressible and the formation is incompressible.
For drilling fluids:
ρ d f = ρ d f 0 e C L ( P P 0 ) = ρ d f 0 [ 1 + C L ( P P 0 ) ]
where ρ d f is drilling fluid density, kg/m3.
(3) Continuity equation (one-dimensional flow):
We assume that the length of the micro-element is dt, the width of the crack is 1, and the height of the crack is b, according to the conservation of mass as follows:
( ρ v ) x b d x d t 2 ρ v s d x d t = ( ρ ϕ ) t b d x d t
where v s is the seepage velocity of drilling fluid to the fracture surface. The first term represents the mass flow rate into the micro-element volume. The second term represents the mass flow rate out of the micro-element volume. The third term represents the rate of change in mass storage within the micro-element volume due to fluid compressibility.
That is,
( ρ v ) x 2 b ρ v s = ( ρ ϕ ) t
By substituting continuity equations into equations of motion and equations of state,
( ρ ϕ ) t = ( ρ d f ϕ 0 ) t = ρ d f 0 ϕ 0 C L P t
Among these, for considering only the flow state in a single fracture, ϕ 0 = 1
( ρ v ) x = ( ρ d f v d f ) x = x ρ d f 0 e C L ( P P 0 ) × [ K d f μ d f ( P x γ ) ] = ρ d f 0 K d f μ d f 2 P x 2 + ρ d f 0 K d f μ d f γ C L P x
Therefore,
ϕ 0 C L P t K d f μ d f 2 P x 2 + K d f μ d f γ C L P x + 2 × 0.136 b K s C L ϕ s μ d f t 1 2 1 + C L ( P P 0 ) ( P P 0 ) = 0
In this expression, A = ϕ 0 C L μ d f K d f , B = γ C L
Therefore,
A P t 2 P x 2 + B P x + 2 × 0.136 b μ d f K d f K s C L ϕ s μ d f t 1 2 1 + C L ( P P 0 ) ( P P 0 ) = 0

3.1.2. Pressure Distribution in the Formation Fluid Area

(1) Equation of motion:
Most of the fluid in the formation fracture is water or gas. It is assumed that the bottom layer fluid is formation water, which is Newtonian fluid, and its stable flow equation can be expressed as follows:
v = K w μ w p x
where ν—Formation water velocity, m/s;
μ w —Formation water viscosity, Pa·s.
The seepage velocity equation of formation water to fracture surface:
v s _ w a t e r = 0.136 ( P P 0 ) ( K s C L ϕ s μ w t ) 1 / 2
where Ks—formation permeability; ϕs—formation porosity.
(2) Equation of State:
The compressibility coefficient of rock is slim relative to that of liquids, so it is assumed that formation water is compressible and the formation is incompressible.
For formation water:
ρ w = ρ w 0 e C L ( P P 0 ) = ρ w 0 [ 1 + C L ( P P 0 ) ]
(3) Continuity equation (one-dimensional flow):
By substituting the equations of motion and state into the continuity Equation (4), we obtain
( ρ ϕ ) t = ( ρ w ϕ 0 ) t = ρ w 0 ϕ 0 C L p t
In this expression, ϕ 0 = 1
( ρ v ) x = ( ρ w v w ) x = x ρ w 0 e C L ( P P 0 ) × K w μ w P x = ρ w 0 K w μ w 2 P x 2
Therefore,
ϕ 0 C L P t K w μ w 2 P x 2 + 2 × 0.136 b K s C L ϕ s μ w t 1 2 1 + C L ( P P 0 ) ( P P 0 ) = 0
In this expression, C = ϕ 0 C L μ w K w
Therefore,
C P t 2 P x 2 + 2 × 0.136 b μ w K w K s C L ϕ s μ w t 1 2 1 + C L ( P P 0 ) ( P P 0 ) = 0

3.2. Discrete Treatment of Flow Models

Through the Taylor series, we draw two lines parallel to the coordinate axis on the x-t plane, and divide the plane into a rectangular grid. We divide the length L into N equal parts, and assume the distance between each part as h, which is called the space step. We equal time dt with τ, which is the time step. Their gridlines can be represented by the following formula:
x = x j = j Δ x = j h , j = 0 , 1 , 2 , t = t n = n Δ t = n τ , n = 0 , 1 , 2 ,
Assuming that the solution P x , t of the initial value problem of a partial differential equation is sufficiently smooth, then the following expression holds:
P j n + 1 P j n τ = [ P t ] j n P j + 1 n P j n h = [ P x ] j n P j + 1 n 2 P j n + P j 1 n h 2 = [ 2 P x 2 ] j n
(1) Drilling fluid area:
By A P t 2 P x 2 + B P x + 2 × 0.136 b μ d f K d f ( K s C L ϕ s μ d f t ) 1 / 2 [ 1 + C L ( P P 0 ) ] ( P P 0 ) = 0
It can be drawn that
A p j n + 1 P j n τ P j + 1 n 2 P j n + P j 1 n h 2 + B P j + 1 n P j n h + 2 × 0.136 b μ d f K d f ( K s C L ϕ s μ d f t ) 1 2 [ 1 + C L ( P P 0 ) ] ( P P 0 ) = 0
The distribution equation P(x,t) is as follows:
P j n + 1 = ( 1 2 τ A h 2 + B τ A h ) P j n + ( τ A h 2 B τ A h ) P j + 1 n + τ A h 2 P j 1 n 2 × 0.136 b τ ϕ 0 C L ( K s C L ϕ s μ z u a n t ) 1 / 2 [ 1 + C L ( P P 0 ) ] ( P P 0 )
(2) Formation fluid area:
By C P t 2 P x 2 + 2 × 0.136 b μ w K w K s C L ϕ S μ w t 1 / 2 1 + C L ( P P 0 ) ( P P 0 ) = 0 , it can be drawn that
C P j n + 1 P j n τ P j + 1 n 2 P j n + P j 1 n h 2 + 2 × 0.136 b μ w K w K s C L ϕ S μ w t 1 / 2 1 + C L ( P P 0 ) ( P P 0 ) = 0
The distribution equation P(x,t) is as follows:
P j n + 1 = 1 2 τ C h 2 P j n + τ A h 2 P j + 1 n + τ C h 2 P j 1 n 2 × 0.136 b τ ϕ 0 C L K s C L ϕ S μ w t 1 / 2 1 + C L ( P P 0 ) ( P P 0 )

3.3. Boundary Conditions

We take the wellbore as the starting point 0 and establish the correlation equation, where Pw is the wellbore fluid column pressure, P0 is the original formation pressure, L is the fracture length, and the original boundary is shown in Equation (23):
x = 0 , P = P w x = L , P = P 0
Fracture permeability: K f = b e 2 12 , where is the hydraulic opening, i.e., effective flow opening; b e = b ¯ h , b ¯ is the average width of fracture; h is boundary layer thickness of micro-flow; the compressibility coefficient of drilling fluid and formation water differs little, so its compressibility coefficient is set as CL = 4.5 × 10⁻¹⁰ Pa−1; the pressure gradient γ = τ y 3 b 8 corresponds to Bingham fluid overcoming yield stress (Pa/m), where τy is fluid yield stress (Pa).
The permeability of hard brittle shale formation is ultra-low. The biggest difference between the sandstone medium and high permeability formation lies in that the seepage velocity of fluid from the micro-fracture to hard brittle shale formation is negligibly low, so that the transmission loss of drilling fluid column pressure along the fracture to formation is negligible, and the pressure in the fracture rises rapidly, which affects the mechanical properties of surrounding rocks.
In hard brittle shale formations, the correlated seepage model in fractures can be simplified without regard to the seepage of fluid to fracture surfaces.
(1) The pressure distribution Equation (9) in the drilling fluid area is simplified as follows:
A P t 2 P x 2 B P x = 0
(2) The pressure distribution Equation (16) of the formation fluid area is simplified as follows:
C P t 2 P x 2 = 0
Therefore, the equation of pressure distribution in fracture of hard brittle shale formation is simplified as follows:
In drilling fluid area:
P j n + 1 = 1 2 τ A h 2 + B τ A h P j n + τ A h 2 B τ A h P j + 1 n + τ A h 2 P j 1 n
In formation fluid area:
P j n + 1 = 1 2 τ C h 2 P j n + τ A h 2 P j + 1 n + τ C h 2 P j 1 n

3.4. Simulation Parameters

MATLAB R2018a numerical simulation programming is performed according to Equation (28), where the seepage process ends when νinterface < 0 in the interface between the drilling fluid and formation water in micro-fractures. Consider the fracture width as b, fracture length L, and drilling fluid column pressure Pw, the influence of drilling fluid rheology on fracture pressure around hard brittle shale wells is studied by changing drilling fluid rheological parameters such as viscosity μdf and Bingham fluid yield stress τy. Table 1 shows relevant parameters of drilling fluid in some well intervals during the drilling of the Shahejie Formation in the blocks of Dagang oil fields. The main lithology of the Shahejie Formation is shale interbedded with sandstone, which is vulnerable to collapse. These field data, particularly the range of funnel viscosity (25–105 s), provided realistic ranges for drilling fluid viscosity parameters used in our numerical simulations.
According to Table 1, the well interval is 2700–3700 m, the drilling fluid hopper viscosity is 25–105 s, the drilling fluid density is 1.22–1.48 g/cm3 and borehole enlargement rate is 6–140%. Absolute viscosity is generally used for correlation calculation during theoretical calculation. A funnel viscometer is usually used to measure the viscosity of drilling fluid for convenience and quickness on site. It is called funnel viscosity. Therefore, conversion is required. The relationship between absolute viscosity and funnel viscosity is as follows (as per API Recommended Practice 13B-1 [42]):
μ = 100 ρ × 0.0731 × A + 35 50 0.0631 A + 35 50
where μ—absolute viscosity, cp; A—funnel viscosity, s; ρ —density, g/cm3.
Assuming that the formation depth of hard and brittle shale is 3000 m and the drilling fluid density is 1.25 g/cm3, the drilling fluid column pressure Pw = 37.5 MPa and the formation pressure is normal. In the numerical simulation of P0 = 30.9 MPa, the fracture length L is divided into N equal parts, and the distance between each small part is h, which is the space step. The spatial step of 0.001 m is selected because it is sufficiently smaller than the fracture length scale (0.1 m to 2 m) to ensure numerical stability and accuracy. Convergence tests were performed during model development to confirm that this step size provides results with acceptable precision and is computationally efficient for this problem scale. The pressure drop at the first space step h (the space step value in this paper is 0.001 m) is defined as ΔP, and the influence distance of drilling fluid column pressure on fracture pressure around the well is defined as the pressure transmission distance Ltransmit.

4. Simulation Result Analysis and Discussion

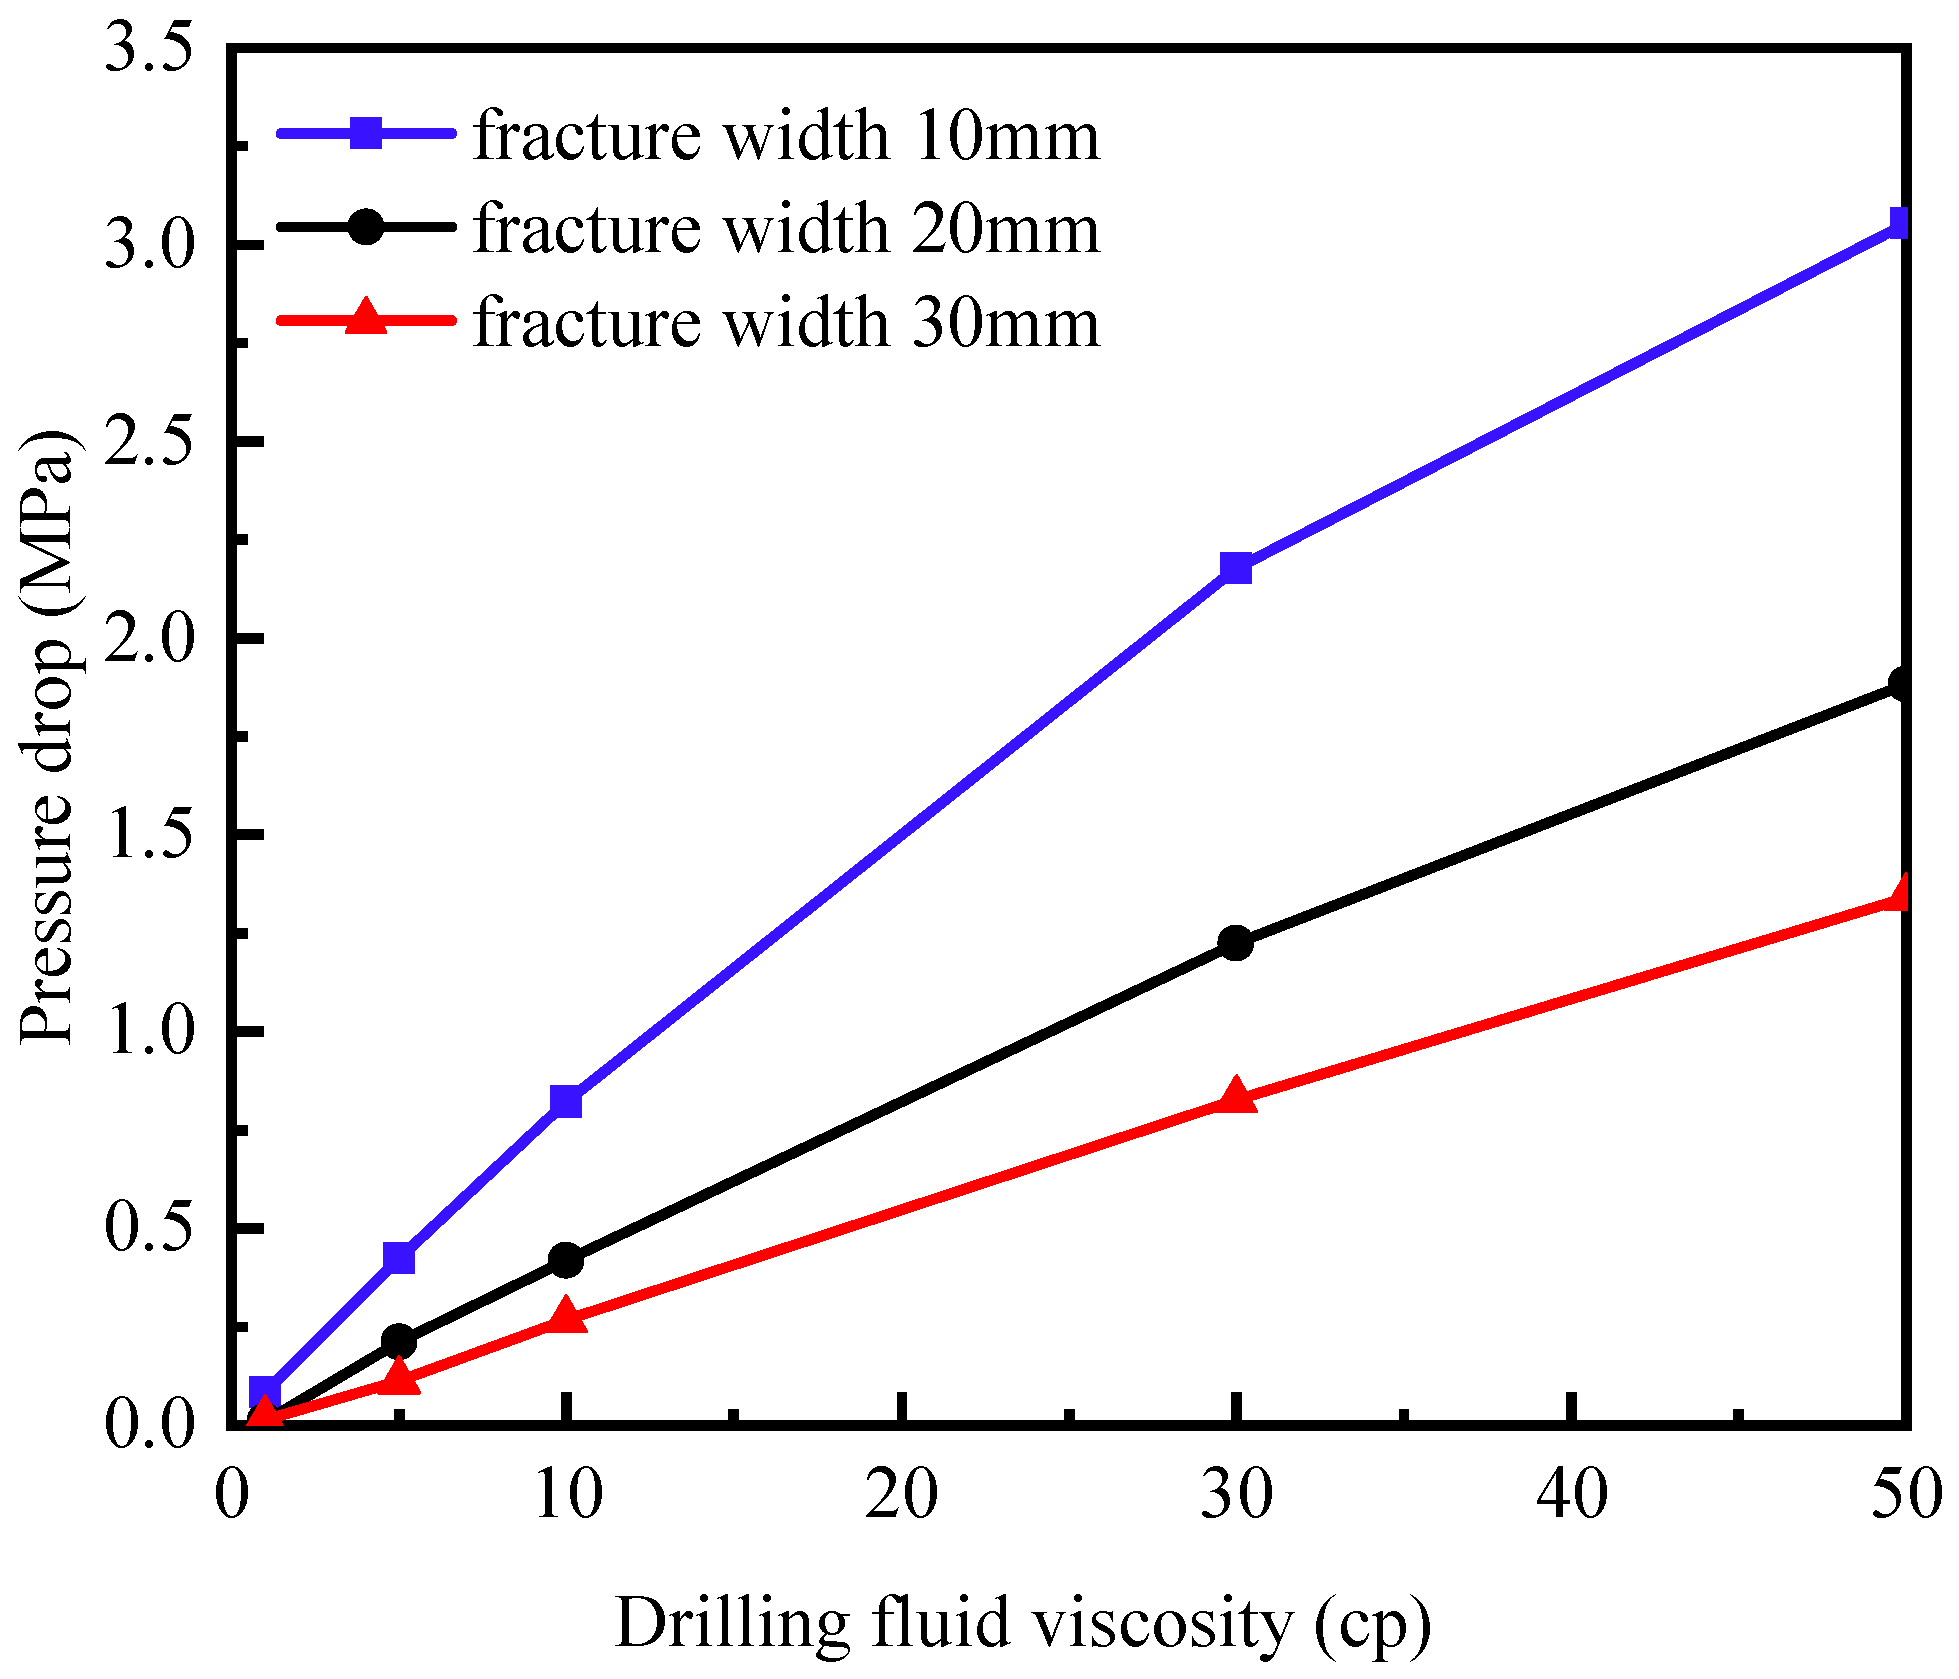
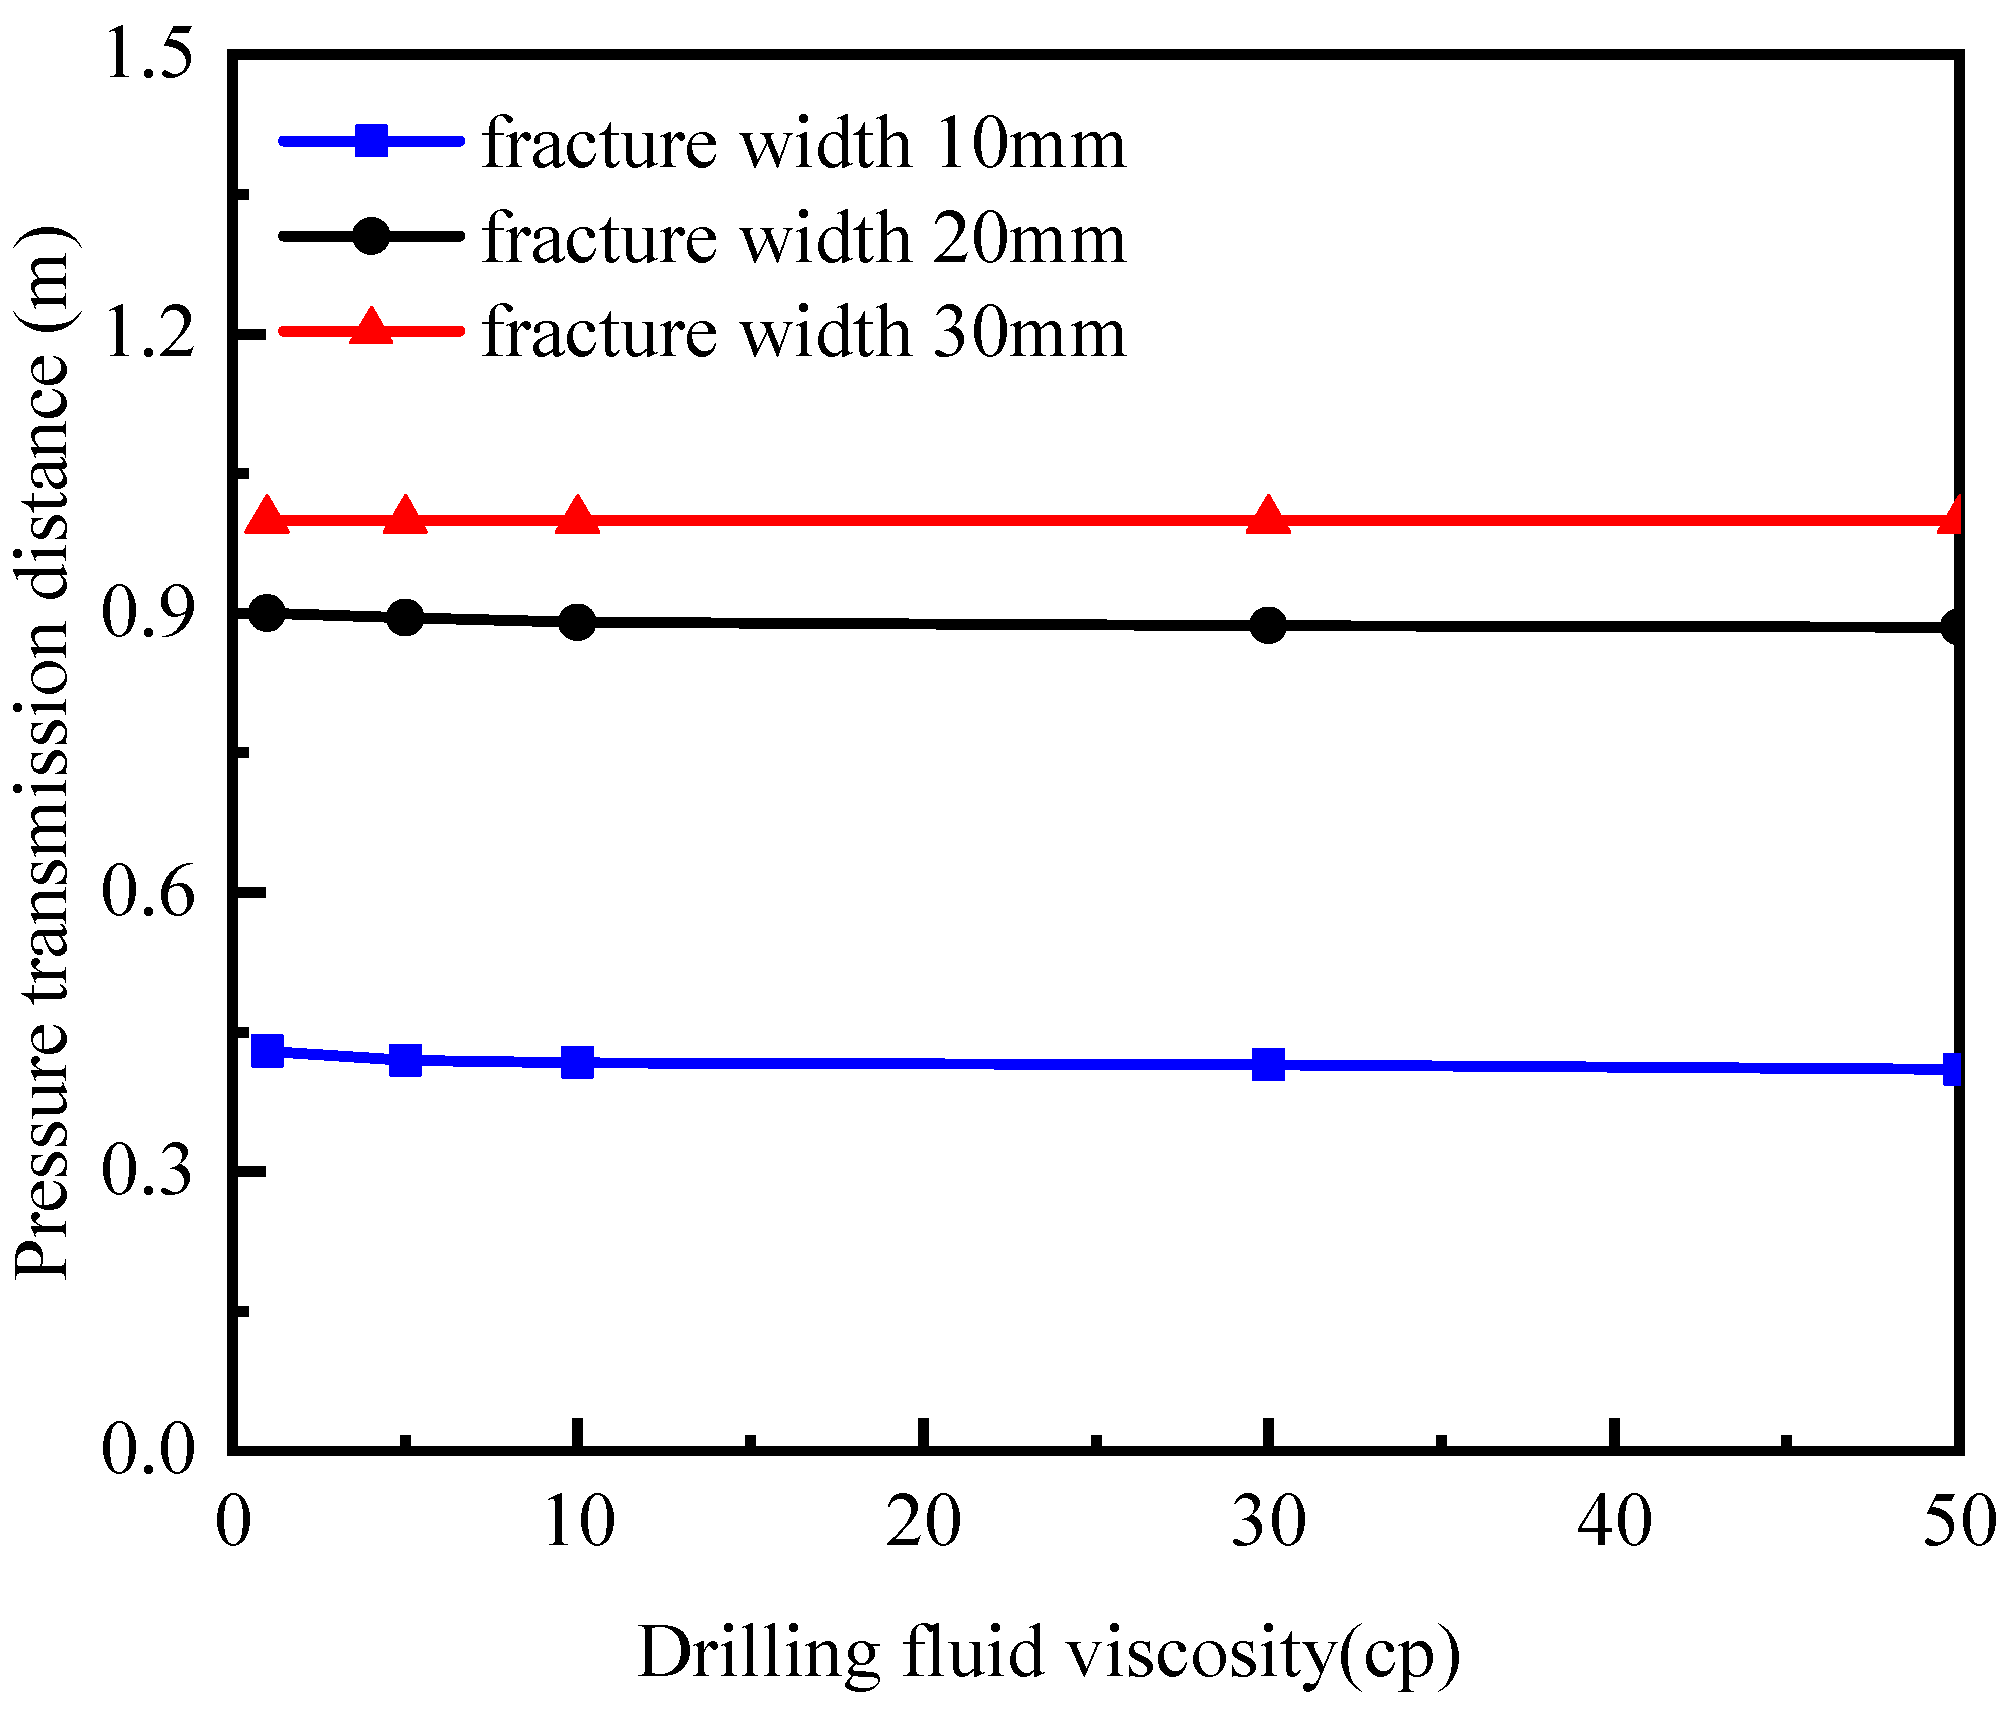
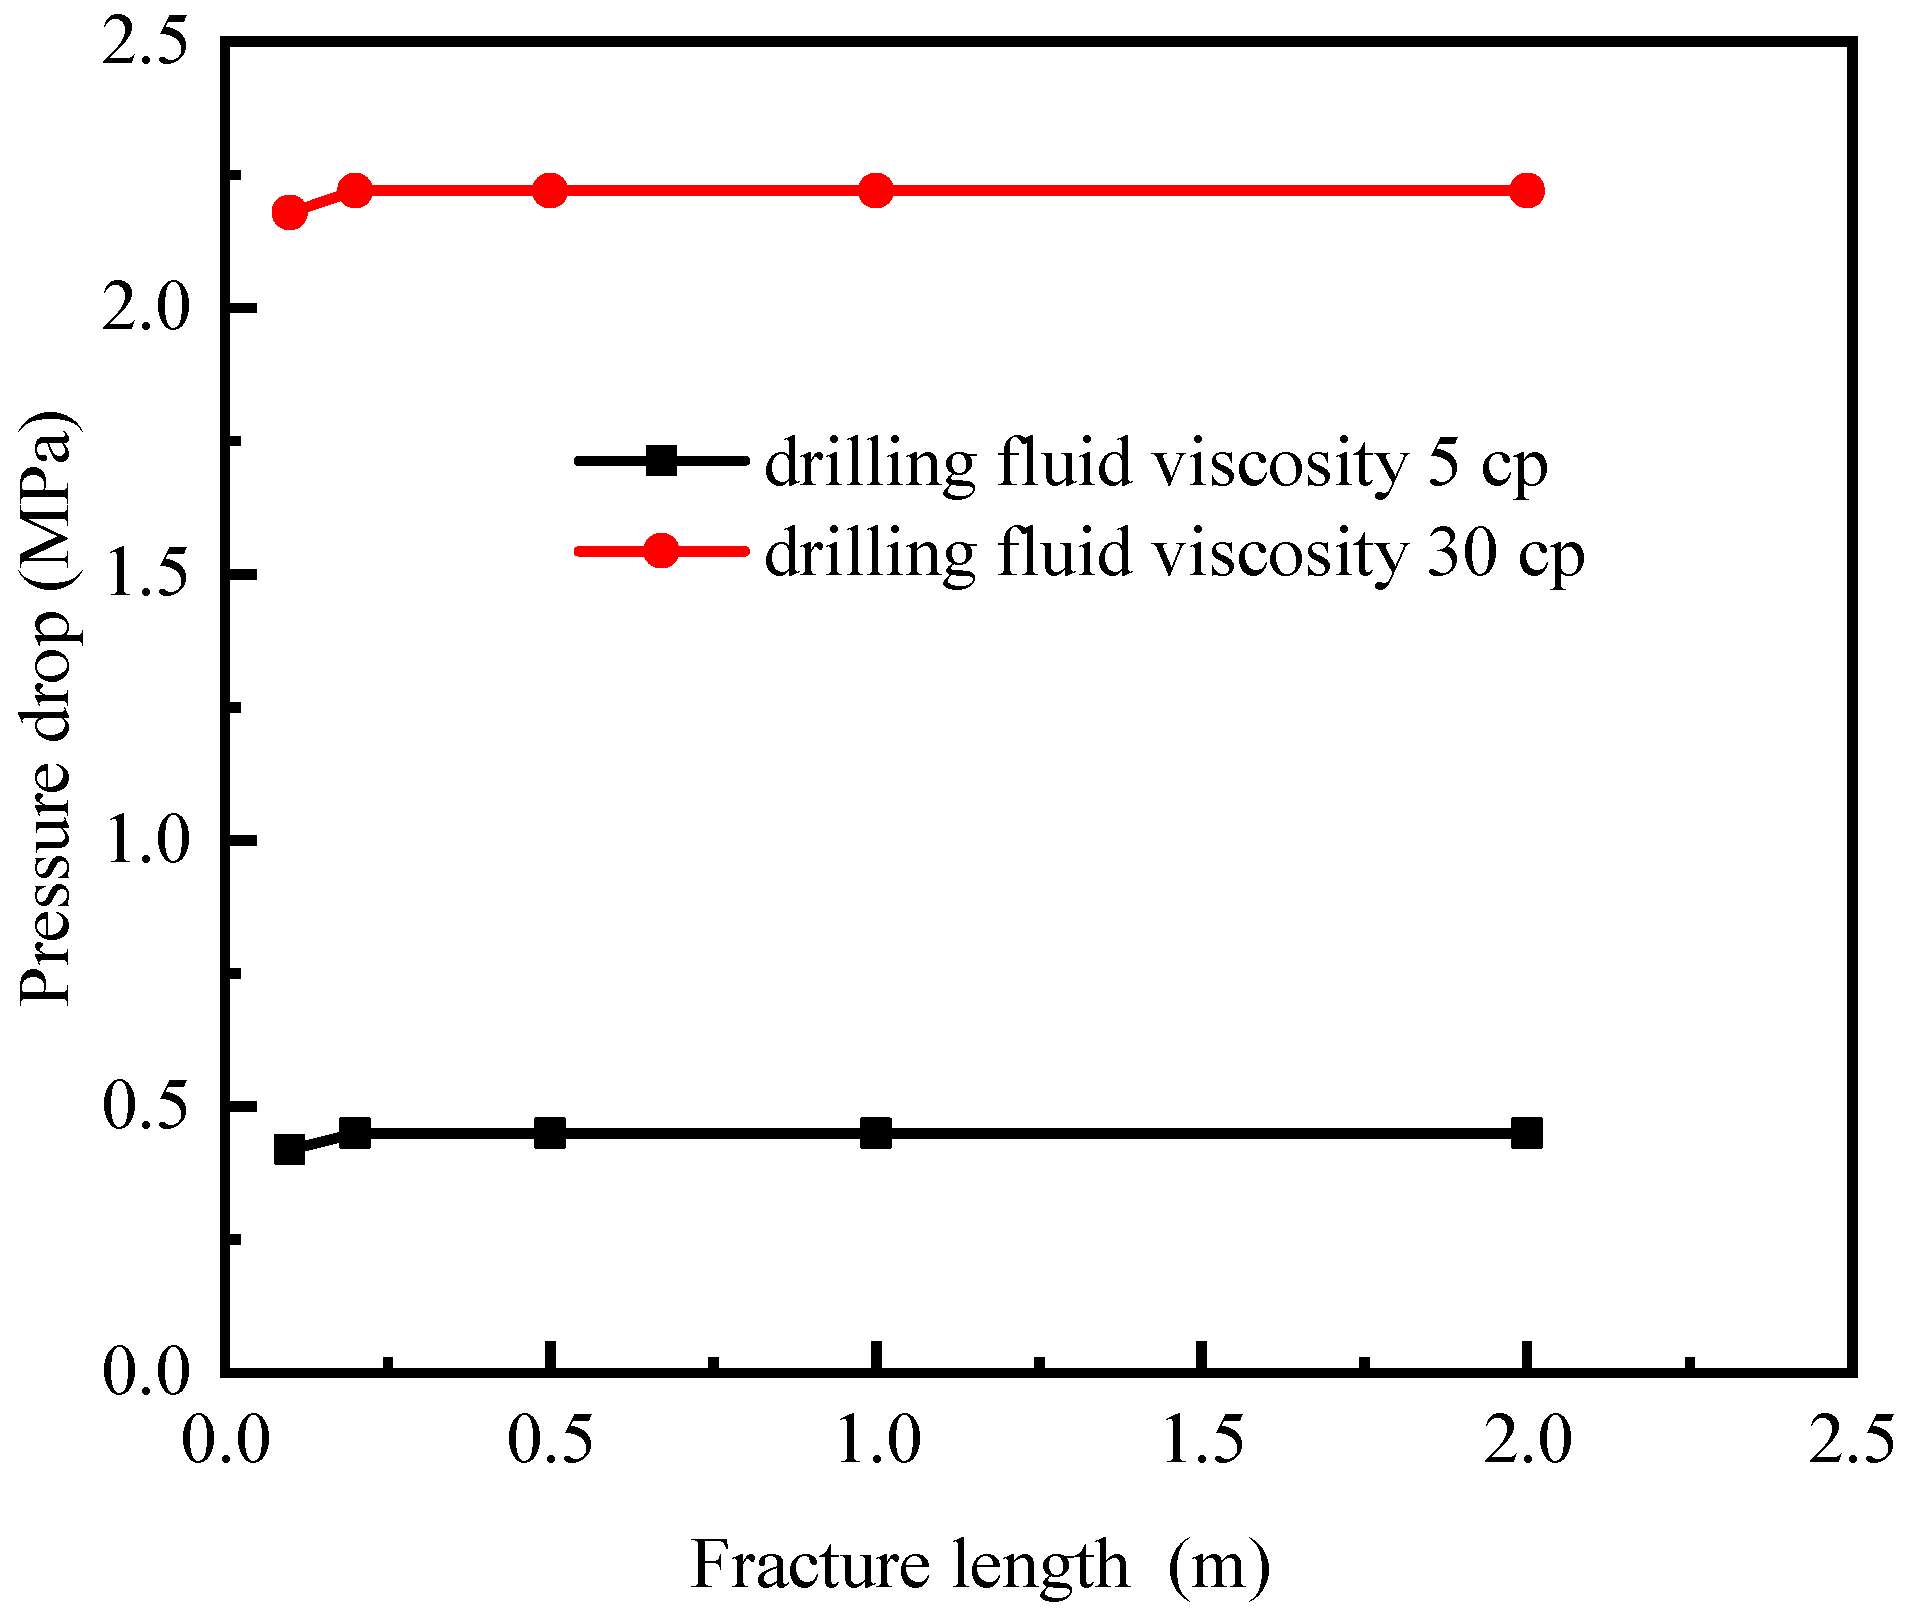
4.1. Influence of Drilling Fluid Viscosity

To thoroughly investigate the impact of drilling fluid viscosity on the dynamic wellbore fracture pressure, the numerical simulation results (Figure 3 and Figure 4) indicate that under the condition of constant fracture width, there is a significant positive correlation between the wellbore pressure drop and the drilling fluid viscosity. When the mud viscosity increases from 10 cp to 50 cp, the pressure drop within the fracture system increases by as much as 271–401%, while the pressure transmission distance shows only a relatively slight decrease of 0–2%. On the contrary, under the condition of constant mud viscosity (30 cp), when the fracture width increases from 10 mm to 30 mm, the pressure drop significantly decreases by approximately 62%, while the pressure transmission distance increases rapidly by 150%. The results clearly reveal that fracture width is the dominant controlling parameter in the pressure transmission process, while the primary role of drilling fluid viscosity is focused on the fine adjustment of pore pressure in the near-well zone. Therefore, in engineering practice, a differentiated strategy for optimizing drilling fluid parameters should be implemented based on the development degree of fractures in the formation. For narrow fracture formations, the drilling fluid viscosity should be prioritized to effectively control the concentration of wellbore stress. In wide fracture formation environments, however, it is necessary to jointly optimize the drilling fluid viscosity and fracture width-related parameters to suppress the risk of remote formation loss.

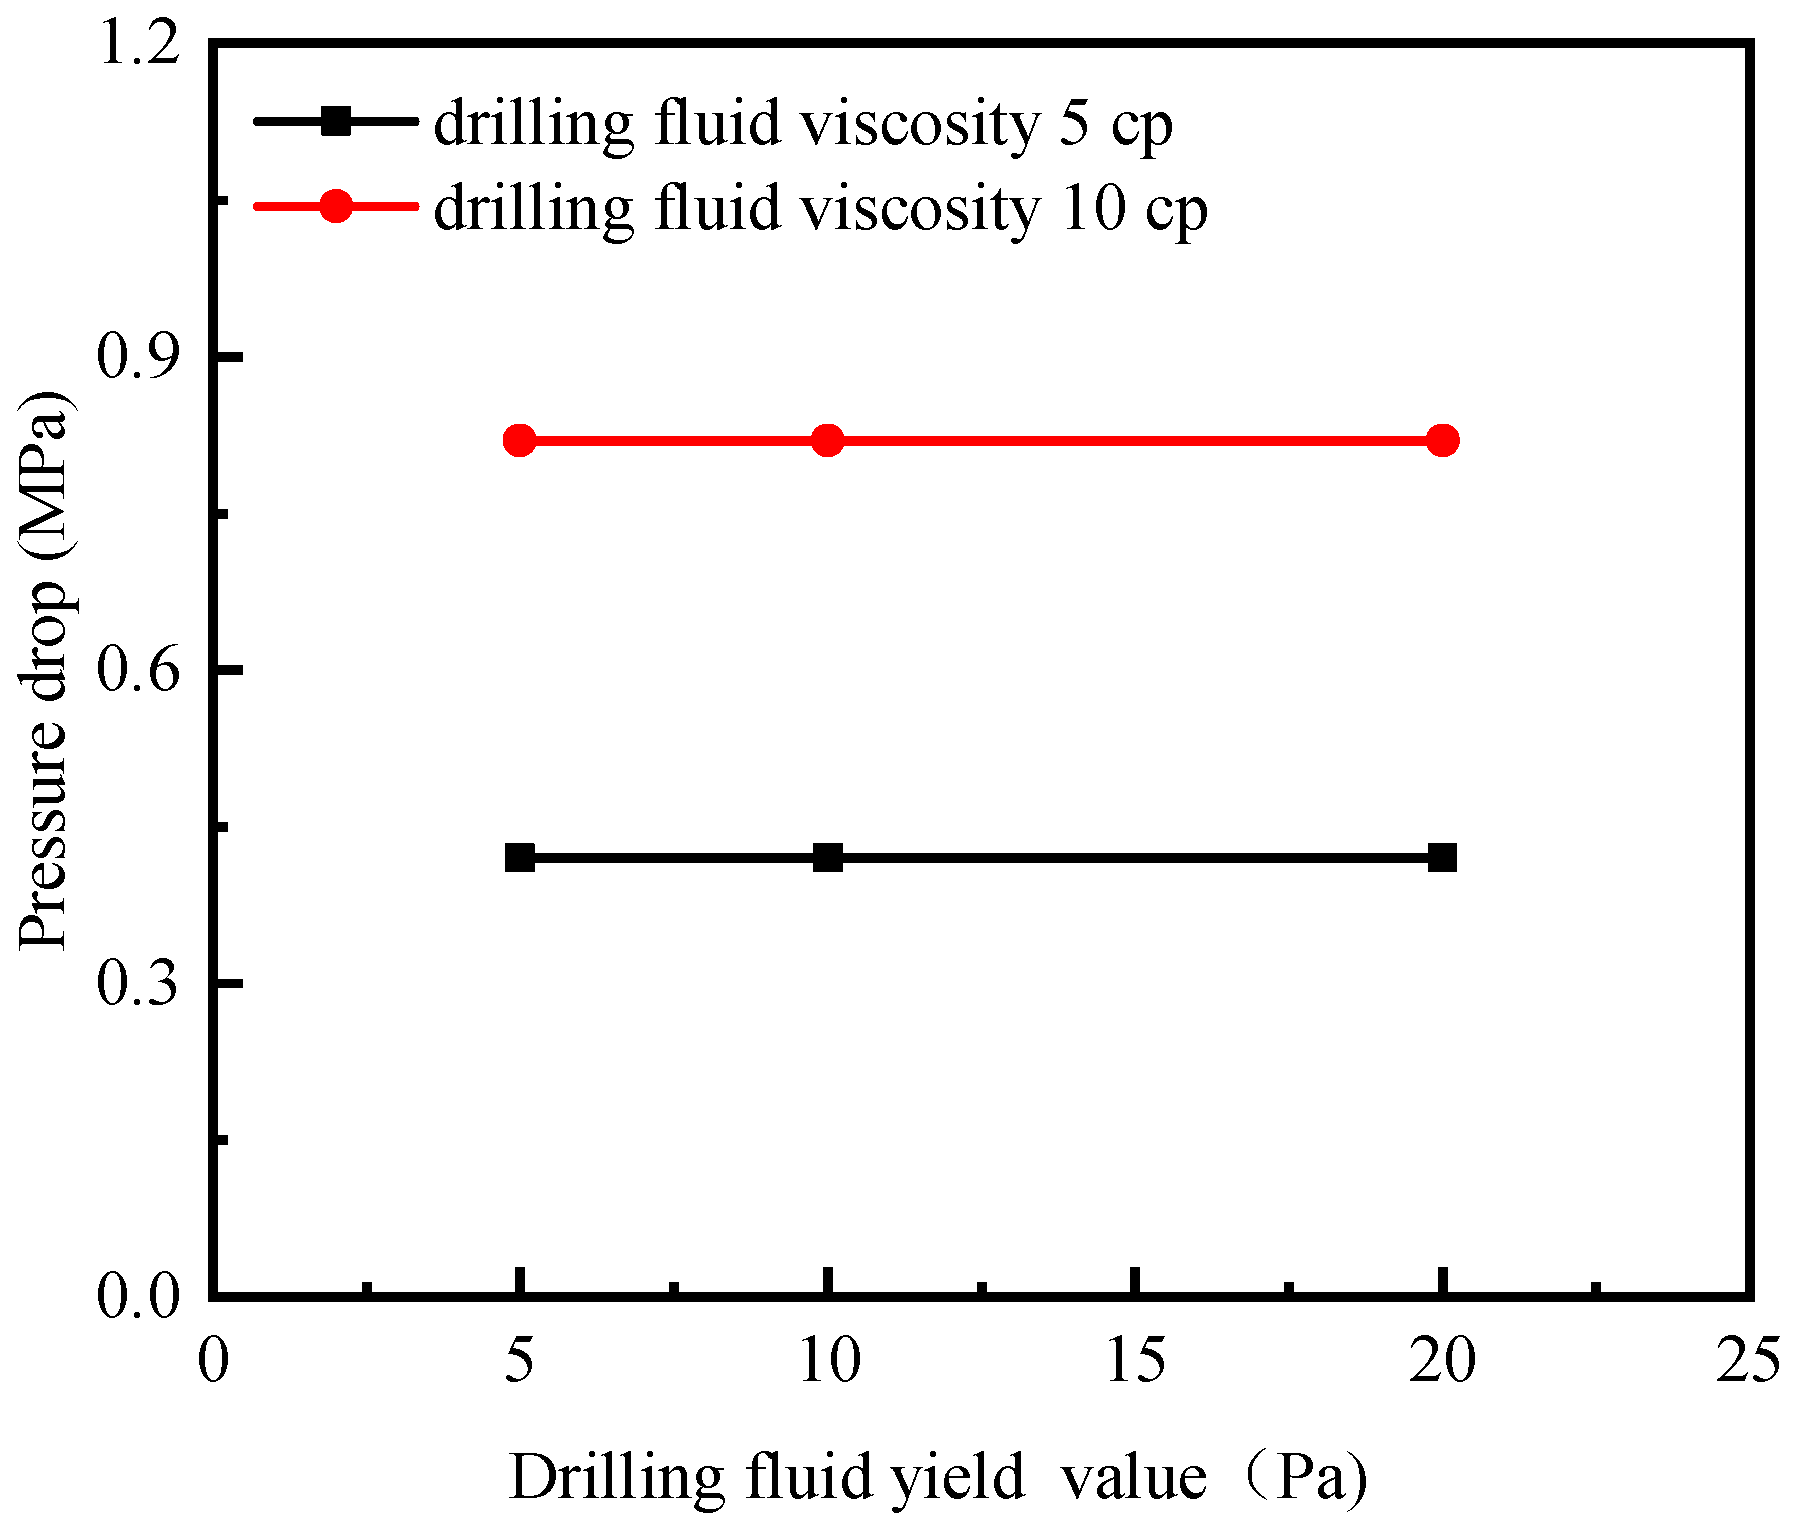
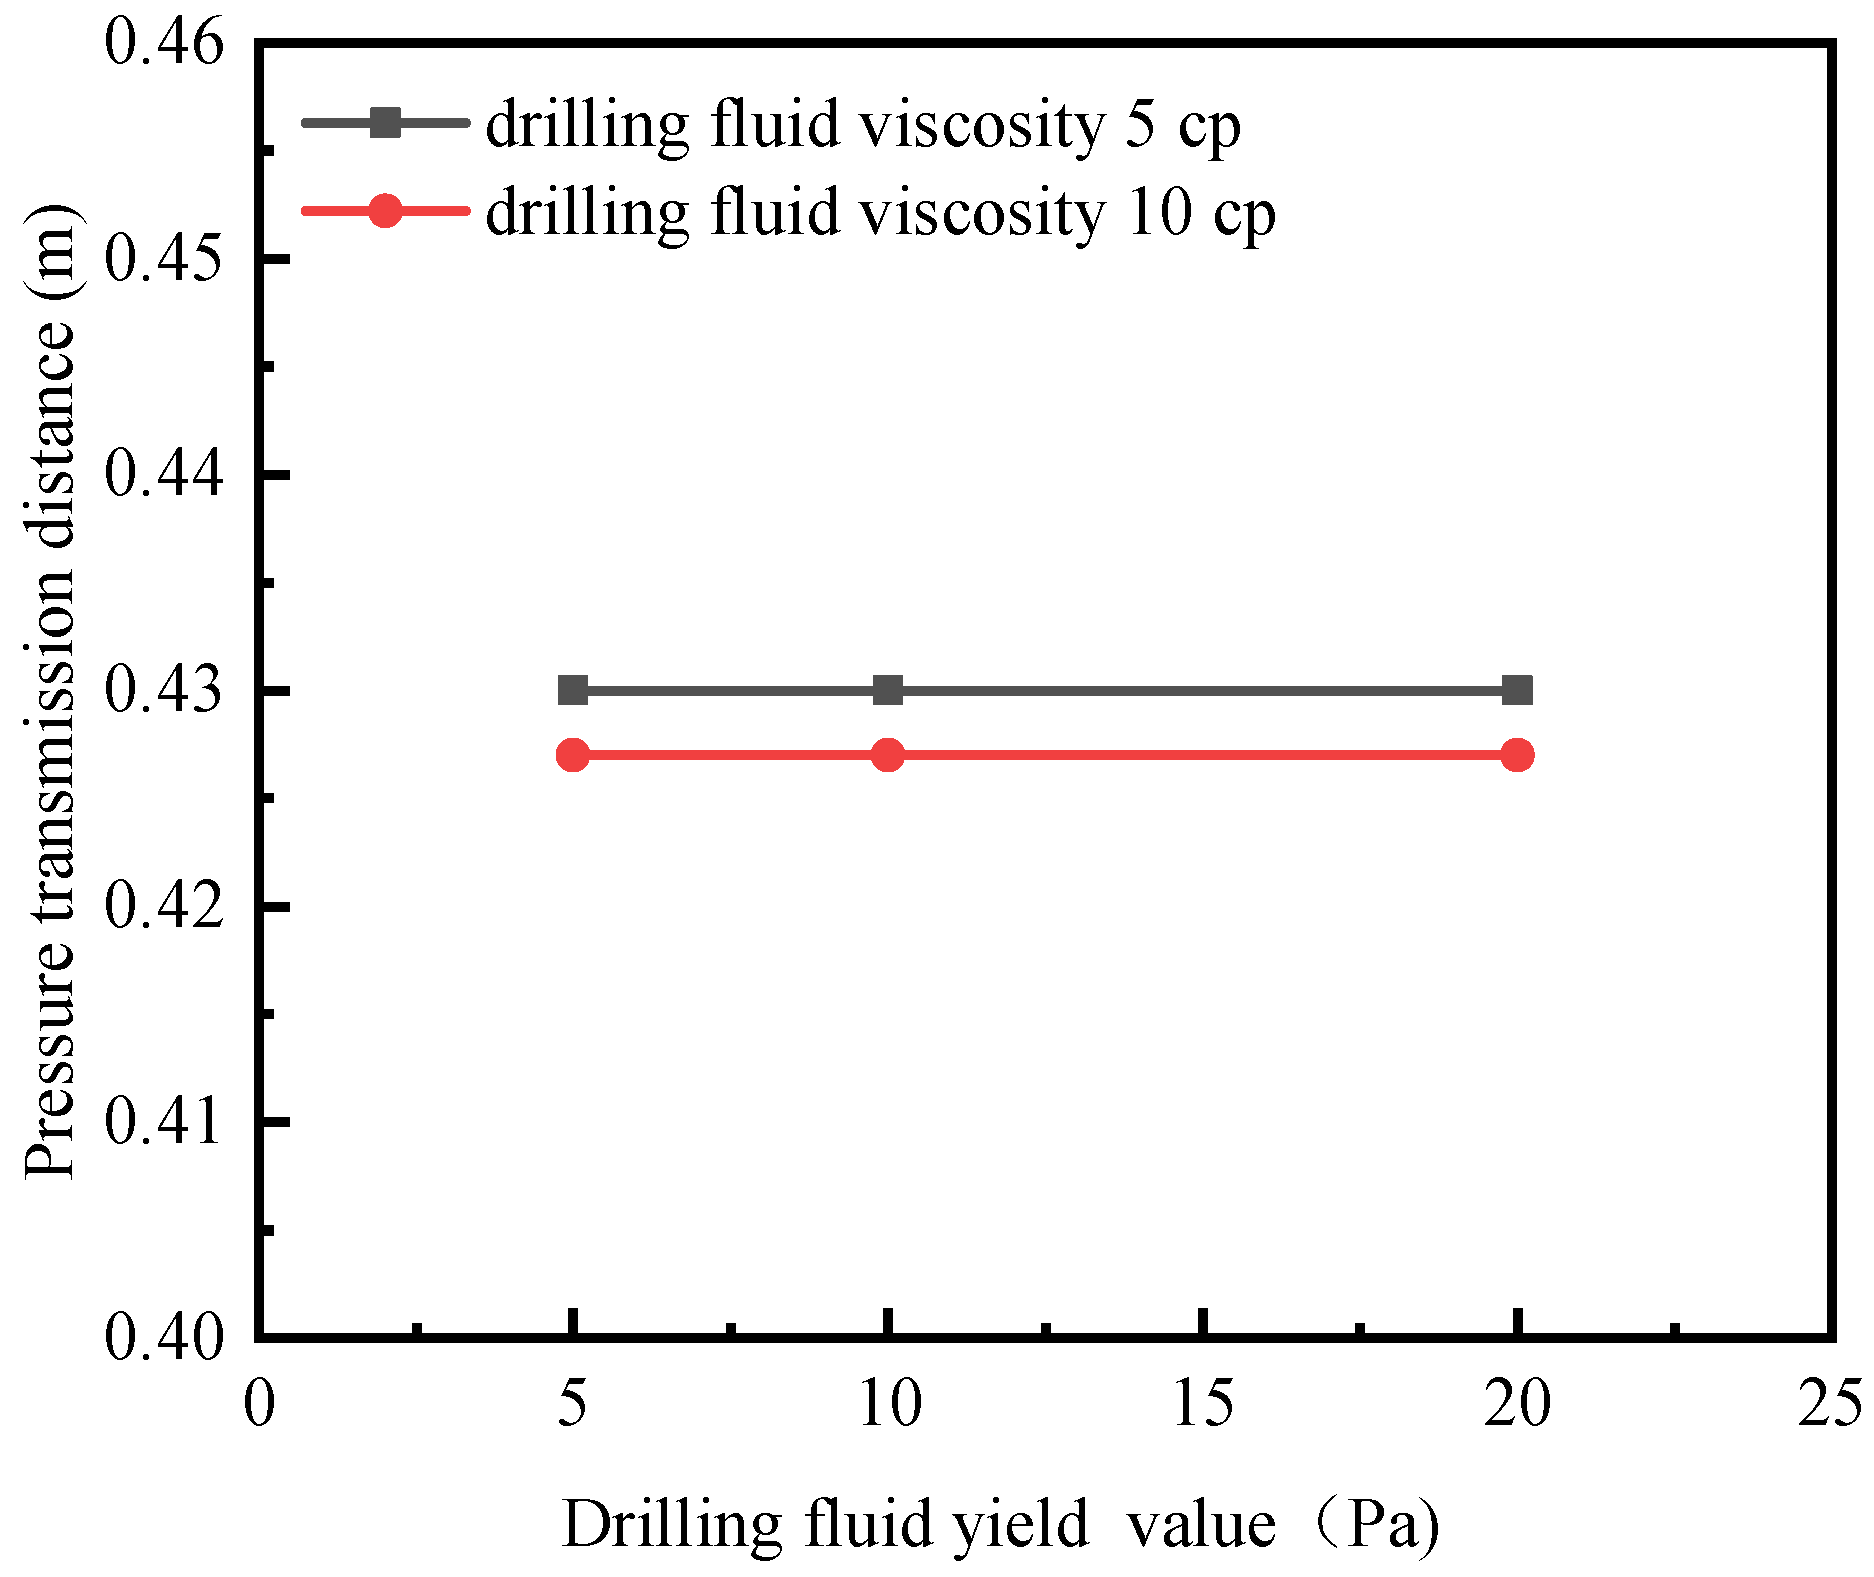
4.2. Influence of Drilling Fluid Yield

To thoroughly investigate the impact of drilling fluid yield value on the dynamic wellbore fracture pressure, the simulation parameters were set as follows: fracture length 0.5 m, fracture width 10 μm, and drilling fluid viscosity at 10 cp. The yield value of the drilling fluid varied within the range of 5 Pa to 20 Pa. As shown in Figure 5 and Figure 6, under conditions where the drilling fluid viscosity, fracture width, and fracture length were kept constant, both the pressure drop and pressure transmission distance exhibited nearly horizontal trends as the yield value of the drilling fluid increased, with minimal changes in magnitude. This result suggests that in cases where the fracture width is constrained, the pressure drop dominated by viscous forces may far exceed the yield stress threshold, thereby masking the potential effects of variations in the yield stress. The implications of this mechanism for engineering practices are as follows: in formations with sub-millimeter-scale fractures, the core focus of drilling fluid design should be on precise control of the viscosity parameters, while the optimization window for the yield stress can be extended to 3–4 times the conventional design standards. This approach not only maintains wellbore stability requirements but also significantly reduces the cost of using rheological modifiers.

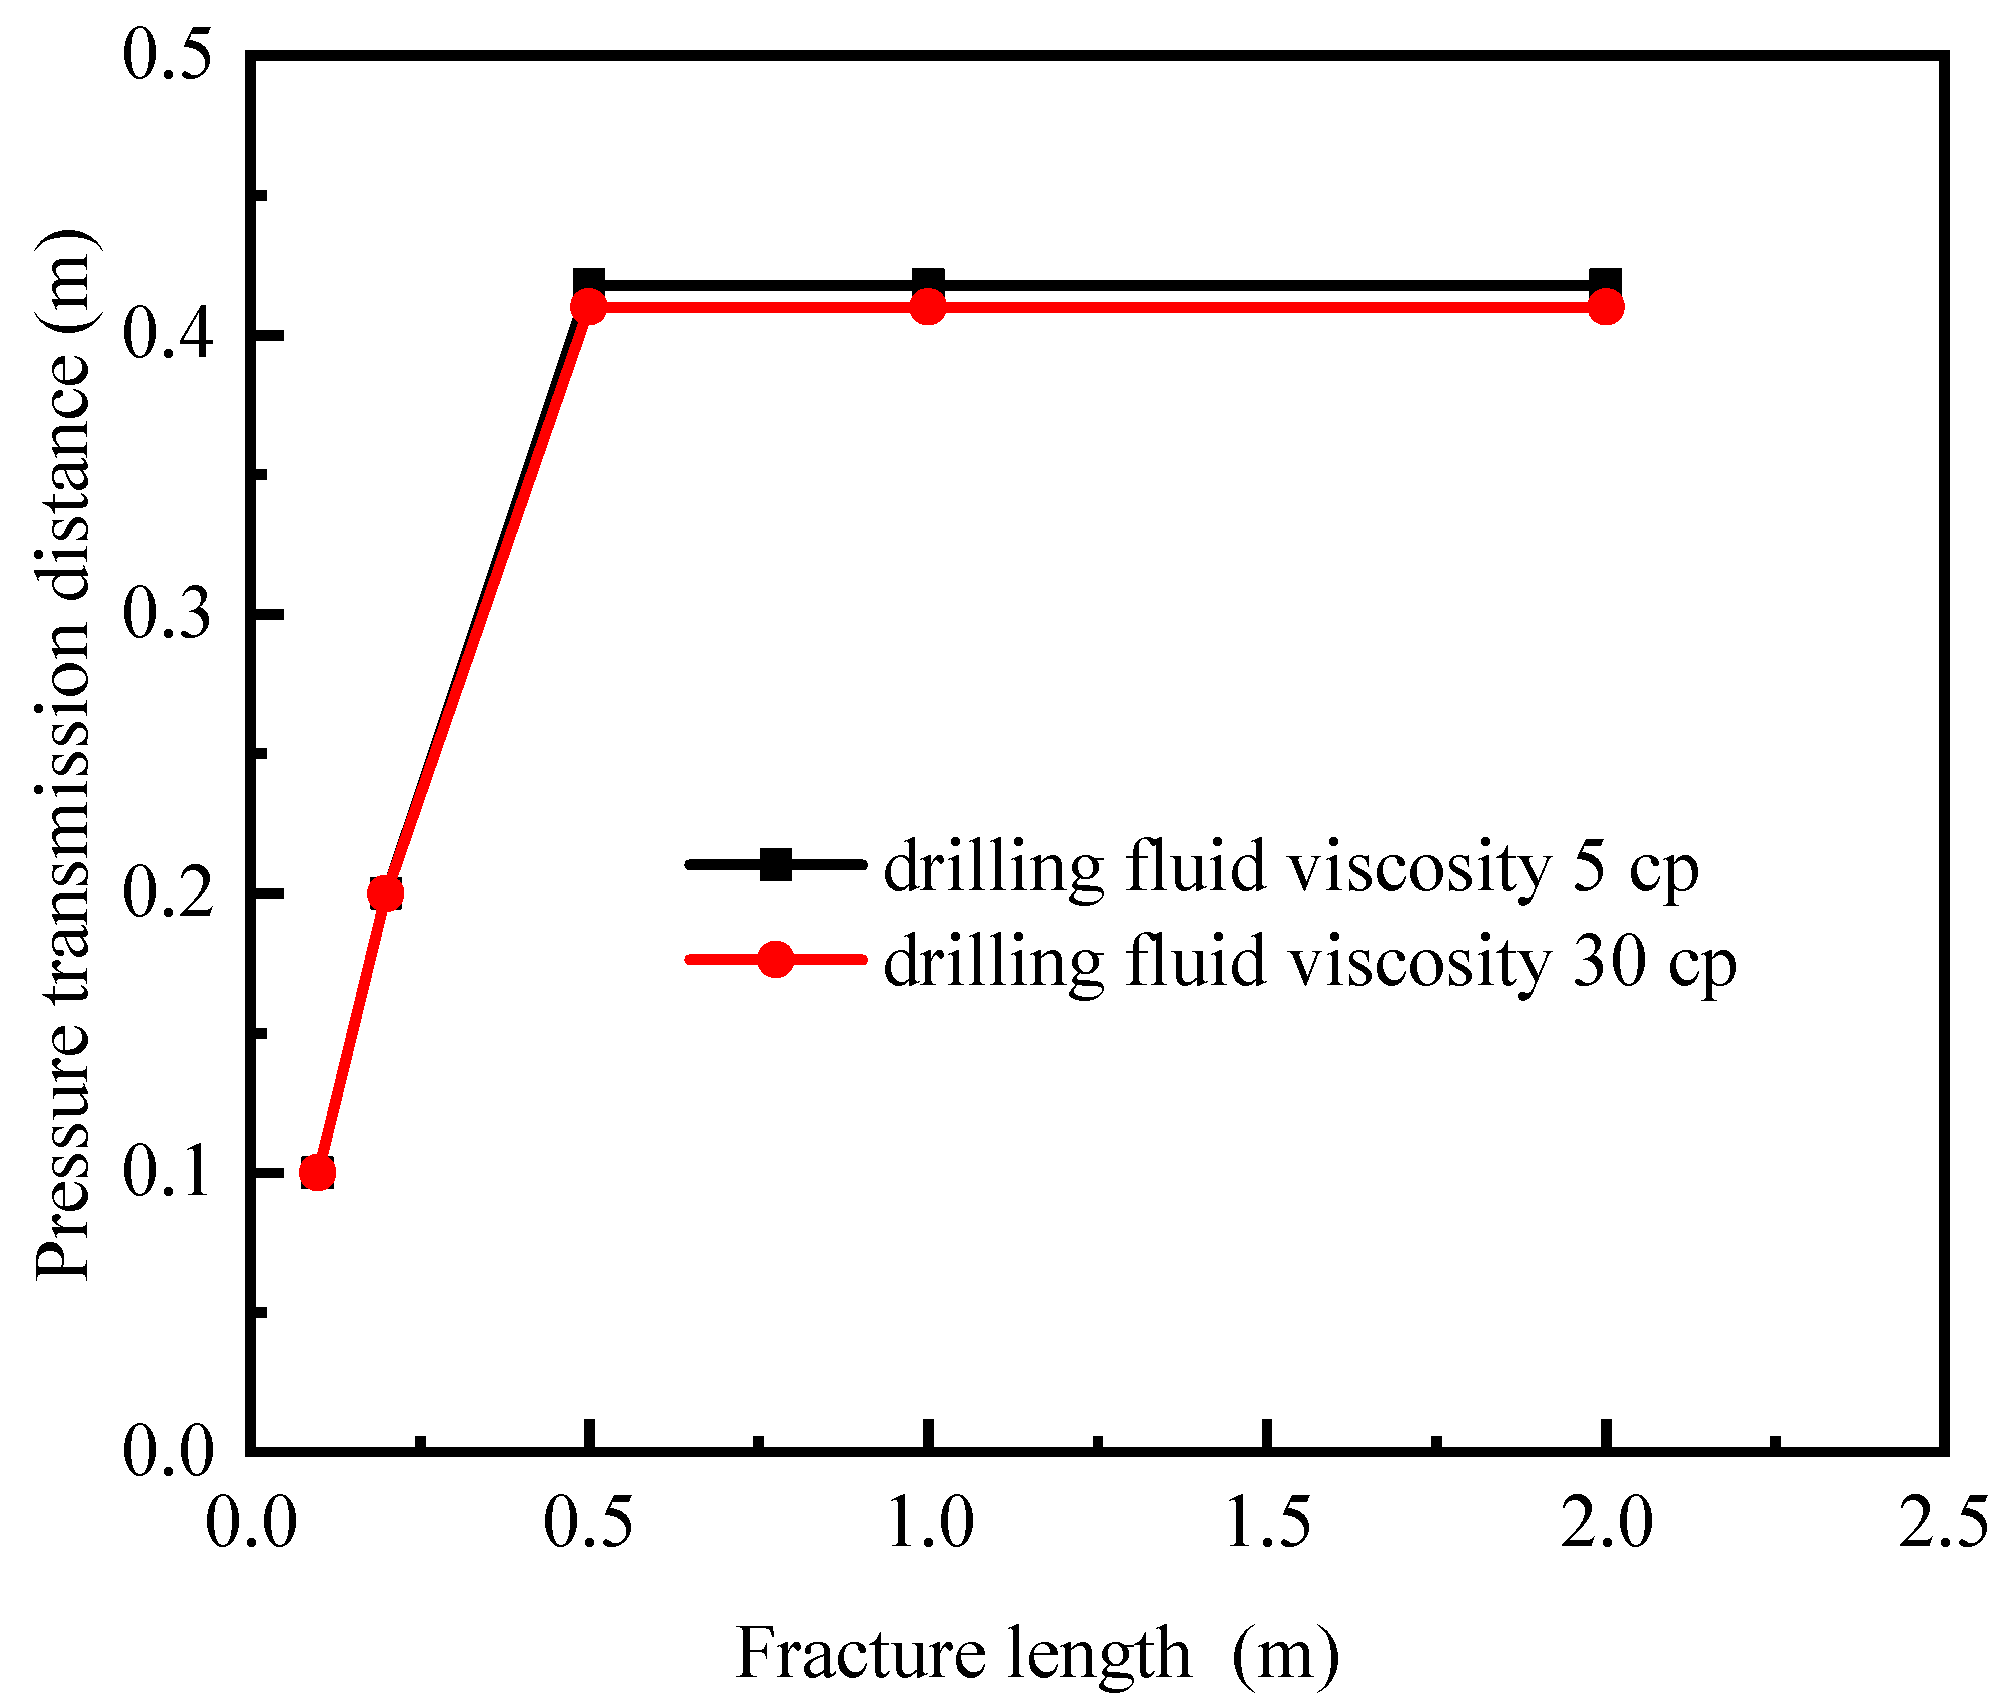
4.3. Influence of Crack Length L

The influence of fracture width b on pore pressure and pressure transmission distance in fractures around wells has been mentioned earlier. With the increase in fracture width b, pressure drop ΔP decreases and pressure transmission distance Ltransmit increases rapidly. The fracture length L is 0.1 m, 0.2 m, 0.5 m, 1 m and 2 m, fracture width b is 10 μm, drilling fluid viscosity μdf is 5 cp and 30 cp, and drilling fluid yield value τy is 10 Pa. It can be seen from Figure 7 and Figure 8 that when the drilling fluid viscosity, fracture width, and yield value are the same, the pressure drop ΔP increases slowly before the fracture length L increases to a certain value, and then it does not change. As shown in Figure 7 and Figure 8, the pressure drop ΔP is basically a horizontal line, and the pressure transmission distance Ltransmit increases first, and then it does not change. In addition, it is found that Ltransmit and ΔP will change with the change in fracture length B only when the pressure transmission distance Ltransmit is less than the fracture length L, which indicates that the fracture length has little effect on the pore pressure in the fracture around the well, but the pressure transmission distance has great effect.
To thoroughly investigate the impact of fracture length on the dynamic wellbore fracture pressure, this study conducted numerical simulation experiments with the following parameter settings: the fracture length was set within a range of 0.1 m to 2 m (specifically 0.1 m, 0.2 m, 0.5 m, 1 m, and 2 m), the fracture width was fixed at 10 μm, the drilling fluid viscosity was set to 5 cp and 30 cp, and the drilling fluid yield value was set to 10 Pa. Under the condition of maintaining constant drilling fluid viscosity, fracture width, and yield value, the effect of fracture length on the wellbore fracture pressure response exhibited the following characteristics:
Pressure Drop: When the fracture length increases from 0.1 m to 0.2 m, the pressure drop shows a slight increase. However, when the fracture length exceeds 0.2 m, the pressure drop tends to stabilize, and further increases in fracture length no longer cause significant changes in the pressure drop.
Pressure Transmission Distance: The variation trend of the pressure transmission distance is similar to that of the pressure drop. When the fracture length is short (0.1 m to 0.2 m), the pressure transmission distance increases synchronously with the fracture length. However, when the fracture length exceeds 0.5 m, the pressure transmission distance also quickly stabilizes, and the continued increase in fracture length contributes minimally to the extension of the pressure transmission distance.

5. Conclusions

This paper analyzes the influence of drilling fluid rheological properties on the stability of wellbores in hard and brittle shale formations through numerical simulation and draws the following conclusions:
(1)
There are numerous micro-fractures in hard and brittle shale, typically sized between 0.5 μm and 30 μm, which serve as the primary flow channels for the filtrate. The micro-fracture sizes in hard and brittle shale are generally larger than 0.1 μm, and the fluid flow within them falls under micro-flow, which produces a micro-flow effect. However, the Navier–Stokes equations and their no-slip boundary conditions remain applicable.
(2)
The influence of drilling fluid rheological properties on pressure transmission in fractures around the wellbore in hard and brittle shale can be divided into two aspects: When the fracture width is equal to the fracture length, an increase in drilling fluid viscosity leads to a rapid increase in pressure drop (ΔP), while the pressure transmission distance decreases slowly. This indicates that drilling fluid viscosity has a significant impact on the pore pressure around the wellbore but a relatively smaller effect on the pressure transmission distance. When the drilling fluid viscosity is equivalent to the fracture width and length, an increase in the drilling fluid yield point results in a slow and minimal decrease in pressure drop (ΔP), while the pressure transmission distance remains largely unchanged. This suggests that within a reasonable range of drilling fluid yield points, the yield point has little influence on the pore pressure or pressure transmission distance around the wellbore.
(3)
Under reasonable drilling fluid rheological parameters, increasing parameters such as drilling fluid viscosity will reduce the rise in pore pressure around the wellbore in hard and brittle shale formations. This reduction in pore pressure also lowers the collapse pressure required to maintain vertical wellbore stability, which is beneficial for improving the stability of wellbores in hard and brittle shale formations.

6. Limitations and Future Work

This study provides valuable insights into the influence of drilling fluid rheology on pressure transmission within micro-fractures in hard brittle shale. However, it is important to acknowledge certain limitations. The numerical model simplifies the complex fracture network geometry to a single fracture and assumes a homogeneous shale matrix. While this simplification is necessary for computational feasibility and to isolate the effects of rheological parameters, it may not fully capture the heterogeneity and complexity of real shale formations. Furthermore, the model neglects fracture propagation and assumes constant fracture aperture during drilling fluid invasion. The range of rheological parameters and fracture dimensions explored in the simulations is based on typical field data but might not encompass the full spectrum of conditions encountered in all hard brittle shale formations. Future research should focus on incorporating more complex fracture network geometries, considering fracture propagation, and validating the model with experimental data across a wider range of parameters to enhance the applicability and robustness of the findings. While direct experimental validation is lacking in this study, convergence tests were performed during model development to ensure numerical stability and accuracy for the chosen spatial step.

Author Contributions

W.S.: Conceptualization, Visualization, Writing—original draft. Y.Z.: Methodology, Supervision, Investigation. W.W.: Investigation, Writing—review and editing. G.J.: Supervision. J.S.: Supervision. C.M.: Data curation, Writing—review and editing. All authors have read and agreed to the published version of the manuscript.

Funding

The authors express their thanks for the financial support provided by the Foundation of the National Natural Science Foundation of China (NO. 41802196), Dynamic Assessment and Deployment Strategy Research on Oil and Gas Prospecting Initiatives (NO. DD20242067) and CNPC Innovation Found (NO. 2024DQ02-0149).

Data Availability Statement

The original contributions presented in this study are included in the article. Further inquiries can be directed to the corresponding authors.

Conflicts of Interest

We declare that we have no financial and personal relationships with other people or organizations that can inappropriately influence our work and there is no professional or other personal interest of any nature or kind in any product, service and/or company that could be construed as influencing the position presented in, or the review of, the manuscript entitled.

References

  1. Li, H. Coordinated development of shale gas benefit exploitation and ecological environmental conservation in China: A mini review. Front. Ecol. Evol. 2023, 11, 1232395. [Google Scholar] [CrossRef]
  2. Zou, C.; Dong, D.; Wang, Y.; Li, X.; Hung, J.; Wang, S.; Guan, Q.; Zhang, C.; Wang, H.; Liu, H.; et al. Shale gas in China: Characteristics, challenges and prospects (I). Pet. Explor. Dev. 2015, 42, 753–767. [Google Scholar] [CrossRef]
  3. Zou, C.; Dong, D.; Wang, Y.; Li, X.; Hung, J.; Wang, S.; Guan, Q.; Zhang, C.; Wang, H.; Liu, H.; et al. Shale gas in China: Characteristics, challenges and prospects (II). Pet. Explor. Dev. 2016, 43, 182–196. [Google Scholar] [CrossRef]
  4. Sun, J.; Lu, C.; Li, Z.; Ouyang, G.; Cao, X.; Zhou, F. Characteristics of stress distribution and microseismic activity in rock parting occurrence area. J. Min. Strat. Control Eng. 2021, 3, 043518. [Google Scholar]
  5. Jin, Y.; Zhang, Y.; Lu, Y. Progress and reflections on the microcrack growth mechanism of hard-brittle shale under chemical-mechanical couplings. Pet. Sci. Bull. 2023, 5, 577–587. [Google Scholar]
  6. Fjaer, E.; Holt, R.M.; Horsrud, P.; Raaen, A.M. Petroleum Related Rock Mechanics; Elsevier: Amsterdam, The Netherlands, 2008. [Google Scholar]
  7. Li, H.; Zhu Deng, J.; Zhang, Y.; Li, Z.; Li, X. Study and Application of Wellbore Stability in Offshore Drilling: A case study of Well A-1. Sci. Technol. Eng. 2022, 22, 16007–16015. [Google Scholar]
  8. Lal, M. Shale stability: Drilling fluid interaction and shale strength. In Proceedings of the SPE Asia Pacific Oil and Gas Conference and Exhibition, Jakarta, Indonesia, 20–22 April 1999; SPE-54356-MS. SPE: Dallas, TX, USA, 1999. [Google Scholar]
  9. Van Oort, E. On the physical and chemical stability of shales. J. Pet. Sci. Eng. 2003, 38, 213–235. [Google Scholar] [CrossRef]
  10. Schoenball, M.; Sahara, D.P.; Kohl, T. Time-dependent brittle creep as a mechanism for time-delayed wellbore failure. Int. J. Rock Mech. Min. Sci. 2014, 70, 400–406. [Google Scholar] [CrossRef]
  11. Zoback, M.D. Reservoir Geomechanics; Cambridge University Press: Cambridge, UK, 2010. [Google Scholar]
  12. Xiao, Z.; Jia, S.; Qi, X.; Dai, Y.; Lv, F.; Jia, L.; Wen, C. Hydraulic-mechanical-chemical coupling evaluation for progressive failure of hard brittle shale wellbore. J. Cent. South Univ. (Sci. Technol.) 2019, 50, 2464–2480. [Google Scholar]
  13. Ewy, R.T. Practical approaches for addressing shale testing challenges associated with permeability, capillarity and brine interactions. Geomech. Energy Environ. 2018, 14, 3–15. [Google Scholar] [CrossRef]
  14. Roychaudhuri, B.; Tsotsis, T.T.; Jessen, K. Shale-fluid interactions during forced lmbibition and flow-back. J. Pet. Sci. Eng. 2019, 172, 443–453. [Google Scholar] [CrossRef]
  15. Abdullah, A.H.; Ridha, S.; Mohshim, D.F.; Yusuf, M.; Kamyab, H.; Krishna, S.; Maoinser, M.A. A comprehensive review of nanoparticles: Effect on water-based drilling fluids and wellbore stability. Chemosphere 2022, 308, 136274. [Google Scholar] [CrossRef]
  16. Luo, J.; Xu, S.; Wu, X. Influence of silicate base drilling fluid on wellbore stability of shale. Drill. Fluid Complet. Fluid 2006, 23, 17–20. [Google Scholar]
  17. Yao, R.; Jiang, G.; Li, W.; Zhang, H. Research and Application of Permitted Rheological Parameter Control Window of Drilling Fluid. Sci. Technol. Eng. 2013, 13, 1671–1815. [Google Scholar]
  18. Yamamoto, K.; Shioya, Y.; Uryu, N. Discrete element approach for the wellbore instability of laminated and fissured rocks. In Proceedings of the SPE/ISRM Rock Mechanics Conference, Irving, TX, USA, 20–23 October 2002; SPE-78181-MS. SPE: Dallas, TX, USA, 2002. [Google Scholar]
  19. Roshan, H. Three Dimensional Non-Linear Anisotropic Thermo-Chemo-Poro-Elastoplastic Modelling of Borehole Stability in Chemically Active Rocks; UNSW: Sydney, Australia, 2011. [Google Scholar]
  20. Kong, Y.; Han, F.; Yao, L.; Zhang, G.; Liu, J. Simulation and application of shale fracture width immersed in drilling fluid. Oil Drill. Prod. Technol. 2014, 36, 41–46. [Google Scholar]
  21. Song, S.; Wu, Y.; Fu, Y.; Liu, D.; Zhou, P. Experimental study on shear mechanical properties of anchored rock mass under impact load. J. Min. Strat. Control. Eng. 2021, 3, 043034. [Google Scholar]
  22. Gholami, R.; Elochukwu, H.; Fakhari, N.; Sarmadivaleh, M. A review on borehole instability in active shale formations: Interactions, mechanisms and inhibitors. Earth-Sci. Rev. 2018, 177, 2–13. [Google Scholar] [CrossRef]
  23. Lee, H.; Ong, S.H.; Azeemuddin, M.; Goodman, H. A wellbore stability model for formations with anisotropic rock strengths. J. Pet. Sci. Eng. 2012, 96, 109–119. [Google Scholar] [CrossRef]
  24. Nguyen, V.X.; Abousleiman, Y.N. The porochemothermoelastic coupled solutions of stress and pressure with applications to wellbore stability in chemically active shale. In Proceedings of the SPE Annual Technical Conference and Exhibition, New Orleans, LA, USA, 4–7 October 2009; SPE-124422-MS. SPE: Dallas, TX, USA, 2009. [Google Scholar]
  25. Xu, C.; Liu, J.; Tian, Y.; Xiao, W.; Xu, T.; Cai, W. Research on mechanism and treating methods of wellbore instability in fractured and hard brittle mudstone. Drill. Fluid Complet. Fluid 2013, 30, 13–16. [Google Scholar]
  26. Jia, L.; Chen, M.; Tan, Q.; Sun, Z.; Wu, S. Key Factors for Inhibiting Fracture Propagation during Leakage Control under Pressure. Pet. Drill. Tech. 2016, 44, 49–56. [Google Scholar] [CrossRef]
  27. Cheng, C.; Bunger, A.P. Optimizing fluid viscosity for systems of multiple hydraulic fractures. AIChE J. 2019, 65, e16564. [Google Scholar] [CrossRef]
  28. Zhao, H.; Fan, S.; Lian, S.; Li, S.; Cheng, X.; Ke, D. Study on high temperature resistant weak gel anti gas invasion drilling fluid system in Shunbei oil and gas field. Drill. Fluid Complet. Fluid 2023, 40, 332–339. [Google Scholar]
  29. Gholami, R.; Raza, A.; Rabiei, M.; Fakhari, N.; Balasubramaniam, P.; Rasouli, V.; Nagarajan, R. An approach to improve wellbore stability in active shale formations using nanomaterials. Petroleum 2021, 7, 24–32. [Google Scholar] [CrossRef]
  30. Li, M.; Xu, J.; Pei, D.; Su, K.; Wang, L. Evaluation of Aminated Nano-Silica as a Novel Shale Stabilizer to Improve Wellbore Stability. Materials 2024, 17, 1776. [Google Scholar] [CrossRef] [PubMed]
  31. Mao, H.; Yang, Y.; Zhang, H.; Zheng, J.; Zhong, Y. Conceptual design and methodology for rheological control of water-based drilling fluids in ultra-high temperature and ultra-high pressure drilling applications. J. Pet. Sci. Eng. 2020, 188, 106884. [Google Scholar] [CrossRef]
  32. Rodrigues, R.K.; Martins, S.d.F.C.; Naccache, M.F.; de Souza Mendes, P.R. Rheological modifiers in drilling fluids. J. Non-Newton. Fluid Mech. 2020, 286, 104397. [Google Scholar] [CrossRef]
  33. Zheng, D.; Miska, S.; Ozbayoglu, E.; Zhang, J. Combined experimental and well log study of anisotropic strength of shale. In Proceedings of the SPE Annual Technical Conference and Exhibition, San Antonio, TX, USA, 16–18 October 2023; D031S046R003. SPE: Dallas, TX, USA, 2023. [Google Scholar]
  34. Zheng, D.; Miska, S.; Ziaja, M.; Zhang, J. Study of anisotropic strength properties of shale. AGH Drill. Oil Gas 2019, 36, 93–112. [Google Scholar] [CrossRef]
  35. Zheng, D.; Ozbayoglu, E.; Miska, S.; Zhang, J. Experimental study of anisotropic strength properties of shale. In Proceedings of the ARMA US Rock Mechanics/Geomechanics Symposium, Atlanta, GA, USA, 25–28 June 2023; ARMA-2023-0128. ARMA: Alexandria, VA, USA, 2023. [Google Scholar]
  36. Suo, Y.; Li, Z.H.; Fu, X.F.; Zhang, C.-C. Comprehensive study of hydraulic fracturing in shale oil reservoirs comprising shale–sandstone transitions. Phys. Fluids 2024, 36, 077161. [Google Scholar] [CrossRef]
  37. Suo, Y.; Zhao, Y.J.; Fu, X.F.; Fu, X.F.; He, W.Y.; Pan, Z. Study on fracture propagation behavior of deep high-temperature shale gas based on the modified MERR criterion. Theor. Appl. Fract. Mech. 2024, 131, 104352. [Google Scholar] [CrossRef]
  38. Rafieepour, S.; Zheng, D.; Miska, S.; Ozbayoglu, E.; Takach, N.; Yu, M.; Zhang, J. Combined experimental and well log evaluation of anisotropic mechanical properties of shales: An application to wellbore stability in bakken formation. In Proceedings of the SPE Annual Technical Conference and Exhibition, Virtual, 27–29 October 2020; D021S015R006. SPE: Dallas, TX, USA, 2020. [Google Scholar]
  39. Zheng, D.; Turhan, C.; Wang, N.; Wu, C.; Ashok, P.; van Oort, E. Prioritizing wells for repurposing or permanent abandonment based on generalized well integrity risk analysis. In Proceedings of the SPE/IADC Drilling Conference and Exhibition, Galveston, TX, USA, 5–7 March 2024; D021S018R001. SPE: Dallas, TX, USA, 2024. [Google Scholar]
  40. Suo, Y.; Li, F.; He, W.; Fu, X.; Pan, Z.; Feng, F.; Zhao, W. Invasion of drilling fluid into laminated shale model. Chin. J. Eng. 2024, 46, 547–555. [Google Scholar] [CrossRef]
  41. Bear, J. Dynamics of Fluids in Porous Media; Courier Corporation: Washington, DC, USA, 2013. [Google Scholar]
  42. American Petroleum Institute. API Recommended Practice 13B-1: Recommended Practice for Field Testing of Water-Based Drilling Fluids; API: Washington, DC, USA, 2009. [Google Scholar]
Figure 1. Scanning electron microscopic image of Basin A showing (a) densely packed mineral particles at 300× magnification, (b) flake-like loose structure with micro-fractures and pores at 3000× magnification, and (c,d) flake-like loose structure with micro-fractures and pores at 8000× magnification.
Processes 13 01339 g001
Figure 2. Schematic diagram of drilling fluid invasion flow in a single fracture.
Processes 13 01339 g002
Figure 3. Simulation results of drilling fluid viscosity effect on pressure drop.
Processes 13 01339 g003
Figure 4. Simulation results of the effect of drilling fluid viscosity on pressure transmission distance.
Processes 13 01339 g004
Figure 5. Simulation results of the effect of drilling fluid yield value on pressure drop.
Processes 13 01339 g005
Figure 6. Simulation results of the effect of drilling fluid yield value on pressure transmission distance.
Processes 13 01339 g006
Figure 7. Simulation results of the effect of fracture length on pressure drop.
Processes 13 01339 g007
Figure 8. Simulation results of the effect of fracture length on pressure transfer distance.
Processes 13 01339 g008
Table 1. Drilling fluid field data of Dagang Oil fields.
Well NumberWell Depth (m)Funnel Viscosity (s)Density (g/cm3)Hole Expansion Rate (%)
QG12740–2790361.2748.21
2790–2840381.3329.68
2840–2890561.3516.11
3190–3257821.376.65
QN82900–2950311.2271.37
2950–3000321.2464.42
3200–3250351.2872.83
3250–3300451.348.21
3300–3350581.3423.68
3350–3400721.3515.16
GS93063–3163861.367.29
3163–32131051.384.21
3413–3463451.4220.42
3363–3413431.4122.37
GS183078–3103401.26132.56
3103–3123441.2786.04
3123–3153531.2764.98
3153–3253621.2829.53
3253–3463731.2818.03
GS693273–3373841.288.84
3723–3773581.456.53
GS7-13175–3225901.266.97
T30-223237–3297271.2892.13
3177–3237251.27139.53
Disclaimer/Publisher’s Note: The statements, opinions and data contained in all publications are solely those of the individual author(s) and contributor(s) and not of MDPI and/or the editor(s). MDPI and/or the editor(s) disclaim responsibility for any injury to people or property resulting from any ideas, methods, instructions or products referred to in the content.

