Article

Enhancement of Bacillus subtilis Growth and Sporulation by Two-Stage Solid-State Fermentation Strategy

1
Inner Mongolia Key Laboratory of Environmental Pollution Prevention and Waste Resource Recycle, School of Ecology and Environment, Inner Mongolia University, Hohhot 010021, China
2
Key Laboratory of Ecology and Resource Use of the Mongolian Plateau, Ministry of Education, Inner Mongolia University, Hohhot 010021, China
3
School of Chemistry and Chemical Engineering, Inner Mongolia University of Science and Technology, Baotou 014010, China
*
Author to whom correspondence should be addressed.
Processes 2019, 7(10), 644; https://doi.org/10.3390/pr7100644
Submission received: 19 August 2019 / Revised: 17 September 2019 / Accepted: 17 September 2019 / Published: 20 September 2019
(This article belongs to the Section Biological Processes and Systems)

Abstract

:
Two-stage solid-state fermentation strategy was exploited and systematically optimized to enhance Bacillus subtilis growth and sporulation for increasing effective cell number in B. subtilis microbial ecological agents. The first stage focused on improving cell growth followed by the second stage aiming to enhance both cell growth and sporulation. The optimal fermentation condition was that temperature changed from 37 °C to 47 °C at a fermentation time of 48 h and Mn2+ content in medium was 4.9 mg MnSO4/g dry medium. Solid medium properties were improved by the optimal two-stage fermentation. HPLC results demonstrated that glucose utilization was facilitated and low-field nuclear magnetic resonance (LF-NMR) results showed that more active sites in medium for microbial cells were generated during the optimal two-stage fermentation. Moreover, microbial growth and sporulation were enhanced simultaneously during the second stage of fermentation through delaying microbial decline phase and increasing sporulation rate. As a result, effective cell number of B. subtilis reached 1.79 × 10¹⁰/g dry medium after fermentation for 72 h, which was 29.7% and 8.48% higher than that of conventional fermentation for 72 h and 48 h, respectively. Therefore, the optimal two-stage fermentation could increase the effective cell number of B. subtilis microbial ecological agents efficiently.

1. Introduction

Microbial ecological agents are environmental friendly alternatives to antibiotics, which can be utilized as feed additives for preventing disease and promoting growth of animals [1]. Bacillus subtilis can generate spores, which have strong resistance to environmental stress including heat in drying process, mechanical force in granulation process, and acid in digestive tract. Therefore, B. subtilis is one of the preferred strains during microbial ecological agents’ preparation. Effective cell number involving spore number and viable cell number is the key measurement to evaluate the quality of B. subtilis microbial ecological agents [2,3]. Because the optimal conditions are different between microbial growth and sporulation, a two-stage fermentation has been considered as an effective strategy to promote both cell growth and spore formation. The first stage aimed at improving the cell growth followed by the second stage which was under the optimal conditions for sporulation. Sen and Babu employed the response surface methodology to optimize the operation parameters including pH, temperature, rates of agitation, and aeration in two-stage liquid fermentation. The yields of biomass and spores of Bacillus coagulans RK-02 were effectively improved [4]. Zhang et al. also utilized the two-stage fermentation to enhance the growth and sporulation of biocontriol bacteria B579 in liquid fermentation. The initial glucose concentration, pH, rotating speed, and temperature in second stage were optimized and the sporulation rate was increased by 1.43 times after optimization [5].
In recent years, solid-state fermentation (SSF) has gained much attention from researchers since SSF offers numerous opportunities in processing of agro-industrial residues [6]. Because of the environmental-friendly advantages of solid wastes recycle, low energy requirement, high products concentration, and little wastewater discharge, SSF is considered as one of the promising clean processes [7]. However, since the continuous phase in SSF is the gas phase with low thermal conductivity and the culture medium is solid phase rather than the liquid phase, control of sterility and process monitoring in SSF are more difficult than those in liquid fermentation. To address these challenges, a novel high-temperature and short-time steam explosion sterilization technique for SSF sterilization has been established [8,9]. In addition, low-field nuclear magnetic resonance (LF-NMR) is applied as an effective analyzing technique to monitor the microstructure changes of solid medium [10,11]. The relaxation times of the proton can be used to assess the different states of water in substrates, which reflect the different micro-environments that the water experiences. Therefore, LF-NMR could be utilized to characterize the microstructure of solid matrix [12,13]. SSF is especially suitable for the production of microbial ecological agents due to its convenient post-treatment. The substrates after SSF could be utilized as feed additives directly without the treatment of separation and purification, which helps to improve the production efficiency. Meanwhile, Lima-Pérez et al. reported that SSF of Bacillus thuringiensis maintained higher biomass and spore yields as compared to submerged fermentation using the same media [14]. Lu optimized the compositions of solid medium and found that wheat bran and soybean meal were the optimal carbon and nitrogen sources for B. subtilis Y31. Fermentation parameters including temperature, water content, and inoculum size were further optimized by single factor test to increase the spore number effectively [15]. Liu et al. utilized two-steps gas double-dynamic solid-state fermentation to enhance the growth and spore production of Conithyrium minitans. Results showed that the higher glycine content may result from the high temperature stress which had a close relationship with pycnidia and conidia production [16]. Overall, progress has been made on fermentation process optimization for higher quantity of viable cells and spores. However, systematic optimization for improving B. subtilis growth and sporulation during SSF, especially the enhanced mechanisms from the viewpoint of changes in medium property and behaviors of microbial growth and metabolism, were still lacking, which limited the understanding and further improvement of SSF process.
In the present study, the two-stage fermentation strategy was systematically optimized to improve both B. subtilis growth and sporulation in SSF by using orthogonal test. Effects of two-stage fermentation on physical and chemical properties of solid medium were systematically investigated. Furthermore, fermentation kinetics and sporulation process were studied in order to clarify the mechanisms of enhancing B. subtilis growth and sporulation in two-stage solid-state fermentation.

2. Materials and Methods

2.1. Microorganism and Medium

B. subtilis CICC 10732 was provided by China Center of Industrial Culture Collection. The strain was stored in LB medium slant at 4 °C. To prepare the inoculum, B. subtilis CICC 10732 was pre-cultivated in 100 mL liquid medium containing 4% (w/v) glucose, 1% (w/v) peptone, 1% (w/v) yeast extract, 1% (w/v) CaCO3, and 0.05% (w/v) MgSO4 at 37 °C and vortexed at 150 rpm for 24 h.
Solid medium consisted of 30 g wheat bran, 3.0 g soybean meal, 0.75 g glucose, 1.5 g CaCO3, 30 mL of 2.5% (w/v) KH2PO4, and 1.25% (w/v) (NH4)2SO4 inorganic salt solution and 9.6 mL of deionized water. Chemicals were purchased from Sangon Biotech (Shanghai) Co., Ltd. The medium was put into 250 mL Erlenmeyer flasks and sterilized at 121 °C for 20 min. After sterilization, the medium was cooled at room temperature and inoculated by adding 12 mL of seed solution for fermentation for 72 h.

2.2. Two-Stage Solid-State Fermentation Strategy and Orthogonal Experimental Design

Two-stage fermentation strategy was used to enhance both cell growth and spore formation of B. subtilis. The first stage aimed at improving cell growth, during which the cultivating temperature was set to 37 °C. Then the temperature was changed in order to promote sporulation, which illustrated that the fermentation process entered into the second stage. The time when temperature changed was defined as the turning point time in two-stage fermentation. Because Mn2+ content was considered as the influencing factor on B. subtilis sporulation under certain conditions [17], it was chosen as a parameter to be investigated. In addition, turning point time and temperature in second stage were selected as the experimental factors to be investigated and optimized. The three influencing factors were denoted by the characters of A, B, and C, respectively (Table 1). Each factor had three levels indexed from 1 to 3. The three levels of different factors were chosen for the experiments. Orthogonal test of L9 (34) was introduced and experiments design was shown in Table 1. All these experiments were conducted with two replicates.
Range analysis was utilized for the results analysis of orthogonal experiment. Ki and ki represent the impact of level i of each factor on the effective cell number. The higher the Ki and ki are, the higher effective cell number is. kmax is the maximum among three ki values of each factor and kmin is the minimum. R represents the range, and the factor that has higher R value suggests a stronger impact on the effective cell number. In this sense, according to the value of R, the influence order of factors could be judged [18]. Meanwhile, analysis of variance (ANOVA) of the experimental results was conducted.

2.3. Measurement of Spore and Viable Cell Number

Sporulation rate and viable cell number were determined to evaluate the fermentation performance. A total of 3.10 g of solid medium was sampled and mixed with 50 mL of sterile water in 250-mL Erlenmeyer flasks. The Erlenmeyer flasks were shaken at 150 rpm for 30 min at 37 °C. The mixture was defined as M. For spore number determination, 5 mL of the mixture M was sampled into a sterile test tube, which was placed in a water bath at 80 °C for 15 min to make the vegetative cells death. Total of 100 μL of the mixture was serially diluted with sterile water down to 107. While for the determination of viable cell number, 100 μL of the mixture M was serially diluted with sterile water down to 107. The spore and viable cell number were determined by spread plate method in duplicate on LB plates. After 36 h of incubation at 37 °C, the numbers of colonies were determined and thus the spore and viable cell numbers were obtained. Sporulation rate was calculated as following,
Sporulation   rate = S p o r e   n u m b e r V i a b l e   c e l l   n u m b e r
Because of the high resistance of spores and low resistance of vegetative cells, effective cell number of B. subtilis microbial ecological agents was defined as following:
Effective cell number = Spore number + 0.1 × (Viable cell numberSpore number)

2.4. Glucose and Guanosine Triphosphate (GTP) Contents Changes in Medium

For glucose content determination, 4.0 mL of the mixture M in Section 2.3 was centrifuged at 8000 rpm for 10 min at room temperature. Glucose content in the supernatant was analyzed by high-performance liquid chromatography (HPLC; Agilent 1260) equipped with a refractive index detector. A total of 20 μL samples were loaded on an Aminex HPX-87H column (6.5 × 250 mm), eluted with 0.5 mM H2SO4 solution at a flow rate of 0.3 mL/min, and operated at 55 °C. The glucose content was expressed as g/g dry medium (DM).
For GTP content determination, 1.0 g of solid medium was sampled and mixed with 5.0 mL of extractant (methanol/acetonitrile/water, 40:40:20, by vol.) in 50 mL centrifuge tube. The mixture was frozen and thawed in liquid nitrogen and ice respectively for three times after shaking. Then the sample was centrifuged at 10,000 rpm for 10 min at 4 °C. The supernatant was collected and analyzed by HPLC. Chromatographic conditions were as follows: 10 μL samples were loaded on a C18 reversed phase column (4.6 × 150 mm, 5 μm). The mobile phase was A (buffer solution of 20 mM KH2PO4 including 0.2 g/mL TBAH and 5 g/mL acetonitrile, pH 6.5): B (acetonitrile) with linear gradient elution (1–5 min, A:B = 95:5; 5–25 min, A:B = 65:35; 25–26 min, A:B = 95:5) and the flow rate was 1.0 mL/min. The ultraviolet detector wavelength was set to 254 nm [19]. GTP content was expressed as g/g DM.

2.5. Low-Field Nuclear Magnetic Resonance (LF-NMR) Measurements

Water states and dynamics in solid medium were detected by LF-NMR on a MesoMR23-060H-I Analyst Analyzing & Imaging system (Niumag Co., Ltd., Shanghai, China). Total of 2.60 g of solid medium samples were obtained from the central part of the substrates and placed into 25 mm NMR glass tubes. The tubes were then inserted into the NMR probe. T2 relaxation times were measured using Carr–Purcell–Meiboom–Gill (CPMG) sequence with a τ-value of 100 μs (time between 90 and 180 pulse). A total of 3000 echoes were collected as 16 scan repetitions, and the repetition time between two successive scans was 2.5 s. The relaxation times measurements were performed at 32 °C. Data analysis was performed with the NMR Analyzing System Ver 1.0 (Niumag Co., Ltd., Shanghai, China). Relaxation time T2i and its corresponding water proportion M2i were presented.
In addition, water content of solid medium was measured by oven-drying method at 105 °C.

2.6. Statistical Analysis

Pearson correlation analysis was conducted using IBM SPSS version 22.0 to study the correlation between LF-NMR data and fermentation performance. Pearson correlation coefficient r describes the linear correlative degree of the two variables, and its value ranges from −1 to +1. If r > 0, it shows that the two variables are positively correlated, that is, one variable’s value increases as the other variable’s value increases. While if r < 0, it indicates that the two variables are negatively correlated. The larger the absolute value of r is, the stronger the correlation becomes [20].

3. Results and Discussion

3.1. Two-Stage Fermentation Optimization for Improving Effective Cell Number

Effective cell number is the key measurement to evaluate the quality of microbial ecological agents. Effects of two-stage fermentation strategy on effective cell number of B. subtilis were systematically investigated. Because of the different operating conditions, Table 1 shows that there were obvious differences among the effective cell number results from the different orthogonal tests. The highest effective cell number was 17.9 × 10⁹/g DM of treatment 9 while the lowest effective cell number was 2.88 × 10⁹/g DM of treatment 7. Based on the magnitude order of R value, the order of influencing factors on effective cell number was temperature in second stage > turning point time > Mn2+ content. To further investigate the effects of the factors, analysis of variance (ANOVA) was utilized for results analysis. Table 2 shows that significance of factors increased with the order of C < B < A, which indicated that the influence of factors decreased as the order C > B > A. The result was consistent with the range analysis in Table 1. Therefore, temperature in second stage and turning point time have more obvious impact on the effective cell number than Mn2+ content. Effects of temperature in second stage and turning point time on effective cell number and sporulation rate were further analyzed. As shown in Figure 1, effective cell number increased as the turning point time increased from 24 h to 48 h when temperature in second stage was either 47 °C or 57 °C. The results implied that when fermentation stage was switched early, large quantity of microbial cells were killed under high temperature at the second stage. In addition, effective cell number decreased when temperature in second stage increased from 47 °C to 57 °C, which indicated that the higher strength heat could destroy more microbial cells. On the other hand, sporulation rate decreased when the turning point time increased. It implied that the earlier stage switch made microbial cells suffered from high temperature for a longer time, which facilitated the sporulation. Overall, in terms of the kmax value of each column in Table 1, the optimal factors combination is A3B3C2, which was the same as the conditions of treatment 9. As a result, when Mn2+ content was 4.9 mg MnSO4/g DM, turning point time was 48 h and temperature in second stage was 48 °C, and the effective cell number reached the maximum value of 17.9 × 10⁹/g DM.

3.2. Physical and Chemical Properties of Medium Changes during Two-Stage Fermentation Processes

3.2.1. Glucose Content Changes during Two-Stage Fermentation Processes

Glucose content in medium is an important indicator of microbial metabolism. Figure 2 shows that glucose content decreased after thermal sterilization at 121 °C for 20 min. It can be interpreted as the heat processing had an adverse effect on the nutrients and thermal degradation of glucose [8,21]. Glucose content of all treatments in Figure 2 decreased obviously during the first 24 h of fermentation, indicating that microorganisms grew rapidly and thus large amounts of glucose were consumed. During the fermentation time of 24–48 h, glucose content of treatment 8 and 9 continued to decline rapidly, indicating that microorganisms still grew and metabolized vigorously at this stage. While glucose content of treatment 4 and 7 at 48 h were significantly higher than that of treatment 8 and 9, which may be due to the temperature increase at 24 h in treatment 4 and 7 caused the death of microorganisms and thus reduced the glucose consumption. While during the fermentation time of 48–72 h, glucose content of treatment 7, 8, and 9 increased slightly. This phenomenon can be interpreted as that B. subtilis could generate polysaccharide-degrading enzymes during fermentation process. B. subtilis is very well recognized as an amylase producer at industrial level. Besides, it has also been reported that B. subtilis could generate cellulase during fermentation processes [22,23]. While glucose content of treatment 4 decreased during the fermentation time of 48–72 h, implying that glucose consumption was stronger than glucose production. Overall, the glucose utilization was facilitated when temperature changed into 47 °C at 48 h of treatment 9 than temperature changed into 47 °C or 57 °C at 24 h. The improvement of glucose utilization could contribute to microbial growth and biomass accumulation of B. subtilis.

3.2.2. Water States and Microstructure of Medium Changes During Two-Stage Fermentation Processes

Water states are significantly related to the substrate microstructure, which can be determined by LF-NMR rapidly [24]. In order to elucidate the microstructure changes of solid medium during the two-stage fermentation, water dynamics, and proton relaxation times T2 development of treatment 9 were investigated. Figure 3 shows that three proton fractions were found in mediums. T2b was the fastest fraction with a relaxation time of approximately 0.21 ms, which was ascribed to the bound water associated with hydrophilic groups, such as carboxyl, hydroxyl, and sulfydryl [12,25]. The intermediate component T21 accounting for the major part was attributed to the water in pores of the medium microstructure, which can be defined as capillary water. The slowest fraction T22 was assigned to water in the cavities of the three-dimensional network of medium, which is defined as lumen water. Felby et al. [12] applied LF-NMR to investigate the cellulose–water interactions during the enzymatic hydrolysis process. Structural changes of cellulose fiber during enzymatic hydrolysis were elucidated by the state and location of water. According to the structural changes of substrate, the synergistic mechanism of endo- and exo-glucanase on lignocelluloses was revealed. Han et al. [11] used LF-NMR to study the water mobility and microstructure changes during heat-induced gelation process of pork myofibrillar proteins. Obvious differences in microstructure depending on the temperature were observed. The LF-NMR data was significantly related to the microstructure characteristics and helped to elucidate the structural changes of pork myofibrillar proteins. All these results suggested that the state and location of water matched well with the structure characteristics of solid matrix. It was noted from Figure 3 that T21 increased and T22 decreased during the first 24 h of fermentation of treatment 9. Because of the microbial utilization of medium, microbial cells enlarged pores at the early stage of fermentation and the broken medium granules filled in the cavities, leading to the more mobile capillary water (T21 increase) and more constrained lumen water (T22 decrease). As the fermentation continued from 24 h to 72 h, both T21 and T22 decreased. Liu and Chen investigated the effects of chemicals on water pool distributions in corn stover. It was reported that T22 relaxation time increased with the glucose concentration decrease because of that the removal of glucose reduced water constraint in substrates. However, compared with glucose concentration, the porosity of macro granule had more significant influence on water constraint [26]. Therefore, although the glucose concentration of treatment 9 shows decreasing trend during the fermentation process, activities of microbial cells resulted in the collapse of medium structure, especially at the late stage of fermentation [27,28]. Thus, the volume of pores and cavities shrunk, leading to the decrease of T21 and T22 during the fermentation time from 24 h to 72 h. Therefore, the development of relaxation times T2 could effectively reflect the structural changes of solid medium during fermentation process.
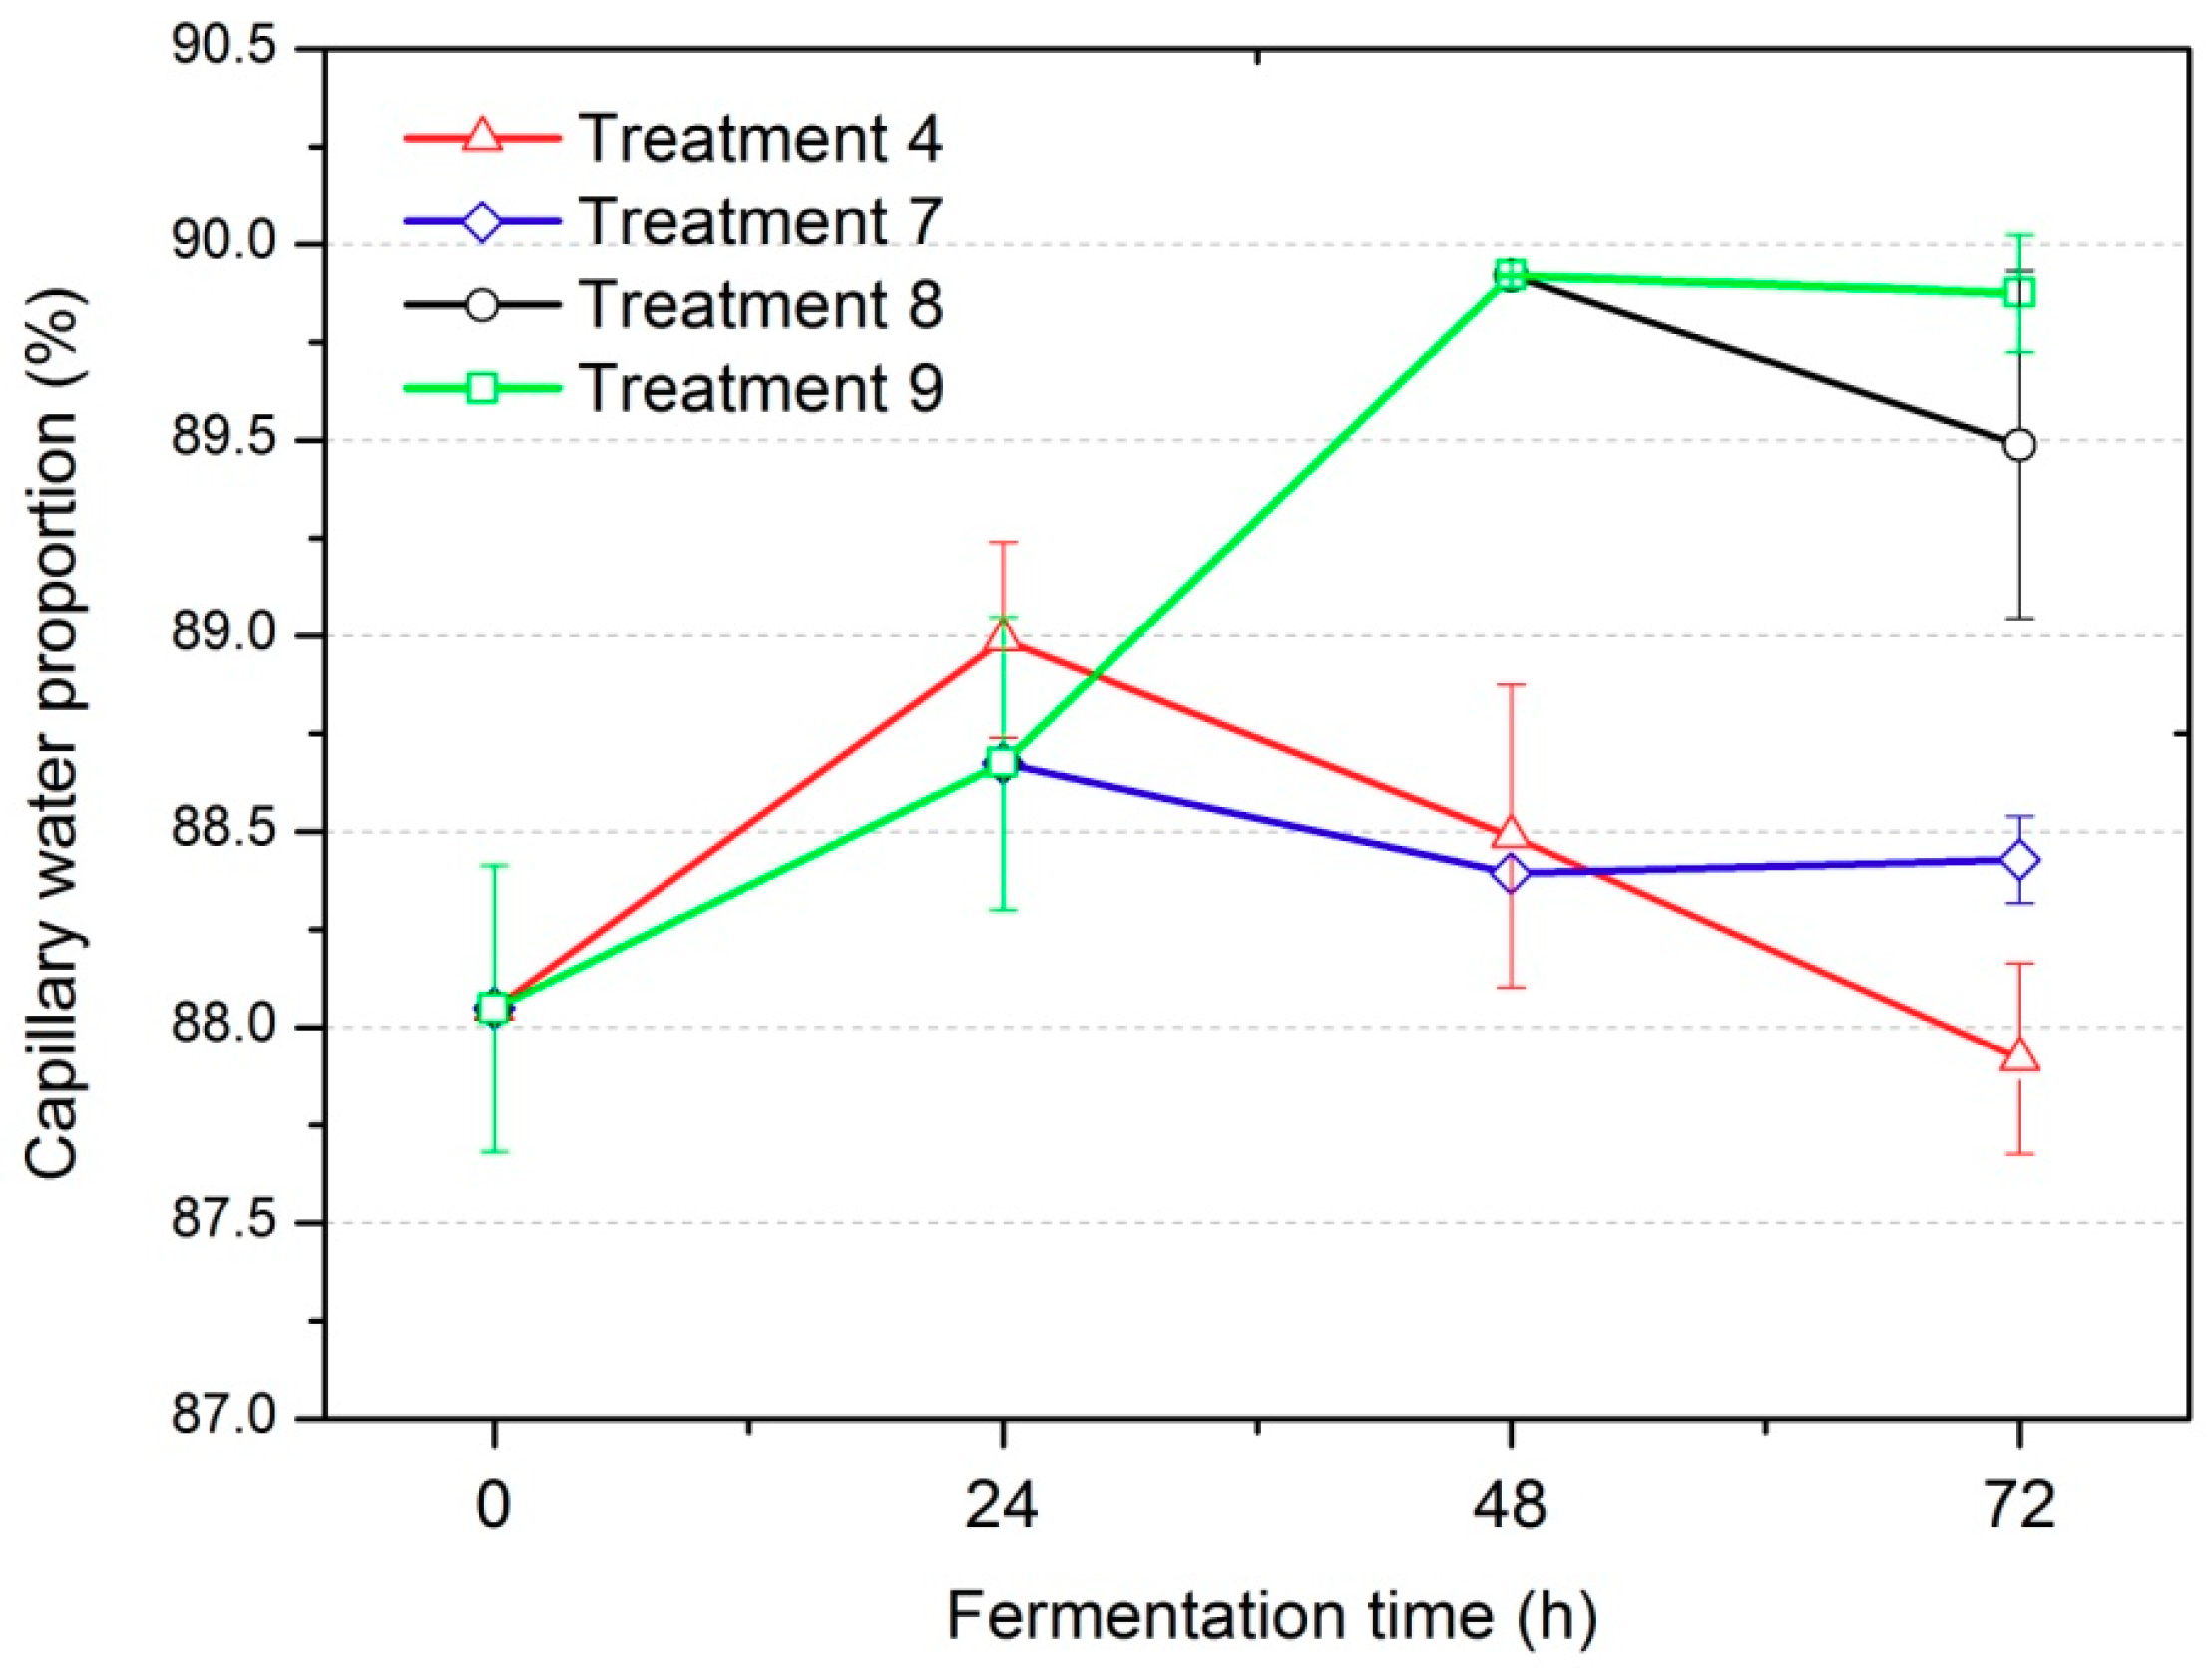
Our previous study has shown that pores where capillary water located were active sites for microbial growth and metabolism [9]. Hereby, capillary water proportion M21 changes during fermentation process of different treatments were systematically investigated. Figure 4 shows that capillary water proportion of all samples increased during the first 24 h of fermentation. Capillary water proportion of treatment 8 and 9 continued to increase while that of treatment 4 and 7 decreased at the fermentation stage of 24–48 h. It was interesting to note that viable cell number (Figure 6a) presented similar trends with capillary water proportion, illustrating the close relationship between these two parameters. Pearson correlation analysis was utilized to further study the correlation between capillary water proportion and fermentation performance parameters including effective cell number, viable cell number, and spore number. The results in Table 3 revealed that capillary water proportion correlated significantly with the fermentation performance. The most significant parameters were viable cell number followed by effective cell number and spore number. All these fermentation performance parameters gave positive relationship with capillary water proportion. The results confirmed that larger capillary water proportion was helpful to improve fermentation performance, because of which medium with larger capillary water proportion could provide more active sites for microbial growth and metabolism. Capillary water proportion of treatment 9 kept an increasing trend during the fermentation process, thus contributing to the highest effective cell number production. The results also provide guidance that effective cell number might be further optimized by improving the capillary water proportion through medium pretreatment.

3.2.3. Relationship between GTP Content/Viable Cell Number with Sporulation Rate

GTP content is an effective parameter reflecting cellular nutrient and energy levels, which could influence sporulation process significantly [29,30]. Piggot and Hilbert reported that when lack of nutrition occurred, GTP content decreased and then induced the sporulation process [31]. In the present study, relationship between GTP content/viable cell number with sporulation rate was systematically studied to explore how the changes of fermentation condition influenced sporulation. Figure 5 shows that the values of GTP content/viable cell number of treatment 4 and 7 increased during the fermentation processes, and the value of treatment 7 was higher than that of treatment 4 at the same fermentation time. This can be interpreted as that the temperature increase at 24 h of treatment 4 and 7 reduced the quantity of microbial cells, which left abundant nutrients in the medium. And the more microbial cells reduced, the more nutrients remained. While the values of GTP content/viable cell number of treatment 8 and 9 decreased during the fermentation time of 24–48 h, which may be due to that microbial cells grew rapidly at this stage in treatment 8 and 9 and consumed large amounts of nutrients. At 72 h, GTP content/viable cell number of treatment 8 increased by 3.55 times than that at 48 h, while the value of treatment 9 increased by 93.2% than that at 48 h. The higher value of GTP content/viable cell number of treatment 8 than treatment 9 may be due to that the microbial growth decline phase began and cell number decreased in treatment 8. While the temperature increase at 48 h in treatment 9 may stimulate cells growth and delayed the decline phase. As for sporulation rate, Figure 6b shows that it increased as the fermentation began at 72 h for all treatment 4, 7, 8 and 9. This phenomenon indicated that GTP content was not the only factor determining sporulation in the present study. Changes of fermentation conditions in different treatments could influence sporulation rate through other microbial metabolic pathways, which needs to be studied further.

3.3. Fermentation Kinetics and Sporulation Process in Two-Stage Fermentation

In order to gain understanding of how two-stage strategy influenced the fermentation performance, fermentation kinetics and sporulation rate dynamics of different treatments were further investigated. Figure 6a shows that viable cell number of treatment 8 and 9 increased rapidly during fermentation from 24 h to 48 h, indicating that microorganisms grew and metabolized vigorously. After fermentation for 48 h, viable cell number of treatment 8 began to decline. It was reported that the optimum fermentation period for B. subtilis growth was 48 h by Fu et al. and Joshi et al. [32,33], which was in accordance with the results in the present study. Although viable cell number of treatment 9 remained relatively stable during fermentation time of 48–72 h, implying that the sudden increase of temperature at the late stage of fermentation could stimulate the microorganism growth and delay the decline phase. As for spore number, because of that the sporulation rate and viable cell number increased, spore number of treatment 8 and 9 increased from 24 h to 48 h. During the fermentation time of 48–72 h, sporulation rate of treatment 8 and 9 continued to increase while viable cell number of treatment 8 decreased, leading to the spore number decrease of treatment 8. Therefore, viable cell and spore number reached the maximum at 48 h for the conventional fermentation of treatment 8, of which the value was 2.38 × 10¹⁰/g DM and 1.57 × 10¹⁰/g DM, respectively. Under this condition, the effective cell number was 1.65 × 10¹⁰/g DM and the sporulation rate was 66.0%. While for treatment 9, viable cell number remained relatively stable and sporulation rate increased by 10.9% during the fermentation stage of 48–72 h, leading to the effective cell number reaching 1.79 × 10¹⁰/g DM at 72 h, which was 29.7% and 8.48% higher than that of treatment 8 at 72 h and 48 h, respectively. In addition, it was worth noting that sporulation rate of treatment 9 was 73.2% while the value was 81.7% of treatment 8 at the end of fermentation for 72 h. The temperature increase at 48 h of treatment 9 resulted in a lower sporulation rate than that of treatment 8, which confirmed that sudden increase of temperature at the late stage of fermentation could stimulate the microorganism growth. On the other hand, fermentation performance of treatment 7 and 4 showed that if the temperature increased at the early stage of 24 h, both the viable cell and spore number decreased significantly. For instance, viable cell and spore number of treatment 7 at 72 h were both 2.88 × 10⁹/g DM, which was accounting for 12.2% and 16.7% respectively of those of treatment 9. The results demonstrated that microorganism growth was inhibited if the temperature increased early because of the low stress resistance of microbial cells in the early fermentation stage. Therefore, the turning point time in two-stage fermentation was an important factor influencing microorganism growth, which was consistent with the previous results. Overall, two-stage fermentation strategy in treatment 9 could stimulate microorganism growth and delay the decline phase, implying that the viable cell number maintained a high value during the fermentation time of 48–72 h. In addition, sporulation rate was improved at this stage. Therefore, through gathering microbial growth and sporulation enhancement together, effective cell number of B. subtilis in the optimal two-stage SSF increased effectively. Besides, to overcome the difficulty in control of sterility in large-scale SSF, a novel high-temperature and short-time steam explosion sterilization technique for SSF sterilization had been established in our previous research. Through improving nutrition and increasing specific surface area of solid medium, steam explosion sterilization improved SSF productivity by 2.83 times than that of conventional sterilization [8,9]. At present, steam explosion sterilization reactor and SSF reactor have been successfully scaled up to 5 m3 and 100 m3, respectively [34]. Therefore, combining with the previous research, this study presented a promising way to increase the effective cell number of microbial ecological agents, which should facilitate the cleaner production of alternatives to antibiotics utilizing agro-industrial residues by SSF.

4. Conclusions

An optimal two-stage SSF process was established to improve B. subtilis growth and sporulation effectively. Previous study emphasized on the enhancing effect of sporulation by the second stage in fermentation. However, our present study revealed that the temperature increase at the second stage effectively stimulated the microbial growth and delayed the decline phase, as well as improved the sporulation rate. As a result, effective cell number of B. subtilis reached 1.79 × 10¹⁰/g dry medium after fermentation for 72 h, which was 29.7% and 8.48% higher than that of conventional fermentation for 72 h and 48 h, respectively. This study presented an efficient way to increase the effective cell number of microbial ecological agents, which should facilitate the cleaner production of alternatives to antibiotics utilizing agro-industrial residues.

Author Contributions

Conceptualization, Z.-M.Z.; formal analysis, Z.-M.Z., J.-T.X., J.-F.X., L.-T.M., and J.Z.; funding acquisition, Z.-M.Z., J.-F.X., and L.-T.M.; investigation, Z.-M.Z. and J.-T.X.; project administration, Z.-M.Z. and J.Z.; writing—original draft, Z.-M.Z.; writing—review and editing, Z.-M.Z., J.-F.X., L.-T.M., and J.Z.

Funding

This research was funded by the National Natural Science Foundation of China, grant numbers: 21706136, 21766025 and 51768048.

Conflicts of Interest

The authors declare no conflict of interest.

References

  1. Yeo, S.; Lee, S.; Park, H.; Shin, H.; Holzapfel, W.; Huh, C.S. Development of putative probiotics as feed additives: Validation in a porcine-specific gastrointestinal tract model. Appl. Microbiol. Biotechnol. 2016, 100, 10043–10054. [Google Scholar] [CrossRef]
  2. Cutting, S.M. Bacillus probiotics. Food Microbiol. 2011, 28, 214–220. [Google Scholar] [CrossRef] [PubMed]
  3. Veen, H.V.B.-V.D.; Xie, H.; Esveld, E.; Abee, T.; Mastwijk, H.; Groot, M.N. Inactivation of chemical and heat-resistant spores of Bacillus and Geobacillus by nitrogen cold atmospheric plasma evokes distinct changes in morphology and integrity of spores. Food Microbiol. 2015, 45, 26–33. [Google Scholar] [CrossRef] [PubMed]
  4. Sen, R.; Babu, K.S. Modeling and optimization of the process conditions for biomass production and sporulation of a probiotic culture. Process Biochem. 2005, 40, 2531–2538. [Google Scholar] [CrossRef]
  5. Zhang, Y.C.; Jia, J.H.; Zheng, Y.; Chen, F.; Zeng, M.J.; Luo, J.M.; Wang, M. Optimization of sporulation condition of biocontriol bacteria B579 by two-step control strategy. Agric. Sci. Technol. Hunan 2011, 12, 249–252. [Google Scholar]
  6. Tišma, M.; Tadić, T.; Budžaki, S.; Ostojčić, M.; Šalić, A.; Zelić, B.; Tran, N.N.; Ngothai, Y.; Hessel, V. Lipase Production by Solid-State Cultivation of Thermomyces Lanuginosus on By-Products from Cold-Pressing Oil Production. Processes 2019, 7, 465. [Google Scholar] [CrossRef]
  7. Boratyński, F.; Szczepańska, E.; Grudniewska, A.; Skalny, B.; Olejniczak, T. A novel approach for microbial synthesis of enantiomerically pure whisky lactones based on solid-state fermentation. Molecules 2018, 23, 659. [Google Scholar] [CrossRef] [PubMed]
  8. Zhao, Z.-M.; Wang, L.; Chen, H.-Z. A novel steam explosion sterilization improving solid-state fermentation performance. Bioresour. Technol. 2015, 192, 547–555. [Google Scholar] [CrossRef]
  9. Zhao, Z.-M.; Wang, L.; Chen, H.-Z. Physical structure changes of solid medium by steam explosion sterilization. Bioresour. Technol. 2016, 203, 204–210. [Google Scholar] [CrossRef]
  10. Gianferri, R.; Maioli, M.; Delfini, M.; Brosio, E. A low-resolution and high-resolution nuclear magnetic resonance integrated approach to investigate the physical structure and metabolic profile of Mozzarella di Bufala Campana cheese. Int. Dairy J. 2007, 17, 167–176. [Google Scholar] [CrossRef]
  11. Han, M.; Wang, P.; Xu, X.; Zhou, G. Low-field NMR study of heat-induced gelation of pork myofibrillar proteins and its relationship with microstructural characteristics. Food Res. Int. 2014, 62, 1175–1182. [Google Scholar] [CrossRef]
  12. Felby, C.; Thygesen, L.G.; Kristensen, J.B.; Jørgensen, H.; Elder, T. Cellulose–water interactions during enzymatic hydrolysis as studied by time domain NMR. Cellulose 2008, 15, 703–710. [Google Scholar] [CrossRef]
  13. Tu, C.; Gao, Y.; Li, T.; Rui, X.; Li, W.; Wang, K.; Xiao, Y.; Dong, M. Study of Water Dynamics in the Soaking, Steaming, and Solid-State Fermentation of Glutinous Rice by LF-NMR: A Novel Monitoring Approach. J. Agric. Food Chem. 2015, 63, 3261–3270. [Google Scholar]
  14. Lima-Pérez, J.; López-Pérez, M.; Viniegra-González, G.; Loera, O. Solid-state fermentation of Bacillus thuringiensis var kurstaki HD-73 maintains higher biomass and spore yields as compared to submerged fermentation using the same media. Bioprocess Biosyst. Eng. 2019, 42, 1–9. [Google Scholar] [CrossRef] [PubMed]
  15. Lu, L.D. Studies on Screening, Identification, Solid-State Fermentation Optimization and Application Effect of Bacillus from Chicken Intestines. Master’s Thesis, Fujian Normal University, Fuzhou, China, 2010. [Google Scholar]
  16. Liu, Y.; Wang, L.; Chen, H.-Z. Two-steps gas double-dynamic solid-state fermentation enhances growth and spore production of Conithyrium minitans. Bioresour. Technol. 2018, 262, 235–241. [Google Scholar] [CrossRef] [PubMed]
  17. Guo, X.L.; Di, Y.N.; Wang, Y. Optimization of sporulation conditions of Bacillus subtilis. Soil Fertil. Sci. China 2012, 3, 99–103. [Google Scholar]
  18. Dong, C.; Chen, J. Optimization of process parameters for anaerobic fermentation of corn stalk based on least squares support vector machine. Bioresour. Technol. 2019, 271, 174–181. [Google Scholar] [CrossRef] [PubMed]
  19. Domínguez-Álvarez, J.; Mateos-Vivas, M.; Rodríguez-Gonzalo, E.; García-Gómez, D.; Bustamante-Rangel, M.; Zamarreño, M.-M.D.; Carabias-Martínez, R. Determination of nucleosides and nucleotides in food samples by using liquid chromatography and capillary electrophoresis. TrAC Trends Anal. Chem. 2017, 92, 12–31. [Google Scholar] [CrossRef]
  20. Shamsudin, S.N.; Rahman, M.H.F.; Taib, M.N.; Razak, W.R.W.A.; Ahmad, A.H.; Zain, M.M. Analysis between Escherichia Coli growth and physical parameters in water using Pearson correlation. In Proceedings of the 2016 7th IEEE Control and System Graduate Research Colloquium (ICSGRC), Shah Alam, Malaysia, 8 August 2016. [Google Scholar]
  21. Lund, D. Effects of Heat Processing on Nutrients. In Nutritional Evaluation of Food Processing; Springer Science and Business Media LLC: Dordrecht, Netherlands, 1988; pp. 319–354. [Google Scholar]
  22. Yan, S.; Wu, G. Bottleneck in secretion of α-amylase in Bacillus subtilis. Microb. Cell Factories 2017, 16, 124. [Google Scholar] [CrossRef]
  23. Ding, K.; Qiu, J.J.; Luo, W.G.; Li, W.; Li, Y.X.; Cao, P.H.; He, W.L.; Zhao, L.M.; Wang, Y.Q.; Zhang, C.J. Cloning, fusion expression of two cellulase genes from Bacillus subtilis and its enzymatic preperties. Chin. J. Anim. Nutr. 2017, 29, 2725–2733. [Google Scholar]
  24. Liu, Z.H.; Chen, H.Z. Biomass–water interaction and its correlations with enzymatic hydrolysis of steam-exploded corn stover. ACS Sustain. Chem. Eng. 2016, 4, 1274–1285. [Google Scholar] [CrossRef]
  25. Li, T.; Rui, X.; Li, W.; Chen, X.; Jiang, M.; Dong, M. Water Distribution in Tofu and Application of T2 Relaxation Measurements in Determination of Tofu’s Water-Holding Capacity. J. Agric. Food Chem. 2014, 62, 8594–8601. [Google Scholar] [CrossRef] [PubMed]
  26. Liu, Z.H.; Chen, H.Z. Periodic peristalsis releasing constrained water in high solids enzymatic hydrolysis of steam exploded corn stover. Bioresour. Technol. 2016, 205, 142–152. [Google Scholar] [CrossRef]
  27. Wang, L.; Sun, L.L.; Chen, H.Z. Factors and related strategies for improving the solid-state fermentation loading coefficient. Biotechnol. Bus. 2018, 65, 60–63. [Google Scholar]
  28. Weiss, N.D.; Felby, C.; Thygesen, L.G. Properties important for solid–liquid separations change during the enzymatic hydrolysis of pretreated wheat straw. Biotechnol. Lett. 2018, 40, 703–709. [Google Scholar] [CrossRef]
  29. Levdikov, V.M.; Blagova, E.V.; Young, V.L.; Belitsky, B.R.; Lebedev, A.; Sonenshein, A.L.; Wilkinson, A.J. Structure of the Branched-chain Amino Acid and GTP-sensing Global Regulator, CodY, from Bacillus subtilis. J. Boil. Chem. 2016, 292, 2714–2728. [Google Scholar] [CrossRef] [PubMed]
  30. Narula, J.; Kuchina, A.; Lee, D.-Y.; Fujita, M.; Süel, G.M.; Igoshin, O.A. Chromosomal arrangement of phosphorelay genes couples sporulation and DNA replication. Cell 2015, 162, 328–337. [Google Scholar] [CrossRef] [PubMed]
  31. Piggot, P.J.; Hilbert, D.W. Sporulation of Bacillus subtilis. Curr. Opin. Microbiol. 2004, 7, 579–586. [Google Scholar] [CrossRef]
  32. Fu, X.M.; Zhao, S.M.; Liang, Y.X.; Ge, X.Y. The optimization of solid-state fermentation process for high-yield spore production of a feeding Bacillus subtilis. Feed Industry 2010, 22, 43–46. [Google Scholar]
  33. Joshi, S.; Bharucha, C.; Desai, A.J. Production of biosurfactant and antifungal compound by fermented food isolate Bacillus subtilis 20B. Bioresour. Technol. 2008, 99, 4603–4608. [Google Scholar] [CrossRef]
  34. Chen, H.Z.; He, Q. A novel structured bioreactor for solid-state fermentation. Bioprocess Biosyst. Eng. 2013, 36, 223–230. [Google Scholar] [CrossRef] [PubMed]
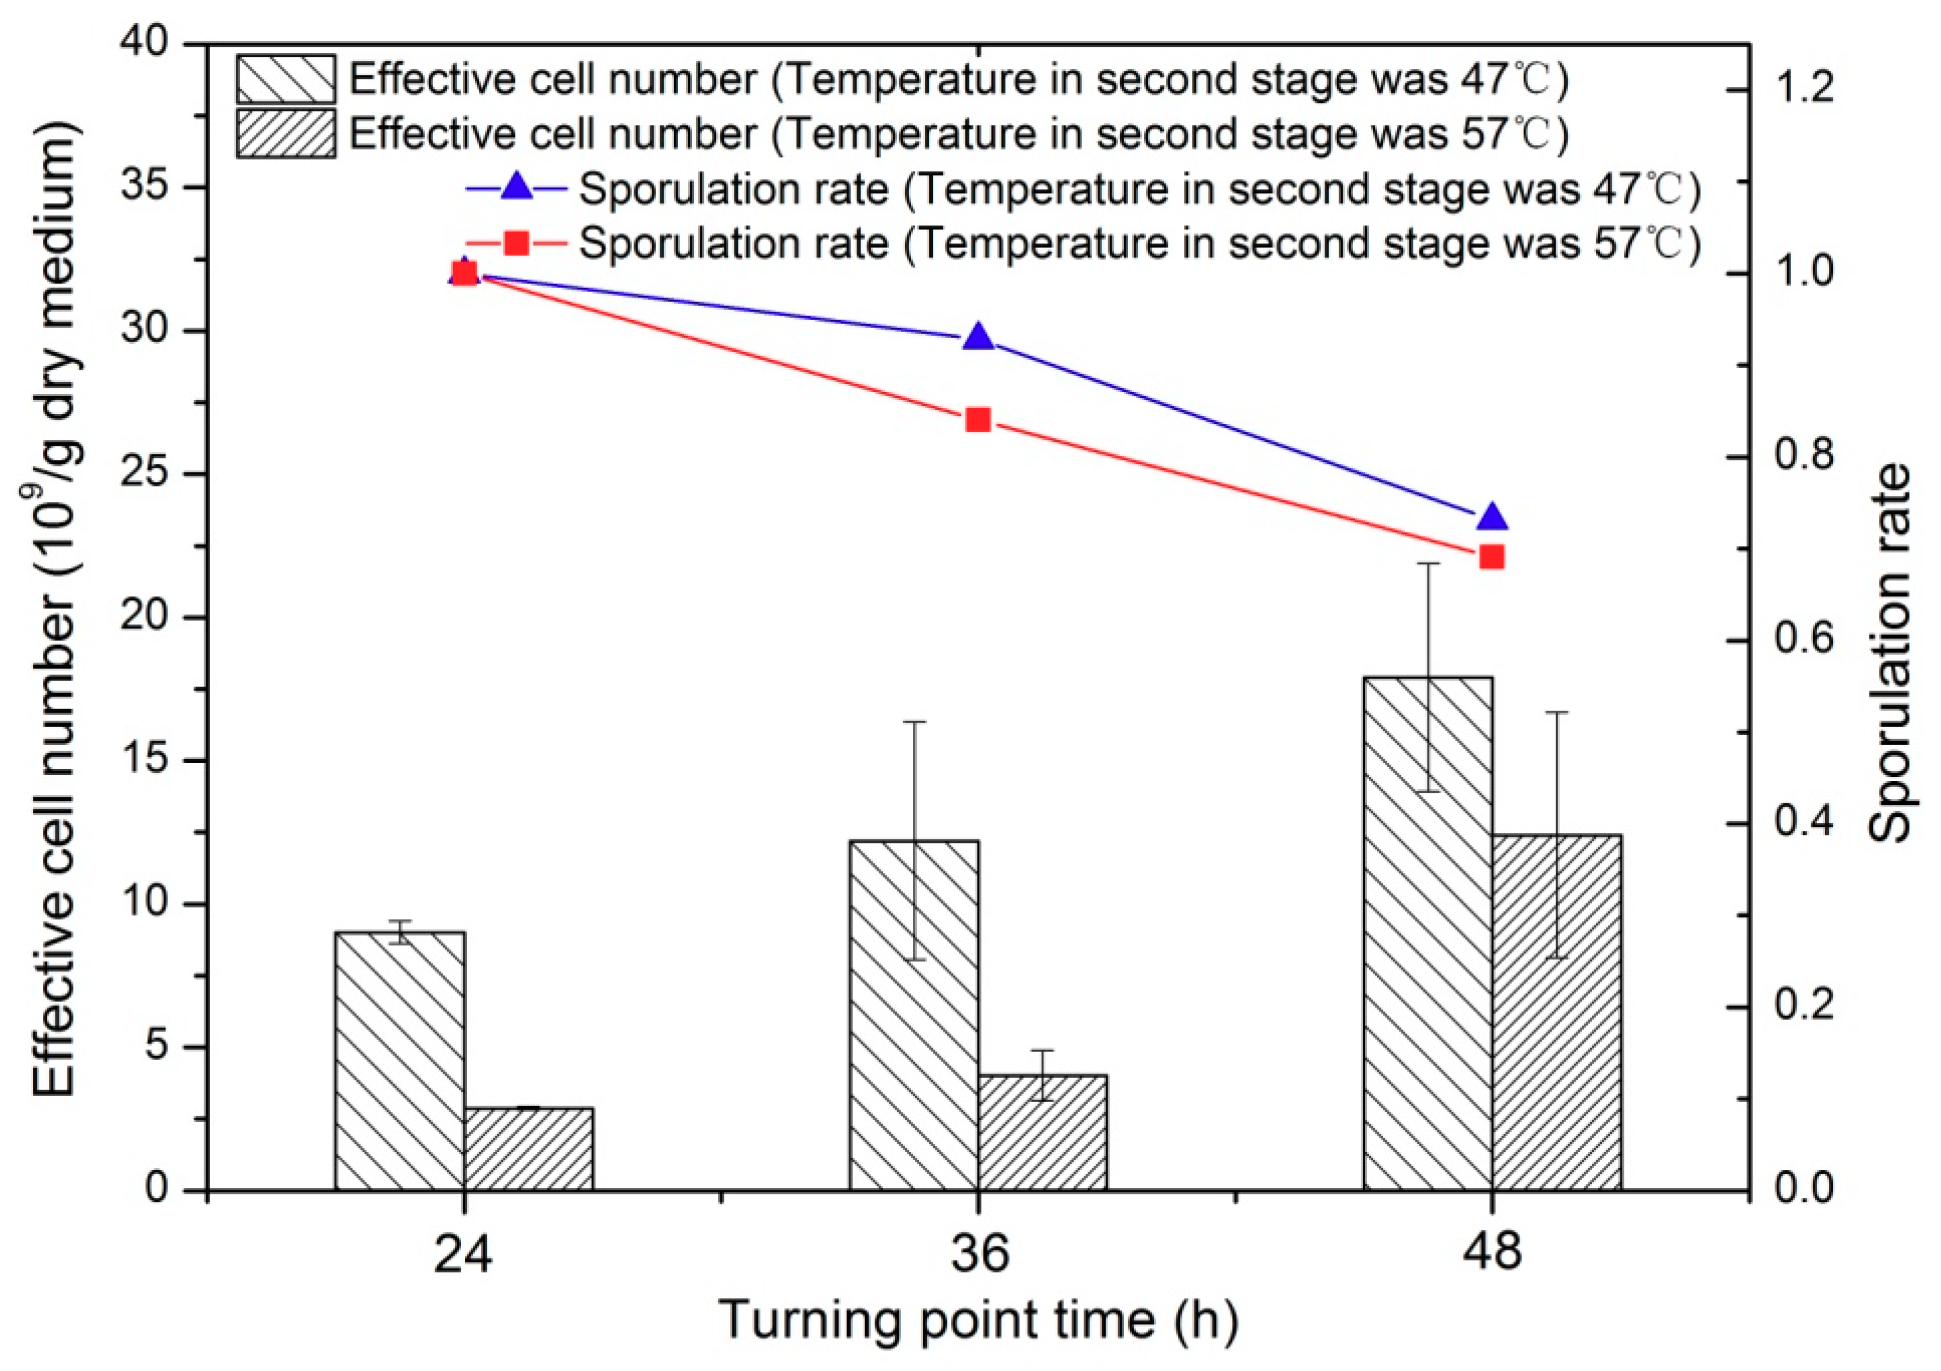
Figure 1. Comparison of effective cell number and sporulation rate after fermentation for 72 h among the different treatments.
Processes 07 00644 g001
Figure 2. Glucose content in medium changes during fermentation process of different treatments. Note: different treatments are shown in Table 1.
Processes 07 00644 g002
Figure 3. Development in proton relaxation times T2 of medium in treatment 9 during fermentation process.
Processes 07 00644 g003
Figure 4. Capillary water proportion M21 in medium changes during fermentation process of different treatments. Note: different treatments are shown in Table 1.
Processes 07 00644 g004
Figure 5. Guanosine triphosphate (GTP) content/viable cell number changes during fermentation process of different treatments. Note: different treatments are shown in Table 1.
Processes 07 00644 g005
Figure 6. Fermentation kinetics and sporulation rate dynamics of different treatments. (a) Viable cell number and spore number changes during fermentation process. C4, C7, C8, C9 represent viable cell number of treatment 4, 7, 8, 9 respectively; S4, S7, S8, S9 represent spore number of treatment 4, 7, 8, 9 respectively; (b) Sporulation rate changes during the fermentation process. Note: different treatments are shown in Table 1.
Processes 07 00644 g006aProcesses 07 00644 g006b
Table 1. Orthogonal experiment design and range analysis of two-stage fermentation.
Treatment NumberA (Mn2+ Content)
(mg MnSO4/g Dry Medium)
B (Turning Point Time) (h)C (Temperature in Second stage) (°C)Effective Cell Number a
(109/g Dry Medium)
10.024379.36 ± 0.51
20.0364712.2 ± 4.14
30.0485712.4 ± 4.28
40.4924479.01 ± 0.40
50.4936574.02 ± 0.87
60.49483710.1 ± 0.20
74.924572.88 ± 0.06
84.9363713.8 ± 3.05
94.9484717.9 ± 3.98
K134.021.333.3
K223.130.039.1
K334.640.419.3
k111.37.1011.1
k27.7010.013.0
k311.513.56.43
R3.806.406.57
OrderRC > RB > RA
K i = Effective   cell   number   at   level   i   of   each   factor , i = 1, 2, 3, k i = K i / 3 , i = 1, 2, 3, R = k m a x k m i n , a Data were expressed as average ± standard deviation.
Table 2. Analysis of variance (ANOVA) of orthogonal experiment.
FactorsSum of Squares (1019)Degree of FreedomMean Square (1019)F-ratioSignificance
A (Mn2+ content)5.5422.771.9260.192
B (Turning point time)12.2826.144.2740.042
C (Temperature in second stage)13.7626.884.7900.032
Error15.80111.44
Table 3. Pearson correlation analysis between capillary water proportion and fermentation performance parameters.
Variables RelationshipCorrelation Coefficient, rSignificance
Capillary water proportion vs. effective cell number0.674* *
Capillary water proportion vs. viable cell number0.694* *
Capillary water proportion vs. spore number0.665* *
* * Correlation is significant at the 0.01 level (2-tailed).