Article

Energetic and Exergetic Investigations of Hybrid Configurations in an Absorption Refrigeration Chiller by Aspen Plus

School of Energy and Environment, Southeast University, Nanjing 210096, China
*
Author to whom correspondence should be addressed.
Processes 2019, 7(9), 609; https://doi.org/10.3390/pr7090609
Submission received: 25 July 2019 / Revised: 23 August 2019 / Accepted: 26 August 2019 / Published: 10 September 2019

Abstract

:
In the present study, a steady-state simulation model was built and validated by Aspen Plus to assess the performance of an absorption refrigeration chiller according to the open literature. Given the complex heat transfer happening in the absorbers and the generator, several assumptions were proposed to simplify the model, for which a new parameter ε l i q was introduced to describe the ratio of possible heat that could be recovered from the absorption and heat-transferring process in the solution cooling absorber. The energetic and the exergetic investigations of a basic cycle and hybrid cycles were conducted, in which the following parameters were analyzed: coefficient of performance (COP), exergetic efficiency, exergy destruction, and irreversibility. According to the results, the basic cycle exhibited major irreversibility in the absorbers and the generator. Subsequently, two proposed novel configurations were adopted to enhance its performance; the first (configuration 1) involved a compressor between a solution heat exchanger and a solution cooling absorber, and the second (configuration 2) involved a compressor between a rectifier and a condenser. The peak COP and the overall exergetic efficiency (η) of configuration 1 were found to be better, increasing by 15% and 5.5%, respectively, and those of configuration 2 were also upregulated by 5% and 4%, respectively. The rise in intermediate compressor ratio not only reduced the driving generator temperature of both configurations but also expanded the operating range of the system under configuration 1, thus proving their feasibility in waste heat sources and the superiority of configuration 1. Detailed information about the optimal state for hybrid cycles is also presented.

1. Introduction

Energy is becoming increasingly vital for the survival and the development of human beings. In recent years, natural resources and environmental preservation were two critical issues facing humans in development processes. One of the crucial ways to solve the energy crisis and to reduce pollutant emissions is to fully exploit renewable sources (e.g., solar energy and geothermal energy) [1]. Absorption refrigeration technology is known as an energy-saving technology capable of tackling the enormous energy consumption of conventional compression refrigeration for its ability to utilize waste heat resources as well as its continuity and its stability [2].
The absorption–compression hybrid cycle is based on the conventional absorption type with a compressor, through which the absorption system’s performance can be enhanced [3]. Also, through this cycle, the temperature of the driving heat source can be theoretically lowered by little additional mechanical power, which can be applied in industrial buildings and for commercial space cooling [4] and which has aroused recent attention.
Chen et al. [5] investigated the effect of the additional compressor on the double-effect absorption cycle, and the thermal performances of four cases were also compared. The simulated results suggested that it was acceptable and effective to place the compressors between heat exchangers, as the coefficients of performance (COP) and the driving temperature of the hybrid systems improved compared with the original system. Seyfouri et al. [6] proposed a compressor-assisted hybrid generator absorber heat exchange (GAX) refrigeration system powered by a built-in Rankine cycle to produce cooling below freezing temperatures (as low as −50 °C), for which the heat source temperature was 133.5 °C. Through a parametric study, the optimal operating conditions of the system were obtained. The performance was also enhanced, e.g., COP increased with the rise in the compressor discharge pressure. Also, the upper and the lower bounds for the condensation and the generator temperatures were determined in the case of a constant degassing range and discharge pressure.
Meng et al. [7] and Lounissi et al. [8] primarily discussed the use of an absorption–compression hybrid cycle to recover low-grade solar energy to produce commercial refrigeration, in which organic solvents were used as absorbents. Two new parameters were employed for the analysis of the energy-saving mechanism. An optimal compressor pressure was found in the cycle. Also, to better exploit the low-temperature renewable/waste energy of such a hybrid cycle, Wu [9] investigated and compared several ironic-absorbent-based low-global-warming-potential (GWP) refrigerants. Results indicated that R32 exhibited the optimal performance with a COP of 0.67, while R1234yf achieved the lowest COP of about 0.43. The performance of the absorption–compression hybrid cycle was not only shown to be better than that of the basic cycle, but it also reduced the generator temperature from 60–70 °C to below 45 °C.
Furthermore, hybrid cycles consisting of a compressor were applied to heat pumps. Rostamzadeh et al. [10] proposed a hybrid heat pump cycle employed in a humidification–dehumidification (HDH) system for seawater desalination. It was observed that this system had the lowest cost of freshwater by adjusting key parameters (e.g., compression ratio). Based on this type of heat pump, Changchun et al. [11] developed another novel absorption–compression system to generate industrial steam over 150 °C with waste heat in a cascade manner. The simulation was conducted using Aspen Plus, the result of which revealed that COP was upregulated by 5.49% compared with the basic heat pump, while the compressor outlet temperature was reduced below 150 °C, and its working conditions were optimized.
Moreover, the impact of compressor location on the absorption–compression hybrid system was explored. Schweigler et al. [12] analyzed a triple-level absorption–compression hybrid unit. They explored the mechanism of hybrid cycles of different positions and also investigated three major operational models. Their results revealed that the intermediate pressure ratio significantly influenced the overall system efficiency. On that basis, a detailed physical model of a turbo compressor was designed for precise prediction. Xiangyang et al. [13] also investigated the effects of compressor position. They reported that their two proposed cycles could achieve higher COP and lower f, whereby a compressor mounted on the back of an evaporator exhibited the best performance.
To gain more insight into the system for optimization, exergetic investigations abiding by the second law of thermodynamics were also extensively applied, since a feasible exergy analysis is capable of identifying the magnitude of, the locations of, and the reasons behind the thermodynamic irreversibility of the systems [14].
Experimental exergetic investigations of an absorption refrigeration system were conducted by Yıldız et al. [15], in which the exergy losses for each component of such a machine were presented and interpreted. The highest exergy loss was detected in the solution heat exchanger. Kairouani et al. [16] presented an exergetic study of a novel hybrid heat pump for solar applications, in which R124/DMAC (dimethylacetamide) was adopted as the working pair. They highlighted that the rise in intermediate pressure not only accounted for lower exergetic irreversibility and smaller driving temperature but also allowed for higher efficiency. Wu et al. [17] drew comparisons between the performance of ammonia and its matching ionic absorbents in a compression-assisted absorption heat pump. The comparison results revealed that the exergetic coefficient of performance (ECOP) of [dmea][Ac] (N,N-dimethylethanolamine/acetate) was best, with the optimal value of efficiency upon varying other operating parameters. Razmi et al. [18] developed a novel modified environmentally friendly hybrid refrigeration system without the need for a bulky condenser. They pointed out that this system exhibited four-fold better efficiency than the single-effect system, and the maximum exergy destruction occurred in the condenser and the generator.
Dixit et al. [19] theoretically assessed the performance of GAX and hybrid GAX (HGAX) absorption refrigeration systems from the perspective of exergy and energy. They found that the maximum exergetic efficiency ranged from 21% to 35% for GAX and from 22% to 43% for HGAX. Moreover, a higher value of HGAX could be attained at a slightly higher driving temperature. The energetic and the exergetic analyses of such GAX hybrid absorption systems were also conducted and compared by Yari et al. [20]. A more obvious effect of generator temperature was found on the second law of efficiency than on the COP, and the maximum exergetic efficiency of the hybrid GAX cycle occurred at a slightly higher generator temperature as compared with that of the basic cycle. Kholghi et al. [21] also compared the GAX absorption cycle with a branched GAX system with detailed exergetic analysis, in which the exergy destructions of each component and the two whole systems were revealed. For a condensation temperature of 30 °C, the exegetic efficiency and the overall exergy destruction of the branched GAX were 14.6% higher and 10.6% lower than those of the GAX, respectively. Exergo-economic analyses of the novel hybrid Rankine and the GAX cycles were conducted by Seyfouri et al. [22], where several hybrid configurations were compared and optimized. The “parallel–series” configuration was found to have the highest exergetic efficiency (42.8%). The boiler exhibited the lowest efficiency with the highest relative cost, which required improvement.
These careful investigations suggested the implication of exergetic analysis in exploring the irreversibility of absorption cycles, whereas exergetic studies of proposed hybrid cycles were rarely conducted. Furthermore, we found that the Aspen simulation model of the investigated basic system—applicable to thermodynamic analysis—was not used in the literature to study the complicated heat and mass transfer happening in a rectifier and solution cooling absorber.
Thus, a steady-state simulation model of an air-cooled absorption refrigeration chiller was originally built in this study through an Aspen Plus simulation based on experimental data. Simulation results were found to be consistent with the reference data. Subsequently, the energetic and the exergetic analyses of the basic and the hybrid cycles were presented according to the given simulation model. For hybrid cycles, configuration 1 involved setting an additional compressor between the solution heat exchanger and the solution cooling absorber, while configuration 2 involved setting one between the rectifier and the condenser. Furthermore, the effects of the configurations, the intermediate pressure, and the generator temperature were investigated to determine the optimal state of the novel cycles. In fact, we expect that our work can be used as a basis for designing or building models for other complicated cycles, especially hybrid cycles, and for selecting optimal working pairs under different operating conditions.

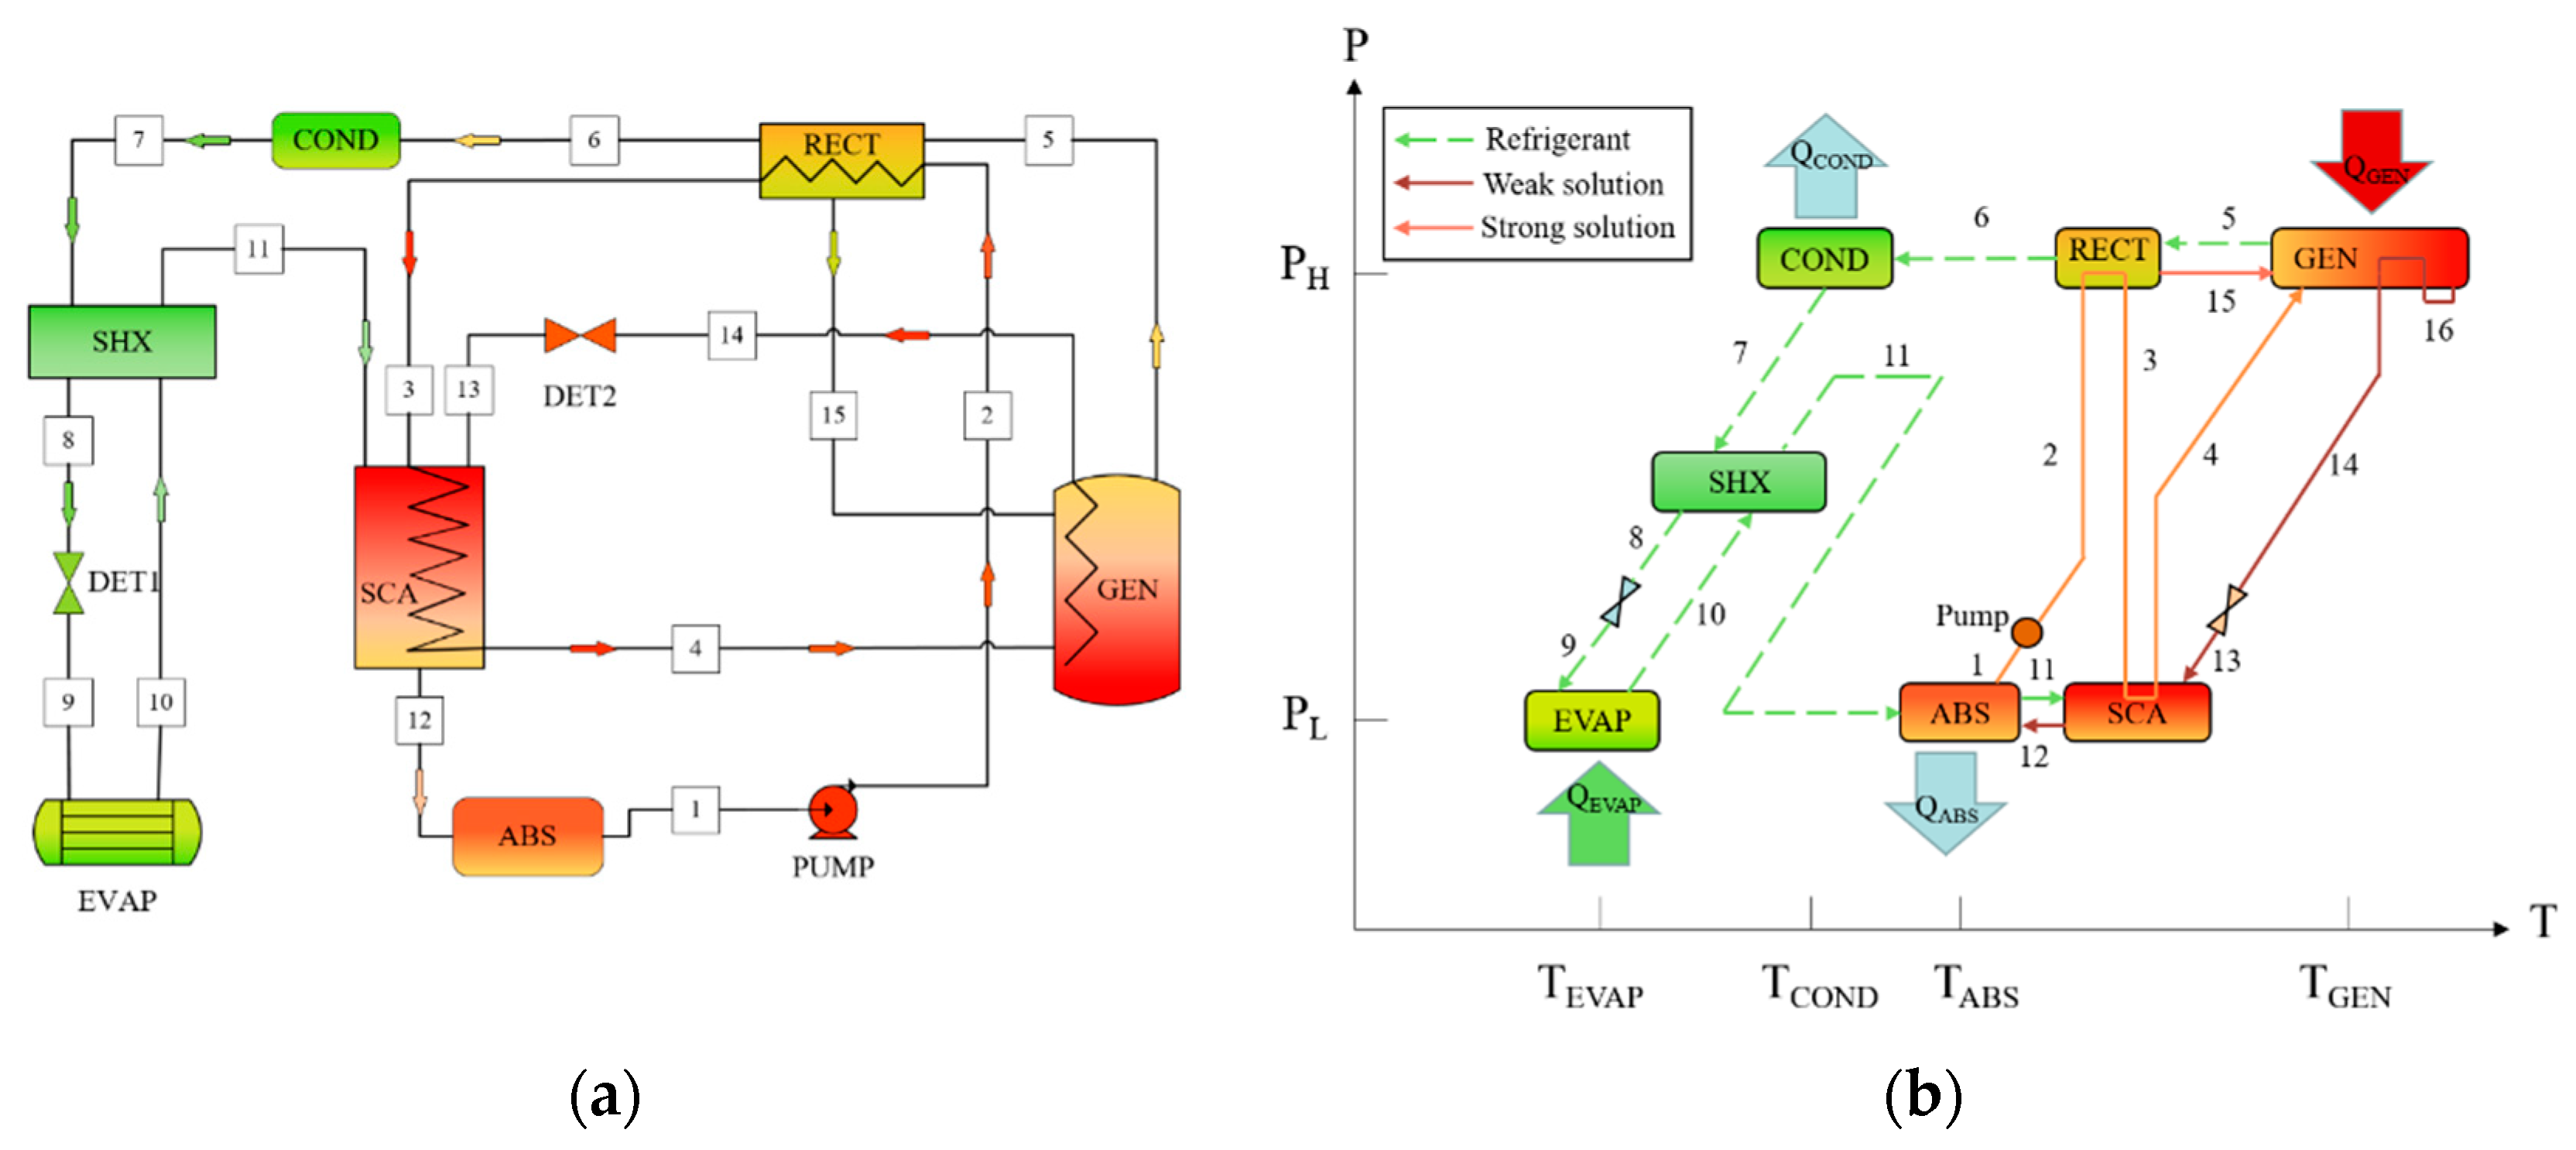
2. Unit Description and Working Principles

A schematic representation and a pressure-temperature (P-T) diagram of the investigated basic absorption cycle are shown in Figure 1. This unit is air-cooled and gas-fired, for which the working pair of ammonia/water was adopted. In the generator (GEN), the refrigerant vapor was obtained by heating the mixture of ammonia and water (Stream 4) with an liquefied petroleum gas (LPG) burner. Then, the “almost pure” ammonia vapor (Stream 5) got further purification from the water vapor by transferring its heat to a strong solution (Stream 3) from the air-cooled absorber (ABS), causing the partial condensation in the rectifier (RECT). Subsequently, the refrigerant vapor (Stream 6) continued to flow to the air-cooled condenser (COND) where it got liquefied, and then it underwent one subcooled process and one throttling process in the solution heat exchanger (SHX) and the throttle valve (DET1) respectively. In the evaporator (EVAP), the liquid refrigerant (Stream 9) was restored to the vapor state (Stream 10) again by absorbing the heat from chilled water, producing the cooling capacity. Next, the vapor (Stream 11) was dissolved with a weak solution (Stream 13) from the generator (GEN) and transformed into a strong solution (Stream 12). The absorption process was completely achieved through two absorbers set (ABS, SCA), one cooled by the air and the other by internal heat transfer. Afterward, the strong solution (Stream 1) was pumped to a high-pressure generator (GEN). Commonly, in a basic cycle, in addition to the inside heat recovery of the generator (GEN), the heat generated within the rectifier (RECT) and the solution cooling absorber (SCA) is carried by the strong solution from the absorber (ABS), causing its COP to be higher than that of the single-stage absorption cycle.

3. Establishment of Simulation Model

3.1. Setting Parameters

The steady-state simulation model in this study was built by a chemical engineering software, Aspen Plus. It is an advanced flowsheet simulator with a large databank of physical-chemical properties [23] through which operational characteristics of experimental devices can be better reflected than the numerical simulation. It also abides by energy and mass balance automatically, as long as the accuracy of simulation modules is ensured.
The PR-BM (Peng–Robinson equation of state with the mixing rule of Boston–Mathias alpha temperature function) property model was first adopted to predict thermodynamic properties of the ammonia/water [24]. This equation is known to be reliable and feasible in predicting non-polar or weak-polar mixtures, which also can be utilized for all temperature and pressure ranges, especially some gas processing applications [25]. Subsequently, binary interaction parameters of the equation were fitted to the reference T-x-y vapor-liquid equilibrium data from the open literature [26] by the Aspen Plus Data Regression System facility. Regressed binary interaction parameters K N H 3 / H 2 O A , K N H 3 / H 2 O B , and K N H 3 / H 2 O C were −1.00169, 0.0011, and 119.821, respectively [21]. The simulation design only makes sense when properties of the working fluid are accurately calculated.
Next, the simulation model of the absorption cycle was built based on the predecessors’ experimental data [27], as depicted by Aspen in Figure 2 [among which the virtual separator (SEP) could be removed and was only adopted in analysis]. The authors performed experiments at three ambient air temperatures (26 °C, 35 °C, and 38 °C) with 14 temperature measurement points in the basic system, in which the energy input of the generator in each case was kept at about 17 kW. Nominal design conditions employed for the model construction are listed in Table 1, in which the ambient temperature was at 35 °C. Operating states in other conditions were for verification. The simulation results of May [28] were also used for the comparison.
In Aspen Plus, the accurate selection of equivalent modules for the components is especially vital, since modeling the absorption cycle is based on these modules [23,24,29]. Accordingly, the names and the setting values of selected modules corresponding to their components in Figure 2 are given in Table 2. Among the setting parameters, the isentropic efficiency of the pump was assumed as 100% for its small power consumption and its slight effect on the overall performance of the unit [12,17,18,30].

3.2. Assumptions and Simplification

Note that, in Figure 2, a virtual separator (SEP) was set before the condenser (COND), which was employed to block water from entering subsequent heat exchangers. Partial water vapor existing in a system can cause unprofitable effects of the whole unit and state disorder during simulations, making conduction of normal analysis difficult [29]. This hypothesis did not affect the performance of the system except parts of state points, and it enabled normal analysis even when the system was running poorly. However, to get closer to the results under experimental conditions for verification, the separator module (SEP) was only employed when performing thermodynamic analysis in the following hybrid cycles.
It was equally noteworthy that the absorbers (SCA, ABS) and the generator (GEN) were critical components of the absorption cycle because primary states in these components were in non-equilibrium (as represented by changing colors in Figure 1). Thus, several assumptions were required to simplify the model [28]:
  • Because of the lack of relevant experimental information, the processes of the vapor leaving the RECT towards the COND and the condensate returning to the GEN were supposed to be in equilibrium. Given this, to simply the device, the rectifier was integrated into the generator module with the top stage of the distillation column as a rectifier for which the heat transferred to the strong solution could be considered in its regenerating process. This was a rough but effective simplification [29].
  • As the wide concentration change existed between strong and weak solutions (suggesting their huge temperature differences in the solution loop), there was a process of internal heat recovery happening in the GEN, where inlet solutions (Stream 4, 15) were heated by the sensible heat of the high-temperature outlet solution (Stream 14). For simplification, the exit temperature of Stream 14 was almost equal to that of stage 2 in the GEN, i.e., it was equivalent to the temperature of the condensate leaving the rectifier (RECT) [31].
  • The treatment of complex structures of the solution cooling absorber (SCA) was also effectively simplified by introducing a new parameter ε l i q to define its unique heat exchanger effectiveness:
    ε l i q = T 13 T 12 T 13 T 3
    According to its definition, T13 and T3 represent the highest temperature of the incoming weak solution (Stream 13) and the lowest temperature of the incoming strong solution (Stream 3) in the SCA respectively. Also, T12 denotes the outlet strong solution’s temperature (Stream 12). Therefore, the denominator and the numerator represent the theoretical maximum heat transfer rate and the actual heat recovery of the exothermic reaction that could be achieved for liquid, respectively. To be specific, ε l i q describes the ratio of possible heat for liquid that could be recovered from the coupled heat/mass transfer processes in the SCA.
The above assumptions could be implemented through corresponding Calculator and Transfer blocks [25], in which self-written Fortran programs are supported.

3.3. Validation of the Model

To obtain the value of a new parameter ε l i q in Calculator, according to its definition, the reported experimental data by Klein [27] at an ambient cooling air temperature of 35 °C was used to minimize errors of the objective function below:
f e r r = i = 1 14 ( T c a l , i T e x p , i T e x p , i ) 2 + ( Q ˙ c a l , G e n Q ˙ e x p , G e n Q ˙ e x p , G e n ) 2
The subscript i refers to each corresponding calculated or experimental state point measured by Klein [27]. By the calculation, the minimum errors could be obtained when the value of ε l i q was equal to 0.69, and the states of the calculated points were well in agreement with those tested, as shown in Figure 3.
In Figure 3, different simulation results from this study and May [28] are compared together with the experimental data at the cooling air temperature of 35 °C. Detailed calculated state points of the simulation model are also listed in Table 3. Moreover, heat duties of main components and COP reported in the Klein’s work [27] and present work are given in Table 4. As regards the thermal loads, the maximum deviation happened in the generator, which was about 1.25 kW and below 7%. Also, the COP’s deviation was about 5.3%.
Next, to prove the accuracy of the built model in performing analysis, results of the ambient temperature at about 26 °C were also used for verification by converting all HeatX modules from temperatures set to UA values set, which were calculated in thermal results of the countercurrent heat exchangers at 35 °C. Then, the temperature of each point in the analytic case could be obtained based on these operations. The compared results are shown in Figure 4 with good consistency as well. According to all results, the validity of the above assumptions was proven.

4. Exergy Balance

Exergy refers to the maximum available energy for any form of energy that can be converted into the useful work. Exergy balance is an effective and feasible criterion for the quality of conversion and the irreversibility of energy. Regardless of potential and kinetic parts, the specific exergy of any stream can be formed as the sum of thermophysical and chemical exergies [32]:
E x = E x p h + E x c h
Since no chemical reactions happened between streams and the diffusion effect of ammonia in water for solutions was negligible, only the thermophysical exergy was considered [18,28,33]. On that basis, the specific exergy of the relevant stream at average temperature T is defined as [8,21,34]:
E x = ( h h 0 ) T 0 ( s s 0 )
For any controlled thermal process in a system, the exergy balance equation then could be expressed by [15,21,34]:
  ( q ˙ n E x ) i n , k   ( q ˙ n E x ) o u t , k ±   E x Q ˙ , k ± W ˙ k = E x D , k
where E x Q ˙ , k denotes the thermal exergy from the heat source, the definition of which is shown below [16,28]:
E x Q ˙ , k = Q ˙ k ( 1 T 0 T k )
also, E x D , k refers to the exergy destruction of the corresponding component k.
In the above equations, W ˙ k and Q ˙ k are the respective work and heat exchanged with the ambient environment. Subscripts 0 and k denote the environmental state and the specific component, respectively. Terms h and s are the enthalpy and the entropy of the relevant stream, respectively.
Subsequently, the exergy balances in major components of the basic cycle are expressed as follows [16]:
E x D , E V A P = q ˙ n , 9 ( E x 9 E x 10 ) + Q ˙ E V A P ( 1 T 0 T E V A P )
E x D , S H X = q ˙ n , 7 ( E x 7 E x 8 ) + q ˙ n , 10 ( E x 10 E x 11 )
E x D , C O N D = q ˙ n , 6 ( E x 6 E x 7 ) Q ˙ C O N D ( 1 T 0 T C O N D )
E x D , S C A = q ˙ n , 11 E x 11 + q ˙ n , 13 E x 13 + q ˙ n , 3 ( E x 3 E x 4 ) q ˙ n , 12 E x 12
E x D , A B S = q ˙ n , 12 ( E x 12 E x 1 ) Q ˙ A B S ( 1 T 0 T A B S )
E x D , R E C T = q ˙ n , 1 ( E x 2 E x 3 ) + Q ˙ R E C T ( 1 T 0 T R E C T )
E x D , G E N = q ˙ n , 4 E x 4 + q ˙ n , 17 E x 17 q ˙ n , 14 E x 14 q ˙ n , 5 E x 5 + Q ˙ G E N ( 1 T 0 T G E N )
The relationship between streams could be formulated by the term solution circulation ratio:
f = q ˙ n , 4 q ˙ n , 6 = x 6 x 14 x 4 x 14
The irreversibility of each component k is written as [19,21]:
φ k ( % ) = E x D , k E x D , T × 100 %
where E x D , T denotes the total exergy destruction in all components.
The exergetic efficiency could reflect the degree to which the energy of any component was exploited in quality, which is defined as [8,15,16]:
η k = ( E x o u t ) k ( E x i n ) k
For the basic whole cycle, the overall exergetic efficiency is expressed as [16,19]:
η = | Q ˙ E V A P ( 1 T 0 T E V A P ) Q ˙ G E N ( 1 T 0 T G E N ) + W ˙ P U M P |
Likewise, several hypotheses should be considered in exergetic investigations:
  • All investigations are in steady-state;
  • Pressure drop and heat losses within the device can be neglected except the throttling process;
  • The temperature of each heat exchanger is its logarithmic mean temperature difference;
  • The exergy destruction of the virtual block SEP is ignored;
  • Reference states of the ambient environment are 1.01325 bar and 25 °C.
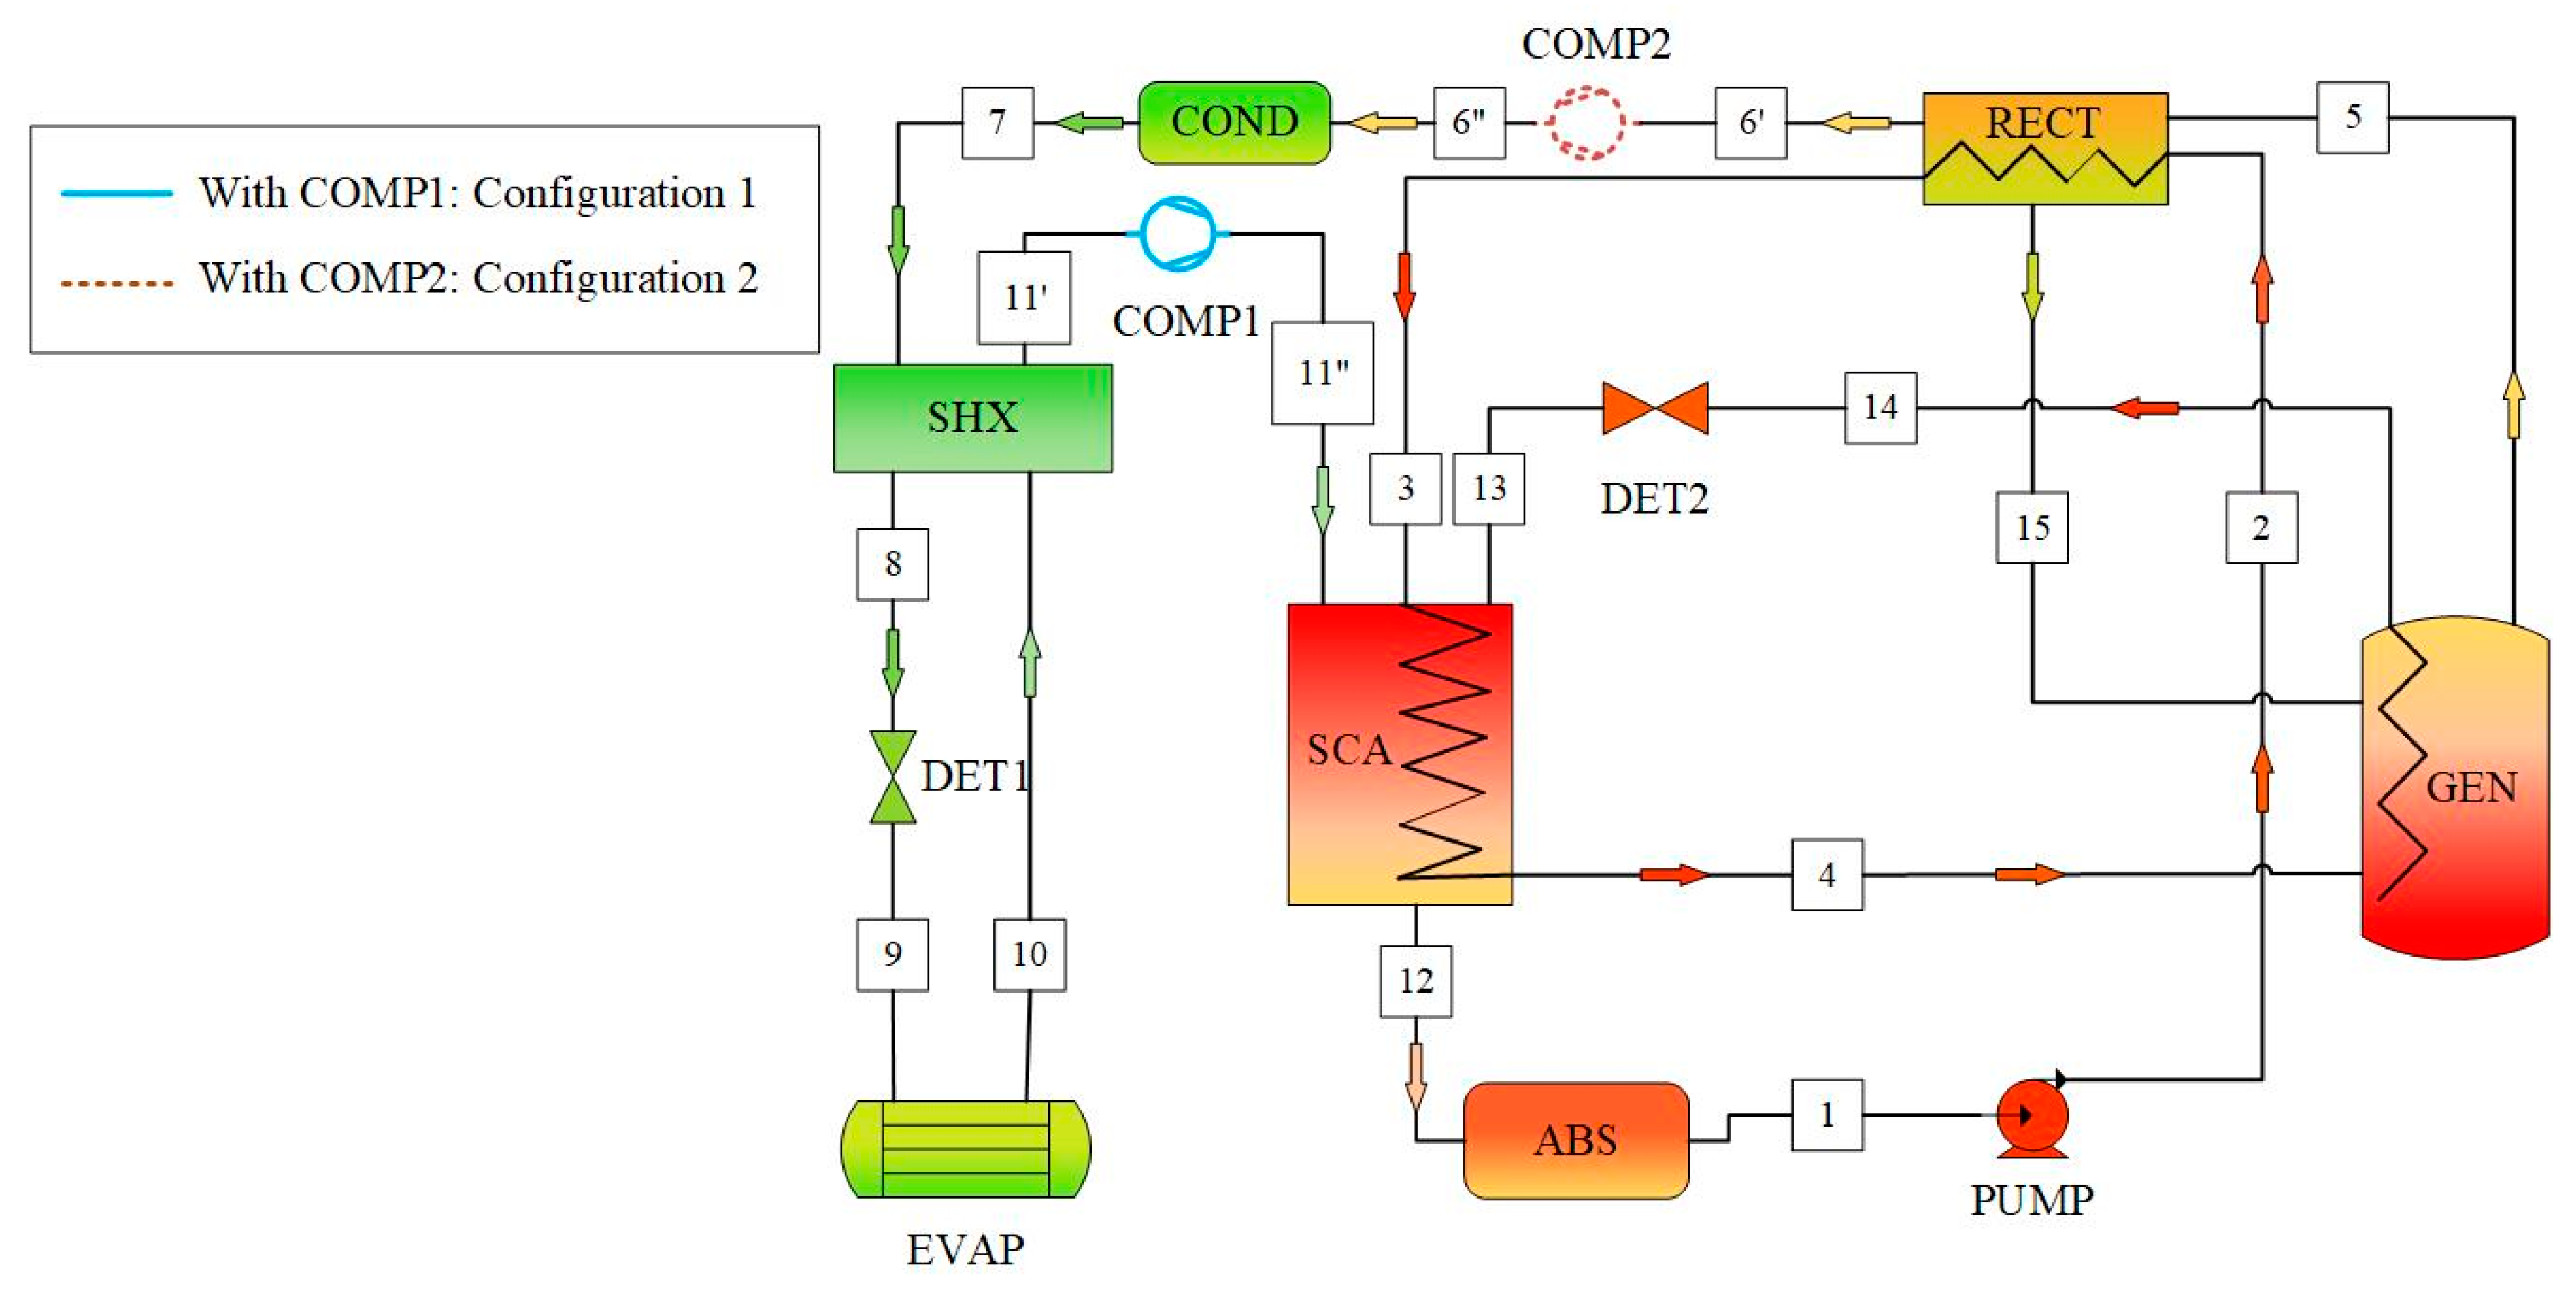
By conducting these exergy balance equations, calculated specific exergetic information of each component k in the above-mentioned simulation model under nominal design conditions was obtained and is listed in Table 5 below.

5. Hybrid Cycles

Two configurations of hybrid cycles were proposed, as illustrated in Figure 5, between which the distinction was the setting position of a compressor. For the convenience of comparison, the former setting a compressor between the SHX and the SCA was termed as configuration 1 and the latter between the RECT and the COND as configuration 2. Both hybrid types could theoretically enhance the performance of the basic system. Configuration 1 could raise the pressure of the absorbers (ABS, SCA), thereby enhancing the solubility of ammonia vapor within solutions, and the cooling capacity could be improved when at a fixed generator heat load. Configuration 2 could alleviate the pressure of the generator; thus, the solubility of the ammonia strong solution was decreased, resulting in the reduced generator heat load when at a fixed cooling capacity.
With the above measures, hybrid cycles could operate at three pressure levels, in which the respective downstream and upstream pressures of the compressor for configurations 1 and 2 were intermediate. To facilitate the exploration of their effects on the performance, the compressor pressure ratio is defined as [12,13]:
π = P I P L f o r   1   o r   π = P H P I   f o r   2
Subsequently, the COP and the exergetic efficiency η are respectively deduced as [16,19]:
C O P = Q ˙ E V A P Q ˙ G E N + W ˙ P U M P + W ˙ C O M P
η = | Q ˙ E V A P ( 1 T 0 T E V A P ) Q ˙ G E N ( 1 T 0 T G E N ) + W ˙ P U M P + W ˙ C O M P |
where the calculation of the real work in a compressor is based on its isentropic process:
W ˙ C O M P = W ˙ i s η i s
Also, the relationship between the isentropic efficiency and the compressor pressure ratio is given as [8,16,35]:
η i s = 0.874 0.0135 π

6. Results and Discussion

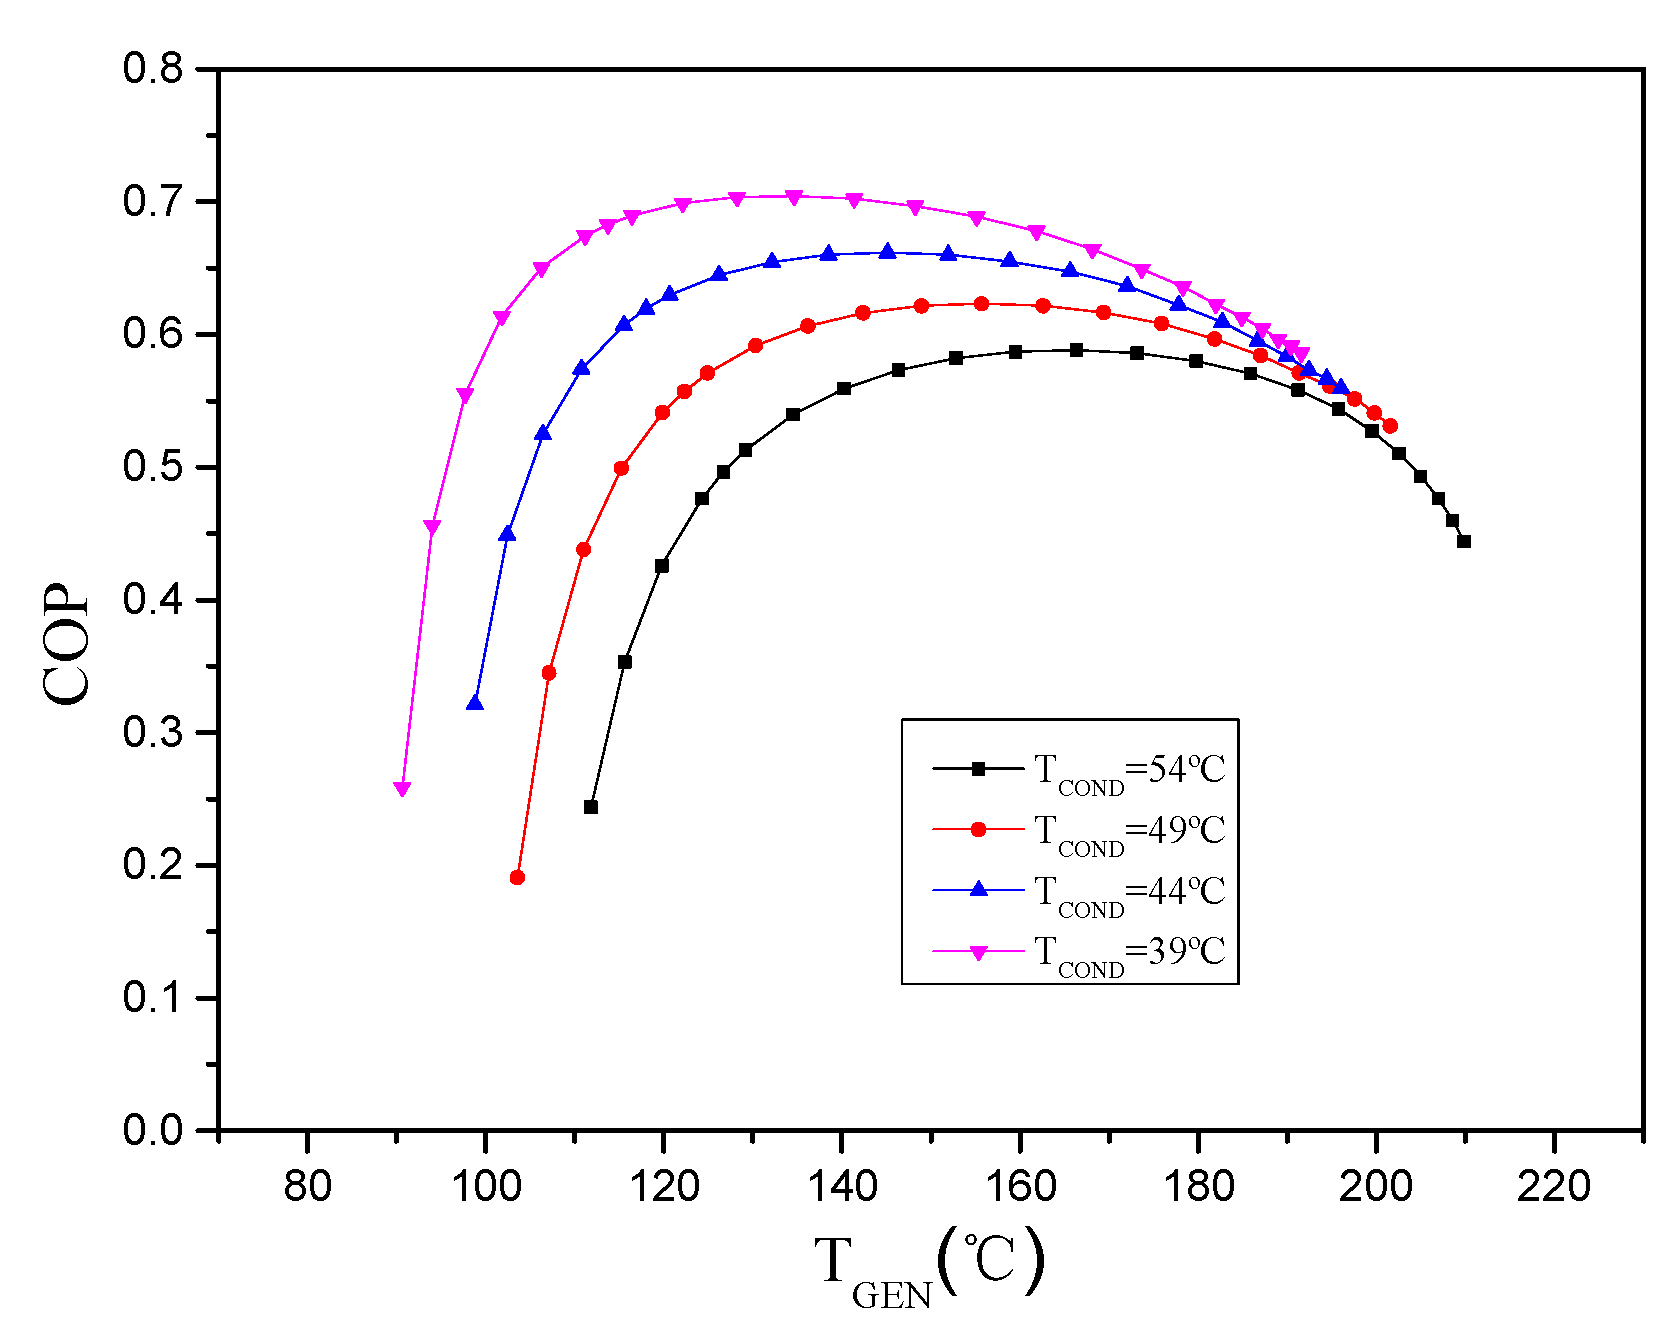
6.1. Performance of Basic Cycle

Thermodynamic research of hybrid cycles was conducted based on the built model above. The virtual module SEP was employed to ensure the normal operation of the unit even in the case of low load. To figure out the influences of external environments on systems more easily, condensation temperatures were adopted for analysis instead of condensation pressures, while the evaporation and the absorber temperatures were always kept at 4 °C and 45 °C, respectively.
Figure 6 shows how the generator temperature affected COP of the original cycle at different condensation temperatures. COP first increased with the rise in the generator temperature; after the generator temperature reached the optimal value, continuously increasing the temperature did not improve COP. Additionally, COP at the lower condensation temperature was always larger than that at the higher temperature. For instance, when the generator temperature was 140 °C, COP was upregulated from 0.56 at TCOND = 54 °C to 0.69 at TCOND = 39 °C. The optimal generator temperature slightly decreased with the fall in the condensation temperature, whereas the corresponding maximum COP was still increasing. As the optimal temperatures of different condensation temperatures were 160 °C, 150 °C, 140 °C, and 130 °C, the corresponding COPs were 0.58, 0.62, 0.66, and 0.7, respectively.
Figure 7 also illustrates variations of the exergetic efficiency η for the basic cycle under different condensation conditions. With the decrease in the condensation temperature, the exergetic efficiency appeared to increase, and the generator temperature corresponding to the maximum value declined, consistent with the variations of COP. Its maximum value varied between the generator temperatures of 110 °C and 140 °C (for nearly 11.5% at TCOND = 54 °C to about 17.2% at TCOND = 39 °C).
After reaching the optimal points, the exergetic efficiency dropped sharply with the growing TGEN instead of being stable as with COP. For instance, at the condensation temperature of 39 °C, it was reduced from 17.2% at 110 °C to about 10% at 190 °C. Also, the differences of COP and η between condensation temperatures at the high TGEN were increasingly reduced. Thus, from overall considerations of the relations between COP, exergetic efficiency η, and generator temperature, it was speculated that the basic system should not operate over 160 °C.
Above changes in COP and η could also be explained by Figure 8, which shows the variations of the solution circulation ratio f versus the TGEN for the basic cycle at different condensation temperatures. f was reduced not only with the rise in TGEN but also with the decrease in TCOND, the reduction of which helped lessen the volume of the absorption refrigeration system. The reason for this was that, when TGEN began to rise, the solubility of the ammonia solution in the generator decreased, leading to the decrease in f and the rise in COP and η. Nevertheless, as TGEN continued to grow, the decreasing rate of the solubility was smaller, resulting in a moderate reduction rate of f and an increasing rate of Q ˙ E V A P . This suggested that more heat was needed and more exergy destructions were caused in the generator, thus COP and η would decline to a certain extent.
Figure 9 plots the percentages of irreversibility φ of main components versus TGEN in the basic cycle at the condensation temperature of 54 °C, where major irreversible exergy losses were occurring in the absorber, the solution cooling absorber, and the generator. The reason for this phenomenon was that the higher the TGEN was, the lower the f was, resulting in the rise in temperature of the weak solution, which explained a beginning rise in φ happening in the SCA and the ABS. Besides, as the TGEN kept increasing, the heat recovery of the SCA gradually improved as well, leading to a continuous increase of φ in the SCA and a reduction in the ABS at last.

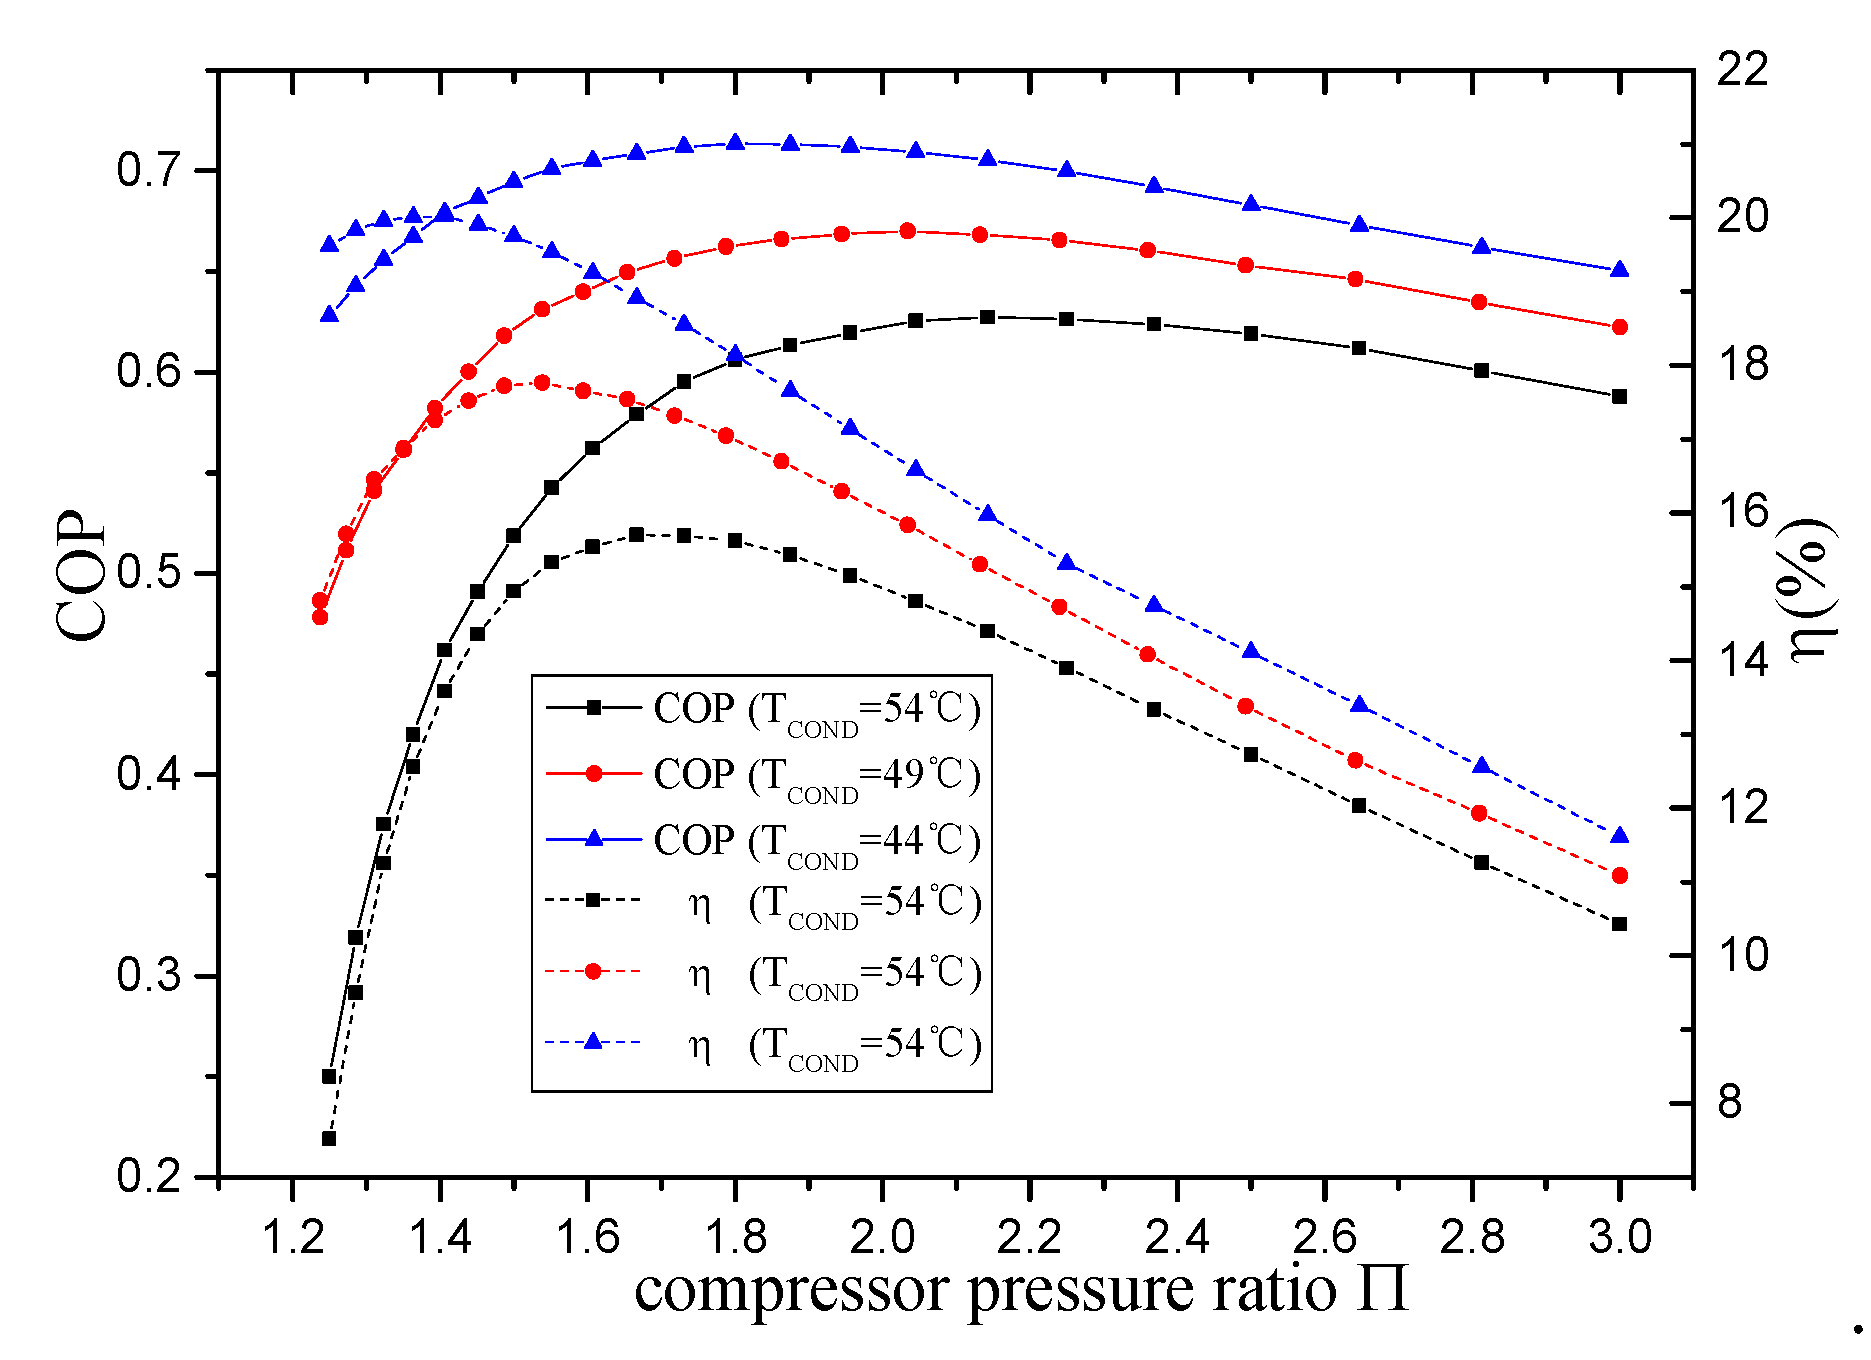
6.2. Variations of COP for Hybrid Cycles

On the whole, main components (absorbers and generator) of the refrigeration unit should be optimized. Two configurations in Figure 5 were then taken to build different absorption–compression hybrid refrigeration systems. Principles of enhancing the performance of the chiller were also different; configuration 1 focused on increasing the concentration of ammonia solution in the absorbers (SCA, ABS), while configuration 2 primarily reduced the solubility in the generator (GEN). To clarify the differences brought by a compressor and to explore the performance in harsher environments, major analyses of hybrid cycles were conducted at a uniform condensation temperature of 54 °C.
The relationships between COP and TGEN at different intermediate pressures P i n t (or compressor pressure ratios π ) under two hybrid types are represented by Figure 10 and Figure 11. These two figures suggest that the COP of both hybrid cycles was higher than that of the basic cycle. Furthermore, the TGEN corresponding to the maximum COP decreased with the increase in π , which meant the two proposed systems required a lower driving temperature than the initial one. For example, in Figure 10, the optimal COP for the initial system was about 0.58 at TGEN = 160 °C, as shown in Figure 6, while the optimal COP for configuration 1 at P i n t of 6 bar was about 0.63 for the generator temperature of 150 °C, and it could reach about 0.74 at TGEN =120°C and P i n t = 10 bar. The COP of configuration 1 could increase by up to 15%. Figure 11 shows that, for configuration 2, the optimal COP was about 0.6 at P i n t of 16 bar and TGEN of 135 °C, and its maximum value was nearly 0.63 at P i n t of 12 bar for TGEN = 100 °C. The COP of configuration 2 could be improved by up to 5%.
This also displayed that there was an optimal P i n t that occurred in both hybrid cycles. At this time, increasing the intermediate pressure ratio did not continue to increase COP; nevertheless, the temperature corresponding to each optimal point continued to decrease.
Results also illustrate that, for configuration 1, the increase in P i n t not only reduced the generator temperature in each optimal state but also increased the operating range of the system. For the basic system, its range was from 110 °C to 210 °C, while the starting operating temperature was reduced to 65 °C when at P i n t of 14 bar. However, for configuration 2, the increase of π only reduced the initial operating temperature, and the operating range was not significantly expanded. Additionally, the COP of configuration 1 at the highest TGEN increased with the growing P i n t , while configuration 2 showed the opposite. All of this could be ascribed to the individual working principles; the compressor in configuration 1 increased the mass concentration of ammonia in the absorbers, causing the good separation rate of the strong solution (even in higher TGEN), while in configuration 2, the compressor was used to strengthen the vapor separation in lower TGEN, leading to the poor effect in higher TGEN, where the function of a compressor only acted as a temperature transformer. All the analyses above verified the feasibility of both hybrid cycles in solar energy and other renewable energies, among which corrosion of the high-temperature solution happening in the generator could be solved by configuration 2, and configuration 1 could be applied to a wider operating range of waste heat scenarios.
To compare COP deeply between hybrid cycles, Figure 12 depicts their detailed variations with the compression ratio π at different TGEN. When π was set as 1, configurations 1 and 2 could be viewed as the basic cycle. It shows that the results in Figure 12 were consistent with those in Figure 10 and Figure 11, where, for TGEN = 120 °C, the optimal π s were 2.1 (10.5 bar) and 1.87 (12 bar) in configurations 1 and 2, respectively, while for TGEN = 100 °C, the optimal π s were upregulated to 2.2 (11 bar) and 2.1 (11 bar) in respective cycles, and when TGEN was reduced to 80 °C, they also increased up to 2.6 (13 bar) and 2.5 (9 bar). This indicated that the lower the generator temperature was, the greater the compressor work was needed.
Figure 12 also shows that, when at the same TGEN, the higher the π was, the greater the differences of COP between the two configurations were. This indicated that the strengthening effects of different compressor locations on COP were different and that the former was much greater than the latter.

6.3. Variations of Overall Exergetic Efficiency for Hybrid Cycles

To explore the performance of the novel hybrid cycles more deeply, variations of the overall exergetic efficiency were studied. Figure 13 and Figure 14 respectively reveal how TGEN affected the overall exergetic efficiency η in both configurations for different intermediate pressures P i n t . The variations of η corresponded to COP, as shown in the above figures. The largest optimal ηs of both configurations were better than those in the basic cycle by differences of about 5.5% and 4%, respectively; the generator temperature of the optimal η was also downregulated with the rise in π , as with what happened for COP.
However, there were still some differences. For configuration 1, the optimal η in the investigated pressure range was the largest at about P i n t = 8 bar ( π = 1.6) and TGEN = 110 °C, while COP was at 10 bar ( π = 2) and 120 °C. Similar results were obtained in configuration 2, where the optimal η was the highest at about P i n t = 14 bar ( π = 1.6) and TGEN = 100 °C, while COP was at 12 bar ( π = 1.87) and 100 °C. All these results proved that the energy was reflected faster in quality than quantity. The maximum optimal ηs were respectively about 17% and 15.5% for both hybrid cycles. A second difference was that, when the optimal point was reached under the respective P i n t , further increasing TGEN caused dramatic decline of η (but not as slowly as COP in both configurations), which also verified that the exergetic analysis was more sensitive. The third was that, for configuration 1, differences of the exergetic efficiency between intermediate pressures at higher TGEN were increasingly reduced, while COP displayed significant growth with the growing P i n t , though the trend of configuration 2 was consistent and declining. This meant that the strengthening effect of configuration 1 at higher TGEN was increasing in quantity but remained the same in quality, while the effect of configuration 2 was continuously reduced regardless of quality or quantity, which was ascribed to their respective principles.
Figure 15 presents the evolution of η beyond the compressor pressure ratio π at different TGEN for configurations 1 and 2, the results of which were consistent with the values beyond TGEN. For TGEN = 120 °C, the optimal ηs in configurations 1 and 2 were respectively 16.6% of π = 1.5 (7.5 bar) and 15.3% of π = 1.4 (16 bar), and for TGEN = 100 °C, the optimal ηs increased up to 16.9% of π . = 1.72 (8.6 bar) and 15.7% of π = 1.66 (13.5 bar), while for TGEN = 80 °C, the optimal ηs were then reduced to 15% of π = 2.2 (11 bar) and 15.1% of π = 2.25 (10 bar).
It was noteworthy that, at TGEN = 120 °C, the higher compressor pressure ratio π may have resulted in ηs of both configurations being lower than those of the basic cycle at about π = 2.25 (10 bar) and 2.6 (8.65 bar), respectively, which verified that running hybrid systems at higher pressure ratios and temperatures led to a greater loss of the energy in quality than that in quantity. A second noticeable result was that, with the same TGEN, the higher the π was, the smaller the differences of η between the two configurations were. A third significant result was that, when operating at TGEN = 80 °C, the variation of η was reversed, where that of configuration 2 was larger than that of configuration 1. Therefore, it was demonstrated that, in low-temperature and high-pressure applications, the energy utilized in quality of configuration 2 was better than that of configuration 1.

6.4. Detailed Information of Optimal State for Hybrid Cycles

Thus, given the above variations of COP and η in both configurations, the optimal operation could be obtained when the generator temperature was about 100 °C. Figure 16 shows how the circulation ratio f varied with π at TGEN = 100 °C. As can be seen, f of configuration 1 dropped faster than that of configuration 2, which meant the flow rate of solutions required for configuration 1 was lower than that for configuration 2, resulting in a smaller system size at a same amount of refrigeration, which also meant a wider outgassing range for configuration 1, causing a stronger output cooling capacity. However, this kind of beneficial effect was also costly, as shown in Figure 17; the total exergy destruction was much larger with the rise in π compared to configuration 2.
As mentioned above, major irreversibility happened in the absorbers (SCA, ABS) and the generator (GEN), thus the exergetic efficiency of ABS, SCA, GEN, and COMP versus π at TGEN of 100 °C is illustrated in Figure 18. It was discovered that variations of η in the generator were consistent with those in both whole hybrid cycles in Figure 15. For configuration 1, the optimal η of the generator was located in π = 1.7, which was similar to 1.72 of the whole cycle, while for configuration 2, the value of the generator was in π = 1.68, which was also similar to 1.66 of the whole cycle. These results confirmed the major role of the generator.
A second finding was that, for configuration 1, η of the SCA and the GEN increased with the rise in π, suggesting that the strengthening effect of configuration 1 was primarily at the solution cooling absorber and the generator, while for configuration 2, the increase only appeared in the GEN, meaning the strengthening effect was only in the generator. This finding revealed improvement of major irreversible components. A third significant result was that η of each component for configuration 1 was larger than for configuration 2 except the compressor, since the compressor in configuration 1 acted as not only a temperature transmitter but also as a performance enhancer. The double effect resulted in worse exergetic efficiency of the compressor compared to that of configuration 2, whereas it effectively enhanced the efficiency of other components.
The exergy destructions of these components are illustrated in Figure 19, where the values are consistent with the results in Figure 17 and Figure 18. The exergy destruction of nearly every component for configuration 1 was higher than that for configuration 2, since the stronger effect of configuration 1 caused the wider concentration change of the solution loop, which needed more heat input at a fixed temperature. Also, despite the first rise in exergetic efficiency of the SCA and the GEN, exergy losses were always increasing, allowing this parameter to specifically show the real performance of these components. Furthermore, with the rise in π , the exergy destructions of the compressor increased rapidly, and it gradually played a leading role, which explained the sharp ending decline of η.
For further investigations regarding the parameters of temperatures and pressures, taking the optimal TGEN = 100 °C as an example, Figure 20 and Figure 21 depict the evolution of COP and η with π for both configurations at different TCOND. The results of configuration 1 were consistent with those of configuration 2, as their curves exhibited the same trends. With the decrease in the condensation temperature, the COP and the exergetic efficiency of both configurations were upregulated. The optimal compressor ratios of both COP and η also showed reduction, which meant less compressor work was needed in both configurations at lower ambient temperature, regardless of the exergetic or the energetic perspectives. In particular, the differences of the optimal π between COP and η for each condensation temperature were almost the same; for configuration 1, the values within the three TCOND were always about 0.5, while for configuration 2, the value of approximately 0.4 was also kept, which proved the consistency and the accuracy of the calculated results in our built model under different conditions.
Figure 20 and Figure 21 also display that, at the same optimal TGEN = 100 °C, regardless of each configuration’s COP or η, the higher the π was, the smaller the differences between different condensation temperatures were, indicating the smaller benefit caused at the higher π . Former conclusions that the exegetic investigation was faster and more sensitive could be confirmed again from these figures, as the exergetic efficiency decreased significantly when exceeding the optimal π . Therefore, for the operation of the two hybrid systems, attention should be paid to controlling the pressure ratio range of compressors.

7. Conclusions

A steady-state simulation model was built by Aspen Plus to predict the performance of an absorption refrigeration chiller verified by the published experimental data. Given the complex heat transfer processes in heat exchangers, several assumptions were made to simplify the model for which a new parameter ε l i q was introduced to describe the ratio of possible heat for liquid that could be recovered from the coupled heat/mass transfer processes in the SCA.
Energetic and exergetic investigations of the basic cycle and the hybrid cycles were conducted by adding the virtual block SEP to the built model. For the basic cycle, the values of COP and overall exergetic efficiency η at lower condensation temperatures were higher, and they always first increased with the growing generator temperature and then declined after reaching the maximum point. Also, the major irreversible exergy losses occurred in the absorbers and the generators. Two new hybrid refrigeration systems were then proposed for the optimization of these components by adding a compressor. The major conclusions are as follows:
  • Both configurations could improve the basic cycle because the maximum COP and η of configuration 1 increased by 15% and 5.5%, respectively, and those of configuration 2 were also upregulated by 5% and 4%. The driving generator temperatures of both configurations also decreased, which verified their feasibility in waste heat sources.
  • Both configurations had the optimal P i n t corresponding to COP and η, and the optimal P i n t of η was reflected faster than COP, which proved the exergetic analysis to be more sensitive. The rise in P i n t merely expanded the operating range of configuration 1, suggesting its wider range of waste heat utilization, while a corrosion of the high-temperature solution in the generator could be avoided by configuration 2.
  • Detailed information at common optimal TGEN = 100 °C was also illustrated. The results confirmed that the main irreversible components (except the absorber) both had improvements. Moreover, with the rise in P i n t , the compressor gradually played a major role in exergy losses. The results at the optimal TGEN affected by condensation temperatures were also displayed.
Due to the investigated harsh environments, the COP and the overall exergetic efficiency of the systems were not high, whereas the proposed hybrid configurations verified their feasibility in respective scenarios. It was also found that, for configuration 2, when P i n t increased to a certain value, the outlet temperature of the compressor was higher than that of TGEN, which also created a novel method for our subsequent study to further enhance its performance by transferring the heat of the condenser to the generator.

Author Contributions

Conceptualization, X.Z.; Methodology, X.Z.; Formal analysis, X.Z.; Writing-Original Draft Preparation, X.Z.; Writing-Review & Editing, T.C.; Supervision, L.C.; Project Administration, L.C.

Funding

This research was founded by the National Key Research and Development Program of China (Grant No. 2018YFC0705306), the Natural Science Foundation of China (Grant No. 6503000103).

Acknowledgments

The authors acknowledge the School of Energy and Environment of Southeast University, 210096, China for the support given to conduct this research.

Conflicts of Interest

The authors declare no conflict of interest.

Nomenclature

CONDCondenser
SHXSolution heat exchanger
DET1Expansion valve 1
DET2Expansion valve 2
EVAPEvaporator
SCASolution cooling absorber
ABS Absorber
GENGenerator
PUMPPump
RECTRectifier
SEPVirtual component separator
H-RECOHeat-recovery block
MIXMixer
COP Coefficients of Performance, COP = Q ˙ E V A P /( Q ˙ G E N + W ˙ P U M P )
COMPCompressor
UAProduct of heat transfer coefficient and area
TTemperature [°C]
PPressure [bar]
xMole fraction
Q ˙ Heat duty [kW]
q ˙ n Mole flow [kmol/h]
η i s Isentropic efficiency
hyMole enthalpy [kJ/mol]
sMole entropy [kJ/mol·K]
ExSpecific exergy [kW]
Subscripts
liqLiquid
calCalculated
expExperimental
DDestroyed exergy
TTotal
0Reference
isIsentropic
kSpecific component
IIntermediate-pressure
LLowest-pressure
HHighest-pressure

References

  1. Sim, J.; Kim, C.S. The value of renewable energy research and development investments with default consideration. Renew. Energy 2019, 143, 530–539. [Google Scholar] [CrossRef]
  2. Li, J.; Xu, S. The performance of absorption–compression hybrid refrigeration driven by waste heat and power from coach engine. Appl. Therm. Eng. 2013, 61, 747–755. [Google Scholar] [CrossRef]
  3. Jung, C.W.; Song, J.Y.; Kang, Y.T. Study on ammonia/water hybrid absorption/compression heat pump cycle to produce high temperature process water. Energy 2018, 145, 458–467. [Google Scholar] [CrossRef]
  4. Dixit, M.; Arora, A.; Kaushik, S. Thermodynamic and thermoeconomic analyses of two stage hybrid absorption compression refrigeration system. Appl. Therm. Eng. 2017, 113, 120–131. [Google Scholar] [CrossRef]
  5. Chen, W.; Sun, Q.; Bai, Y.; Zhang, B. Numerical investigation of the thermal performance of compressor-assisted double-effect absorption refrigeration using [mmim]DMP/CH3OH as working fluid. Energy Convers. Manag. 2018, 166, 433–444. [Google Scholar] [CrossRef]
  6. Seyfouri, Z.; Ameri, M.; Mehrabian, M.A. A Totally Heat-Driven Refrigeration System Using Low-Temperature Heat Sources for Low-Temperature Applications. Int. J. Air Cond. Refrig. 2019, 27, 1950012. [Google Scholar] [CrossRef]
  7. Meng, X.; Zheng, D.; Wang, J.; Li, X. Energy saving mechanism analysis of the absorption–compression hybrid refrigeration cycle. Renew. Energy 2013, 57, 43–50. [Google Scholar] [CrossRef]
  8. Lounissi, D.; Bouaziz, N. Exergetic analysis of an absorption/compression refrigeration unit based on R124/DMAC mixture for solar cooling. Int. J. Hydrog. Energy 2017, 42, 8940–8947. [Google Scholar] [CrossRef]
  9. Wu, W. Novel ionic-liquid-based low-GWP working fluids used for hybrid low-temperature absorption cooling. Energy Procedia 2019, 158, 1620–1625. [Google Scholar] [CrossRef]
  10. Rostamzadeh, H.; Namin, A.S.; Ghaebi, H.; Amidpour, M. Performance assessment and optimization of a humidification dehumidification (HDH) system driven by absorption-compression heat pump cycle. Desalination 2018, 447, 84–101. [Google Scholar] [CrossRef]
  11. Liu, C.; Jiang, Y.; Han, W.; Kang, Q. A high-temperature hybrid absorption-compression heat pump for waste heat recovery. Energy Convers. Manag. 2018, 172, 391–401. [Google Scholar] [CrossRef]
  12. Schweigler, C.; Helm, M.; Eckert, T. Flexible heat pump or chiller with hybrid water/LiBr absorption/compression cycle. Int. J. Refrig. 2018. [Google Scholar] [CrossRef]
  13. Liu, X.; Ye, Z.; Bai, L.; He, M. Performance comparison of two absorption-compression hybrid refrigeration systems using R1234yf/ionic liquid as working pair. Energy Convers. Manag. 2019, 181, 319–330. [Google Scholar] [CrossRef]
  14. Morosuk, T.; Tsatsaronis, G.; Schult, M. Conventional and Advanced Exergetic Analyses: Theory and Application. Arab. J. Sci. Eng. 2013, 38, 395–404. [Google Scholar] [CrossRef]
  15. Yildiz, A.; Ersöz, M.A. Energy and exergy analyses of the diffusion absorption refrigeration system. Energy 2013, 60, 407–415. [Google Scholar] [CrossRef]
  16. Kairouani, D.L.N.B. An exergetic study of a new hybrid heat pump based on R124/DMAC mixture for solar cooling. Int. J. Exergy 2015, 17, 513–531. [Google Scholar]
  17. Wu, W.; Wang, B.; You, T.; Wang, J.; Shi, W.; Li, X. Compression-assisted absorption cycles using ammonia and various ionic liquids for cleaner heating. J. Clean. Prod. 2018, 195, 890–907. [Google Scholar] [CrossRef]
  18. Razmi, A.; Soltani, M.; Kashkooli, F.M.; Farshi, L.G. Energy and exergy analysis of an environmentally-friendly hybrid absorption/recompression refrigeration system. Energy Convers. Manag. 2018, 164, 59–69. [Google Scholar] [CrossRef]
  19. Dixit, M.; Arora, A.; Kaushik, S. Thermodynamic analysis of GAX and hybrid GAX aqua-ammonia vapor absorption refrigeration systems. Int. J. Hydrog. Energy 2015, 40, 16256–16265. [Google Scholar] [CrossRef]
  20. Yari, M.; Zarin, A.; Mahmoudi, S. Energy and exergy analyses of GAX and GAX hybrid absorption refrigeration cycles. Renew. Energy 2011, 36, 2011–2020. [Google Scholar] [CrossRef]
  21. Kholghi, S.A.; Mahmoudi, S.M.S. Energy and exergy analysis of a modified absorption cycle: A comparative study. Sustain. Energy Technol. Assess. 2019, 32, 19–28. [Google Scholar] [CrossRef]
  22. Seyfouri, Z.; Ameri, M.; Mehrabian, M.A. Exergo-economic analysis of a low-temperature geothermal-fed combined cooling and power system. Appl. Therm. Eng. 2018, 145, 528–540. [Google Scholar] [CrossRef]
  23. Bian, Y.; Pan, J.; Liu, Y.; Zhang, F.; Yang, Y.; Arima, H. Performance analysis of a combined power and refrigeration cycle. Energy Convers. Manag. 2019, 185, 259–270. [Google Scholar] [CrossRef]
  24. Mansouri, R.; Boukholda, I.; Bourouis, M.; Bellagi, A. Modelling and testing the performance of a commercial ammonia/water absorption chiller using Aspen-Plus platform. Energy 2015, 93, 2374–2383. [Google Scholar] [CrossRef]
  25. Sun, L.; Ding, X.; Yu, N.; Yu, S.M. Chemical Process Simulation Training, 2nd ed.; Chemical Industry Press: Beijing, China, 2017. [Google Scholar]
  26. Mejbri, K.; Bellagi, A. Modelling of the thermodynamic properties of the water–ammonia mixture by three different approaches. Int. J. Refrig. 2006, 29, 211–218. [Google Scholar] [CrossRef]
  27. Klein, S.A. A Model of the Steady-State Performance of an Absorption Heat Pump, US Department of Commerce; NBS National Engineering Laboratory Center for Building Technology: Washington, DC, USA, 1982. [Google Scholar]
  28. El May, S.; Boukholda, I.; Bellagi, A. Energetic and exergetic analysis of a commercial ammonia water absorption chiller. Int. J. Exergy 2011, 8, 33–50. [Google Scholar] [CrossRef]
  29. Yue, X.Y.; Li, S.H.; Xu, M.K.; Li, Y.J.; Du, K.; Yang, L. Experimental study of ternary NH3-H2O-LiBr absorption cycle combined with membrane separation technique. Sustain. Cities Soc. 2018, 40, 728–734. [Google Scholar]
  30. Fitó, J.; Coronas, A.; Mauran, S.; Mazet, N.; Stitou, D. Definition and performance simulations of a novel solar-driven hybrid absorption-thermochemical refrigeration system. Energy Convers. Manag. 2018, 175, 298–312. [Google Scholar] [CrossRef]
  31. Keith, E.H.; Radermacher, R.; Klein, S.A. Absorption Chillers, and Heat Pumps, 2nd ed.; CRC Press: Boca Raton, FL, USA, 2016. [Google Scholar]
  32. Salehi, S.; Yari, M. Exergoeconomic assessment of two novel absorption-ejection heat pumps for the purposes of supermarkets simultaneous heating and refrigeration using NaSCN/NH3, LiNO3/NH3 and H2O/NH3 as working pairs. Int. J. Refrig. 2019, 101, 178–195. [Google Scholar] [CrossRef]
  33. Jain, V.; Sachdeva, G.; Kachhwaha, S. Comparative performance study and advanced exergy analysis of novel vapor compression-absorption integrated refrigeration system. Energy Convers. Manag. 2018, 172, 81–97. [Google Scholar] [CrossRef]
  34. Razmi, A.; Soltani, M.; Aghanajafi, C.; Torabi, M. Thermodynamic and economic investigation of a novel integration of the absorption-recompression refrigeration system with compressed air energy storage (CAES). Energy Convers. Manag. 2019, 187, 262–273. [Google Scholar] [CrossRef]
  35. Elakhdar, M.; Tashtoush, B.; Nehdi, E.; Kairouani, L. Thermodynamic analysis of a novel Ejector Enhanced Vapor Compression Refrigeration (EEVCR) cycle. Energy 2018, 163, 1217–1230. [Google Scholar] [CrossRef]
Figure 1. (a) Schematic representation of the basic cycle. (b) Pressure and temperature levels of the basic cycle.
Processes 07 00609 g001
Figure 2. Aspen Plus simulation model for basic cycle.
Processes 07 00609 g002
Figure 3. Experimental data at different locations at the ambient temperature of 35 °C.
Processes 07 00609 g003
Figure 4. Data at different locations at the ambient temperature of 26 °C.
Processes 07 00609 g004
Figure 5. Schematic representation of hybrid cycles.
Processes 07 00609 g005
Figure 6. COP of the basic cycle versus TGEN at different TCOND.
Processes 07 00609 g006
Figure 7. Exergetic efficiency of the basic cycle versus TGEN at different TCOND.
Processes 07 00609 g007
Figure 8. f of the basic cycle versus TGEN at different TCOND.
Processes 07 00609 g008
Figure 9. Irreversibility φ of main components versus TGEN at TCOND = 54°C.
Processes 07 00609 g009
Figure 10. COP versus TGEN for configuration 1 at different intermediate pressures.
Processes 07 00609 g010
Figure 11. COP versus TGEN for configuration 2 at different intermediate pressures.
Processes 07 00609 g011
Figure 12. COP versus π at different TGEN for both hybrid cycles.
Processes 07 00609 g012
Figure 13. η versus TGEN for configuration 1 at different intermediate pressures.
Processes 07 00609 g013
Figure 14. η versus TGEN for configuration 2 at different intermediate pressures.
Processes 07 00609 g014
Figure 15. η versus π at different TGEN for both hybrid cycles.
Processes 07 00609 g015
Figure 16. Circulation ratio f versus π at TGEN = 100 °C.
Processes 07 00609 g016
Figure 17. Total exergy destruction versus π at TGEN = 100 °C.
Processes 07 00609 g017
Figure 18. η of ABS, SCA, GEN, and COMP versus π at TGEN = 100 °C.
Processes 07 00609 g018
Figure 19. Exergy destruction of ABS, SCA, GEN, and COMP versus π at TGEN = 100 °C.
Processes 07 00609 g019
Figure 20. COP and η of configuration 1 versus π at different TCOND.
Processes 07 00609 g020
Figure 21. COP and η of configuration 2 versus π at different TCOND.
Processes 07 00609 g021
Table 1. Design conditions used in simulation design.
ParametersValuesUnits
Inlet temperature of chilled water20°C
Chilled water flow rate35kmol/h
Inlet air temperature35°C
Inlet air flow rate70–150kmol/h
Condensation pressure22.4bar
Evaporation pressure4.94bar
Strong solution flow rate5.165kmol/h
Ammonia mole fraction in strong solution0.458
Distillate mole flow rate of vapor mixture2.091kmol/h
Table 2. Components and their corresponding modules with input data.
ComponentsAspen Modules Input Data
Evaporator
(EVAP)
Two-stream countercurrent heat exchanger HeatXPinch temperature difference:
Hot inlet-cold outlet difference: 10.5 °C
Solution heat exchanger
(SHX)
Two-stream countercurrent heat exchanger HeatXPinch temperature difference:
Hot inlet-cold outlet difference: 22.5 °C
Condenser
(COND)
Two-stream countercurrent heat exchanger HeatXPinch temperature difference:
Hot outlet-cold inlet difference: 13.5 °C
Absorber
(ABS)
Two-stream countercurrent heat exchanger HeatXPinch temperature difference:
Hot outlet-cold inlet difference: 10 °C
Expansion valve 1/2
(DET1/2)
ValveOutlet pressure: 4.936 bar
Solution cooling absorber
(SCA1/2 and MIX)
Two heater modules and mixer Pressure drop: 0 bar
Exit temperature based on calculator block of εliq
Pressure drop: 0 bar
Generator
(GEN)
Rigorous distillation tower module RadFracNumber of stages: 5; feed stage: 3;
distillate total mole flow rate: 2.091 kmol/h
Reflux mass ratio: 0.09
HeaterPressure drop: 0 bar
Exit temperature equal to stage 2 in RadFrac
Rectifier
(RECT)
HeaterPressure drop: 0 bar
Duty comes from condensation load of RadFrac
PumpPumpDischarge pressure: 22.4 bar
Isentropic efficiency: 100%
Virtual component separator
(SEP)-only used in analysis
Component separator SEPSplit fraction of ammonia: 0.999
Table 3. Calculated state points corresponding to specific streams.
StatesTemperature (°C)Pressure (bar) x N H 3 q ˙ n   ( kmol / h ) h (kJ/mol)s (kJ/mol·K)Ex (kW)
1454.9360.4585.165−187.88−0.17150.536
245.822.40.4585.165−187.77−0.17120.604
369.922.40.4583.074−186.24−0.16670.829
49822.40.4585.165−184.37−0.16151.271
6103.622.40.9762.091−486.85−0.11574.395
748.522.40.9762.091−705.19−0.18093.006
825.522.40.9762.091−724.74−0.18722.962
94.84.9360.9762.091−724.74−0.18682.893
109.54.9360.9762.091−554.65−0.12582.21
1117.64.9360.9762.091−535.1−0.11902.161
1286.44.9360.4585.165−176.92−0.13902.373
13122.74.9360.1063.074−257.73−0.14650.911
14124.122.40.1063.074−257.73−0.14660.938
12A93.84.9360.4585.165−175.06−0.13392.855
16187.722.40.1063.074−252.22−0.13382.372
Table 4. Comparison of heat duties and coefficient of performance (COP) between experimental and simulation results at the ambient temperature of 35 °C.
ParametersExperimental DataSimulated Data
Q ˙ E V A P (kW)9.649.84
Q ˙ G E N (kW)1718.25
Q ˙ A B S   ( kW ) -15.46
Q ˙ COND (kW)-12.7
W ˙ P U M P (kW)-0.07
COP0.5670.537
Table 5. Calculated exergetic information of each component at nominal design conditions.
ComponentsExergy Destruction (kW)Irreversibility (%)Exergetic Efficiency
GEN2.0153.130.82
EVAP0.0792.080.948
COND0.1143.0250.974
ABS0.82921.90.645
SCA0.66517.590.981
RECT0.0691.840.923
SHX0.0160.430.99
E x D , T = 3.785 φ T = 100% η = 9.15%

