A Potential Inhibition Process of Ricin Protein with the flavonoids Quercetin and Epigallocatechin Gallate. A Quantum-Chemical and Molecular Docking Study

 , and
, and 
Abstract
:
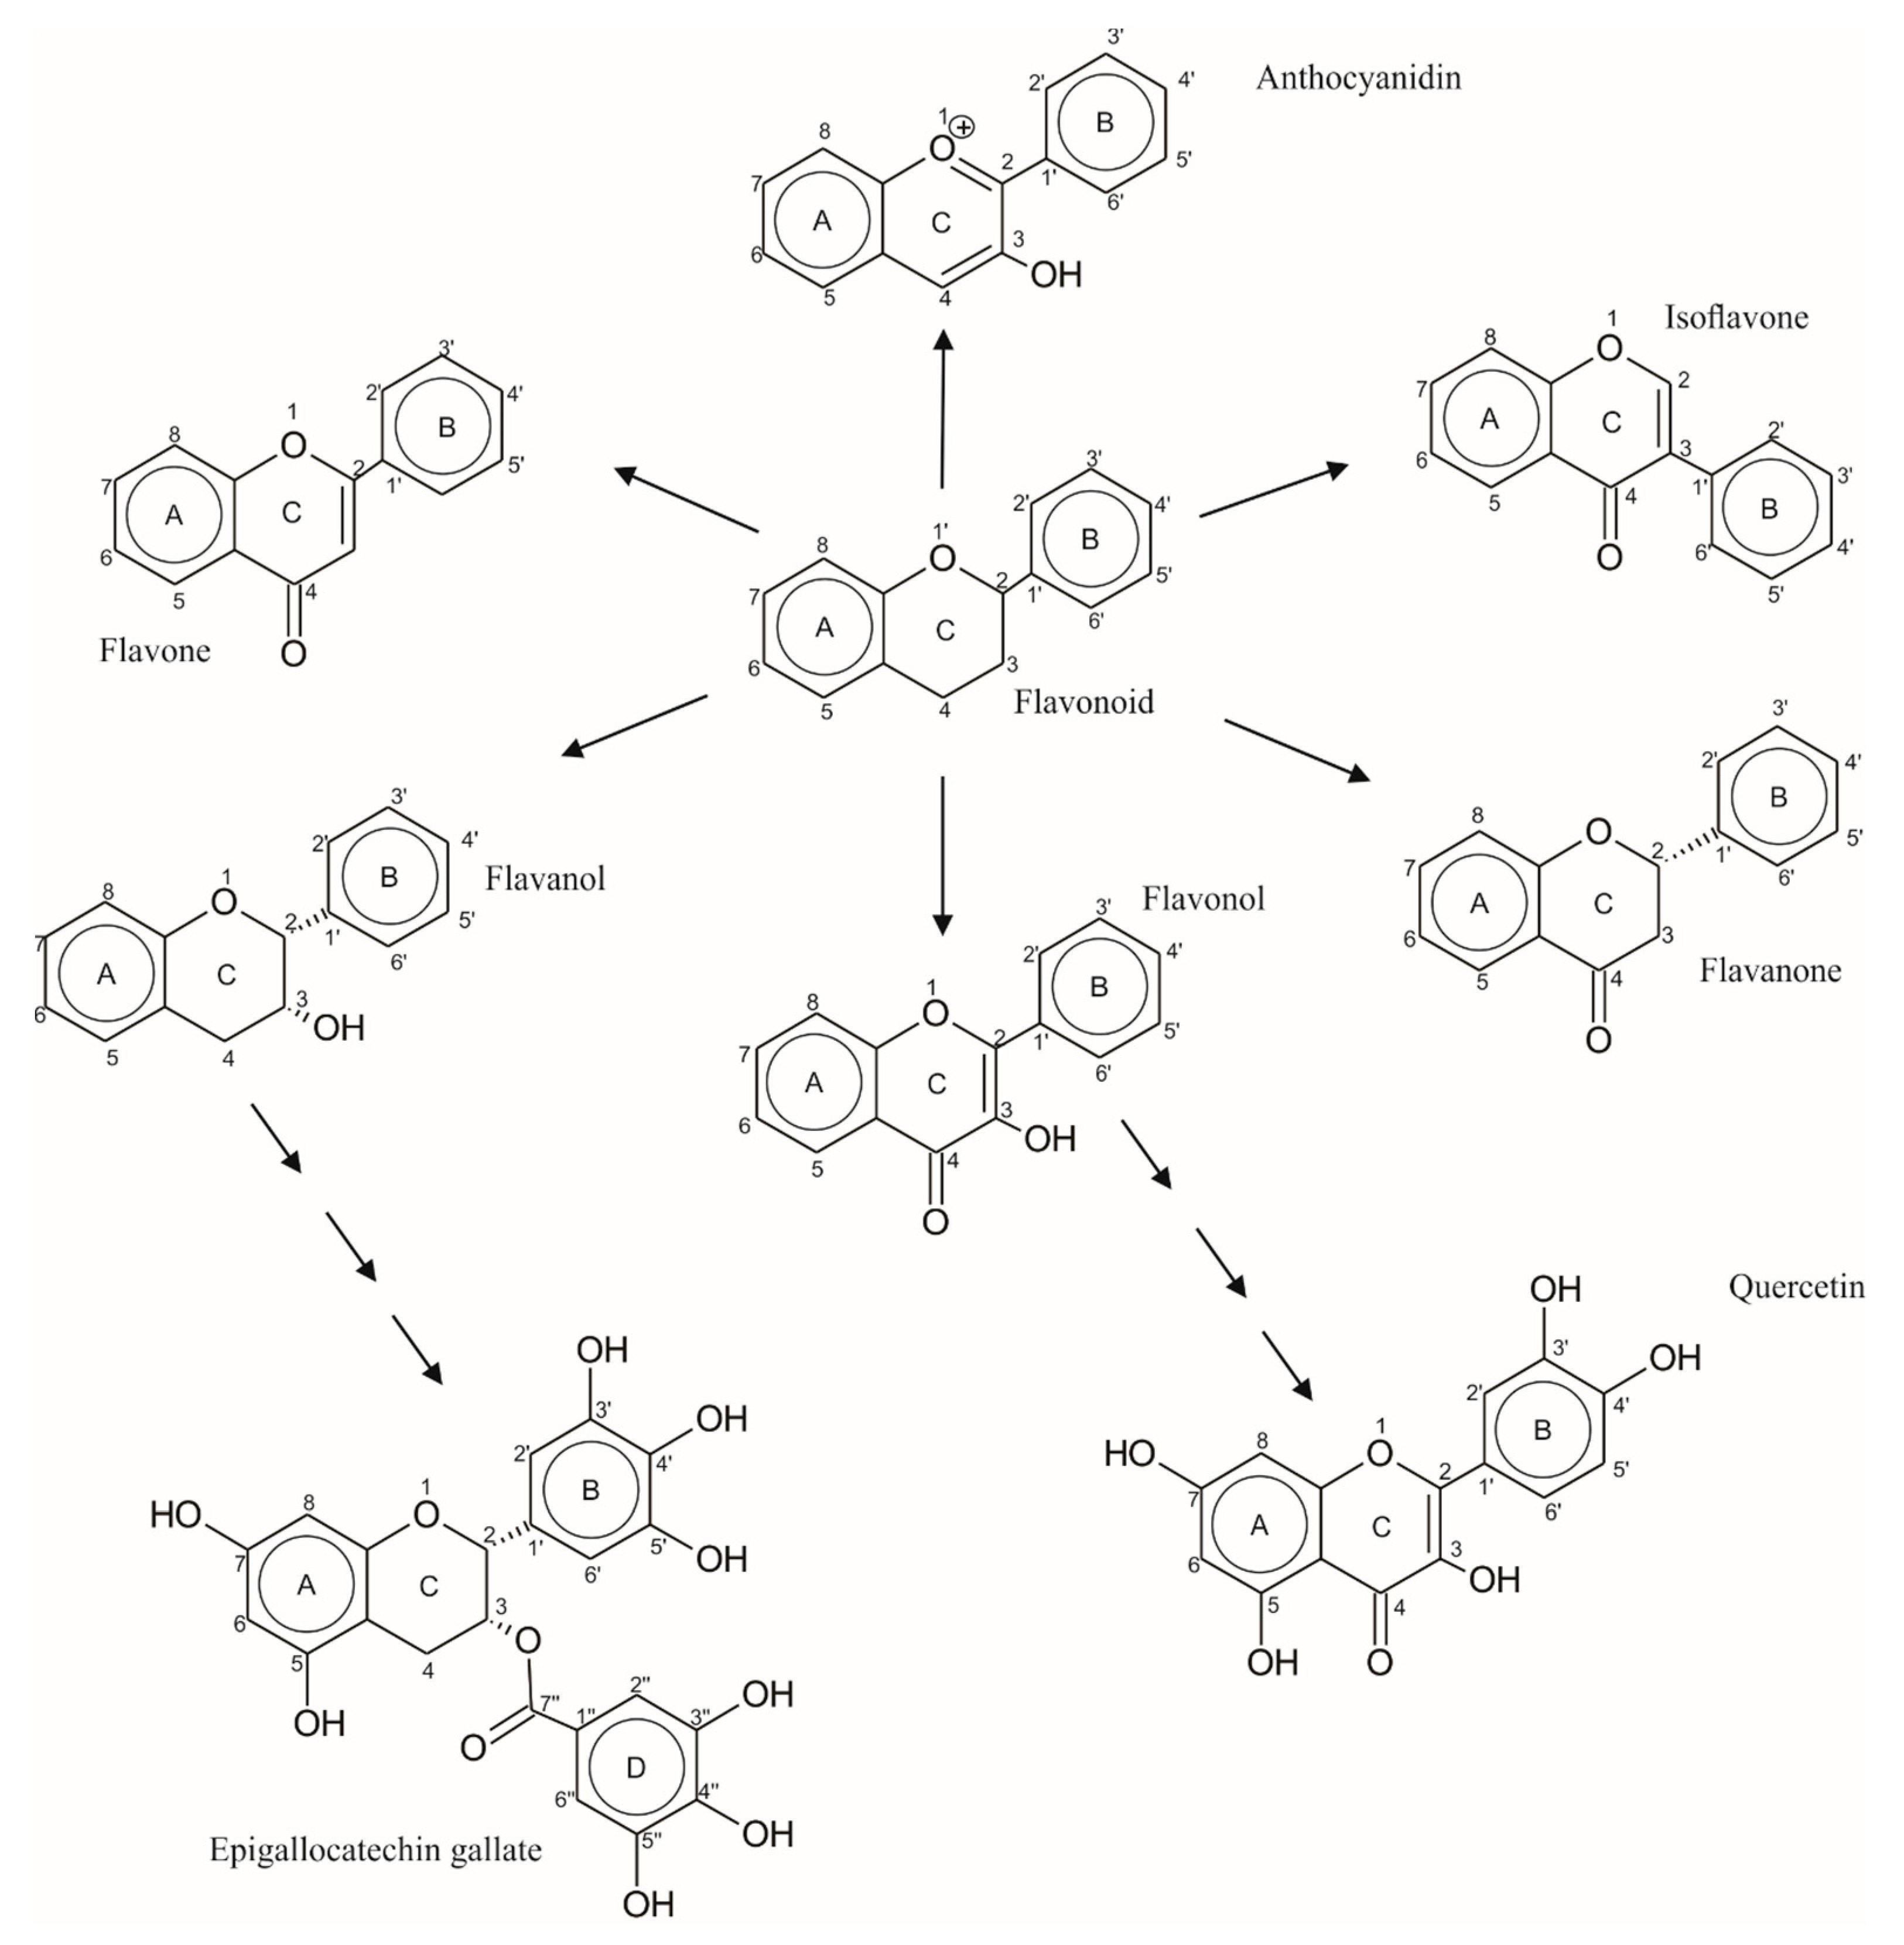
1. Introduction
2. Computational Details
2.1. Quantum-Chemical Calculations
2.2. Preparation of Protein for Molecular Docking Calculations
2.3. Molecular Docking Calculations
3. Results and Discussion
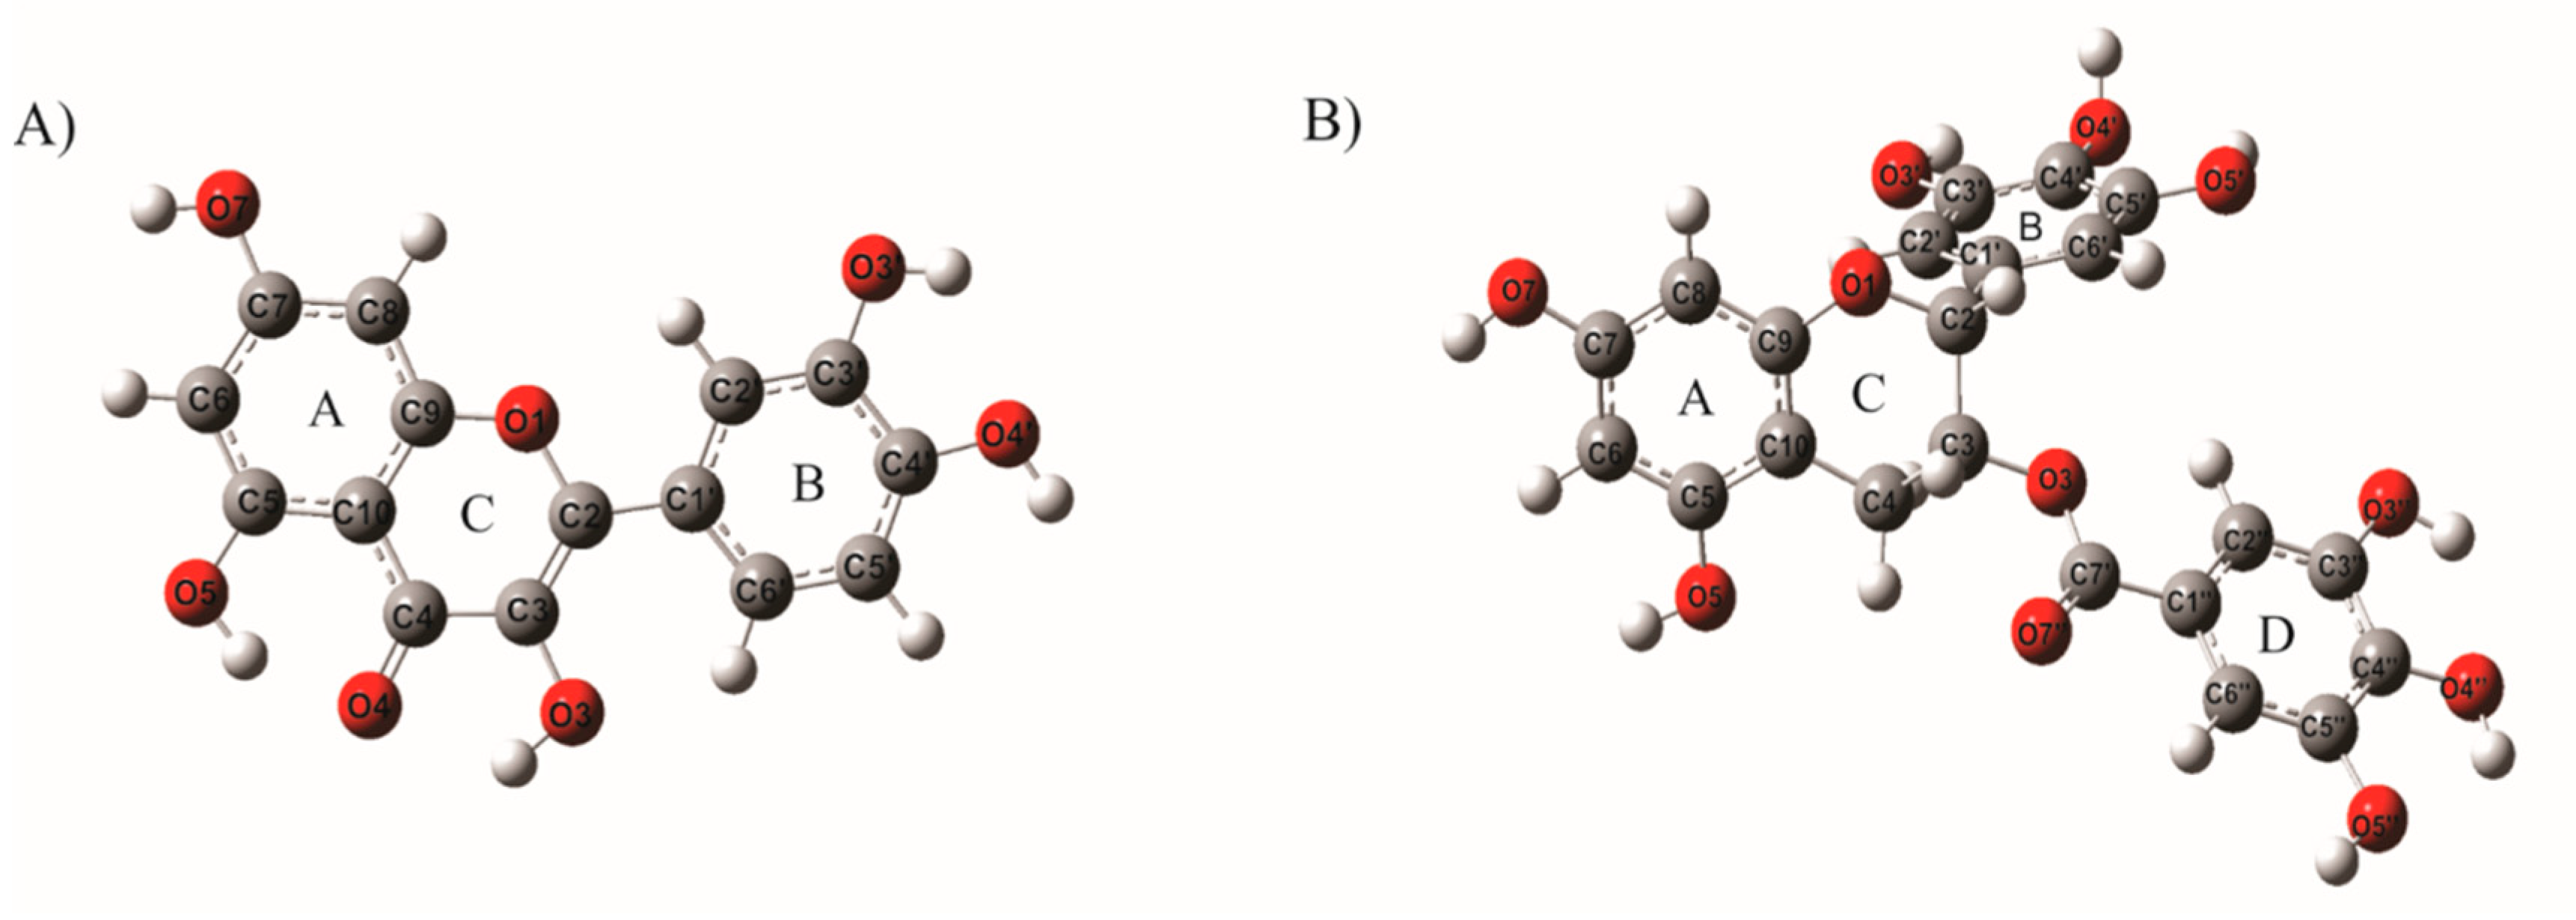
3.1. Quantum-Chemical Calculations
3.2. Global Chemical Reactivity
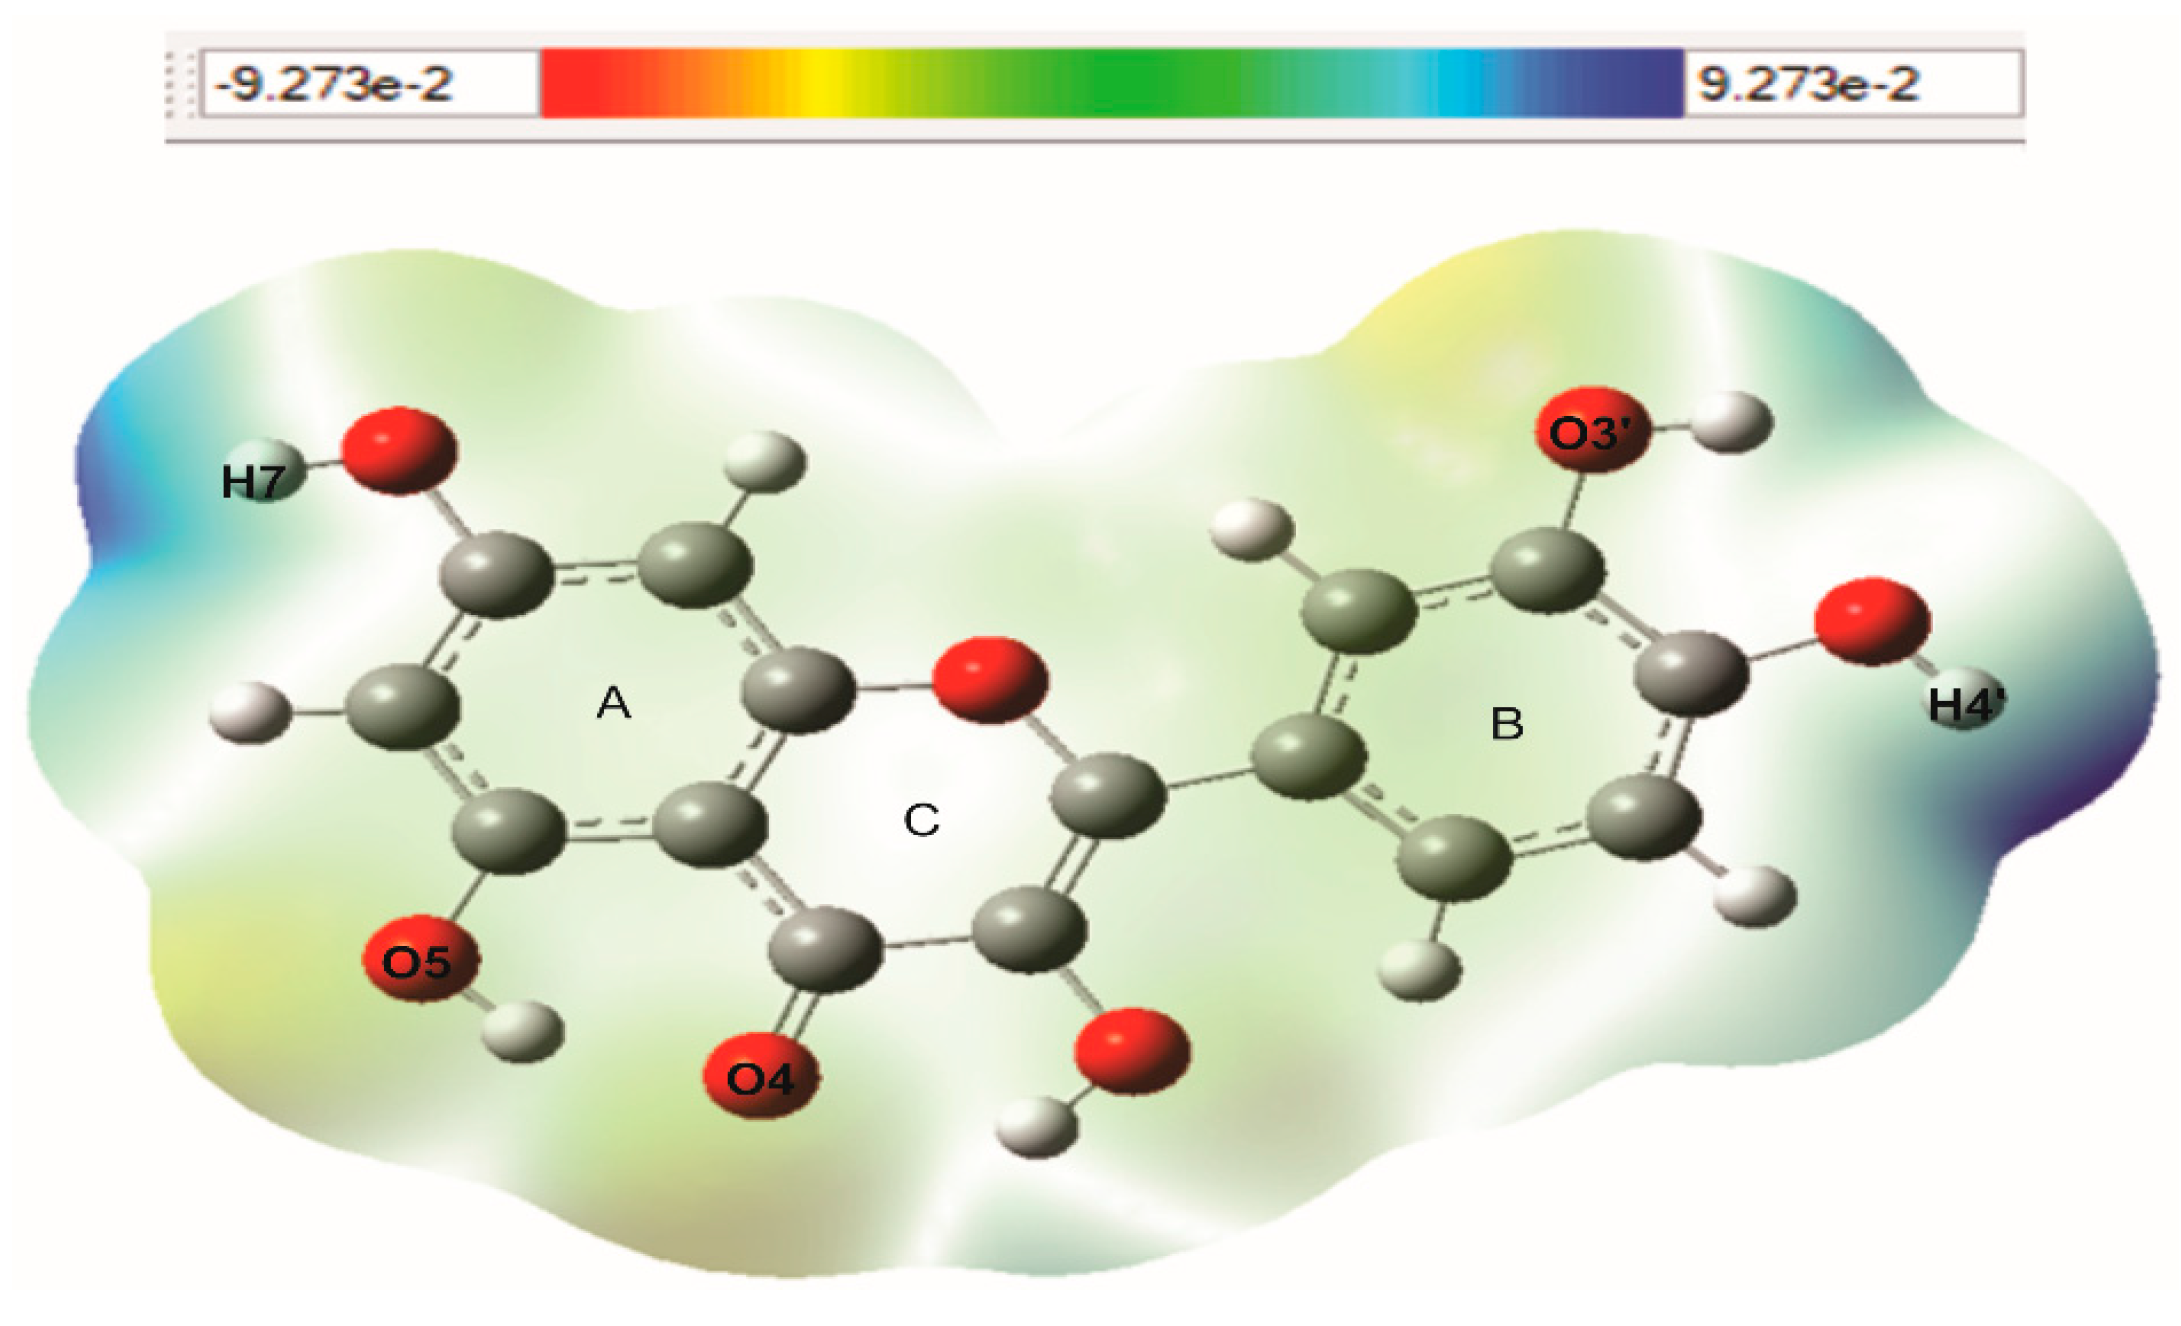
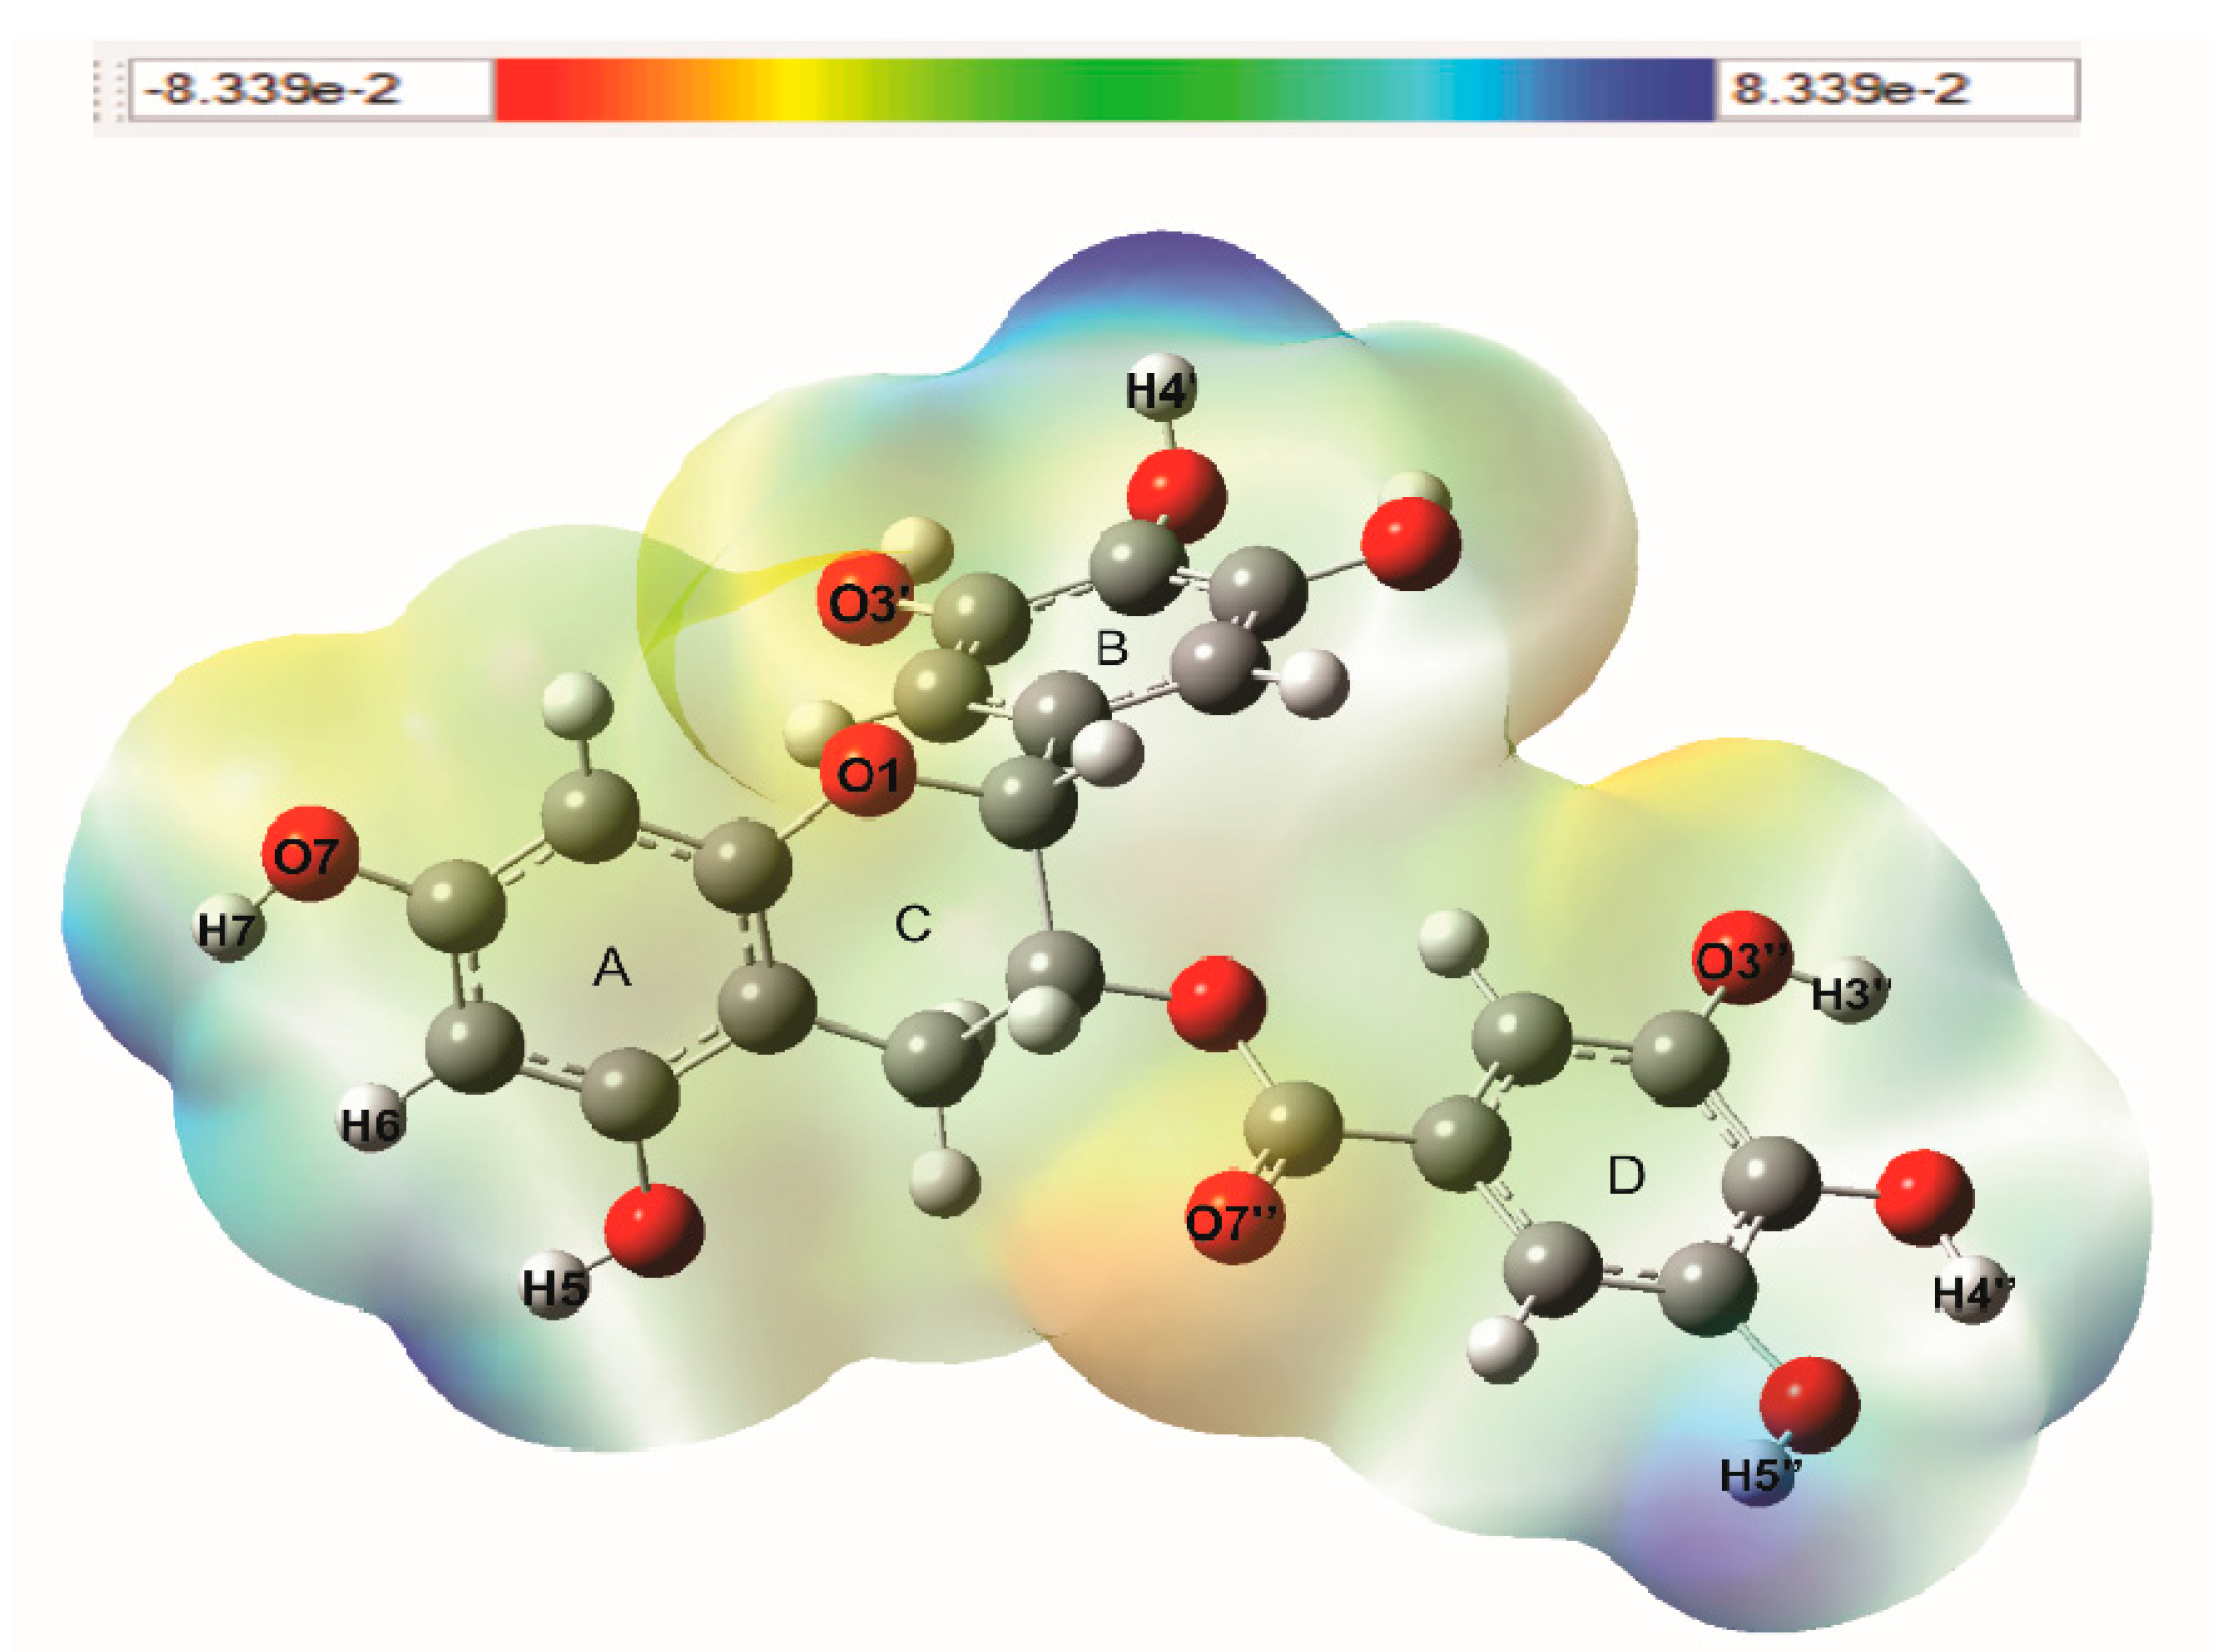
3.3. Molecular Electrostatic Potential (MEP)
3.4. Electronic Density of the Frontier Molecular Orbitals (HOMO and LUMO)
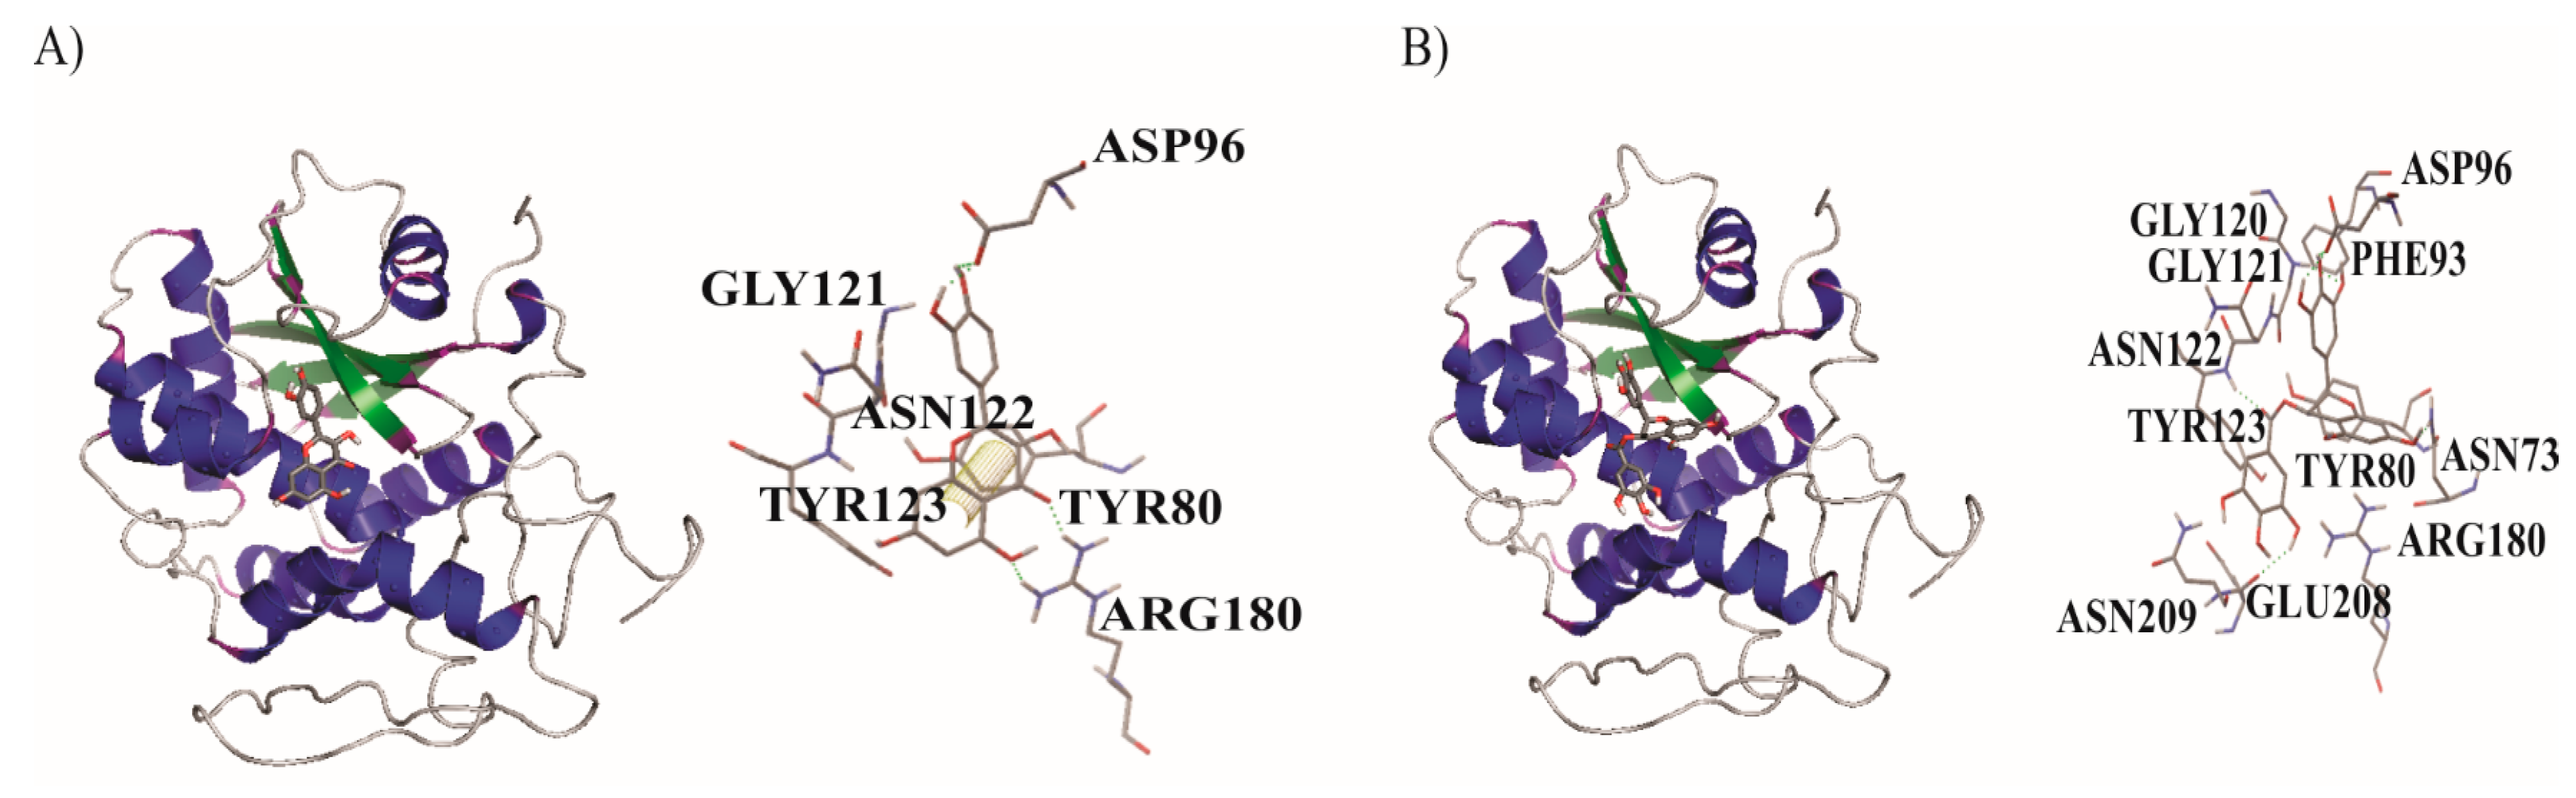
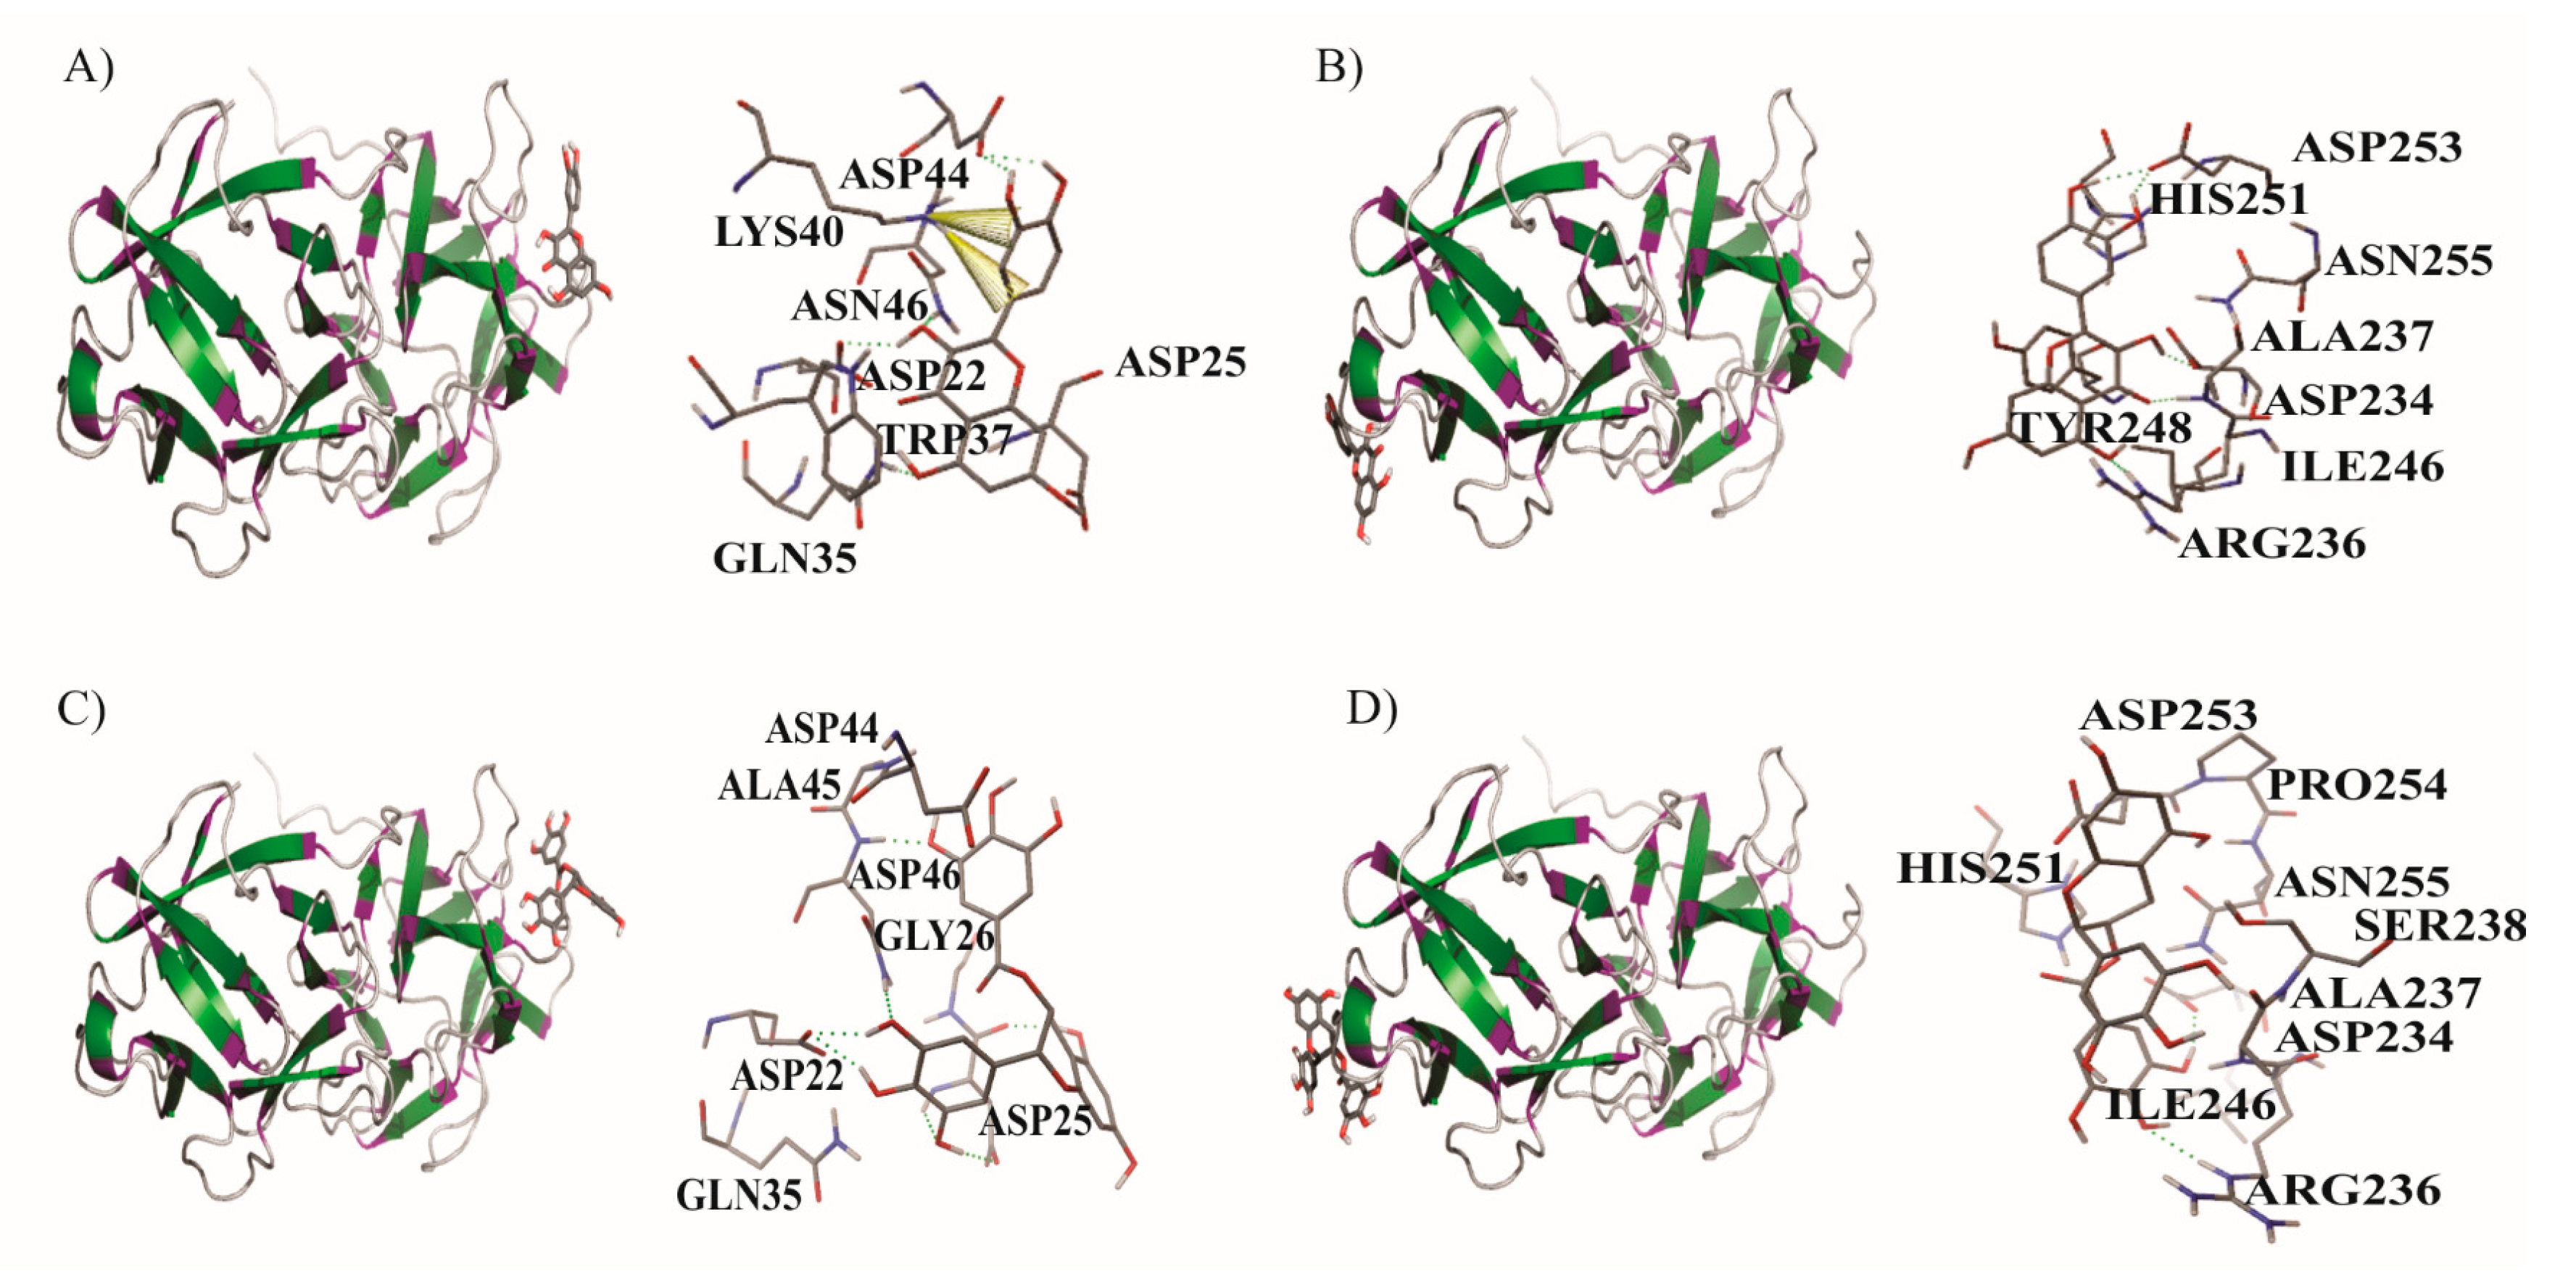
3.5. Docking Analysis
3.6. Adjustment and Alignment after Interaction
3.7. Fractional Number of Transferred Electrons (ΔN)
4. Conclusions
Author Contributions
Funding
Acknowledgments
Conflicts of Interest
References
- Voisin, G.; Jansen, F.; Gros, P. Cytotoxic Products Formed by Covalent Bonding of the A Chain of Ricin with an Antibody and the Process for Their Preparation and Use. U.S. Patent 4,340,535, 20 July 1982. [Google Scholar]
- Bozza, W.P.; Tolleson, W.H.; Rivera Rosado, L.A.; Zhang, B. Ricin detection: Tracking active toxin. Biotechnol. Adv. 2015, 33, 117–123. [Google Scholar] [CrossRef] [Green Version]
- Polito, L.; Bortolotti, M.; Battelli, M.G.; Calafato, G.; Bolognesi, A. Ricin: An ancient story for a timeless plant toxin. Toxins 2019, 11, 324. [Google Scholar] [CrossRef] [Green Version]
- Olsnes, S.; Kozlov, J.V. Ricin. Toxicon 2001, 39, 1723–1728. [Google Scholar] [CrossRef]
- Iglesias, R.; Citores, L.; Ferreras, J. Ribosomal RNA N-glycosylase activity assay of ribosome-inactivating proteins. Bio-Protocol 2017, 7, e2180. [Google Scholar] [CrossRef]
- Silitonga, A.S.; Masjuki, H.H.; Ong, H.C.; Yusaf, T.; Kusumo, F.; Mahlia, T.M.I. Synthesis and optimization of Hevea brasiliensis and Ricinus communis as feedstock for biodiesel production: A comparative study. Ind. Crops Prod. 2016, 85, 274–286. [Google Scholar] [CrossRef]
- Akande, T.O.; Odunsi, A.A.; Akinfala, E.O. A review of nutritional and toxicological implications of castor bean (Ricinus communis L.) meal in animal feeding systems. J. Anim. Physiol. Anim. Nutr. 2016, 100, 201–210. [Google Scholar] [CrossRef] [PubMed]
- Sousa, N.L.; Cabral, G.B.; Vieira, P.M.; Baldoni, A.B.; Aragão, F.J.L. Bio-detoxification of ricin in castor bean (Ricinus communis L.) seeds. Sci. Rep. 2017, 7, 15385. [Google Scholar] [CrossRef] [PubMed] [Green Version]
- Adedapo, A.M.; Babalola, T.O. Effect of Autoclaved Castor Seed Meal on Growth Performance, Body Composition and Haematology of Clarias Gariepinus Fingelings; Federal University Oye-Ekiti: Oye-Ekiti, Nigeria, 2017. [Google Scholar]
- Ashraf Ashfaq, M.; Soma Sekhar Reddy, P.; Anil Kumar, C.; Selvaraj, V.M.; Dinesh Kumar, V. Ricin and RCA—The enemies within castor (Ricinus communis L.): A perspective on their biogenesis, mechanism of action, detection methods and detoxification strategies. In The Castor Bean Genome; Springer: Cham, Switzerland, 2018; pp. 215–235. ISBN 9783319972800. [Google Scholar]
- Dyer, P.D.R.; Kotha, A.K.; Gollings, A.S.; Shorter, S.A.; Shepherd, T.R.; Pettit, M.W.; Alexander, B.D.; Getti, G.T.M.; El-Daher, S.; Baillie, L.; et al. An in vitro evaluation of epigallocatechin gallate (eGCG) as a biocompatible inhibitor of ricin toxin. Biochim. Biophys. Acta Gen. Subj. 2016, 1860, 1541–1550. [Google Scholar] [CrossRef] [PubMed] [Green Version]
- Bravo, L. Polyphenols: Chemistry, dietary sources, metabolism, and nutritional significance. Nutr. Rev. 2009, 56, 317–333. [Google Scholar] [CrossRef]
- Guo, W.; Kong, E.; Meydani, M. Dietary polyphenols, inflammation, and cancer. Nutr. Cancer 2009, 61, 807–810. [Google Scholar] [CrossRef]
- Wang, B.; Guo, C.; Zhang, M.; Park, B.; Xu, B. High-resolution single-molecule recognition imaging of the molecular details of Ricin–aptamer interaction. J. Phys. Chem. B 2012, 116, 5316–5322. [Google Scholar] [CrossRef] [PubMed]
- Rice-evans, C.A.; Miller, N.J.; Bolwell, P.G.; Bramley, P.M.; Pridham, J.B. The relative antioxidant activities of plant-derived polyphenolic flavonoids. Free Radic. Res. 1995, 22, 375–383. [Google Scholar] [CrossRef] [PubMed]
- Okawa, M.; Kinjo, J.; Nohara, T.; Ono, M. DPPH (1,1-Diphenyl-2-Picrylhydrazyl) radical scavenging activity of Flavonoids obtained from some medicinal plants. Biol. Pharm. Bull. 2001, 24, 1202–1205. [Google Scholar] [CrossRef] [PubMed] [Green Version]
- Han, X.; Shen, T.; Lou, H. Dietary polyphenols and their biological significance. Int. J. Mol. Sci. 2007, 8, 950–988. [Google Scholar] [CrossRef] [Green Version]
- Lesjak, M.; Beara, I.; Simin, N.; Pintać, D.; Majkić, T.; Bekvalac, K.; Orčić, D.; Mimica-Dukić, N. Antioxidant and anti-inflammatory activities of quercetin and its derivatives. J. Funct. Foods 2018, 40, 68–75. [Google Scholar] [CrossRef]
- Higdon, J.V.; Frei, B. Tea catechins and polyphenols: Health effects, metabolism, and antioxidant functions. Crit. Rev. Food Sci. Nutr. 2003, 43, 89–143. [Google Scholar] [CrossRef]
- De la Torre-Robles, A.; Rivas, A.; Lorenzo-Tovar, M.L.; Monteagudo, C.; Mariscal-Arcas, M.; Olea-Serrano, F. Estimation of the intake of phenol compounds from virgin olive oil of a population from southern Spain. Food Addit. Contam. Part A 2014, 31, 1460–1469. [Google Scholar] [CrossRef]
- Legeay, S.; Rodier, M.; Fillon, L.; Faure, S.; Clere, N. Epigallocatechin gallate: A review of its beneficial properties to prevent metabolic syndrome. Nutrients 2015, 7, 5443–5468. [Google Scholar] [CrossRef] [Green Version]
- Kim, D.-O.; Lee, C.Y. Comprehensive study on vitamin C equivalent antioxidant capacity (VCEAC) of various polyphenolics in scavenging a free radical and its structural relationship. Crit. Rev. Food Sci. Nutr. 2004, 44, 253–273. [Google Scholar] [CrossRef]
- Lopez del Amo, J.M.; Fink, U.; Dasari, M.; Grelle, G.; Wanker, E.E.; Bieschke, J.; Reif, B. Structural properties of EGCG-induced, nontoxic Alzheimer’s disease Aβ oligomers. J. Mol. Biol. 2012, 421, 517–524. [Google Scholar] [CrossRef]
- Soobrattee, M.A.; Neergheen, V.S.; Luximon-Ramma, A.; Aruoma, O.I.; Bahorun, T. Phenolics as potential antioxidant therapeutic agents: Mechanism and actions. Mutat. Res. Mol. Mech. Mutagen. 2005, 579, 200–213. [Google Scholar] [CrossRef] [PubMed]
- Seeram, N.P.; Nair, M.G. Inhibition of lipid peroxidation and structure−activity-related studies of the dietary constituents anthocyanins, anthocyanidins, and catechins. J. Agric. Food Chem. 2002, 50, 5308–5312. [Google Scholar] [CrossRef] [PubMed]
- Ferry, D.R.; Smith, A.; Malkhandi, J.; Fyfe, D.W.; DeTakats, P.G.; Anderson, D.; Baker, J.; Kerr, D.J. Phase I clinical trial of the flavonoid quercetin: Pharmacokinetics and evidence for in vivo tyrosine kinase inhibition. Clin. Cancer Res. 1996, 2, 659–668. [Google Scholar] [PubMed]
- Sengupta, B.; Sengupta, P.K. The interaction of quercetin with human serum albumin: A fluorescence spectroscopic study. Biochem. Biophys. Res. Commun. 2002, 299, 400–403. [Google Scholar] [CrossRef]
- Gutzeit, H.O.; Henker, Y.; Kind, B.; Franz, A. Specific interactions of quercetin and other flavonoids with target proteins are revealed by elicited fluorescence. Biochem. Biophys. Res. Commun. 2004, 318, 490–495. [Google Scholar] [CrossRef]
- Dahiya, R.; Mohammad, T.; Roy, S.; Anwar, S.; Gupta, P.; Haque, A.; Khan, P.; Kazim, S.N.; Islam, A.; Ahmad, F.; et al. Investigation of inhibitory potential of quercetin to the pyruvate dehydrogenase kinase 3: Towards implications in anticancer therapy. Int. J. Biol. Macromol. 2019, 136, 1076–1085. [Google Scholar] [CrossRef]
- Avakyan, V.G.; Nazarov, V.B.; Alfimov, M.V.; Bagatur, A.A.; Voronezheva, N.I. The role of intra-and intermolecular hydrogen bonds in the formation of β-cyclodextrin head-to-head and head-to-tail dimers. The results of ab initio and semiempirical quantum-chemical calculations. Russ. Chem. Bull. 2001, 50, 206–216. [Google Scholar] [CrossRef]
- Pithayanukul, P.; Ruenraroengsak, P.; Bavovada, R.; Pakmanee, N.; Suttisri, R.; Saen-oon, S. Inhibition of Naja kaouthia venom activities by plant polyphenols. J. Ethnopharmacol. 2005, 97, 527–533. [Google Scholar] [CrossRef]
- Parr, R.G.; Szentpály, L.V.; Liu, S. Electrophilicity index. J. Am. Chem. Soc. 1999, 121, 1922–1924. [Google Scholar] [CrossRef]
- Landeros-Martínez, L.L.; Chavez-Flores, D.; Orrantia-Borunda, E.; Flores-Holguin, N. Construction of a nanodiamond-tamoxifen complex as a breast cancer drug delivery vehicle. J. Nanomater. 2016. [Google Scholar] [CrossRef] [Green Version]
- Landeros-Martínez, L.L.; Glossman-Mitnik, D.; Orrantia-Borunda, E.; Flores-Holguín, N. Theoretical calculation of UV-Vis, IR spectra and reactivity properties of tamoxifen drug: A methodology comparison. MOJ Bioorganic Org. Chem. 2017, 1, 87–95. [Google Scholar] [CrossRef] [Green Version]
- García-Montoya, I.A.; Flores-Holguín, N.R.; Landeros-Martínez, L.-L.; Alvarado-González, M.; Rascón-Cruz, Q.; Fuentes-Montero, M.E.; Palomares-Báez, P.; Rodríguez-Valdez, L.M. Analysis of the molecular interactions between cytochromes P450 3A4 and 1A2 and aflatoxins: A docking study. Appl. Sci. 2019, 9, 2467. [Google Scholar] [CrossRef] [Green Version]
- Tirado-Rives, J.; Jorgensen, W.L. Performance of B3LYP density functional methods for a large set of organic molecules. J. Chem. Theory Comput. 2008, 4, 297–306. [Google Scholar] [CrossRef] [PubMed]
- Winter, N.O.C.; Graf, N.K.; Leutwyler, S.; Hättig, C. Benchmarks for 0-0 transitions of aromatic organic molecules: DFT/B3LYP, ADC(2), CC2, SOS-CC2 and SCS-CC2 compared to high-resolution gas-phase data. Phys. Chem. Chem. Phys. 2013, 15, 6623–6630. [Google Scholar] [CrossRef]
- Aparicio, S. A systematic computational study on flavonoids. Int. J. Mol. Sci. 2010, 11, 2017–2038. [Google Scholar] [CrossRef] [PubMed] [Green Version]
- Zhou, H.; Li, X.; Shang, Y.; Chen, K. Radical scavenging activity of puerarin: A theoretical study. Antioxidants 2019, 8, 590. [Google Scholar] [CrossRef] [Green Version]
- Vieth, M.; Hirst, J.D.; Brooks, C.L. Do active site conformations of small ligands correspond to low free-energy solution structures? J. Comput. Aided. Mol. Des. 1998, 12, 563–572. [Google Scholar] [CrossRef]
- Perola, E.; Charifson, P.S. Conformational analysis of drug-like molecules bound to proteins: An extensive study of ligand reorganization upon binding. J. Med. Chem. 2004, 47, 2499–2510. [Google Scholar] [CrossRef]
- Hao, M.H.; Haq, O.; Muegge, I. Torsion angle preference and energetics of small-molecule ligands bound to proteins. J. Chem. Inf. Model. 2007, 47, 2242–2252. [Google Scholar] [CrossRef]
- Seo, M.H.; Park, J.; Kim, E.; Hohng, S.; Kim, H.S. Protein conformational dynamics dictate the binding affinity for a ligand. Nat. Commun. 2014, 5, 1–7. [Google Scholar] [CrossRef] [Green Version]
- Greives, N.; Zhou, H.X. Both protein dynamics and ligand concentration can shift the binding mechanism between conformational selection and induced fit. Proc. Natl. Acad. Sci. USA 2014, 111, 10197–10202. [Google Scholar] [CrossRef] [PubMed] [Green Version]
- Kitchen, D.B.; Decornez, H.; Furr, J.R.; Bajorath, J. Docking and scoring in virtual screening for drug discovery: Methods and applications. Nat. Rev. Drug Discov. 2004, 3, 935–949. [Google Scholar] [CrossRef] [PubMed]
- Becke, A.D. Density-functional thermochemistry. IV. A new dynamical correlation functional and implications for exact-exchange mixing. J. Chem. Phys. 1996, 104, 1040–1046. [Google Scholar] [CrossRef]
- Becke, A.D.; Johnson, E.R. A density-functional model of the dispersion interaction. J. Chem. Phys. 2005, 123, 154101. [Google Scholar] [CrossRef]
- Stephens, P.J.; Devlin, F.J.; Chabalowski, C.F.; Frisch, M.J. Ab initio calculation of vibrational absorption and circular dichroism spectra using density functional force fields. J. Phys. Chem. 1994, 98, 11623–11627. [Google Scholar] [CrossRef]
- Perdew, J.P.; Burke, K.; Ernzerhof, M. Generalized gradient approximation made simple. Phys. Rev. Lett. 1996, 77, 3865–3868. [Google Scholar] [CrossRef] [Green Version]
- Zhao, Y.; Truhlar, D.G. The M06 suite of density functionals for main group thermochemistry, thermochemical kinetics, noncovalent interactions, excited states, and transition elements: Two new functionals and systematic testing of four M06-class functionals and 12 other function. Theor. Chem. Acc. 2008, 120, 215–241. [Google Scholar] [CrossRef] [Green Version]
- Ghalami-Choobar, B.; Ghiami-Shomami, A. Theoretical calculation of pKa values of the Nortryptiline and Amitryptiline drugs in aqueous and non-aqueous solvents. Comput. Theor. Chem. 2013, 1018, 66–70. [Google Scholar] [CrossRef]
- Amovilli, C.; Barone, V.; Cammi, R.; Cancès, E.; Cossi, M.; Mennucci, B.; Pomelli, C.S.; Tomasi, J. Recent Advances in the Description of Solvent Effects with the Polarizable Continuum Model. In Advances in Quantum Chemistry; Academic Press Inc.: Cambridge, MA, USA, 1998; Volume 32, pp. 227–261. [Google Scholar]
- Mennucci, B.; Cancès, E.; Tomasi, J. Evaluation of solvent effects in isotropic and anisotropic dielectrics and in ionic solutions with a unified integral equation method: Theoretical bases, computational implementation, and numerical applications. J. Phys. Chem. B 1997, 101, 10506–10517. [Google Scholar] [CrossRef]
- Frisch, M.; Trucks, G.W.; Schlegel, H.B.; Scuseria, G.E.; Robb, M.A.; Cheeseman, J.R.; Scalmani, G.; Barone, V.; Mennucci, B.; Petersson, G. Gaussian 09, Revision d. 01; Gaussian, Inc.: Wallingford, CT, USA, 2009. [Google Scholar]
- Delano, W.L. PyMOL Molecular Graphics System; Delano Scientific, L.L.C.: San Carlos, CA, USA, 2002. [Google Scholar]
- Morris, G.M.; Huey, R.; Lindstrom, W.; Sanner, M.F.; Belew, R.K.; Goodsell, D.S.; Olson, A.J. AutoDock4 and AutoDockTools4: Automated docking with selective receptor flexibility. J. Comput. Chem. 2009, 30, 2785–2791. [Google Scholar] [CrossRef] [Green Version]
- Spek, A.L.; Kojić-Prodić, B.; Labadie, R.P. Structure of (−)-epicatechin: (2R,3R)-2-(3,4-dihydroxyphenyl)-3,4-dihydro-2H-1-benzopyran-3,5,7-triol, C15H14O6. Acta Crystallogr. Sect. C Cryst. Struct. Commun. 1984, 40, 2068–2071. [Google Scholar] [CrossRef]
- Jin, G.Z.; Yamagata, Y.; Tomita, K. Structure of quercetin dihydrate. Acta Crystallogr. Sect. C Cryst. Struct. Commun. 1990, 46, 310–313. [Google Scholar] [CrossRef] [Green Version]
- Monzingo, A.F.; Robertus, J.D. X-ray analysis of substrate analogs in the ricin A-chain active site. J. Mol. Biol. 1992, 227, 1136–1145. [Google Scholar] [CrossRef]
- Katzin, B.J.; Collins, E.J.; Robertus, J.D. Structure of ricin A-chain at 2.5 Å. Proteins Struct. Funct. Genet. 1991, 10, 251–259. [Google Scholar] [CrossRef]
- Rutenber, E.; Robertus, J.D. Structure of ricin B-chain at 2.5 Å resolution. Proteins Struct. Funct. Genet. 1991, 10, 260–269. [Google Scholar] [CrossRef]
- Sahihi, M.; Heidari-Koholi, Z.; Bordbar, A.-K. The interaction of polyphenol flavonoids with β-lactoglobulin: molecular docking and molecular dynamics simulation studies. J. Macromol. Sci. Part. B 2012, 51, 2311–2323. [Google Scholar] [CrossRef]
- Parr, R.G.; Pearson, R.G. Absolute hardness: Companion parameter to absolute electronegativity. J. Am. Chem. Soc. 1983, 105, 7512–7516. [Google Scholar] [CrossRef]


| Model | Bond Distance (Å) | DFT Functional/6-31G (d,p) | Exp (a,b) | Angles (°) | DFT Functional/6-31G (d,p) | Exp (a,b) | ||||||
|---|---|---|---|---|---|---|---|---|---|---|---|---|
| B3LYP | PBE1PBE | M06 | M06-2X | B3LYP | PBE1PBE | M06 | M06-2X | |||||
| Q | O1-C2 | 1.375 | 1.365 | 1.367 | 1.365 | 1.371 | C2-01-C9 | 122.8 | 122.9 | 122.83 | 122.5 | 121.7 |
| O1-C9 | 1.360 | 1.351 | 1.351 | 1.352 | 1.368 | O1-C2-C3 | 119.0 | 120.0 | 119.25 | 120.0 | 120.1 | |
| C2-C3 | 1.372 | 1.368 | 1.366 | 1.361 | 1.362 | O1-C2-C11 | 112.3 | 112.3 | 112.55 | 112.2 | 111.5 | |
| C2-C11 | 1.465 | 1.460 | 1.459 | 1.468 | 1.469 | C3-C2-C11 | 128.6 | 128.3 | 128.19 | 127.8 | 128.4 | |
| C3-O3 | 1.358 | 1.348 | 1.349 | 1.353 | 1.358 | C2-C3-O3 | 123.7 | 124.1 | 123.70 | 123.5 | 121.1 | |
| C3-C4 | 1.449 | 1.445 | 1.446 | 1.453 | 1.431 | C2-C3-C4 | 121.4 | 121.1 | 121.46 | 121.1 | 121.2 | |
| C4-O4 | 1.265 | 1.260 | 1.256 | 1.250 | 1.269 | O3-C3-C4 | 114.9 | 114.8 | 114.83 | 115.4 | 117.6 | |
| C4-C10 | 1.432 | 1.427 | 1.429 | 1.435 | 1.423 | C3-C4-O4 | 118.7 | 118.6 | 118.62 | 119.0 | 120.6 | |
| Correlation coefficient (r) | 0.944 | 0.921 | 0.930 | 0.946 | Correlation coefficient (r) | 0.812 | 0.779 | 0.805 | 0.809 | |||
| EGCG | O1-C2 | 1.440 | 1.426 | 1.423 | 1.424 | 1.460 | C2-O1-C9 | 113.6 | 114.3 | 114.2 | 114.6 | 114.0 |
| O1-C9 | 1.374 | 1.364 | 1.365 | 1.368 | 1.390 | C3-C2-C11 | 114.6 | 114.3 | 113.2 | 112.4 | 112.4 | |
| O2-C3 | 1.440 | 1.428 | 1.425 | 1.428 | 1.440 | O1-C2-C3 | 109.3 | 109.2 | 109.5 | 110.5 | 109.0 | |
| O3-C5 | 1.366 | 1.356 | 1.355 | 1.358 | 1.380 | O1-C2-C11 | 106.2 | 104.5 | 102.4 | 105.3 | 105.0 | |
| O4-C7 | 1.366 | 1.356 | 1.355 | 1.358 | 1.370 | O2-C3-C2 | 107.1 | 114.9 | 114.4 | 112.2 | 113.3 | |
| O5-C14 | 1.394 | 1.384 | 1.383 | 1.385 | 1.380 | O2-C3-C4 | 111.4 | 110.7 | 111.2 | 112.2 | 111.3 | |
| O6-C13 | 1.361 | 1.351 | 1.351 | 1.355 | 1.390 | C2-C3-C4 | 111.4 | 111.4 | 111.1 | 109.5 | 111.8 | |
| C2-C11 | 1.523 | 1.515 | 1.512 | 1.517 | 1.530 | C3-C4-C10 | 108.5 | 109.0 | 108.5 | 109.7 | 108.7 | |
| Correlation coefficient (r) | 0.955 | 0.944 | 0.94 | 0.946 | Correlation coefficient (r) | 0.939 | 0.801 | 0.873 | 0.918 | |||
| Compound | Electronic Energy | I | EA | µ | X | η | |
|---|---|---|---|---|---|---|---|
| Q | (EN) | −30,047.53 | 5.48 | 2.01 | −3.75 | 3.75 | 3.47 |
| (EN-1) | −30,042.05 | ||||||
| (EN+1) | −30,049.54 | ||||||
| EGCG | (EN) | −45,625.14 | 5.81 | 1.23 | −3.52 | 3.52 | 4.58 |
| (EN-1) | −45,619.33 | ||||||
| (EN+1) | −45,626.37 | ||||||
| Ligands/Protein Chain | Ebinding (kcal/mol) | * Amino Acids in Active Site | Hydrogen Bonds | π Interaction |
|---|---|---|---|---|
| Q/A | −6.30 | TYR123, ASN122, GLY121, TYR80, ASP96, ARG180 | 4 | 1 |
| Q/B1 | −5.28 | GLN35, ASP22, ASP25, ASN46, LYS40, TRP37, ASP44 | 5 | |
| 2π-cation | ||||
| Q/B2 | 5.16 | HIS251, ASP253, ASN255, ALA237, ASP234, ILE246, ARG236, TYR248 | 5 | - |
| EGCG/A | −7.43 | PHE93, ASN78, GLY120, GLY121, ASN122, TYR80, ARG180, TYR123, GLU208, ASN209, ASP96 | 6 | - |
| EGCG/B1 | −5.47 | ASP44, ALA45, ASN46, GLY26, ASP25, ASP22, GLN35 | 7 | |
| - | ||||
| EGCG/B2 | −3.91 | HIS251, ASP253, PRO254, ASN255, SER238, ALA237, ASP234, ILE246, ARG236 | 2 | - |
Publisher’s Note: MDPI stays neutral with regard to jurisdictional claims in published maps and institutional affiliations. |
© 2020 by the authors. Licensee MDPI, Basel, Switzerland. This article is an open access article distributed under the terms and conditions of the Creative Commons Attribution (CC BY) license (http://creativecommons.org/licenses/by/4.0/).
Share and Cite
Martínez-Ceniceros, M.C.; Landeros-Martínez, L.-L.; Sánchez-Bojorge, N.-A.; Sandoval-Salas, F.; Piñón-Castillo, H.A.; Hernández-Ochoa, L.R.; Rodríguez-Valdez, L.M. A Potential Inhibition Process of Ricin Protein with the flavonoids Quercetin and Epigallocatechin Gallate. A Quantum-Chemical and Molecular Docking Study. Processes 2020, 8, 1393. https://doi.org/10.3390/pr8111393
Martínez-Ceniceros MC, Landeros-Martínez L-L, Sánchez-Bojorge N-A, Sandoval-Salas F, Piñón-Castillo HA, Hernández-Ochoa LR, Rodríguez-Valdez LM. A Potential Inhibition Process of Ricin Protein with the flavonoids Quercetin and Epigallocatechin Gallate. A Quantum-Chemical and Molecular Docking Study. Processes. 2020; 8(11):1393. https://doi.org/10.3390/pr8111393
Chicago/Turabian StyleMartínez-Ceniceros, Mayra Cristina, Linda-Lucila Landeros-Martínez, Nora-Aydeé Sánchez-Bojorge, Fabiola Sandoval-Salas, Hilda Amelia Piñón-Castillo, León Raúl Hernández-Ochoa, and Luz María Rodríguez-Valdez. 2020. "A Potential Inhibition Process of Ricin Protein with the flavonoids Quercetin and Epigallocatechin Gallate. A Quantum-Chemical and Molecular Docking Study" Processes 8, no. 11: 1393. https://doi.org/10.3390/pr8111393