Abstract
The operation of granulation plants on an industrial scale is challenging. Periodic instability associated with the operation of the granulation loop causes the particle size distribution of the particles flowing out from the granulator to oscillate, thus making it difficult to maintain the desired product quality. To address this problem, two control strategies are proposed in this paper, including a novel approach, where product-sized particles are recycled back to maintain a stable granulation loop process. A dynamic model of the process that is based on a population balance equation is used to represent the process dynamics. Both of the control strategies utilize a double-loop control structure that is suitable for highly oscillatory systems. The simulation results show that both control strategies, including the novel approach, are able to remove the oscillating behaviour and stabilize the granulation plant loop.
1. Introduction
Granulation is a particle enlargement process during which fine particles and/or atomizable liquids are converted into granules via a series of complex physical processes [1]. Granulation processes are used in a wide range of industrial applications, including the fertilizer industry. Fertilizer manufacturing using the granulation process has received considerable research interest during the last few decades, due to (i) the increasing requirements for efficient production of high quality fertilizers for increased food production in a growing global population and (ii) difficult process control and operation, e.g., among others [2,3,4,5,6], have focused their research on granulation processes.
This paper is focused on the last part of NPK (Nitrogen, Phosphorus, Potassium) fertilizer production. A granulation loop is used in order to produce different grades, i.e., various N:P:K ratios, of fertilizers. The NPK fertilizer is a high value type of fertilizer containing the three main elements that are essential for crop nutrition. Various NPK grades are specifically developed for different crops growing in different climates and soils [7]. The granulation loop that was studied in this paper consists of a rotary drum granulator, a granule classifier (screens), and a roll crusher. Figure 1 shows a typical schematic of a granulation process with a recycle loop. Rotary drums, as granulation units, are frequently used in fertilizer industries due to the ability of rotary drums to handle large amounts of material.
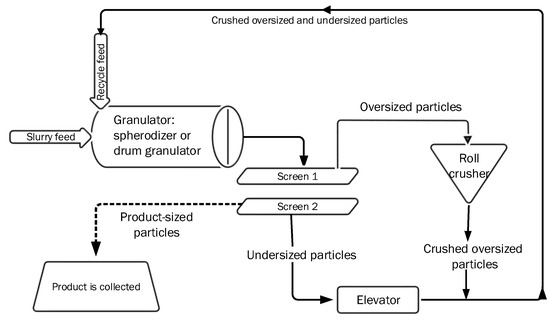
Figure 1.
Schematic diagram of a rotary drum granulation loop [7].
During the granulation process, a slurry of liquid ammonium nitrate and partly dissolved minerals is solidified to form granules. Granules that are too small (under-sized particles) are recycled to the granulation unit and granules that are too large (over-sized particles) are first crushed and then recycled back to the granulator. The recycle feed is an integral part of the granulation process. The recycle feed flow rate, as well as its particle size distribution (PSD), are important for proper process operation. The recycle of off-spec (under-sized and crushed over-sized) particles is needed in order to seed the granulator. Another reason to recycle the feed is to follow the regulations: the off-spec granules cannot be considered as a waste material, and must be recycled from an environmental and economic point of view [7].
For some granulation processes, drum processes are operated below design capacity and the amount of the recycled material is large. A typical recycle ratio in granulation plants is 4:1. This indicates a high ratio between off-spec and on-spec particles. Moreover, granulation loops may show oscillatory behavior for certain operating points. Characteristic oscillatory behavior that is faced in a granulation process industry is shown in Figure 2. In Figure 2, the PSD is represented while using the particle median diameter (diameter that corresponds to the intercept for of cumulative mass).
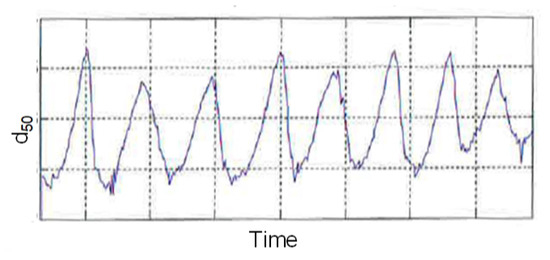
Figure 2.
Oscillatory behavior of in an industrial granulation loop plant.
The observed instability (oscillatory behavior) is linked to the entire granulation loop, since the granulator receives a fluctuating recycled stream as input. This leads to additional challenges in the fertilizer production industry. The need to guarantee that the product complies with the specifications motivates the use of process control systems in the operation of the granulation loop. Thus, it is essential to design a proper control strategy that enables the production and increase the efficiency of the granulation loop.
Granulation processes have been ubiquitous in the industry for many years with significant research being undertaken to gain further insight into designing a control strategy for improved plant operation. Oscillatory behavior in granulation loops are reported in [8,9,10]; the authors have analyzed granulation loop dynamics for fluidized bed spray granulators with internal and external classification. Drum granulation processes were extensively studied at University of Queensland, Brisbane, Australia. Some of their published contributions include [5,11,12]. These works focused on the dynamics and control of the drum granulator itself, not on the entire granulation loop. The control of the granulation loop using model-based design is reported in [8,13,14], while studies on the stabilization of granulation loops using -theory and discrepancy-based control are presented in [15,16,17].
The main objective of this study is to design the control structure to stabilize the granulation loop process, i.e., to propose possible control structures that would reduce or remove the oscillatory behaviour and possibly make granulation loops more steady to operate. To achieve this objective, a feedback control structure using double loop PID controllers reported in [18,19] is applied. In addition, a novel approach where product-sized particles are recycled back to maintain a stable granulation loop process is presented.
The paper is organized, as follows: in Section 2, a mathematical model of a granulation loop, including models of a rotary drum, screens, and a crusher, is given. In Section 3, the system dynamics of the granulation loop process are studied. Two control strategies to suppress the oscillating behavior of the process are proposed in Section 4. In Section 5, the double-loop control structure for composition controller is discussed. Closed loop simulation results and discussions are given in Section 6, while conclusions are drawn in Section 7.
2. Granulation Loop Model
2.1. Rotary Drum
In this study, a rotary drum was modeled using population balance principles. The developed models are two-dimensional (2D) models that are discretized in terms of its internal coordinate (particle diameter) and external coordinate (axial length of the granulator). A mass based population balance equation (PBE) was used, since in an industrial application, it is relatively easier to work with mass based PBEs than number based PBEs. The general form of a mass based PBE with particle diameter (d) as the internal coordinate, spatial variation (z) as the external coordinate and time (t) is represented as
where is the mass density function, d is the particle diameter, G is the particle growth rate, B is the particle birth rate, D is the particle death rate, and v is the velocity of the particles in the granulator [20]. The first term on the right hand side represents the particle growth due to layering, the second and third terms stand for particle birth and death, respectively, due to agglomeration, and the last term represents a continuous process and it gives the flow of particles through the granulator. In this study, the particle velocity is the same for all particle sizes (particle size classes). Equation (1) is derived by assuming that all of the particles are ideal spheres with a constant solid density.
In this study, the rotary drum model is based on the one-dimensional (1-D) model that was reported in [21]. However, in this study, a 2-D model reported in [7] is used in simulations. The extension of the 1-D model to the 2-D model is performed by including the spatial variations in property through the axial direction of the granulator. For this, the length of the granulator is divided into equally sized sections (compartments). Detailed formulations for a three-compartment granulator model is given in [7].
Particle growth G due to layering was modeled while using a size-independent linear growth model reported in [22,23] and used in [7,21]. The layering term was then discretized using a finite volume scheme that was extended by a Koren flux limiter function [24]. Particle agglomeration (B and D) was modeled using Hulburt and Katz’ formulation [25], as given in [7,21]. The discretization of the agglomeration term was then performed by applying one of the sectional schemes—the cell average scheme reported in [26,27].
2.2. Screens
The mass flow rates out from the screens are described while using probability function and from [28]. The mass flow rates from the screen are then calculated as
Here, , , are the mass flow rates of over-sized, under-sized, and product-sized particles, respectively. The corresponding distribution functions of the over-sized, under-sized, and product-sized particles are denoted with , , and , respectively. The screening probability functions and defined by [28] and also given in [29] are calculated while using Equations (5) and (6)
and
where is the mesh size of the screen (sieve diameter), d is the particle diameter, and is the screen separation efficiency.
2.3. Crusher
A mathematical model of the crusher is the distribution function (Equation (7)) that re-distributes the total over-sized mass flow (). Thus, over-sized particles with distribution flowing into the crusher, leave the crusher with the distribution. Having a crusher gap spacing and a standard deviation as the design choices, the crusher distribution function is defined as a Gaussian distribution, as
Here, is the standard deviation and is the crusher diameter, which is the mean size of the crushed particle distribution. The total over-sized particle flow rate is then calculated as
The mass flow rate that is recycled back to the granulator, i.e., the mass flow of the off-spec particles, is given as
An elevator that is used to transfer under-sized particles, together with the crushed over-sized particles to the recycle belt, is modeled as a transport delay.
3. System Dynamics
3.1. Simulation Setup
For studying the system dynamics, particles are classified into 80 size classes and the drum length is divided into three equally sized compartments. The PDE given by Equation (1) is transformed into a set of 240 ODEs by applying the Koren flux limiter scheme [24] for the layering term discretization and the cell average scheme [26,27] for the agglomeration term discretization. Obtained ODEs are then solved using a fourth order Runge–Kutta method with fixed time step. The simulations are performed using MATLAB and Simulink [30]. The parameters used to simulate the granulation loop process are listed in Table 1.

Table 1.
Simulation parameters.
The initialization of the mass distribution function inside the granulator is performed using a Gaussian normal distribution function given by Equation (7). For a comparison of simulation results, the evolution of the average size of the particles is represented by their diameter.
3.2. Effect of Crusher Gap Parameters on Process Dynamics
During granulation, the particles are growing inside the drum granulator, and as a result, the average diameter of the particles leaving the granulator (effluent) is larger compared to the of the particles that are sent to the granulator with the recycle feed (influent). In Figure 3, Figure 4 and Figure 5, a step-by-step change of the crusher gap spacing () is given to the system.
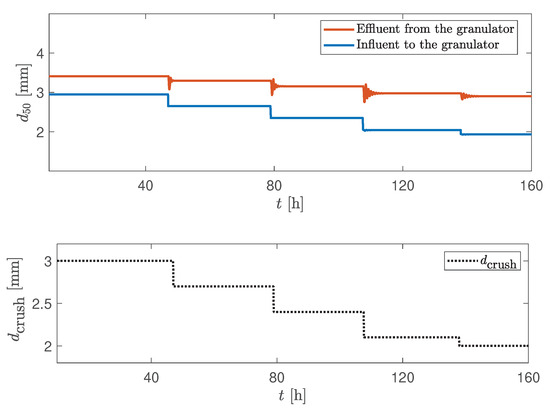
Figure 3.
of the influent/effluent as a response to the step-by-step change of the crusher gap mm.
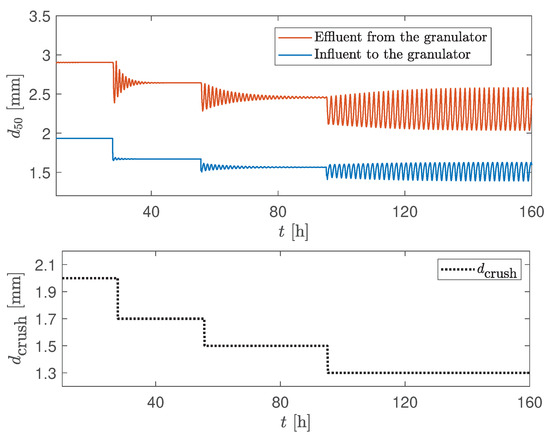
Figure 4.
of the influent/effluent as a response to the step-by-step change of the crusher gap mm.
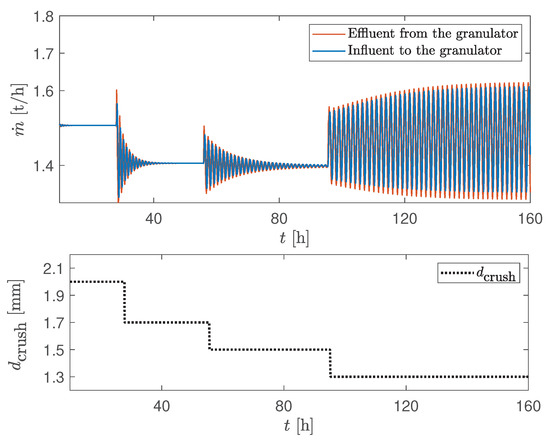
Figure 5.
Total mass flow rates of the influent/effluent as a response to the step-by-step change of the crusher gap mm.
At larger crusher gap spacings, a stable granulation process is observed ( mm in Figure 3). However, as the crusher gap spacing is reduced ( mm in Figure 4 and Figure 5), the granulation loop starts to show oscillatory behavior and, at a certain reduced crusher gap spacing ( mm), sustained periodic oscillations occur. Oscillations occur not only in the product quality, i.e., , but also in the product-sized, off-spec, and total mass flow rates (Figure 4, Figure 5 and Figure 6). Thus, the dynamic behavior of the granulation loop is inevitably connected with the crusher parameter, i.e., with the crusher gap spacing.
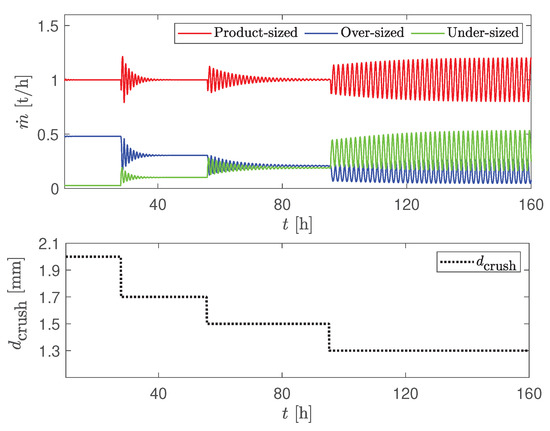
Figure 6.
Mass flow rates of over-sized, product-sized and under-sized particles as a response to the step-by-step change of the crusher gap mm.
The probable reason for the occurrence of oscillations is the off-spec (over-sized and under-sized) particle flow that is recycled to the granulator and acts as nuclei for the new granule generation. At smaller crusher gap spacings, the granulator receives a large amount of fines with the recycle feed. In the granulator, a large amount of fines has a large total particle surface area that slows down the particle growth. Thus, the growth rate and of particles decreases. On the other hand, slower growth rate contributes to the rapid drop in the production of coarse (over-sized) particles, which, in turn, reduces the total recycle feed to the granulator. As a result, the granulator receives smaller amounts of fine particles that now have lower total surface area. Thus, the growth rate and of particles again increases and gives the start of the new cycle of oscillations [7].
3.3. Recycle of Product-Sized Particles
In these open loop simulation, some of the product-sized particle flow was recycled back to the granulator. In particular, some fraction of the product-sized particle flow was sent to the recycle belt and then added to the off-spec (crushed over-sized and under-sized) particle flows.
In Figure 7, after obtaining the sustained oscillations, 20 % of the product-sized particle flow is recycled. As a result, a stable operation of the process was obtained (Figure 7). A stable operation is achieved, since the PSD distribution, measured as particle , becomes more narrow when some fraction of product-sized particles are combined with the off-spec particles and the recycle stream contains less (proportion wise) under-sized particles. One of the aims of the paper is to exploit this particular dynamic behaviour of the process in order to design a control structure for stabilizing the granulation plant.
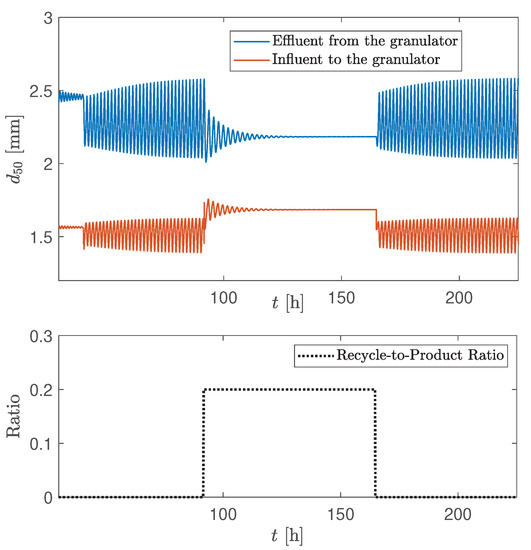
Figure 7.
of the influent/effluent as a response to the step change of the product-sized particle flow: between , 20% of the particle-sized flow rate was recycled.
4. Control Strategies
4.1. Background
The main goal of controlling the granulation plant is to stabilize the process operation by reducing or removing the oscillatory behaviour that occurs in the product quality (PSD) and quantity (mass flow rates), as stated in Section 1. In this paper, two control strategies (CS) are designed. In both CSs, the controlled variable is the granule PSD distribution, as measured by , coming from the rotary drum (effluent from the granulator). The choice of manipulatable variable depends on the plant configuration. In some industrial-scale rotary drum granulation loop plants, the crusher gap spacing can be easily manipulated by operators from the control room. In other rotary drum granulation loop plants, the crusher gap spacing can only be changed manually by operators on the plant itself, and, thus, the crusher gap spacing can not be chosen as manipulatable variable. A novelty of this paper is to show that product-to-recycle ratio can also be used as a manipulated variable in order to stabilize the granulation plant.
4.2. Control Strategy 1
The first control strategy (CS1) is based on the open loop simulations that are given in Section 3.2 and can be applied in the granulation plants where crusher gap spacings can be controlled by operators from the control room. In this control strategy, the controlled variable is the PSD distribution, as measured by , of the granules coming from the rotary drum before the granules are sieved. The manipulatable variable is the crusher gap spacing. Figure 8 shows the schematic diagram of the proposed CS1.
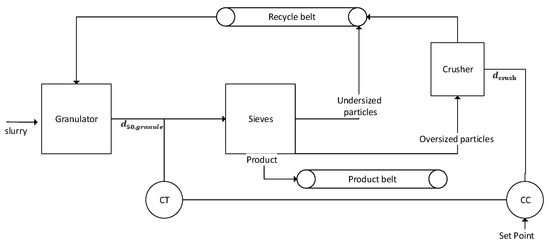
Figure 8.
Schematic diagram of CS1. CT—composition () transmitter; CC—composition () controller.
4.3. Control Strategy 2
In the second control strategy (CS2), the control of the granulation loop is performed by recycling some of the product-sized granules. Figure 9 shows the schematic diagram of the proposed CS2. Similarly to CS1, the controlled variable is the granule PSD distribution, as measured by , on the elevator coming from the rotary drum before the granules are sieved. However, here, unlike CS1, the manipulatable variable is the three-way valve opening in Figure 9. When the valve is closed (), none of the product-sized particles are recycled; when the valve is opened ()—some fraction of the product-sized particle mass flow rate is added to the recycle stream, i.e., mixed with the crushed over-sized and under-sized particle mass flow rates.
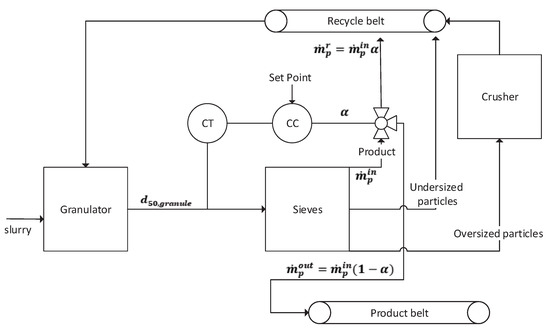
Figure 9.
Schematic diagram of CS2. CT—composition () transmitter; CC—composition () controller; —valve opening.
5. Double-Loop Control Structure for CC Controllers
The proportional-integral-derivative (PID) controller is still the most used control algorithm in the industry, due to its simple structure and easiness in operation. In this paper, the CC – composition () controllers for both control strategies 1 and 2 are designed as a double-loop control structure [18,19] for oscillatory systems.
The main idea of the control structure is to convert a given underdamped (oscillatory) system to an overdamped system while using a proportional controller () and then use an outer PI controller () to this overdamped system to track the specified reference point. Figure 10 illustrates the double-loop control structure.
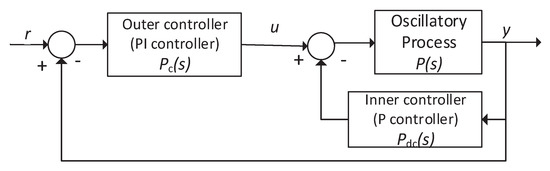
Figure 10.
The proposed double-loop control algorithm. u—control signal, y—controlled variable, r—reference point [18].
The granulation plant can be represented as an oscillatory process (a order plus time delay process) having a transfer function
where is the transfer function of the underdamped (oscillatory) process, is the process gain, is the process time delay, is the natural frequency, and is the damping factor. Process parameters, , , and were found using a simulated step-response of the granulation plant at a stable operating range.
5.1. Inner Controller
The first step in applying the double-loop control structure is to design the inner controller, which is a damping controller ( in Figure 10). In our case, a P-controller to change an underdamped system to an overdamped system. The process parameters of the overdamped system can be found while using the combined transfer function from u to y in Figure 10, i.e.,
where is the transfer function of the overdamped system and is the damping controller.
By approximating the time delay with and specifying the inner loop damping factor , the required P-controller gain is,
Here, can be viewed as a design variable that should be selected appropriately. In this study, was used. The resulting inner loop natural frequency is
5.2. Outer Controller
A simple PI controller was used as the outer controller. Tuning of the PI-controller was performed while using the SIMC tuning rules for PID controllers [31]. It is possible to directly apply SIMC tuning rules for our second order system. However, it is easier to work with a first order system. Thus, in this paper, the order overdamped system was changed to a order system using Skogestad’s half rule reported in [31]. According to the half rule, the order overdamped system was approximated as a order system plus time delay as
where the effective time delay and the effective speed of the response were calculated while using expressions summarized in Table 2.
Table 2.
Expressions used to find the controller parameters.
Tuning of the PI-controller, i.e., finding controller parameters and in Equation (15), was then performed using SIMC PI tuning rule for the order plus time delay system. The PI controller equation in frequency domain is
where is the proportional gain of the PI controller and is the integral time constant of the PI controller that were calculated while using expressions summarized in Table 2.
6. Simulation Results and Discussion
6.1. Control Strategy 1
In this case, the crusher gap spacing is chosen as manipulatable variable and of the particles leaving the granulator as the controlled variable. The double-loop controller was turned on when the sustained oscillations in the controlled variable were observed. The controller was again turned off, as the stability in the controlled variable was achieved. Figure 11 shows the simulation results when the controller was turned on at the maximum point of the cycle, while in Figure 12, the controller was turned on at the minimum point of the cycle.
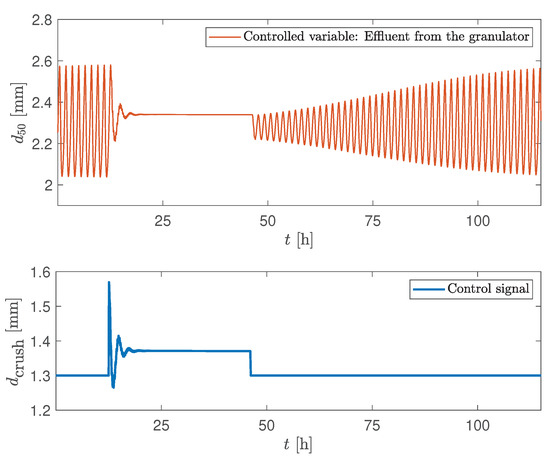
Figure 11.
Simulation of CS1: manipulatable variable—crusher gap, controlled variable— of the effluent. Controller is turned on at the maximum point of the cycle at h and turned off at h.
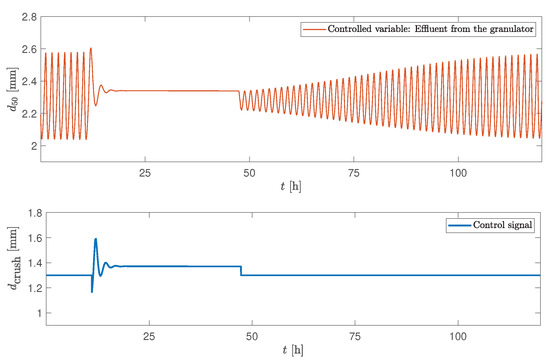
Figure 12.
Simulation of CS1: manipulatable variable—crusher gap, controlled variable— of the effluent. Controller is turned on at the minimum point of the cycle at h and turned off at h.
Both of the simulation scenarios showed similar results: after the controller was turned on, a steady state value (the set point) was reached after around 6 h in both simulation scenarios. For these two cases, identical controller parameters were used. The simulation results show that the control structure was able to eliminate the oscillatory behaviour. This resulted in a stable PSD, of the effluent and mass flow rates of both the product-sized and off-spec particles. Overall, the total mass flow rates in and out of the granulator was stabilized (Figure 13).
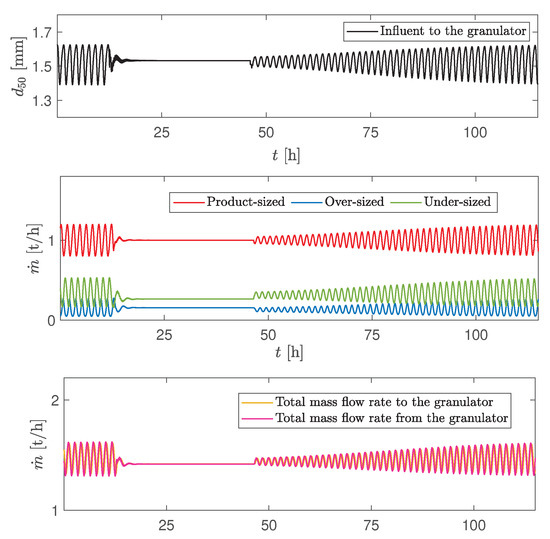
Figure 13.
Simulation of CS1: stabilization of granulation loop process. Controller is turned on at the maximum point of the cycle at h and turned off at h.
6.2. Control Strategy 2
Here, the closed loop simulations were performed using Control Strategy 2 (CS2), as described in Section 4.3 and illustrated in Figure 9. The stabilization of the granulation loop (stabilization of the oscillatory behaviour) is achieved by controlling the PSD of particles leaving the granulator. This is achieved by recycling some of the product-size particles back to the granulator, i.e., by adding some of the product to the recycle feed by adjusting the valve opening. Thus, the controlled variable is the of the particles leaving the granulator and the manipulatable variable is the valve opening that controls the recycled product flow.
In Figure 14 and Figure 15, the controller was turned on when the granulation plant exhibited sustained oscillations, i.e., at h with mm. The oscillations were quickly damped when the controller was turned on and the controller was able to track the to its desired set point. A stable (non-oscillating) PSD of the effluent (and hence a stable of the effluent) was obtained (Figure 14). In addition, a stable flow rate of the product-sized, over-sized, and under-sized particles was also obtained (Figure 15). As expected, when the controller was turned off (at h), the sustained oscillations reappeared. A similar stabilization of of the effluent, and in the mass flow rates can be also obtained for the smaller crusher gap spacings, i.e., when mm. In the case when mm, the controller should be re-tuned. Thus, it is possible to stabilize the oscillatory behaviour by recycling some of the product-sized particles (control input signal in Figure 14). Even though some of the product is recycled, it is still economically favorable: unstable operation can lead to an increase in operational expenses due to occurances of peaks in recycled mass flow rates (both total and product mass flow rates). This, in turn, results in higher energy consumption, i.e., cost. In addition, unpredictable operation also increases safety concerns and may increase maintenance costs in industrial scale plants.
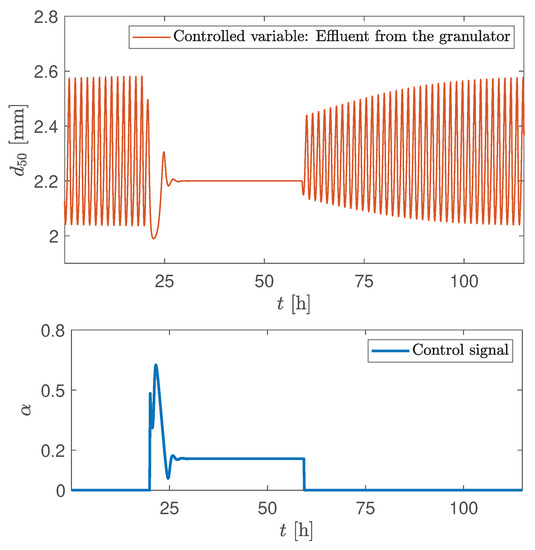
Figure 14.
Simulation of CS2: manipulatable variable—valve opening, controlled variable— of the effluent. Controller is turned on at h and turned off at h.
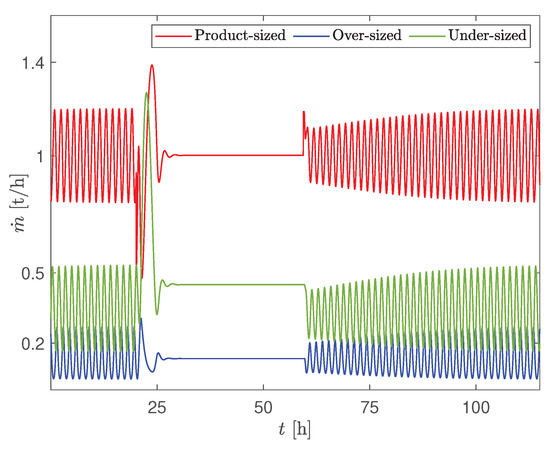
Figure 15.
Simulation of CS2: mass flow rates. Controller is turned on at the minimum point of the cycle at h and turned off at h.
For further understanding of the controller behavior, the controller was turned on at different points of the sustained oscillating behaviour, at the minimum and the maximum points of the cycle. In Figure 14, the controller was turned on at the minimum point of the cycle, while, in Figure 16 at the maximum point of the cycle. Comparison of the controller behaviours for these two cases showed that the steady state value after the controller is turned on can be reached faster if the controller is turned on at the maximum point of the cycle. It took around 7 h to reach steady state value when the controller was turned on at the minimum point (Figure 14) of the cycle, while it took around 6 h when the controller was turned on the maximum point of the cycle (Figure 16). In both these cases, identical controller parameters were used for fair comparison.
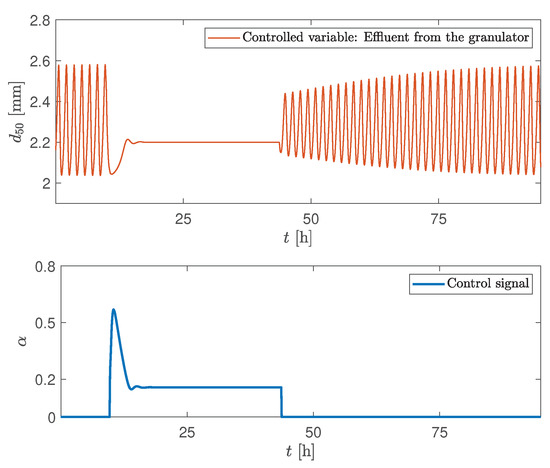
Figure 16.
Simulation of CS2: Controller is turned on at the maximum point of the cycle at h and turned off at h.
7. Conclusions
The dynamic model that was developed for the rotary drum granulation loop used in fertilizer production is able to capture the main dynamics of the granulation process. Through dynamic simulations, the model was found to reproduce unstable operation typically seen in granulation loops. In particular, the model is able to reproduce oscillating behaviour in the particle size distribution. Two feedback control strategies are designed in order to suppress the oscillations and remove the oscillating behaviour. One possible and novel implementation is to recycle the product-sized particles in order to obtain a desired PSD distribution, as measured by , of the granules leaving the granulator. This novel control strategy is particularly useful in these granulation plants where the crusher gap spacing cannot be directly manipulated. Another possibility is to control the PSD of the granules leaving the granulator by manipulating the crusher gap spacing. If a plant configuration allows for choosing between these two control strategies, i.e., if it is possible to manipulate the crusher gap spacing from the control room, then the CS1 seems a better choice for obtaining stability in operation, since the stability in the produced is obtained faster with the CS1 than with CS2. Both control strategies utilize a double-loop structure consisting of P and PI controllers, which are widely accepted and used in process industries.
Author Contributions
Writing—original draft preparation, L.V.; writing–review and editing, B.G. and B.L.; project administration, B.G.; supervision, B.L. All authors have read and agreed to the published version of the manuscript.
Funding
This research was funded by The Research Council of Norway and Yara Technology and Projects through project no. 269507/O20 ’Exploiting multi-scale simulation and control in developing next generation high efficiency fertilizer technologies (HEFTY)’.
Conflicts of Interest
The authors declare no conflict of interest.
References
- Litster, J.D.; Ennis, B. The Science and Engineering of Granulation Processes; Kluwer Academic Publishers: Dordrecht, The Netherlands, 2004; Volume 15. [Google Scholar]
- Herce, C.; Gil, A.; Gil, M.; Cortés, C. A CAPE-Taguchi combined method to optimize a NPK fertilizer plant including population balance modeling of granulation-drying rotary drum reactor. Comput. Aided Chem. Eng. 2017, 40, 49–54. [Google Scholar]
- Ramachandran, R.; Immanuel, C.D.; Stepanek, F.; Litster, J.D.; Doyle III, F.J. A mechanistic model for breakage in population balances of granulation: Theoretical kernel development and experimental validation. Chem. Eng. Res. Des. 2009, 87, 598–614. [Google Scholar] [CrossRef]
- Valiulis, G.; Simutis, R. Particle growth modelling and simulation in drum granulator-dryer. Inf. Technol. Control. 2009, 38, 147–152. [Google Scholar]
- Wang, F.Y.; Ge, X.Y.; Balliu, N.; Cameron, I.T. Optimal control and operation of drum granulation processes. Chem. Eng. Sci. 2006, 61, 257–267. [Google Scholar] [CrossRef]
- Cameron, I.T.; Wang, F.Y.; Immanuel, C.D.; Stepanek, F. Process systems modelling and applications in granulation: A review. Chem. Eng. Sci 2005, 60, 3723–3750. [Google Scholar] [CrossRef]
- Vesjolaja, L.; Glemmestad, B.; Lie, B. Dynamic model for simulating transient behaviour of rotary drum granulation loop. Model. Identif. Control 2020, 41, 65–77. [Google Scholar] [CrossRef]
- Bück, A.; Palis, S.; Tsotsas, E. Model-based control of particle properties in fluidised bed spray granulation. Powder Technol. 2015, 270, 575–583. [Google Scholar] [CrossRef]
- Drechsler, J.; Peglow, M.; Heinrich, S.; Ihlow, M.; Mörl, L. Investigating the dynamic behaviour of fluidized bed spray granulation processes applying numerical simulation tools. Chem. Eng. Sci. 2005, 60, 3817–3833. [Google Scholar] [CrossRef]
- Radichkov, R.; Müller, T.; Kienle, A.; Heinrich, S.; Peglow, M.; Mörl, L. A numerical bifurcation analysis of continuous fluidized bed spray granulator with external product classification. Chem. Eng. Process. 2006, 45, 826–837. [Google Scholar] [CrossRef]
- Ramachandran, R.; Chaudhury, A. Model-based design and control of a continuous drum granulation process. Chem. Eng. Res. Des. 2012, 90, 1063–10733. [Google Scholar] [CrossRef]
- Wang, F.Y.; Cameron, I.T. A multi-form modelling approach to the dynamics and control of drum granulation processes. Powder Technol. 2007, 179, 2–11. [Google Scholar] [CrossRef]
- Bück, A.; Dürr, R.; Schmidt, M.; Tsotsas, E. Model predictive control of continuous layering granulation in fluidised beds with internal product classification. J. Process Control 2016, 45, 65–75. [Google Scholar] [CrossRef]
- Glaser, T.; Sanders, C.F.W.; Wang, F.Y.; Cameron, I.T.; Litster, J.D.; Poon, J.M.-H.; Ramachandran, R.; Immanuel, C.D.; Doyle, F.J., III. Model predictive control of continuous drum granulation. J. Process Control 2009, 19, 615–622. [Google Scholar] [CrossRef]
- Palis, S.; Kienle, A. Stabilization of continuous fluidized bed spray granulation with external product classification. Chem. Eng. Sci. 2012, 70, 200–209. [Google Scholar] [CrossRef]
- Palis, S.; Kienle, A. Discrepancy based control of continuous fluidized bed spray granulation with internal product classification. IFAC Proc. Vol. 2012, 45, 756–761. [Google Scholar] [CrossRef]
- Palis, S.; Kienle, A. Stabilization of continuous fluidized bed spray granulation-a Lyapunov approach. IFAC Proc. Vol. 2010, 43, 1362–1367. [Google Scholar] [CrossRef]
- Nandong, J. Double-loop control structure for oscillatory systems: Improved PID tuning via multi-scale control scheme. In Proceedings of the 10th Asian Control Conference (ASCC), Kota Kinabalu, Malaysia, 31 May–3 June 2015. [Google Scholar]
- Park, J.H.; Sung, S.W.; Lee, I.-B. An enhanced PID control strategy for unstable processes. Automatica 1998, 34, 751–756. [Google Scholar] [CrossRef]
- Ramkrishna, D. Population Balances: Theory and Applications to Particulate Systems in Engineering; Academic Press: Cambridge, MA, USA; London, UK, 2000. [Google Scholar]
- Vesjolaja, L.; Glemmestad, B.; Lie, B. Population balance modelling for fertilizer granulation process. In Proceedings of the 59th Conference on Simulation and Modelling (SIMS 59), Oslo, Norway, 26–28 September 2018. [Google Scholar]
- Mörl, L. Anwendungsmöglichkeiten und Berechnung von Wirbelschichtgranulationstrocknungsanlagen. Ph.D. Thesis, Technische Hochschule Magdeburg, Magdeburg, Germany, 1981. [Google Scholar]
- Mörl, L.; Mittelstrab, M.; Sachse, J. Zum Kugelwachstum bei der Wirbelschichtrocknung von Suspensionen oder Losungen. Chem. Technol. 1977, 29, 95–102. [Google Scholar]
- Koren, B. A Robust Upwind Discretization Method for Advection, Diffusion and Source Terms; Centrum voor Wiskunde en Informatica: Amsterdam, The Netherlands, 1993; pp. 117–138. [Google Scholar]
- Hulburt, H.M.; Katz, S. Some problems in particle technology: A statistical mechanical formulation. Chem. Eng. Sci. 1964, 19, 555–574. [Google Scholar] [CrossRef]
- Kumar, J.; Peglow, M.; Warnecke, G.; Heinrich, S.; Mörl, L. Improved accuracy and convergence of discretized population balance for aggregation: The cell average technique. Chem. Eng. Sci. 2006, 61, 3327–3342. [Google Scholar] [CrossRef]
- Kumar, J. Numerical Approximations of Population Balance Equations in Particulate Systems. Ph.D. Thesis, Otto-von-Guericke-Universität Magdeburg, Universitätsbibliothek, Magdeburg, Germany, 2006. [Google Scholar]
- Molerus, O.; Hoffmann, H. Darstellung von Windsichtertrennkurven durch ein stochastisches Modell. Chem. Ing. Tech. 1969, 41, 340–344. [Google Scholar] [CrossRef]
- Heinrich, S.; Peglow, M.; Ihlow, M.; Mörl, L. Particle population modeling in fluidized bed-spray granulation—analysis of the steady state and unsteady behavior. Powder Technol. 2003, 130, 154–161. [Google Scholar] [CrossRef]
- MATLAB. MathWorks Announces Release 2019b of MATLAB and Simulink; The MathWorks, Inc.: Natick, MA, USA, 2019. [Google Scholar]
- Skogestad, S. Simple analytic rules for model reduction and PID controller tuning. J. Process Control 2003, 13, 291–309. [Google Scholar] [CrossRef]


Publisher’s Note: MDPI stays neutral with regard to jurisdictional claims in published maps and institutional affiliations. |
© 2020 by the authors. Licensee MDPI, Basel, Switzerland. This article is an open access article distributed under the terms and conditions of the Creative Commons Attribution (CC BY) license (http://creativecommons.org/licenses/by/4.0/).