Article

Modeling of Transport of Loose Products with the Use of the Non-Grid Method of Discrete Elements (DEM)

1
Faculty of Biotechnology and Food Science, Lodz University of Technology, Wolczanska 171/173, 90-924 Lodz, Poland
2
MESco Sp. z o.o., Aleja Legionów 4, 41-902 Bytom, Poland
3
Faculty of Process and Environmental Engineering, Lodz University of Technology, Wolczanska 213, 90-924 Lodz, Poland
*
Authors to whom correspondence should be addressed.
Processes 2020, 8(11), 1489; https://doi.org/10.3390/pr8111489
Submission received: 13 October 2020 / Revised: 13 November 2020 / Accepted: 16 November 2020 / Published: 18 November 2020
(This article belongs to the Special Issue Advances in Food Packaging Technology)

Abstract

:
The application of the Discrete Element Method (DEM) allows simulating the movement of a particle of any shape in a conveyor. The DEM method uses the assumptions of the Lagrange calculation model, in which each particle in the domain is tracked individually. It makes it possible to conduct a thorough examination of the behavior of the entire bulk material bed consisting of a set of elements with characteristic physicochemical properties. Therefore, the deposit is not considered according to averages and constants, e.g., strength values, but as a set of elements that can be described individually. The article presents the results of a simulation, with the use of the Discrete Elements Method (DEM), of the process of soft fruit transport in the food industry. The results of the research and exemplary simulations of blueberry fruit transport are presented. The influence of the type of a transport device on the values of normal and tangential forces occurring between the blueberry fruit and structural elements of the transport device, as well as the interaction between the fruits, were modeled. In addition, based on the amount of energy absorbed by each fruit due to collisions, the analysis of the energy spectrum of collisions of particles was carried out to determine the likelihood of damage to the fruit in transport and to identify the phenomena that favor it.

1. Introduction

The dynamic growth of production, which is characteristic of the development of the modern food industry, requires systematic improvement of the level of organization and automation of production processes. It also applies to companies designing technological lines and industrial equipment. The most important criterion determining the selection of a device/method of transport is the type, or rather the physical and chemical characteristics of the product that is transported. A serious technological challenge in the food industry is the transport of delicate products (including soft fruit), susceptible to mechanical damage, the destruction of which makes it necessary to withdraw the raw material/semi-product from the technological line. Another serious problem is micro-cracks, which accelerate the destruction of the product in subsequent stages of the technological process [1,2,3]. A technologist must therefore choose the most appropriate way of dispensing products in a way limiting the time of operation during which mechanical damage to the product may occur and limiting the weight of the waste [4,5,6]. The available numerical methods to investigate the behavior of particles make it possible for machine constructors to track the forces acting on a transported material. The most important ones are normal forces and tangential forces resulting from the collision of particles with the walls of transport equipment [7,8,9]. They affect mainly the quality of the transported material. In the food industry, various ways and mechanisms of transporting loose products are used [10,11]. There are many factors determining the choice of the way products are transported. The most frequently mentioned are: physicochemical properties of the product/raw material, direction, and distance to which the raw material is transported, and the capacity of the transport equipment. Additionally, when choosing the equipment, users are guided by the aesthetics of it, time of delivery, and process/technological safety expressed by the ease of cleaning of the transport equipment. In addition, when selecting the method of transporting the raw material, production technologists, must consider factors affecting keeping the product quality parameters during transport. During the transport of food raw materials, there are unfavorable phenomena, which reduce the quality of the raw material, leading to the loss of the weight of the material, which can be subjected to further technological processes. It is assumed that transporting food is a mobile type of storage, and therefore the changes in the transported products are influenced by the same parameters that affect them during storage [12]. The rate of these changes depends on the temperature, humidity, oxygen, and carbon dioxide content in the environment [13]. Unfavorable changes in the quality of the raw material occur through the influence of microorganisms. Microorganisms that contaminate fruit and vegetables usually settle on their surface and penetrate into tissues as a result of damage caused during harvesting, transport, and storage. The degree of microbiological contamination of fruit and vegetables affects their durability, stability, and sensory properties, so it is a determinant of their quality and suitability for consumption. The fruit is most often contaminated by acidophilic microorganisms, including acetate bacteria Acetobacter sp., Gluconobacter sp., lactic fermentation bacteria Lactobacillus sp., as well as yeasts and filamentous fungi. The dominant vegetable microflora are bacteria of the Bacillus and Clostridium genera, Micrococcus, Flavobacterium, lactic acid bacteria green vegetables [14]. The factors that favor the development of microorganisms on the transported raw material are mechanical damages to the surface, resulting from the mechanical interaction between the elements of the raw material and the walls of the equipment used for transport. One of the mechanical factors that adversely affect the quality of the raw material surface are vibrations [15]. The world literature lacks descriptions of the influence of vibrations generated during the movement of raw material in transport equipment. During transport, the raw material is displaced and there occur mechanical interactions caused by vibrations of the conveying device. The vibrating movement contributes to the reduction of the content of certain chemical compounds in the transported soft fruit, influencing the biochemical transformations leading to the loss of quality characteristics of the transported raw material [12,16]. Soft fruits are particularly exposed to the reduction of chemical compounds (studies on the influence of vibrations on strawberries have shown that the content of sugars and ascorbic acid decreases [17]). Moreover, a change in bacterial cell activity has been observed. Their number changed depending on the temperature at which the research was conducted. The increase in the activity of microorganisms caused by the temperature increase is additionally strengthened by damage to the cell walls of blueberries and the leakage of sugars that are a nutrient medium for multiplication of microorganisms. A decrease in the number of bacterial cells was observed at 10 °C. This can be linked to a reduction of nutrients (including sugars) that provide food for the bacteria. At the temperature of 25 °C, an unfavorable increase in the number of bacterial cells of Escherichia coli was observed, which was explained by the leakage of juice from damaged strawberries, which resulted in an increase in pH, positively influencing the activity of microorganisms [18].
Limiting the unfavorable influence of vibrations of the conveying device on the raw material is one of the most important tasks for constructors of devices used in food processing. At the same time, the choice of the right device involves carrying out costly tests in conditions that meet the requirements of the process line. For this reason, it is becoming increasingly common to use computer simulations to reduce research time and costs. During the design of the device, specialist software is used to simulate its operating conditions and to simulate the behavior of the transported raw material particles. The mathematical models used for simulation calculations make possible to present the movement of the transported raw material deposit corresponding to real process conditions. One of the available simulation tools is Rocky DEM, Engineering Simulation, and Scientific Software Ltd. The software uses the Discrete Element Methods (DEM). The implementation of Rocky DEM makes it possible to simulate the movement of any set of particles of any shape moving in the transport device.
During the research, multi-criteria simulations of blueberry movement, transported by a vibrating conveyor, were carried out. Normal and tangential forces between the blueberry fruit and the walls of the transporter were calculated. The calculations of energy restitution coefficients were made, taking into account the physicochemical properties of blueberry fruit. The calculations were made for the model of a shock (vibrating) conveyor as well as for a conveyor with a chute with a reciprocating movement (shaking conveyor). The results of the simulation made possible to select the structural parameters of the conveyors taking into account the highest capacity (output) of the transported fruit and energy optimization of the device.

2. Materials and Methods

2.1. DEM Model Used for the Calculations

The Discrete Element Method (DEM) is a numerical technique for predicting the movement behavior of mass solids. The DEM method is based on direct tracking of particles in the Lagrange reference system. It ensures a more accurate modeling of the interactions of raw material particles [19].
The movement of loose materials moving along a specific geometry is forced by the shape of the chute, the effect of gravitational force, the movement of the elements of the conveying device and mutual interactions of the particles of the moving material.
The movement of the deposit is the resultant of many factors, and the mathematical description requires a complex computational apparatus, forced by the interpenetrating features. A deposit can be locally treated as a solid, while in other fragments, it shows features of liquid phase. It is also possible for both behaviors to interweave. Using DEM modeling is based on a meshless method describing the elements of the deposit. Each of the particles/elements of the deposit is described mathematically, so that it is finally possible to describe the movement of the whole deposit. It is possible because the individual motion equation for each particle is integrated into the entire deposit.
The available solutions allow performing DEM simulations with the assumption of sphericity of particles or using any shape of geometry (Figure 1). Furthermore, it is possible to perform one- or two-way coupling simulation with thermal, flow, or structural analysis.

2.2. Mathematical Model

The numerical analysis of the feeder, transporting delicate fruit, included:
-
Determination of forces acting on individual particles resulting from their mass;
-
Calculation of interactions with walls or other particles.
In the first step, it is required to introduce necessary settings, such as the selection of mathematical models and the associated parameters and material data. What is determined in the next step is the area of interaction of each particle and then the forces acting on the elements of the modeled set. The calculations lead to the distribution of speed vectors for the particles in a given calculation step. Subsequent transformations lead to estimation of a new position of particles [20]. The calculation is repeated until the condition of the end time of the simulation, set by the user, is fulfilled.
Configuration: geometry, boundary condition, material properties, diameter distribution, and particle type.
Process: the user decides to start processing the simulation for each individual particle; the DEM program performs the following actions:
  • Locates all adjacent particles and borders with which the particle will come into contact;
  • Calculates the sum of all forces (Euler Equation);
  • Acting on the particle:
F t o t a l = F b o d y + F s u r f a c e = m d v d t
Movement: the DEM software uses the current location of particles, velocity, and time step information to move the particle to its next location in the simulation
V n e w = V o l d + t t + Δ t F t o t a l m d t
x n e w = x o l d + t t + Δ t v n e w d t
DEM program.
Markings: F as force, m as mass, t as time, v as velocity, and x as position location. For simplicity of the scheme, no Euler Equation is presented [21].

3. Results

3.1. Forces Acting on a Particle

The algorithm of operation of DEM programs assumes that particles are affected by two types of forces (Equation (1)). The first of them are mass forces (Fbody), whose source is the mass of individual particles, included in the calculation model. The second type of force occurs on the surface of particles, at contact points, which develop as a result of inter-particle collisions or collisions with the geometry of walls. They are marked as surface forces (Fsurface). While determination of mass forces in case of the analyzed feeder is not complicated, it comes down only to determination of the weight of each particle; the forces resulting from interactions on the surface of a particle require advanced mathematical apparatus. In addition, the surface forces are divided into two subtypes, i.e., into normal and tangential forces.

3.1.1. Normal Forces

During the simulation, it is initially assumed that all particles are non-deformable and have a spherical shape. In contrast, actual deformations occurring during collisions of particles should be modeled by taking into account the behavior of the particles resulting from their strength properties. For this purpose, a theoretical deformation (Figure 2) is assumed, which is described as a slight particle permeation. Based on this theoretical approach, a deformation is modeled, being a response to the nature of the interaction of the modeled particle at the point of contact.
To determine normal forces, the model of Walton and Braun linear spring hysteresis was used [22]. This model describes an elastic collision with energy dissipation due to particle deformation. This approach is used effectively in the description of transport of dry material [23,24]. The used model is represented by Equation (4). As the analyses were conducted in a non-stationary (time-varying) mode, the equation was time-dependent. The normal force at a given time step F n t is [25,26]:
F n t = { m i n   ( K n l s n t , F n t Δ t + K n u Δ s n )   if   Δ s n 0 m a x ( F n t Δ t + K n u Δ s n , λ K n l s n t )   if   Δ s n   <   0
where F n t and F n t Δ t are normal forces at the given and previous time step, Δsn is the overlay of particles in the normal direction (Figure 2), Knl and Knu are the contact rigidity when increasing and decreasing the load. These constants are dependent on the Young particle modulus and the walls as well as the particle size.

3.1.2. Tangential Forces

The tangential forces resulting from contact were determined using the Coulomb’s flexible model. In this case, the collision is treated completely elastically. Ideally, it could be described using Equation (5):
F τ , e t =   F τ t Δ t K τ Δ s τ
where:
  • F τ t Δ t is the value of this force from the previous time step;
  • Δsτ is mutual relative deformation;
  • Kτ is the tangent stiffness defined as the fraction of normal stiffness from Equation (4).
Equation (5) describes an ideal case. Additionally, the limit of force must also be taken into account, by marking the Coulomb limit:
F τ t = m i n ( | F τ , e t | , μ F n t ) F τ , e t | F τ , e t |
where μ is the coefficient of friction defined for a given contact pair. If the force derived from Equation (4) exceeds the limit value described by the term μ F n t , the force shall take the value of that term and the sign defined for Equation (4).

3.2. Shock Conveyors—Motion Analysis

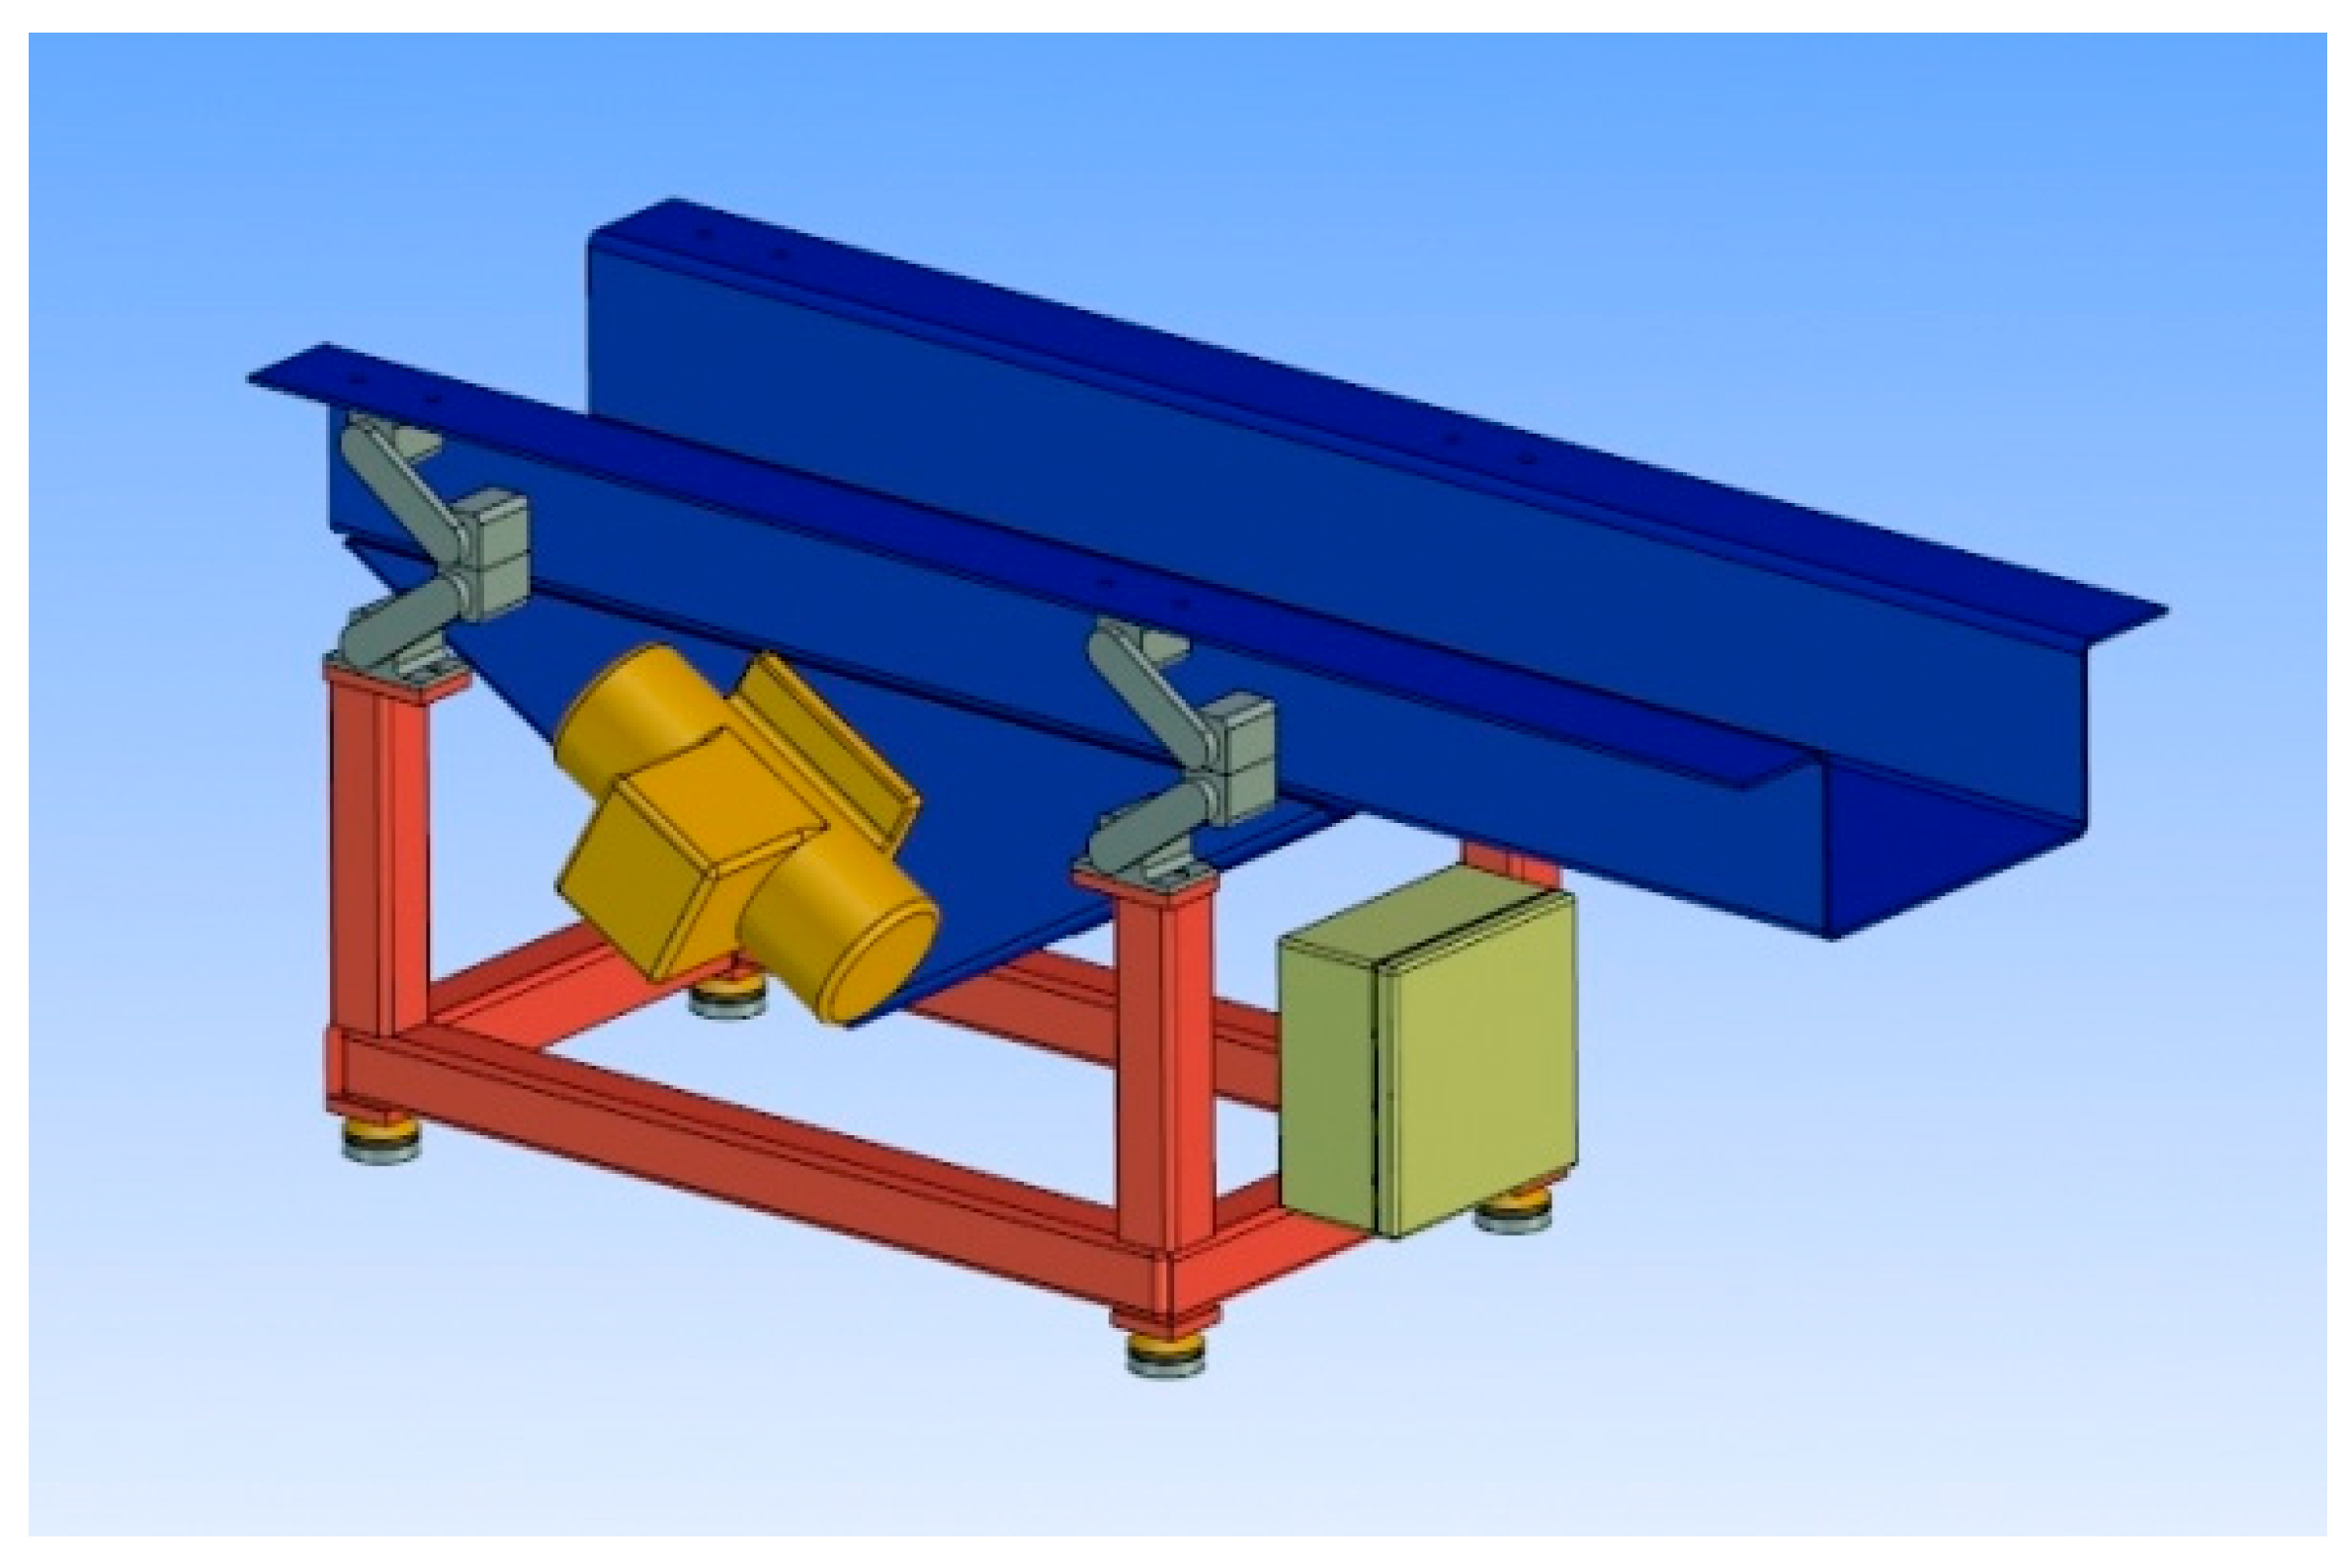
The model of movement of raw material deposit was used to simulate the operating conditions of shock conveyors (Figure 3), which belong to the group of non-concurrent conveyors in which loose materials move in a trough or in a chute, as a result of inertia. Conveyor troughs are excited to vibrate, performing cyclic movements with variable speed and variable acceleration. The material in the trough makes continuously short slides or jumps, moving in the direction of transport.
Conveyors in which cyclic movements take place in a plane parallel to the trough surface are called shock-absorbing conveyors, while those whose direction of movement is inclined at a certain angle to the trough surface are called vibrating conveyors. Another criterion for dividing conveyors into shock and vibration ones is the nature of movement of the transported material. In shock-absorbing conveyors, the material slides in the trough under the influence of inertia forces, regardless of the direction of parallel or inclined movement, whereas in vibrating conveyors the material moves by micro jumps [27,28,29,30]. In Figure 4, the differences between the two types of conveyors are shown graphically. I. Movement of the product in I. Movement of the product inclined at a certain angle to the plane of the trough the plane parallel to the plane of the trough II. The transported material slides in the trough II. The transported material usually makes micro jumps under the influence of inertia forces.
Vibration conveyors differ from shaken ones with the type of drive. The chutes of vibration conveyors are vibrated by means of electromechanical, electromagnetic, hydraulic, and pneumatic drives. The troughs of shaken conveyors, on the other hand, are introduced into the reciprocating motion by means of double crank, crank, and hook mechanisms, elliptical wheels, etc. In addition, pneumatic or hydraulic drive can be used on shakeout conveyors, which will allow the amplitude and frequency of trough movements to be adjusted according to the required capacity [31,32,33].

3.3. The Boundary Conditions Used in the Calculations

For the correctness of the calculations, the material constants of the transported material were used and the process conditions for which the simulation was carried out were determined. For both types of transport, a constant mass flow of blueberry fruit equal to 0.1 kg/s was assumed. The following diameter distribution was assumed for the analysis: 80% of blueberries with a characteristic diameter of 12 mm and 20% with a diameter of 15 mm.
Modeling condition:
  • There is no particles at the beginning of the simulation. The particles are injected to the domain at each time step of the simulation with constant mass flow of 0.1 kg/s, the same for both simulations.
  • The particles are removed after leaving the domain.
  • The particles are spherical. It is possible due to fruits shape and with implementation of rolling resistance. Additionally, it is possible to perform DEM simulation of any kind of shape.
  • The Young modulus for particles was 0.61 MPa.
In order to simulate non-spherical shape of the particles and its elasticity while rolling, a constant rolling resistance model was used. That model represents a constant moment that act on a particle during rotational movement (see Equation (7)):
M r = µ r | r | F n ω | ω |
where:
  • µ r coefficient of rolling resistance, defined as a tangent of maximal slope on which resistance moment counteracts the torque caused by the tangential forces [34];
  • r —rolling radius—vector joining particle center and the contact point;
  • F n —contact normal force;
  • ω —particle angular velocity.
The value of the rolling resistance was assumed as equal 0.9 basing on experience.
The physical properties of the blueberries used in the model are presented in Table 1. The coefficient of restitution, for preliminary analysis, was adopted at the level of 0.7, while in a further step a parametric analysis was considered to examine the effect of this parameter on the values of forces acting on fruits. During the simulation, collision statistics data were collected in the form of normal and tangential forces acting on blueberries during collisions between fruits, and as a result of collisions with walls of the conveyor. Normal and tangential forces are an indicator of the quality of transport because they are responsible for damage to the structure of the fruit and for changes in its surface. The results presented in the further part of this article refer to the established state of the operation of the conveyor, which corresponds to the last 10 s of its operation. During the simulation, a 20-s conveyor operation time was assumed. It made possible to obtain the established operating status of the feeders and to obtain average values for a sufficiently long operating time from the simulation model.
The blueberry transport simulation was carried out on a gutter conveyor, which was designed in CAD software (Invertor 2015, Autodesk, Kraków, Poland, 2015). Then a digital construction model was imported in STL format for simulation calculations. Two types of movement were assigned to the geometry of the conveyor:
  • Vibrating movement, where the movement took place in the direction of 45 degrees of inclination to the conveyor plane (Figure 5) with a frequency of 15 Hz and amplitude of 3 mm;
  • Reciprocating movement, where the movement took place in the feeder line (Figure 4) with a 6 mm pitch. The return movement of the gutter is faster than the forward movement and the time for each of them was 0.01 s and 0.03 s, respectively.

4. Discussion

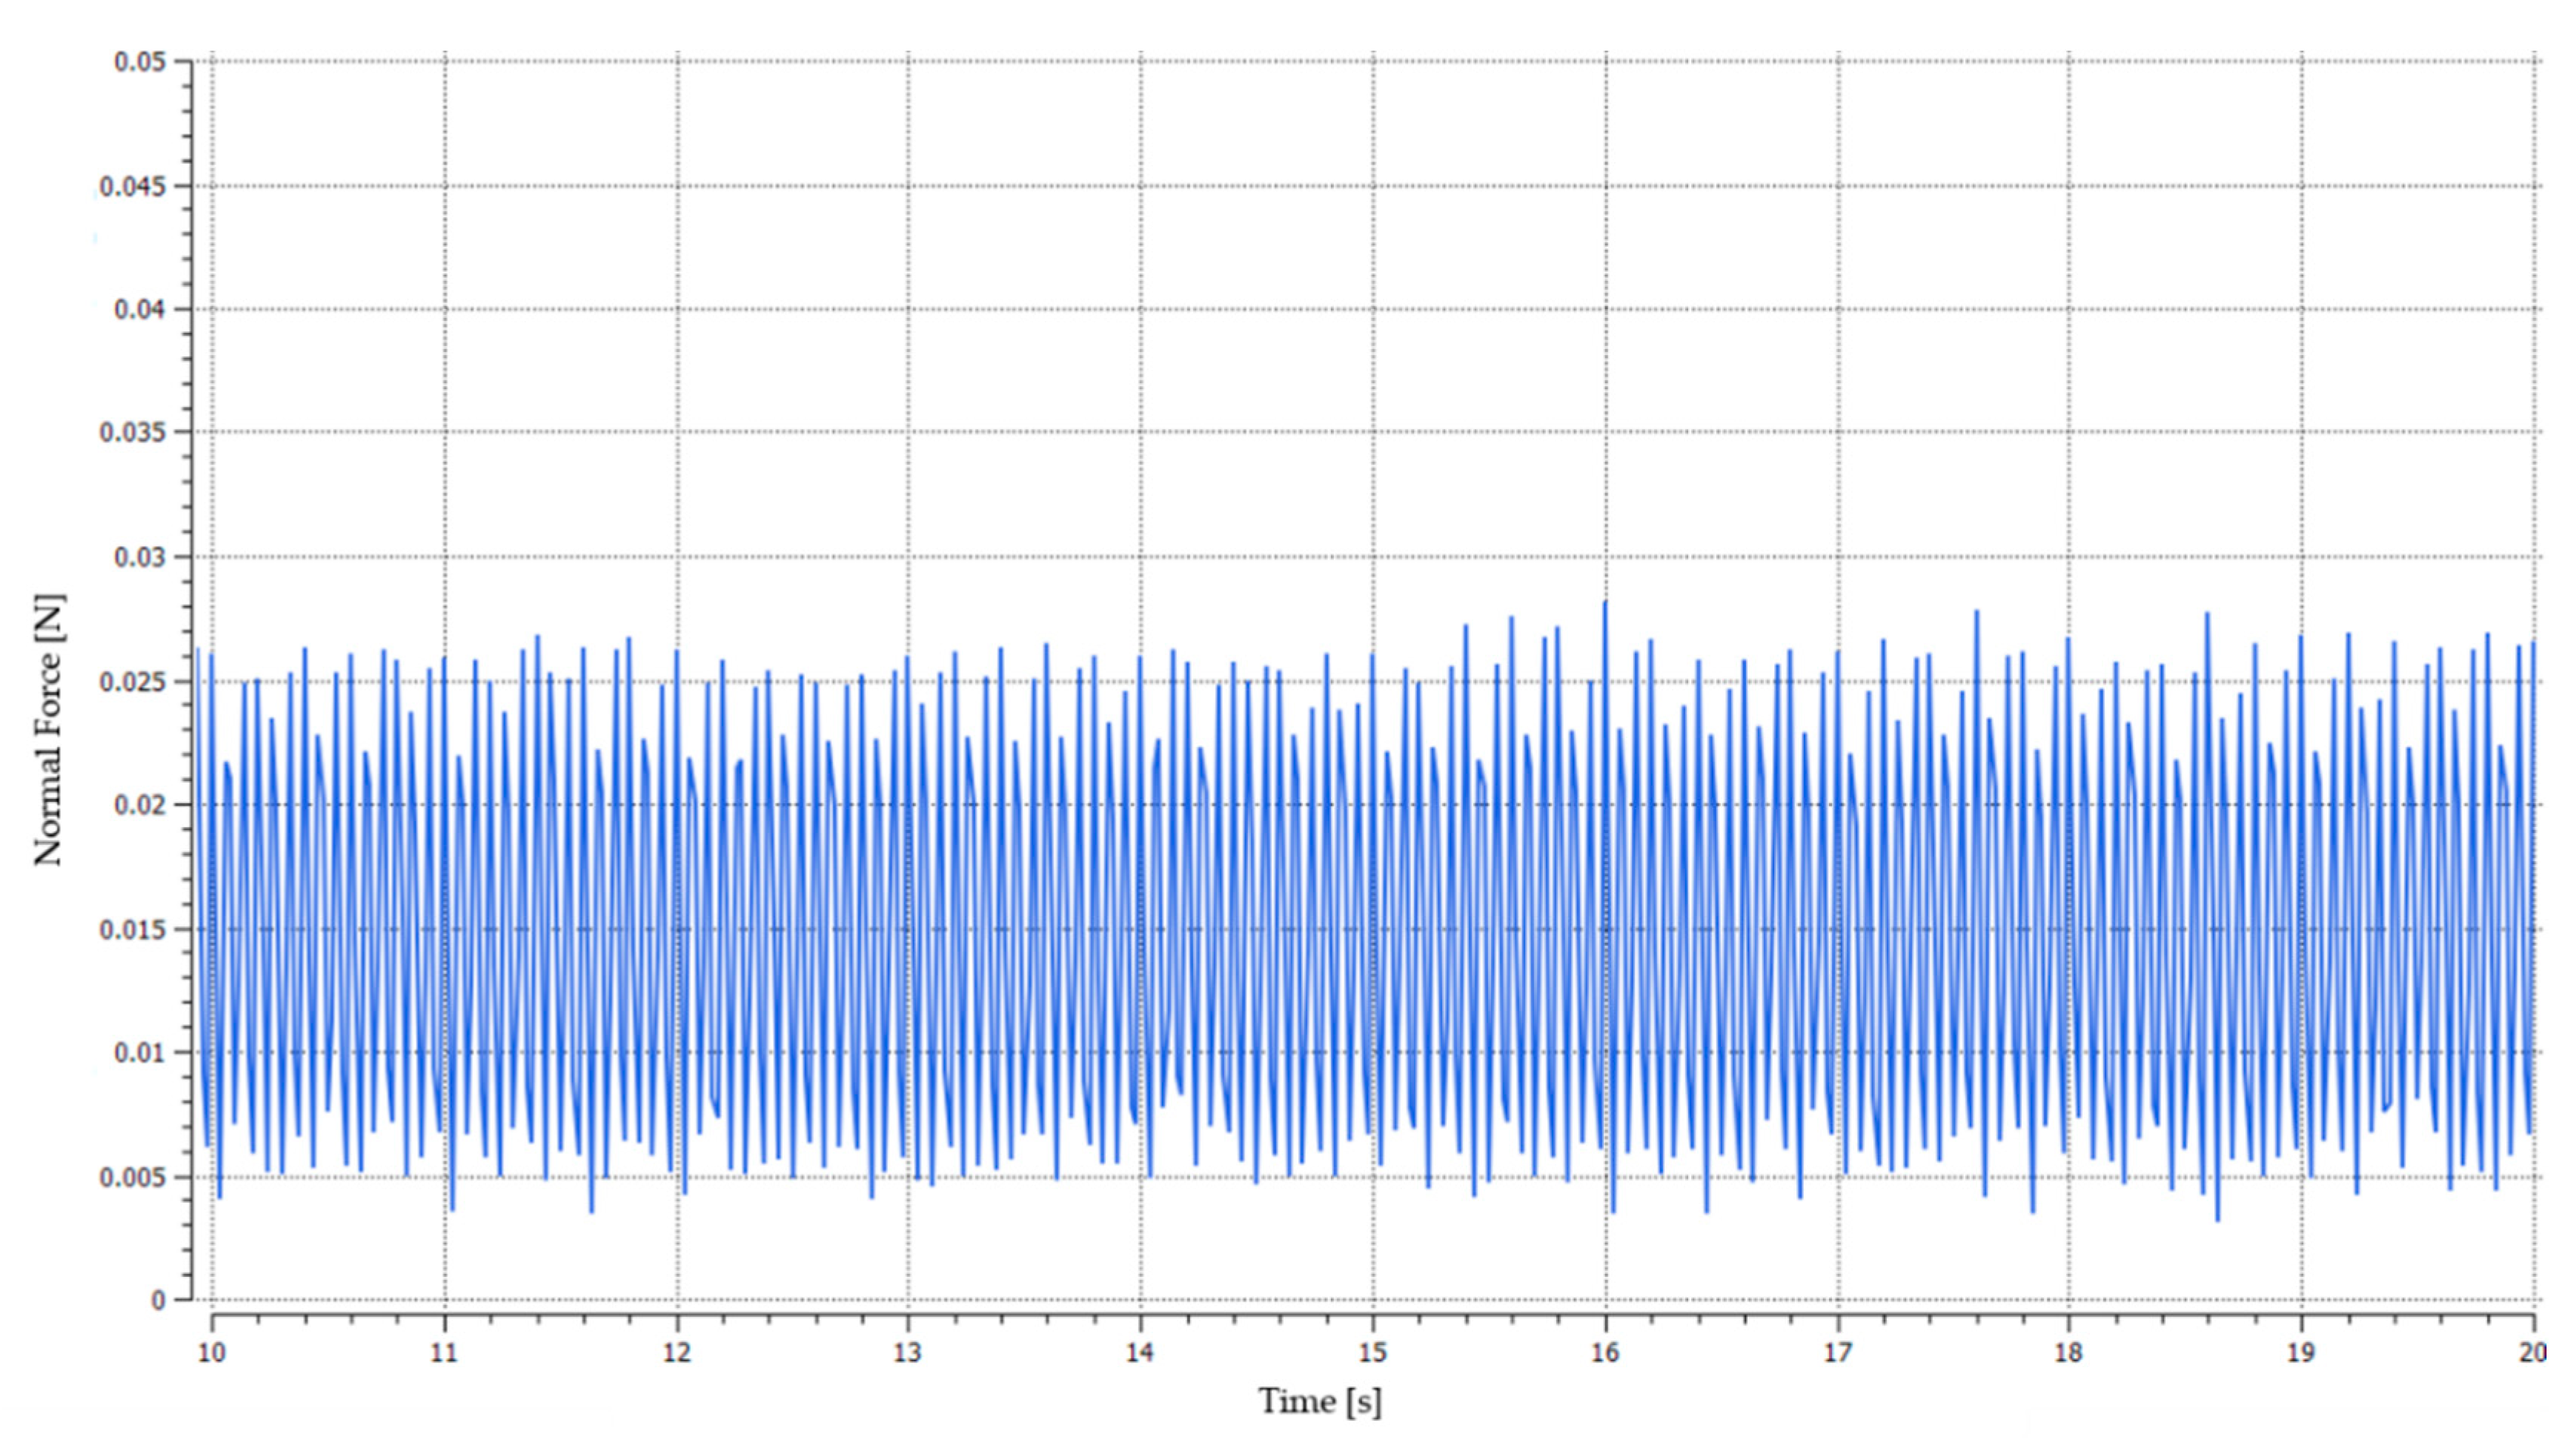
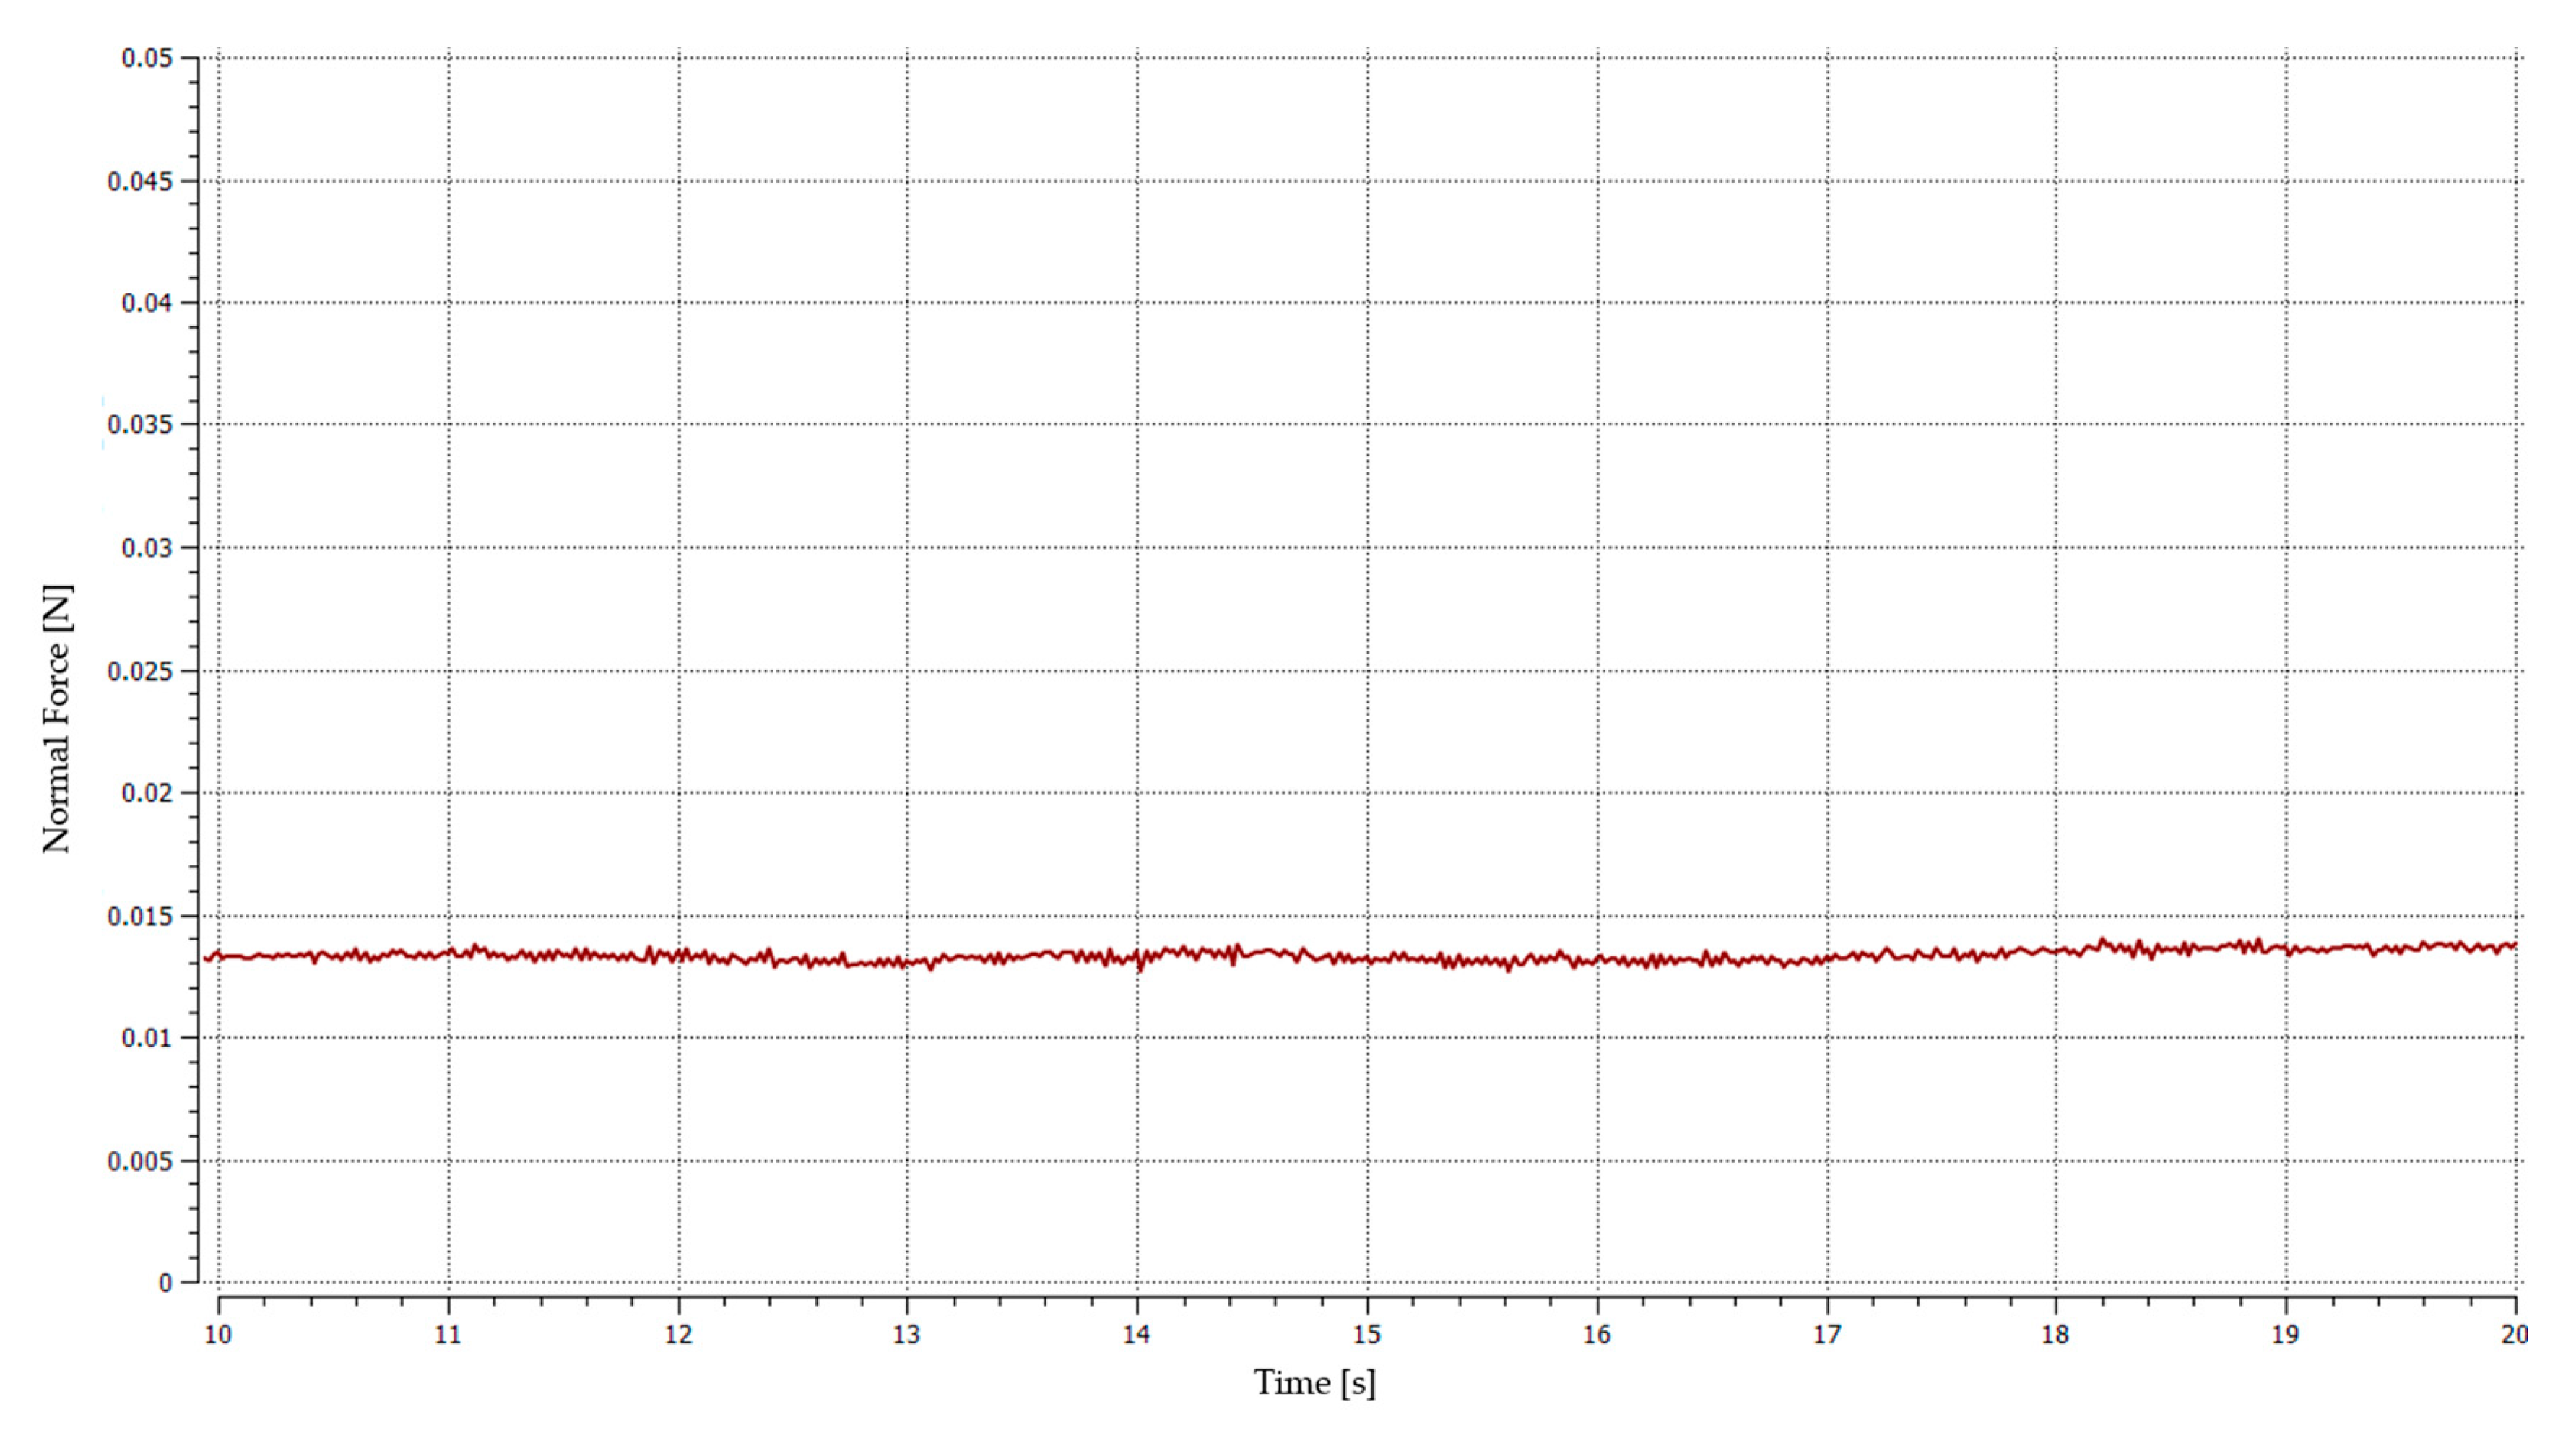
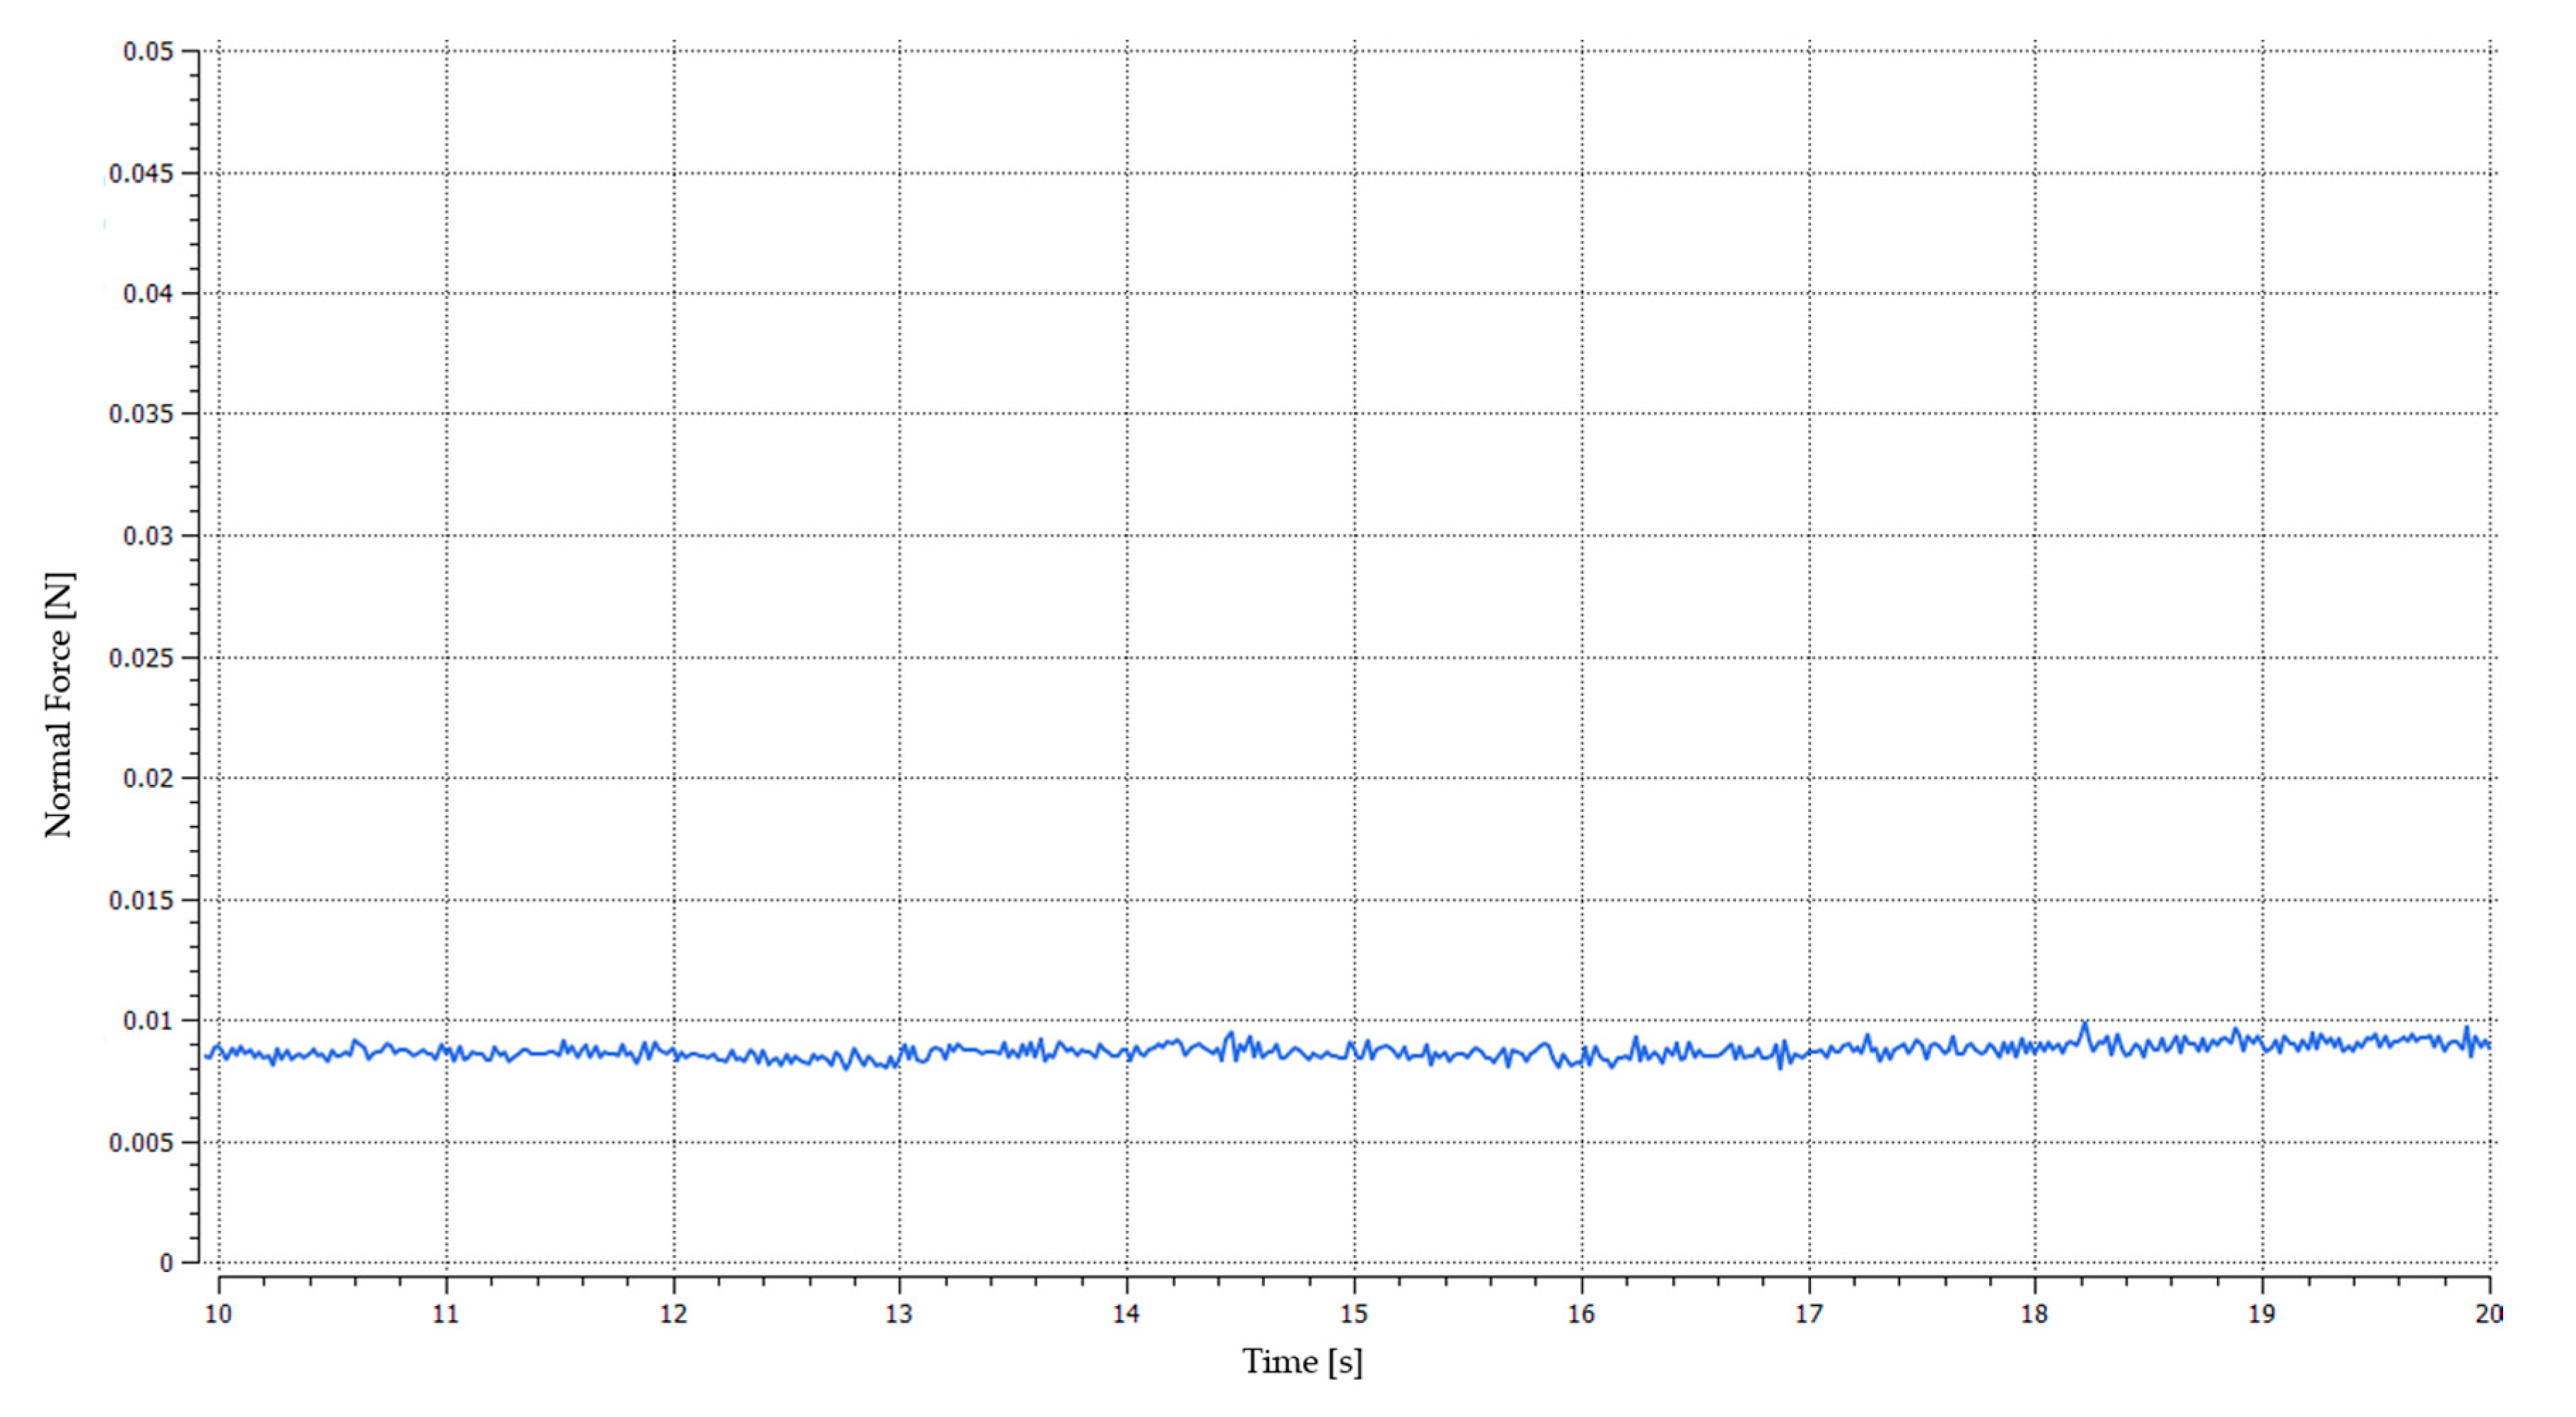
Figure 5, Figure 6, Figure 7 and Figure 8 show a comparison of graphs of mean normal force (mean for the whole population) acting on fruits as a function of time and standard deviation of the mean for this size. There is a significant difference in the results obtained. In case of the vibrating feeder, the forces acting on the fruit are much higher than those acting on the feeder with reciprocating motion [35,36]. In the first case, the average force acting on the fruit after time was 17.4 mN, whereas in case of the reciprocating feeder 11.6 mN, which means that the average value of this force is about 30% lower in comparison with the vibrating feeder.
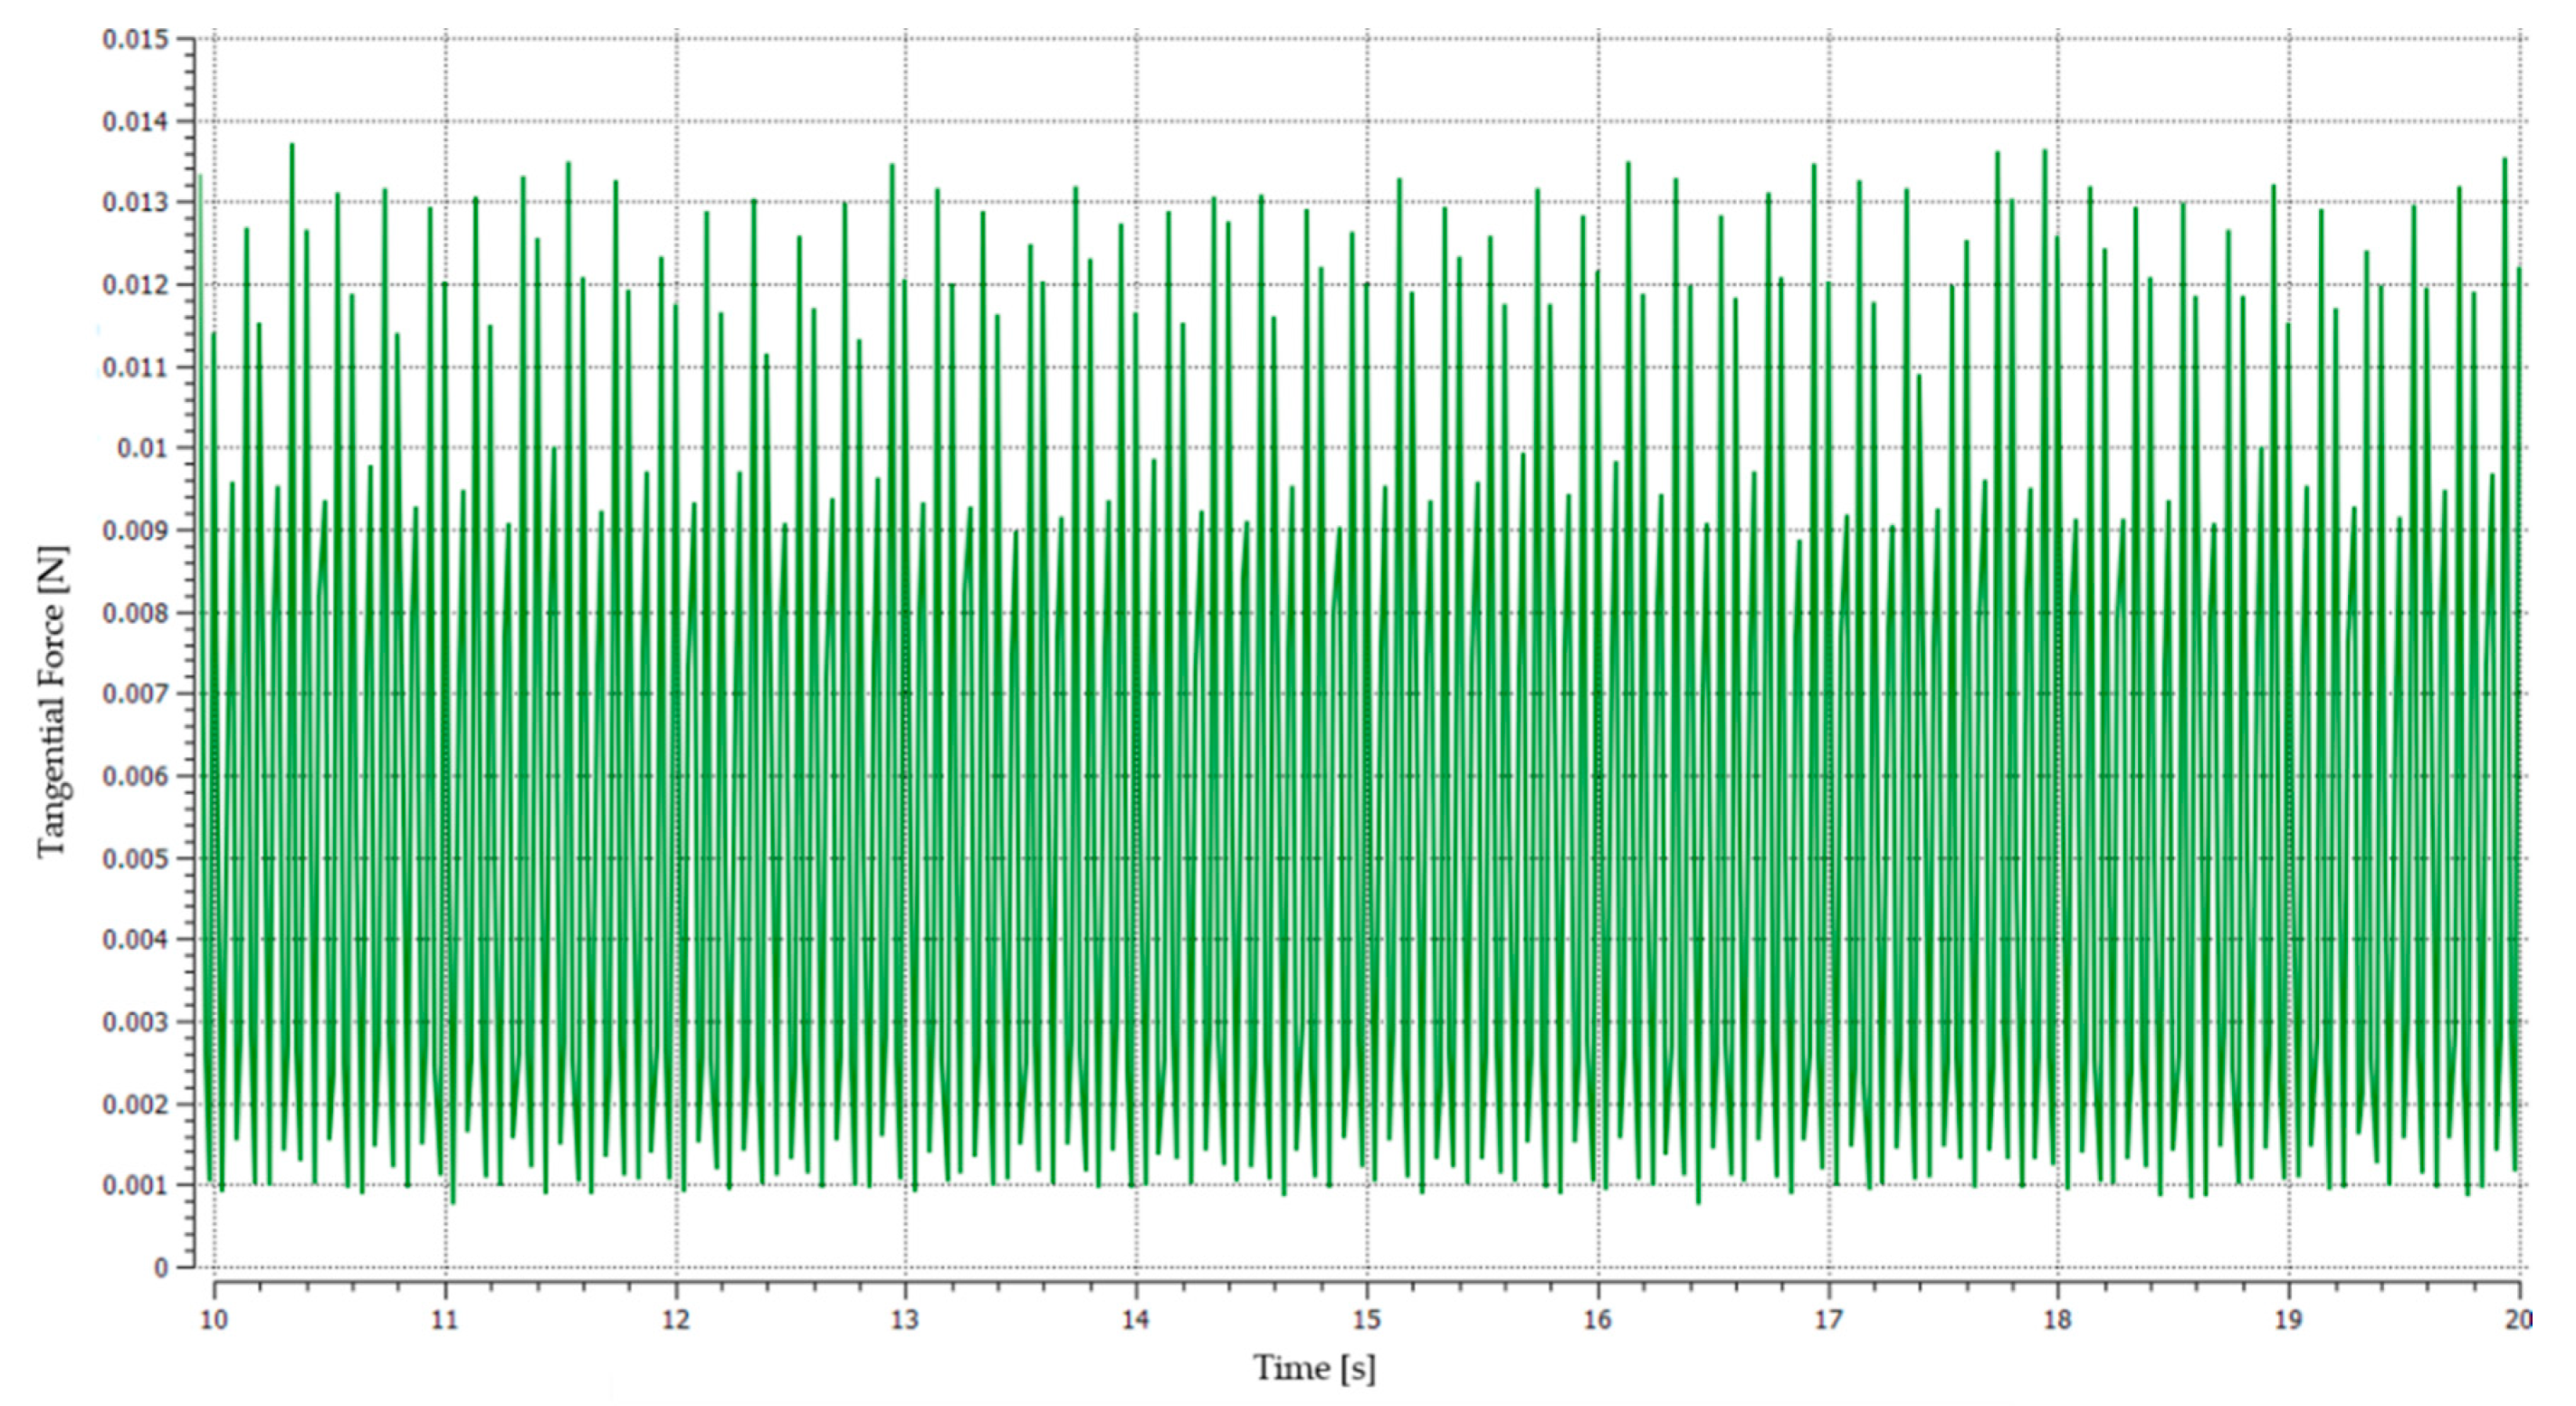
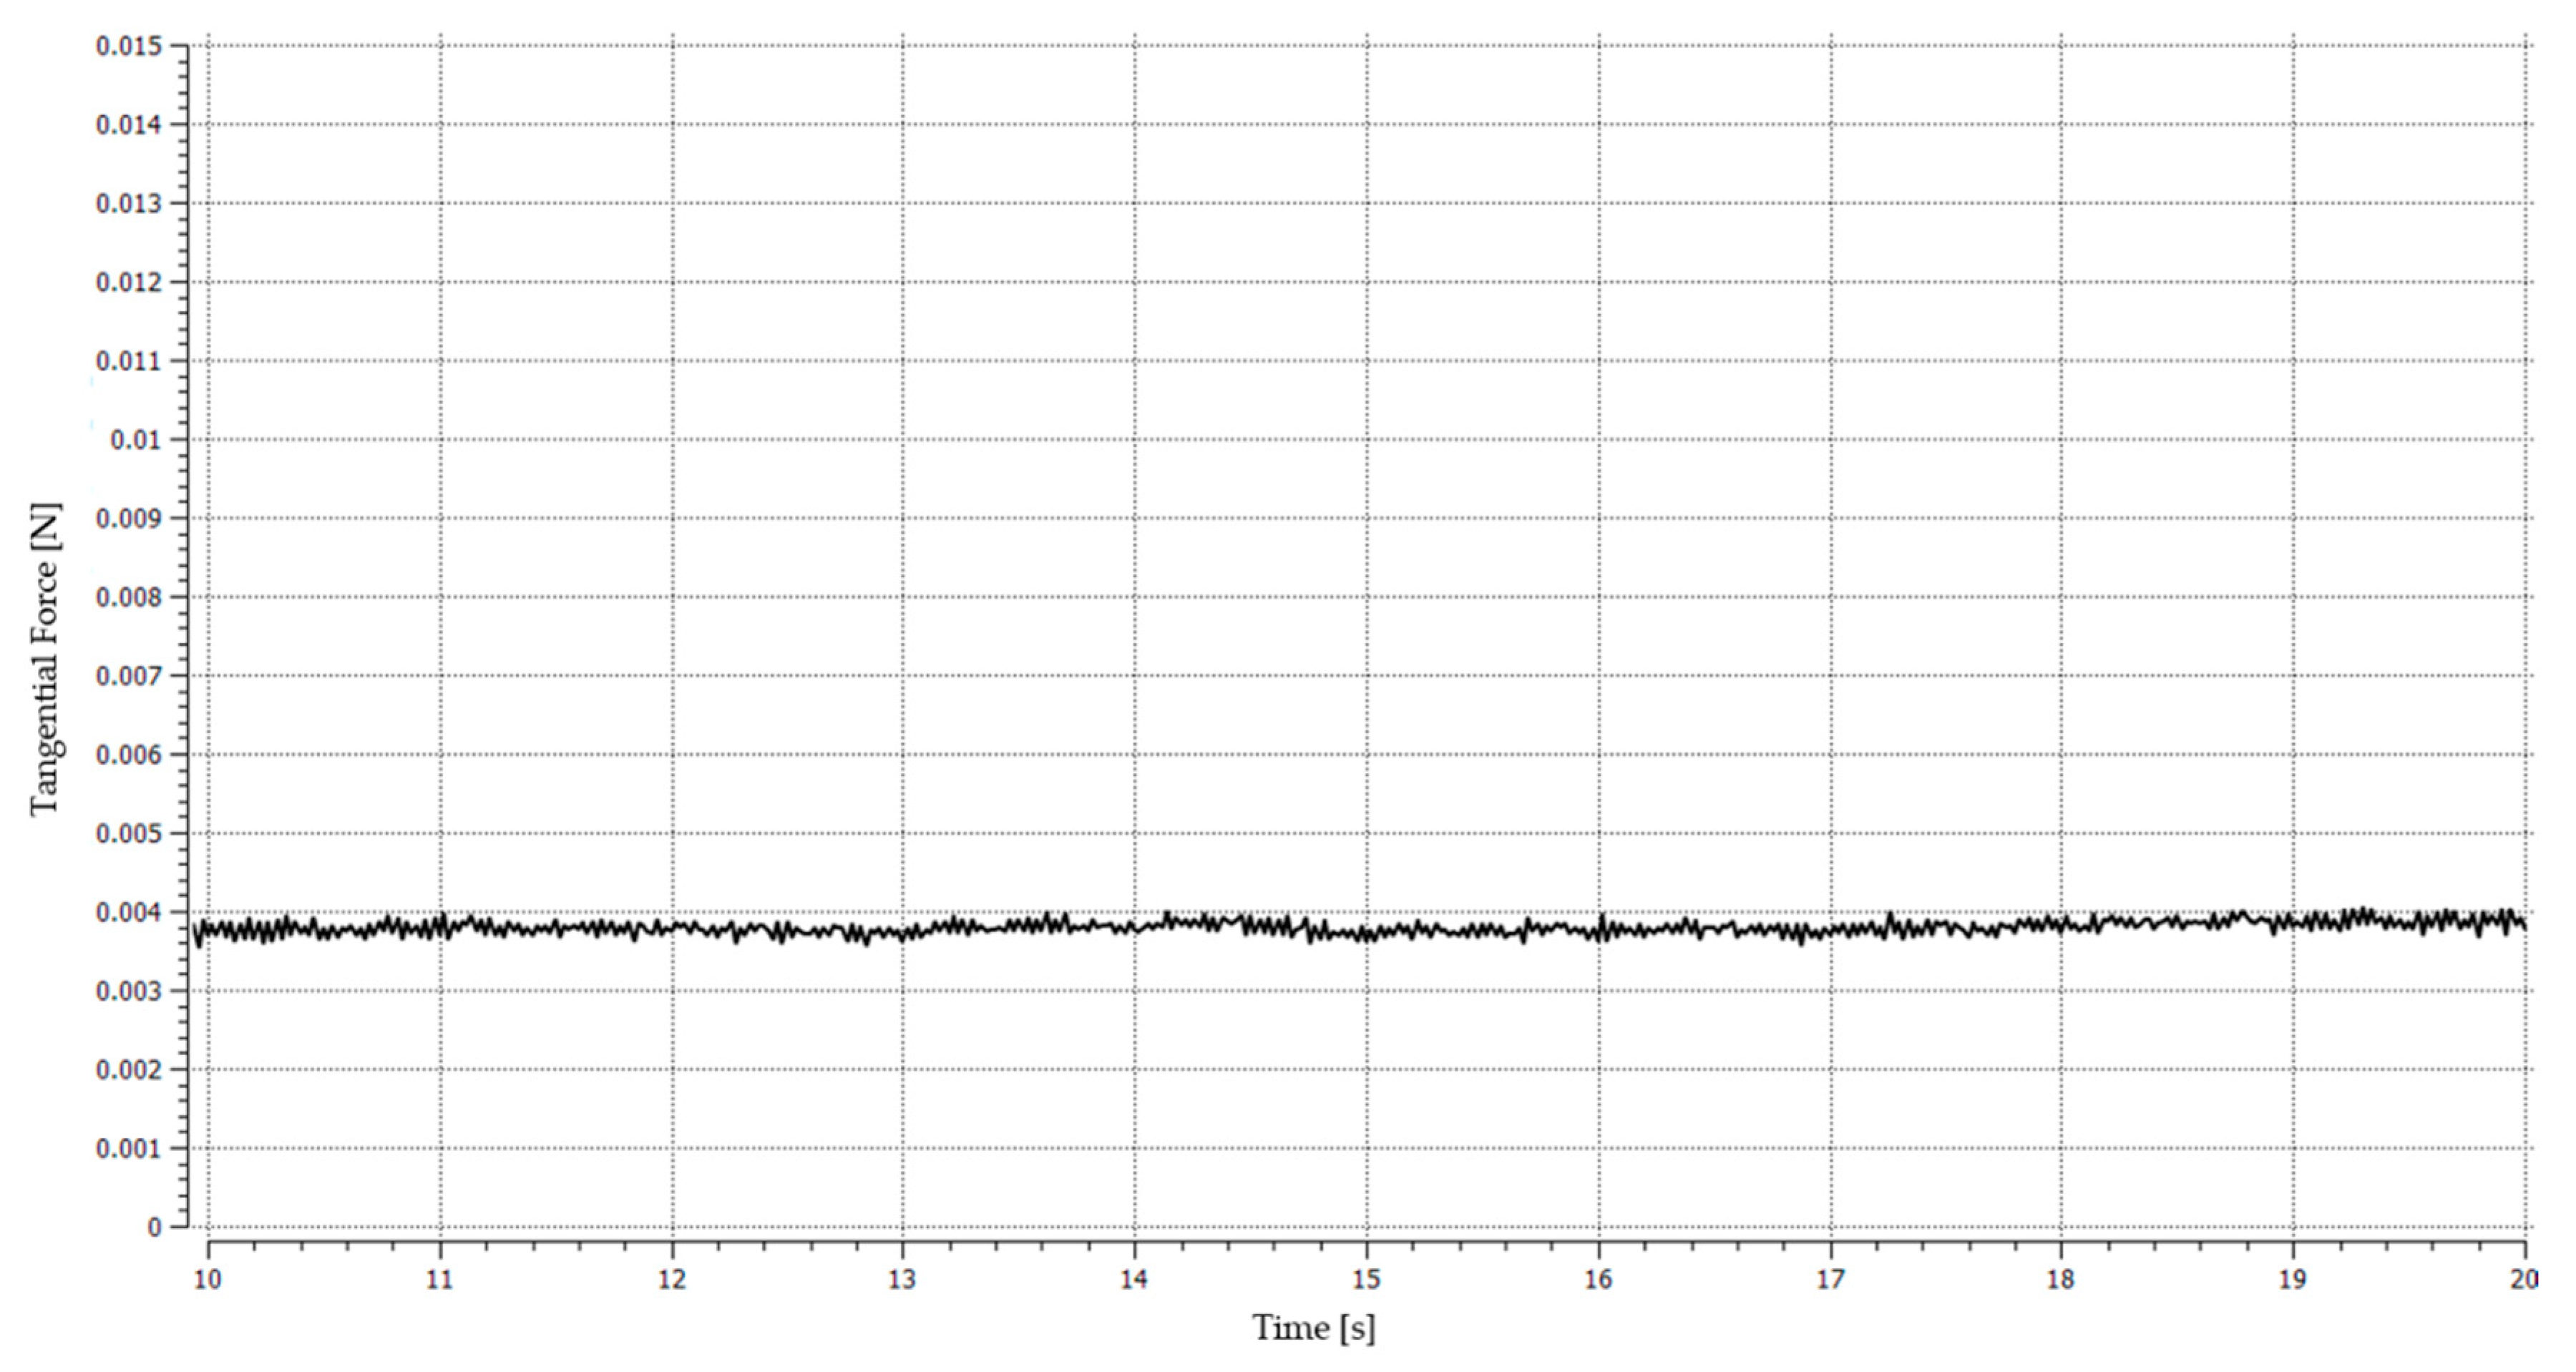
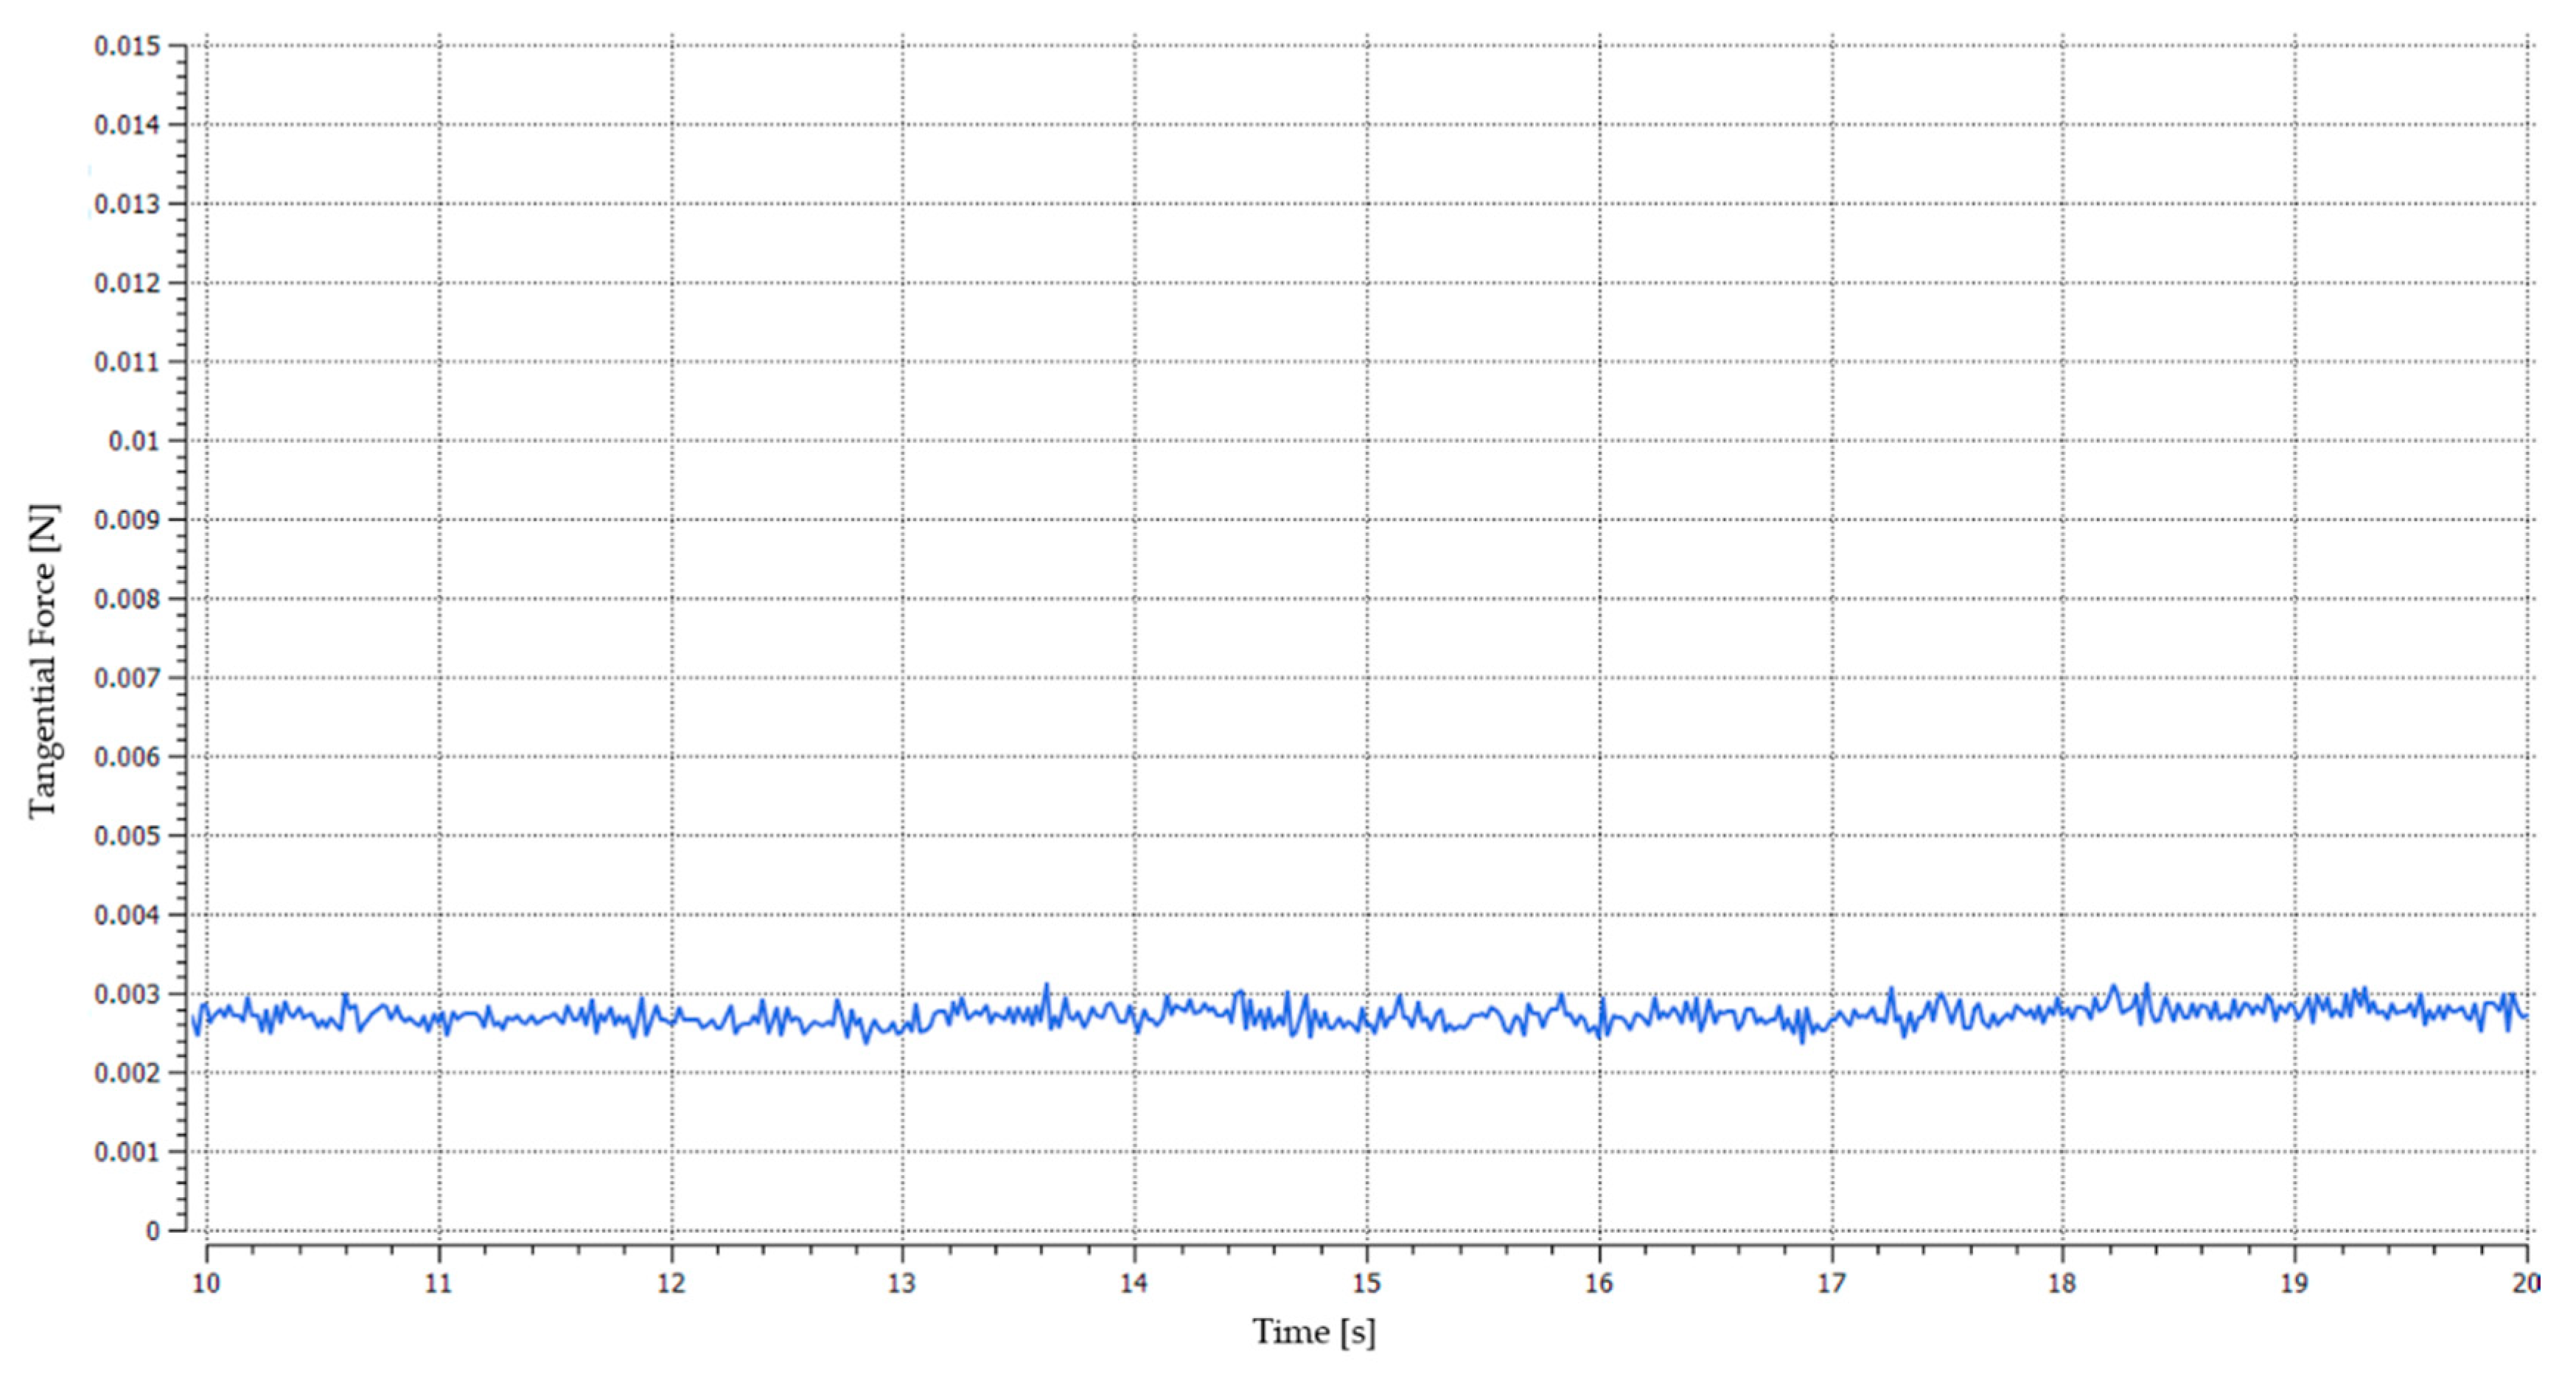
A similar character was obtained for the tangential forces acting on the fruit. Figure 9, Figure 10, Figure 11 and Figure 12 show a comparison of graphs of mean force (mean for the whole population) acting on fruits. These forces are acting on the fruit in the perpendicular movement direction of the bed. In this case, the average value after time for the vibrating feeder was 5.8 mN; while for the reciprocating feeder, it was 3.2 mN, which is about 45% less than for the vibrating feeder.
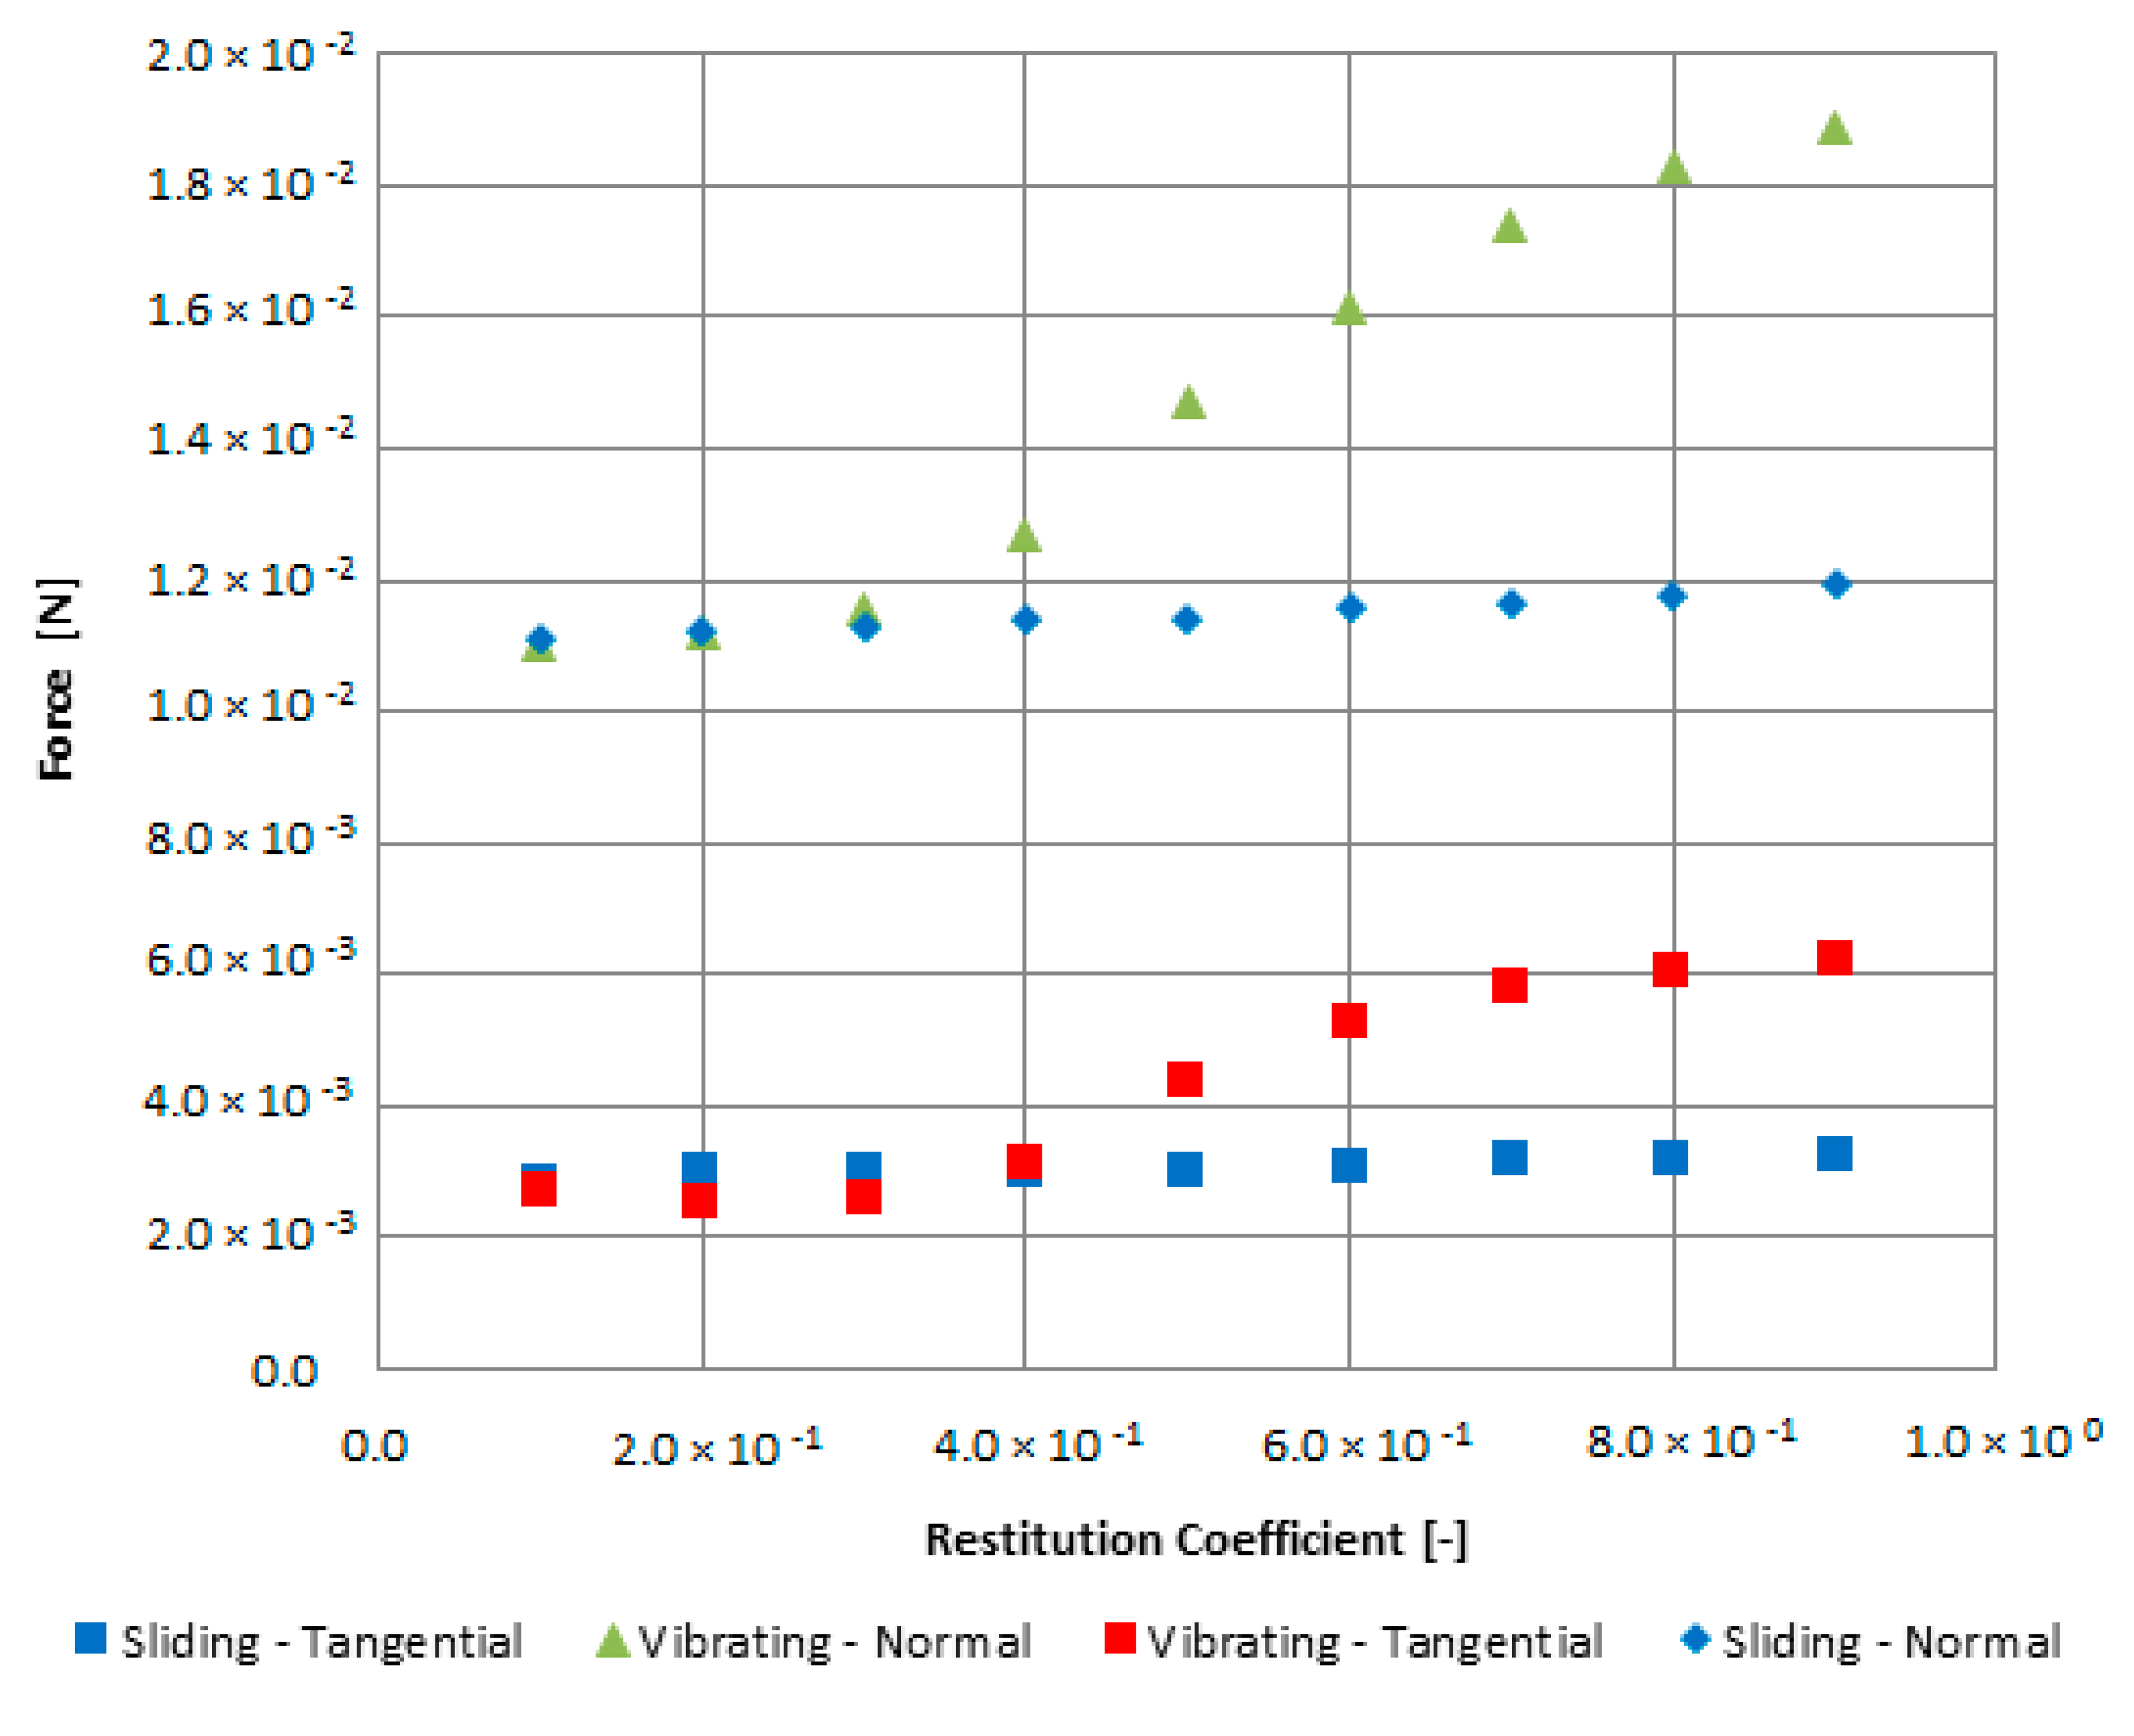
The next step after the initial analysis was to examine the changes in the forces acting on the fruit in the function of the value of the restitution coefficient [37]. This allows drawing conclusions about the differences between the two types of transport depending on the elasticity of the fruit or, for higher values of the coefficient, conclusions about the transport of frozen fruit (Figure 13). Changes in the coefficient from 0.1 to 0.9 with a step of 0.1 were adopted for the analysis. Values 0 and 1 were omitted, due to their non-physical relevance value.
The data presented in Figure 9 shows that for low values of the restitution coefficient, the differences between vibration and reciprocating transport are negligible. On the other hand, as the value of the analyzed coefficient increases, in case of vibrating transport the values of forces increase significantly at the moment when, for the feeder, these forces remain unchanged or increase slightly. This means that the quality of vibrating transport will be strongly dependent on the resilience of the fruit. The greater the elasticity, the greater the risk of damage to the fruit in vibrating transport with a constant quality of the reciprocating transport [38,39].

5. Conclusions

Based on the numerical analysis carried out, one can formulate recommendations concerning the construction of conveyors used for transporting delicate fruit (raspberry, blueberry).
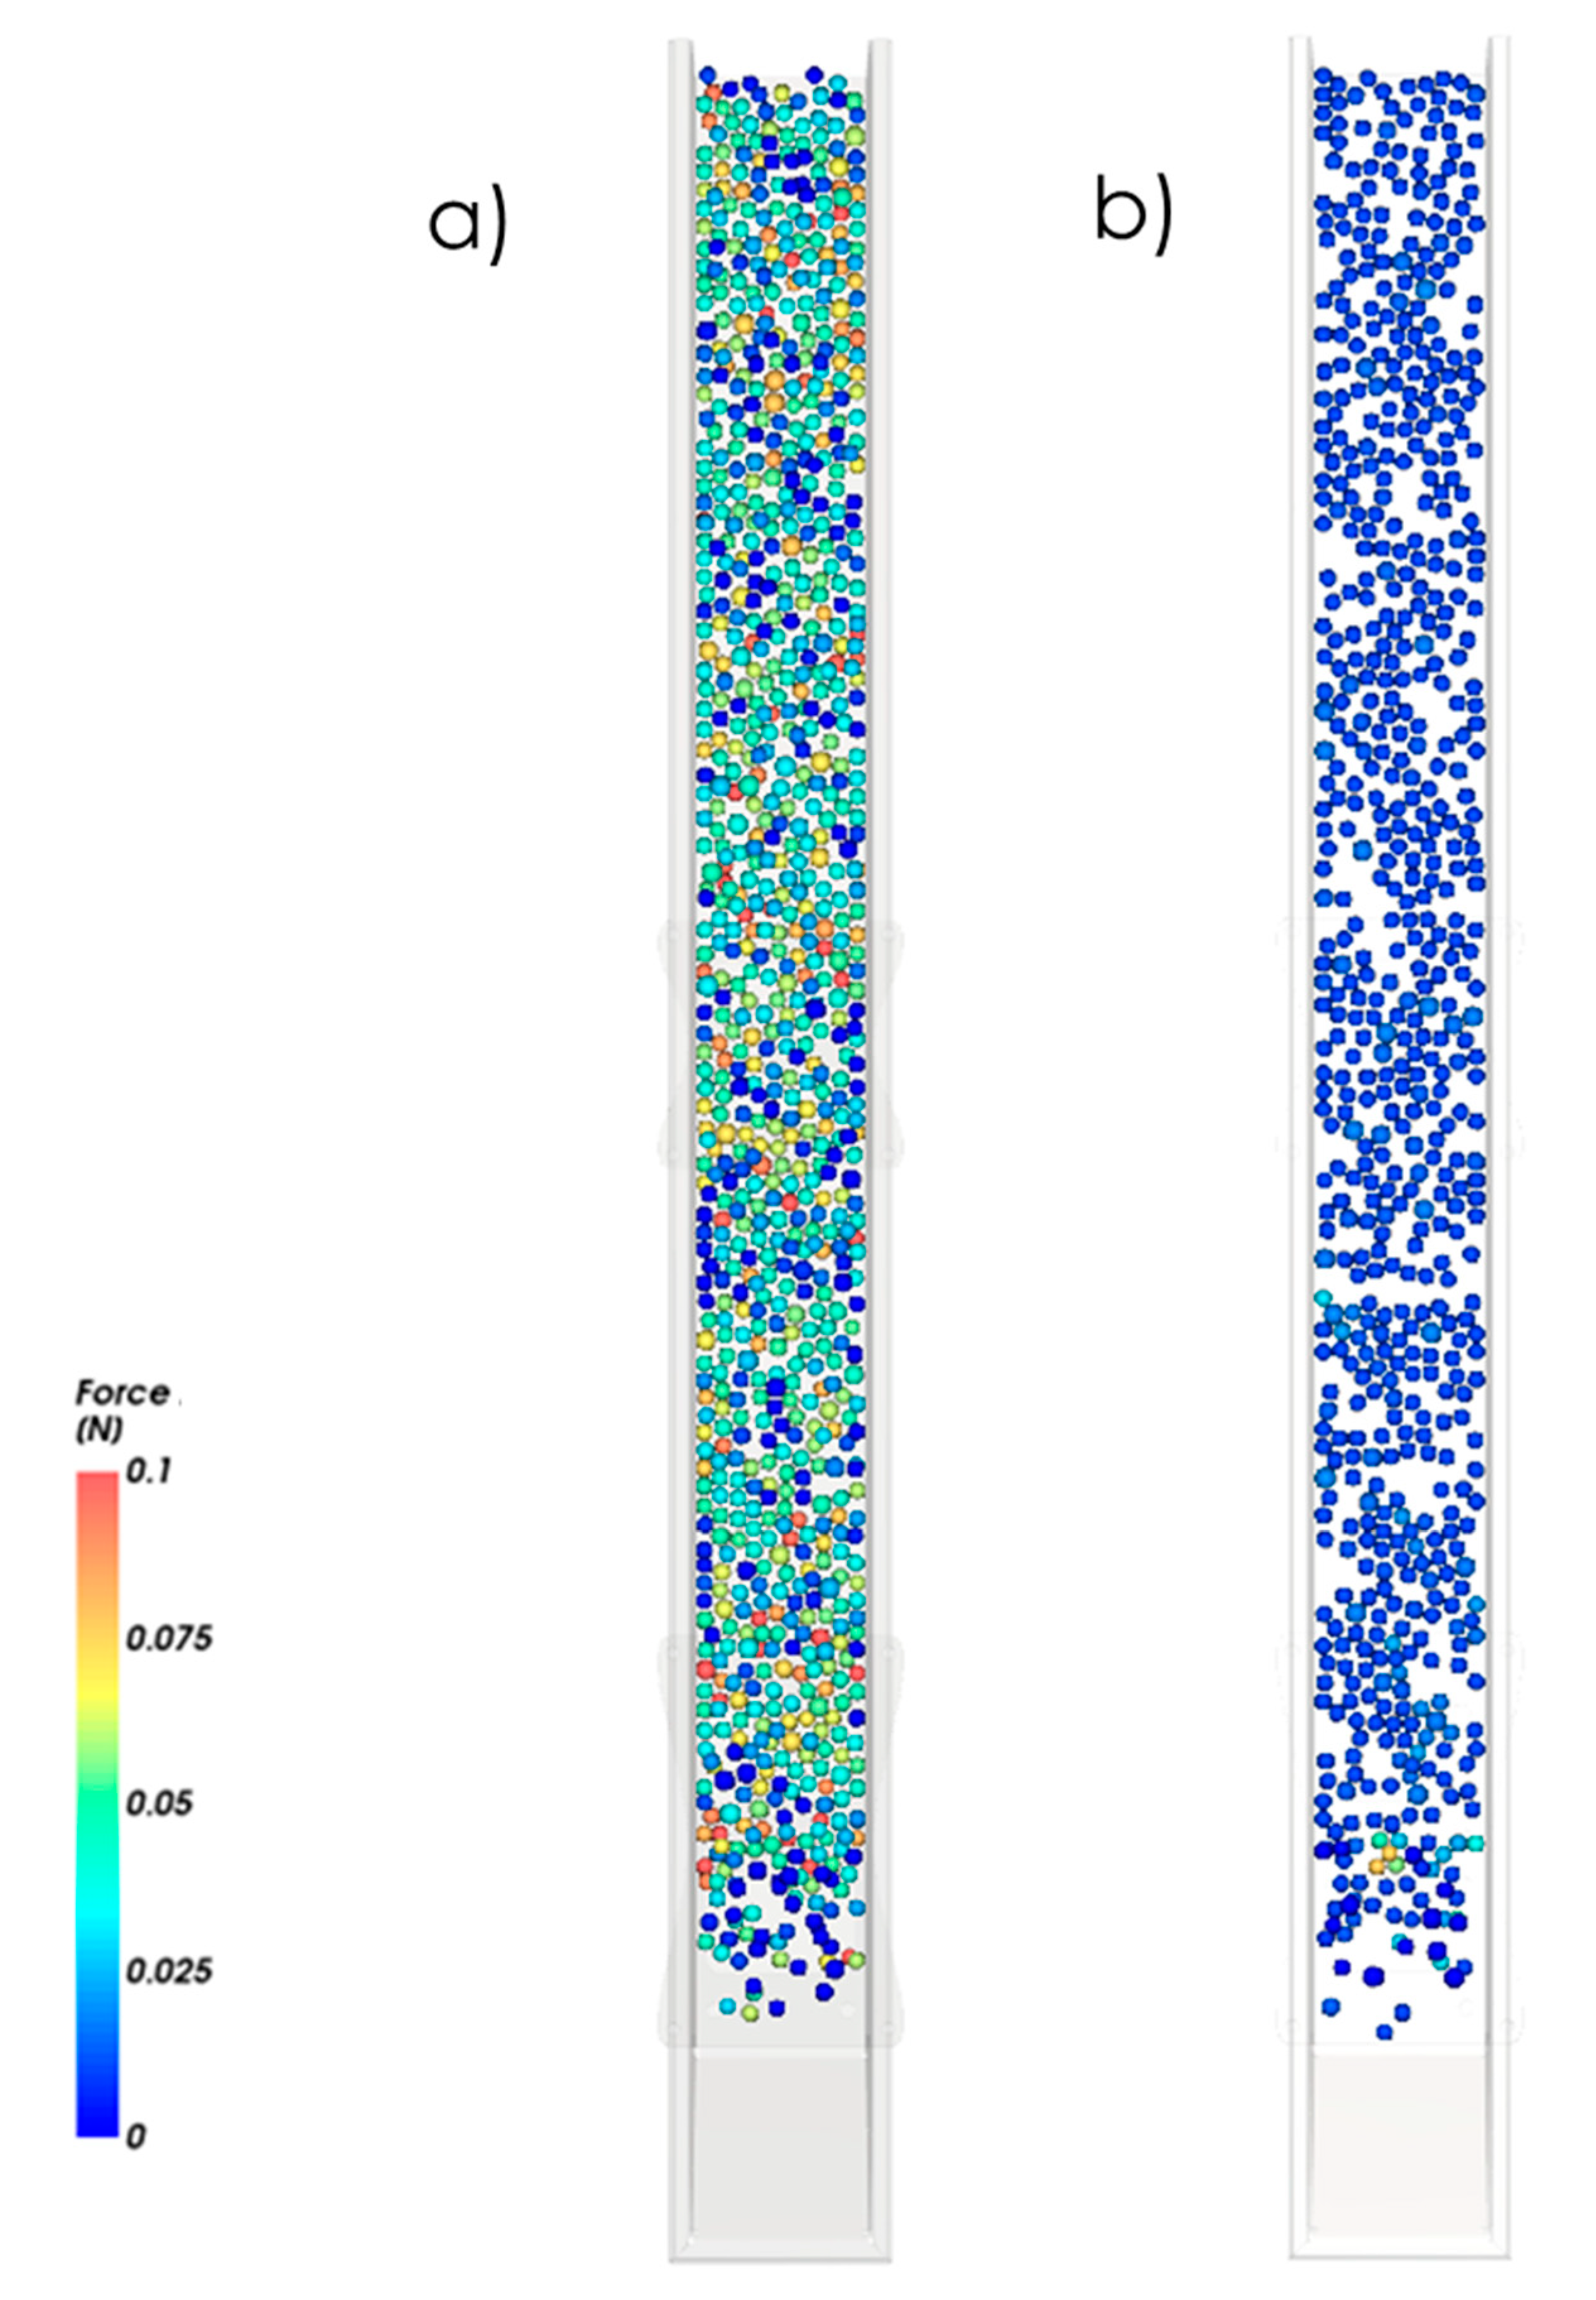
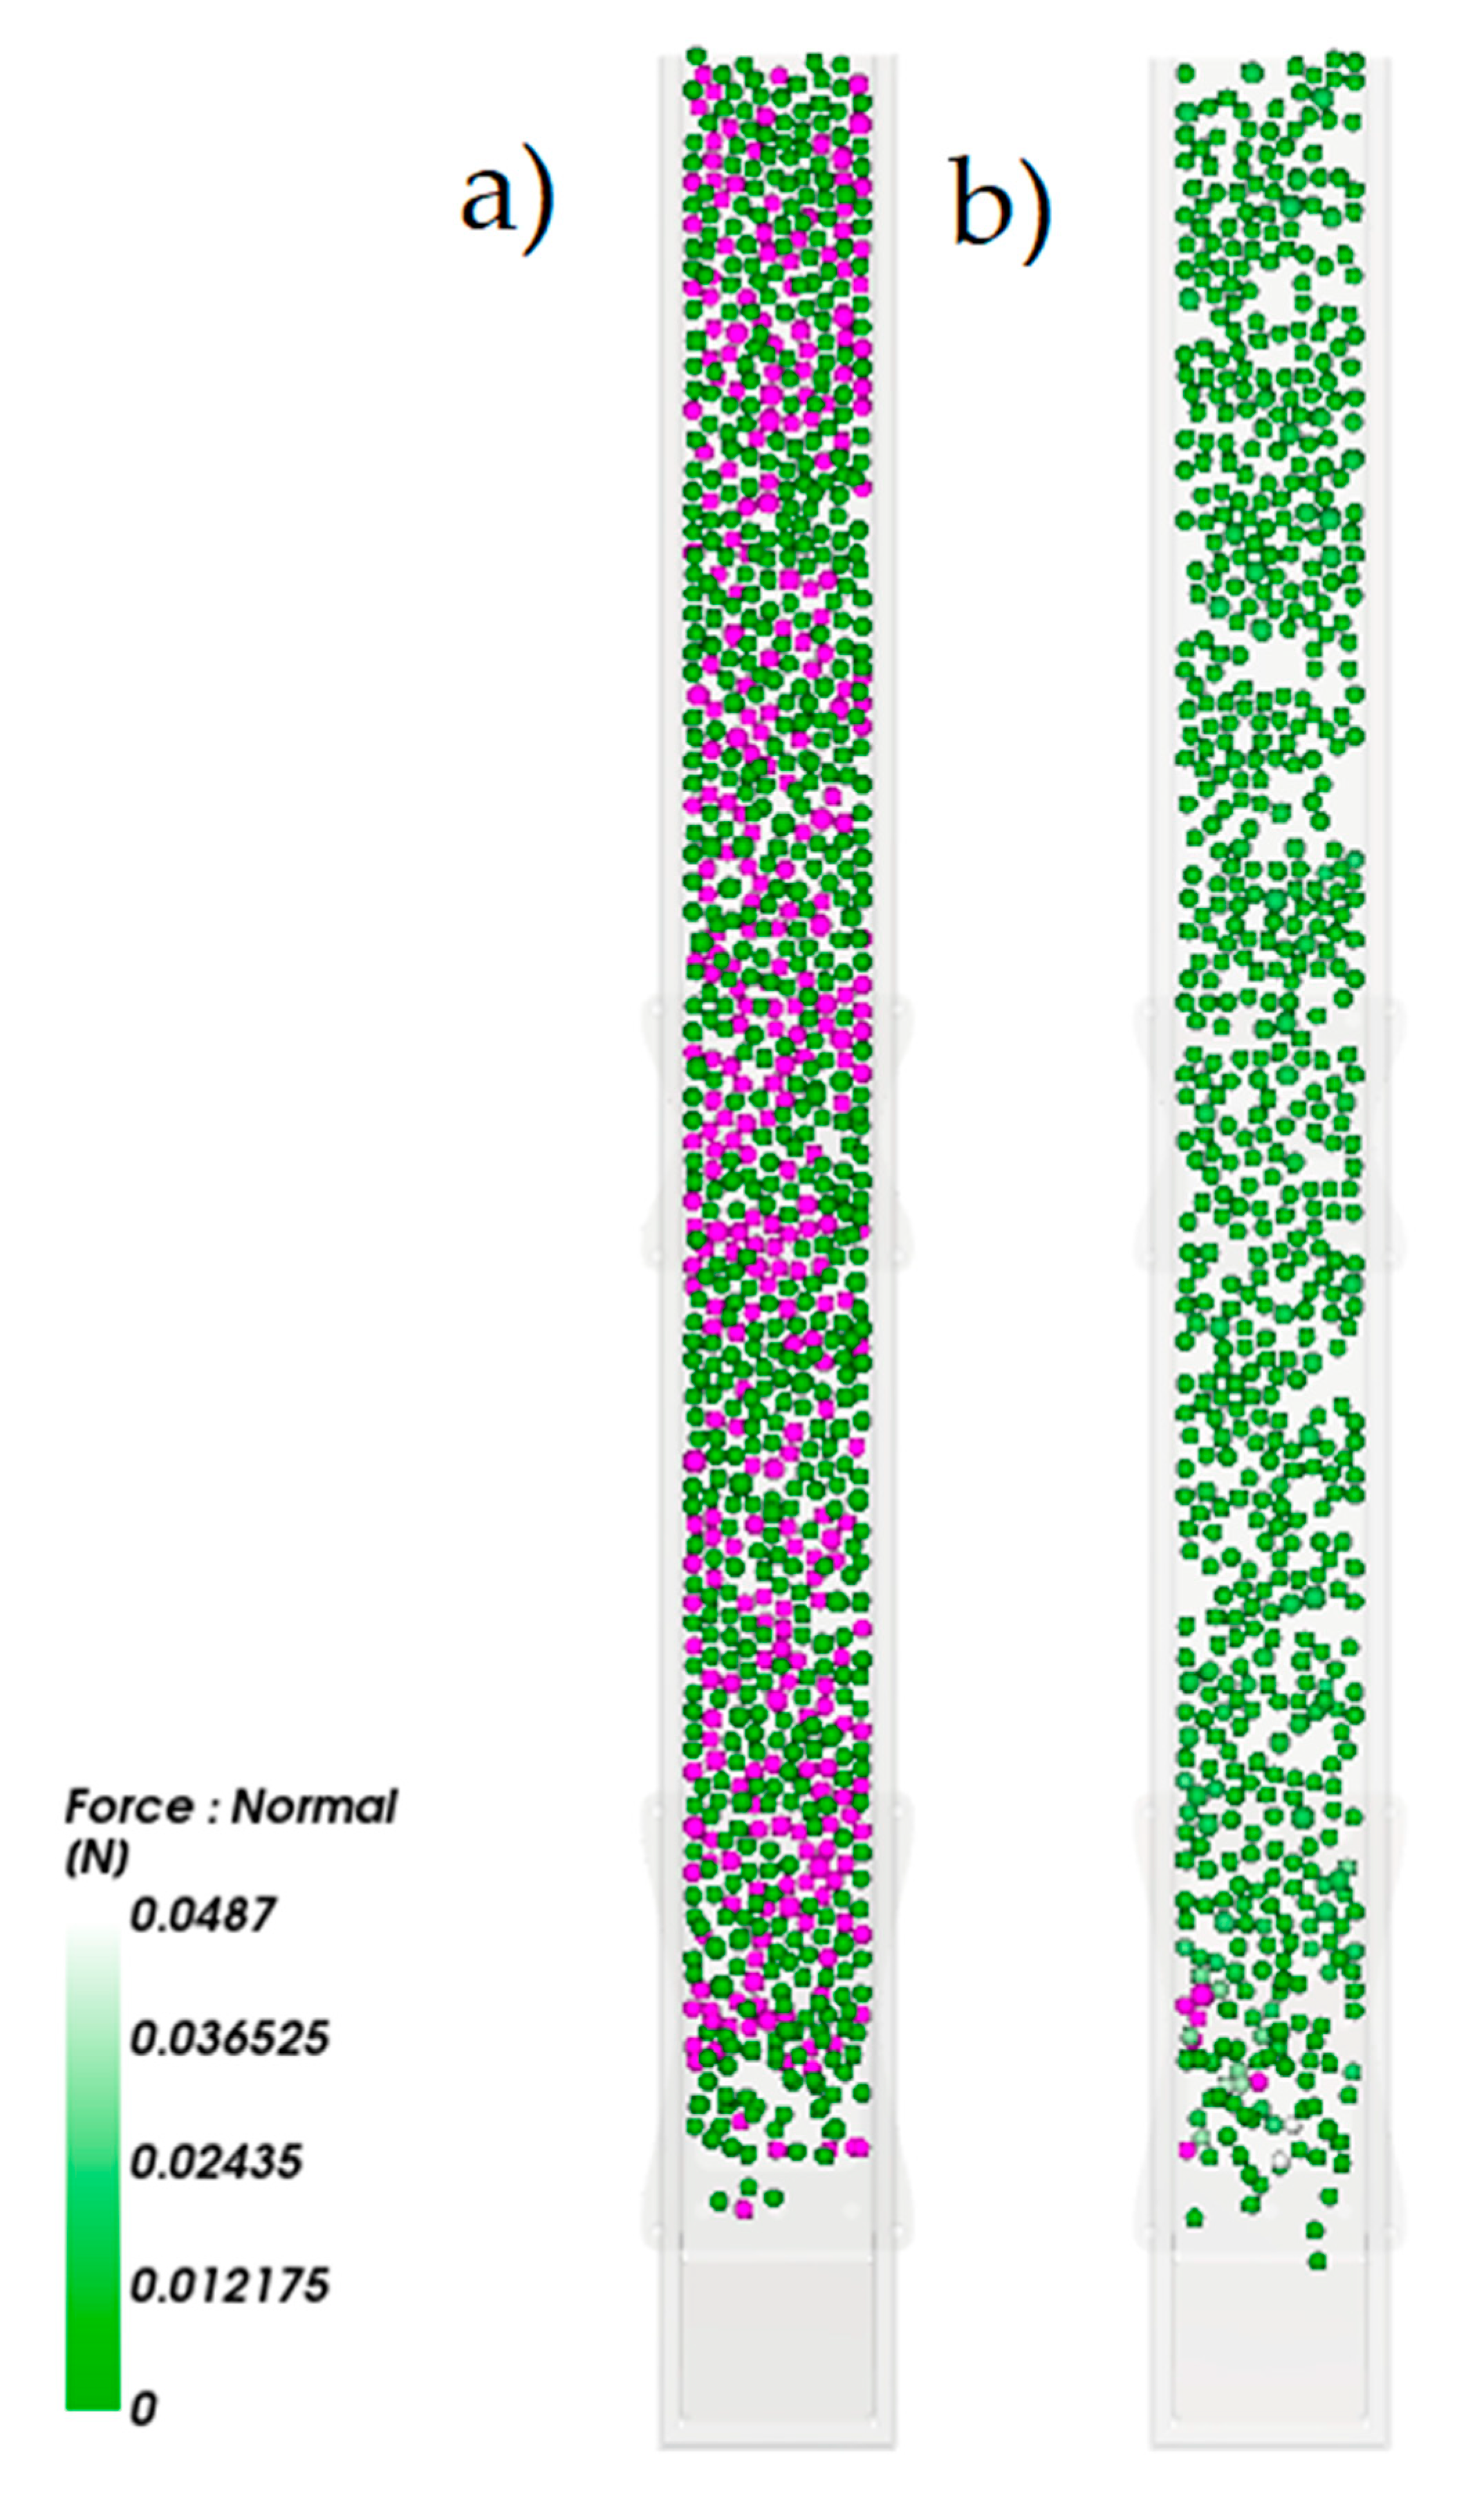
A correlation between the resilience of the fruit and the type of transport was observed. For fresh and frozen fruit, there is a significant difference between the normal acting on the fruits depending on the value. For a vibrating conveyor, an average normal force value of 17.4 mN with a deviation of forces from the average value of up to 40 mN was initially obtained. This means that the values of these forces locally could exceed the average elasticity limit of 48.7 mN for blueberries. The results of the simulation of normal forces are shown in Figure 14, Figure 15 and Figure 16. Figure 16 shows the of normal forces. For the reciprocating trough (Figure 16a), the exceedance of the elasticity limit is only visible near the filling. A small number of blueberries is marked in violet color. On the other hand, in case of the vibrating chute (Figure 16b, there are blueberries along the whole length of the conveyor, subjected to normal forces exceeding the 48.7 mN limit. The number of fruits in the twentieth second of the simulation, for which the limit value was exceeded, was 140 for the vibrating feeder and 10 fruits for the reciprocating feeder, with a total number of 1961 fruits analyzed.
The simulation clearly shows the advantage of using a conveyor with reciprocating motion for transporting blueberries and other soft fruits. There is a very limited number of fruits that can be damaged during transport, including those transported without being frozen and those frozen. The application of the Rocky DEM simulation made it possible to determine the forces acting on the transported material along the entire length of the conveyor. At the same time, the behavior of the entire deposit on the transport trough can be described. The image of the deposit enables the correct design of the geometry of the conveying device while meeting two important process criteria, namely the highest possible mass capacity of the conveyor and the lowest possible number of fruits that may be damaged. In addition, simulations of the distribution of forces affecting the transported fruit make it possible to reduce the probability of collision and to improve the design of the device (e.g., the analysis of the grits and angles increasing the uniformity of the transported deposit) [40,41]. Through changes in the input parameters (e.g., the time of moving the product on the gutter), the constructor of the device strives to optimize the construction of the device, while maintaining favorable quality parameters of the transported product [42,43,44].

Author Contributions

D.K., T.P.O., A.B., A.O., P.P., S.S.; methodology, D.K., T.P.O., A.B., A.O.; software, A.O.; validation, D.K., T.P.O, A.B., S.S., P.P., A.O.; formal analysis, D.K., T.P.O., A.B., A.O.; investigation, D.K., T.P.O., A.B., P.P., S.S., A.O.; resources, D.K., T.P.O., A.B., P.P., S.S., A.O.; data curation, D.K., T.P.O., A.B., A.O., A.O.; writing—original draft preparation, D.K., T.P.O., A.B., A.O.; writing—review and editing, D.K., T.P.O., A.B., A.O.; visualization, D.K., T.P.O., A.B., A.O.; supervision, D.K., T.P.O., A.B., A.O.; project administration, D.K., T.P.O., A.B., A.O., S.S.; funding acquisition, D.K., T.P.O., A.B., A.O., P.P., S.S. All authors have read and agreed to the published version of the manuscript.

Funding

This research was funded by the “Industrial Doctorate” project implemented at the Faculty of Biotechnology and Food Sciences of the Technical University of Lodz, contract No. 40/DW/2017/01/1, financed in the years 2017–2021.

Conflicts of Interest

The authors declare no conflict of interest.

References

  1. Zhong, W.; Yu, A.; Liu, X.; Tong, Z.; Zhang, H. DEM/CFD-DEM modelling of non-spherical particulate systems: Theoretical developments and applications. Powder Technol. 2016, 302, 108–152. [Google Scholar] [CrossRef]
  2. Lu, G.; Third, J.; Chen, J. Discrete element models for non-spherical particle systems: From theoretical developments to applications. Chem. Eng. Sci. 2015, 127, 425–465. [Google Scholar] [CrossRef]
  3. Fonte, C.B.; Oliveira, J.A.J.; De Almeida, J.; Lucilla, C. DEM-CFD Coupling: Mathematical modelling and case studies using Rocky-DEM® and Ansys Fluent®. In Proceedings of the 11th International Conference on CFD in the Minerals and Process Industries, CSIRO, Melbourne, Australia, 7–9 December 2015; pp. 1–7. [Google Scholar]
  4. Holt, J.E.; Schoorl, D. Mechanics of failure in fruits and vegetables. J. Texture Stud. 1982, 13, 83–96. [Google Scholar] [CrossRef]
  5. Menesatti, P.; Paglia, G. PH—Postharvest technology: Development of a drop damage index of fruit resistance to damage. J. Agric. Eng. Res. 2001, 80, 53–64. [Google Scholar] [CrossRef]
  6. Höhne, T.; Rayya, A.; Montoya, G. Numerical modelling of horizontal oil-water pipe flow. Energies 2020, 13, 5042. [Google Scholar] [CrossRef]
  7. Tang, W.; Roman, D.; Dickie, R.; Robu, V.; Flynn, D. Prognostics and health management for the optimization of marine hybrid energy systems. Energies 2020, 13, 4676. [Google Scholar] [CrossRef]
  8. Viccione, G.; Stoppiello, M.G.; Lauria, S.; Cascini, L. Numerical modeling on fate and transport of pollutants in the vadose zone. Environ. Sci. Proc. 2020, 2, 34. [Google Scholar] [CrossRef]
  9. Manenti, S.; Wang, D.; Domínguez, J.M.; Li, S.; Amicarelli, A.; Albano, R. SPH modeling of water-related natural hazards. Water 2019, 11, 1875. [Google Scholar] [CrossRef] [Green Version]
  10. Gibaud, R. Application of the Discrete Element Method to Finite Inelastic Strain in Multi-Materials. Ph.D. Thesis, Université Grenoble Alpes, Saint-Martin-d’Hères, France, 2017. [Google Scholar]
  11. Kryszak, D.; Olejnik, T.P. Linear motion mechanisms in the transport of loose products in the food industry. Przemysł Spożywczy 2018, 12, 42. [Google Scholar] [CrossRef]
  12. Ayaz, F.A.; Kadioglu, A.; Bertift, E.; Acar, C.; Turna, I. Effect of fruit maturation on sugar and organic acid composition in two blueberries (Vaccinium arctostaphylos and V. myrtillus) native to Turkey. N. Z. J. Crop Hortic. Sci. 2010, 29, 137–141. [Google Scholar] [CrossRef]
  13. Freireich, B.; Litster, J.; Wassgren, C.R. Using the discrete element method to predict collision-scale behavior: A sensitivity analysis. Chem. Eng. Sci. 2009, 64, 3407–3416. [Google Scholar] [CrossRef]
  14. Kowal, K. Zagrożenia mikrobiologiczne produktów owocowych i warzywnych. Przemysł Spożywczy 2014, 6, 28–30. [Google Scholar]
  15. Li, L.; Pegg, R.B.; Eitenmiller, R.; Chun, J.; Kerrihard, A. Selected nutrient analyses of fresh, fresh-stored and frozen fruits and vegetables. J. Food Compos. Anal. 2017, 59, 8–17. [Google Scholar] [CrossRef]
  16. Tuzcu, E.T.; Rajamani, R.K. Modeling breakage rates in mills with impact energy spectra and ultra fast load cell data. Miner. Eng. 2011, 24, 252–260. [Google Scholar] [CrossRef]
  17. Kojima, T.; Liu, J.; Fujita, S.; Inaba, S.; Tanaka, M.; Tatara, I. Analysis of vibration and its effects on strawberries during highway transport. J. Soc. Agric. Struct. 1999, 29, 197–203. [Google Scholar]
  18. Nakamura, N.; Inatsu, Y.; Kawamoto, S.; Okadome, H.; Nakano, H.; Maezawa, S.; Shiina, T. Effect of vibration on the bacterial growth on strawberry fruits. J. Food Agric. Environ. 2014, 5, 44–48. [Google Scholar]
  19. Tartakovskya, A.M.; Ferrisa, K.F.; Meakin, P. Lagrangian particle model for multiphase flows. Comput. Phys. Commun. 2009, 180, 1874–1881. [Google Scholar] [CrossRef]
  20. Guo, Y.; Curtis, J.S. Discrete element method simulations for complex granular flows. Annu. Rev. Fluid Mech. 2015, 47, 21–46. [Google Scholar] [CrossRef]
  21. DEM Technical Manual. Available online: https://rocky.esss.co/technical-library/ (accessed on 20 December 2019).
  22. Walton, O.R.; Braun, R.L. Viscosity, granular-temperature, and stress calculations for shearing assemblies of inelastic, frictional disks. J. Rheol. 1986, 30, 949–980. [Google Scholar] [CrossRef]
  23. Almeida, E.; Spogis, N.; Silva, M.A. Computational study of the pneumatic separation of sugarcane bagasse. In Proceedings of the 6th International Conference on Engineering for Waste and Biomass Valorisation, Albi, France, 23–26 May 2016; pp. 1–16. [Google Scholar]
  24. ESSS-Rocky. Rocky-Dem Technical Manual; Engineering Simulation and Scientific Software: Rio de Janeiro, Brazil, 2018; pp. 4–6. [Google Scholar]
  25. Walton, O.R. Numerical simulation of inelastic, frictional particle interactions. In Two-Phase Flow, 2nd ed.; Roco, M.C., Ed.; Butterworth-Heinemann, a Division of Reed Publishing (USA) Inc.: Oxford, UK, 1993; pp. 855–947. [Google Scholar]
  26. Company Advertising Materials Mysak Group. Available online: http://www.przenosnikitransportowe.pl/produkt9.html (accessed on 20 September 2020).
  27. Goździecki, M.; Świątkiewicz, H. Przenośniki; WNT: Warsaw, Poland, 1979. [Google Scholar]
  28. Hua, M.H.; Dong, Q.L.; Liu, B.L.; Umezuruike, L.; Chen, O.L. Estimating blueberry mechanical properties based on random frog selected hyperspectral data. Postharvest Biol. Technol. 2015, 106, 1–10. [Google Scholar] [CrossRef]
  29. Heim, A.; Olejnik, T.P.; Pawlak, A. Using statistical moments to describe grinding in a ball mill for industrial-scale process. Chem. Eng. Process. 2005, 44, 263–266. [Google Scholar] [CrossRef]
  30. Olejnik, T.P. Milling kinetics of chosen rock materials under dry conditions considering strength and statistical properties of bed. Physicochem. Probl. Miner. Process. 2011, 46, 145–154. [Google Scholar]
  31. Olejnik, T.P. Analysis of the breakage rate function for selected process parameters in quartzite milling. Chem. Process Eng. 2012, 33, 117–129. [Google Scholar] [CrossRef]
  32. Olejnik, T.P. Kinetics of gringing ceramic bulk considering grinding media contact points. Physicochem. Probl. Miner. Process. 2010, 44, 187–194. [Google Scholar]
  33. Ławińska, K.; Modrzewski, R.; Serweta, W. The phenomenon of screen blocking for mixtures of varying blocking grain content. Gospod. Surowcami Miner. 2018, 34, 83–95. [Google Scholar]
  34. Ai, J.; Chen, J.F.; Rotter, J.M.; Ooi, J.Y. Assessment of rolling resistance models in discrete element simulations. Powder Technol. 2010, 206, 269–282. [Google Scholar] [CrossRef]
  35. Heim, A.; Solecki, M. Yeast disintegration in a classical bead mill equipped with stationary baffles. Chem. Process Eng. 2002, 23, 5–19. [Google Scholar]
  36. Lawinska, K.; Wodzinki, P.; Modrzewski, P. Verification of the mathematical model of the screen blocking process. Powder Technol. 2014, 256, 506–511. [Google Scholar] [CrossRef]
  37. Jewiarz, M.; Wróbel, M.; Mudryk, K.; Szufa, S. Impact of the drying temperature and grinding technique on biomass grindability. Energies 2020, 13, 3392. [Google Scholar] [CrossRef]
  38. Ławińska, K.; Szufa, S.; Obraniak, A.; Olejnik, T.; Siuda, R.; Kwiatek, J.; Ogrodowczyk, D. Disc granulation process of carbonation lime mud as a method of post-production waste management. Energies 2020, 13, 3419. [Google Scholar] [CrossRef]
  39. Wautier, A.; Bonelli, S.; Nicot, F. Scale separation between grain detachment and grain transport in granular media subjected to an internal flow. Granul. Matter 2017, 19, 22. [Google Scholar] [CrossRef] [Green Version]
  40. Zhang, S.; Cheng, X. Small-strain shear moduli modeling of sand: A non-equilibrium thermodynamic approach, including an application to Leighton Buzzard sand. Granul. Matter 2019, 21, 68. [Google Scholar] [CrossRef]
  41. Liu, L.; Bo, T. A study on the initiation of saltation in the model of wind-blown sand transport considering the effect of turbulence. Granul. Matter 2019, 21, 78. [Google Scholar] [CrossRef]
  42. Maeda, K.; Sakai, H.; Kondo, A.; Yamaguchi, T.; Fukuma, M.; Nukudani, E. Stress-chain based micromechanics of sand with grain shape effect. Granul. Matter 2010, 12, 499–505. [Google Scholar] [CrossRef]
  43. Cabrera, M.A.; Wu, W. Experimental modelling of free-surface dry granular flows under a centrifugal acceleration field. Granul. Matter 2017, 19, 78. [Google Scholar] [CrossRef]
  44. Gilberg, D.; Steiner, K. Size segregation in compressible granular shear flows of binary particle systems. Granul. Matter 2020, 22, 45. [Google Scholar] [CrossRef] [Green Version]
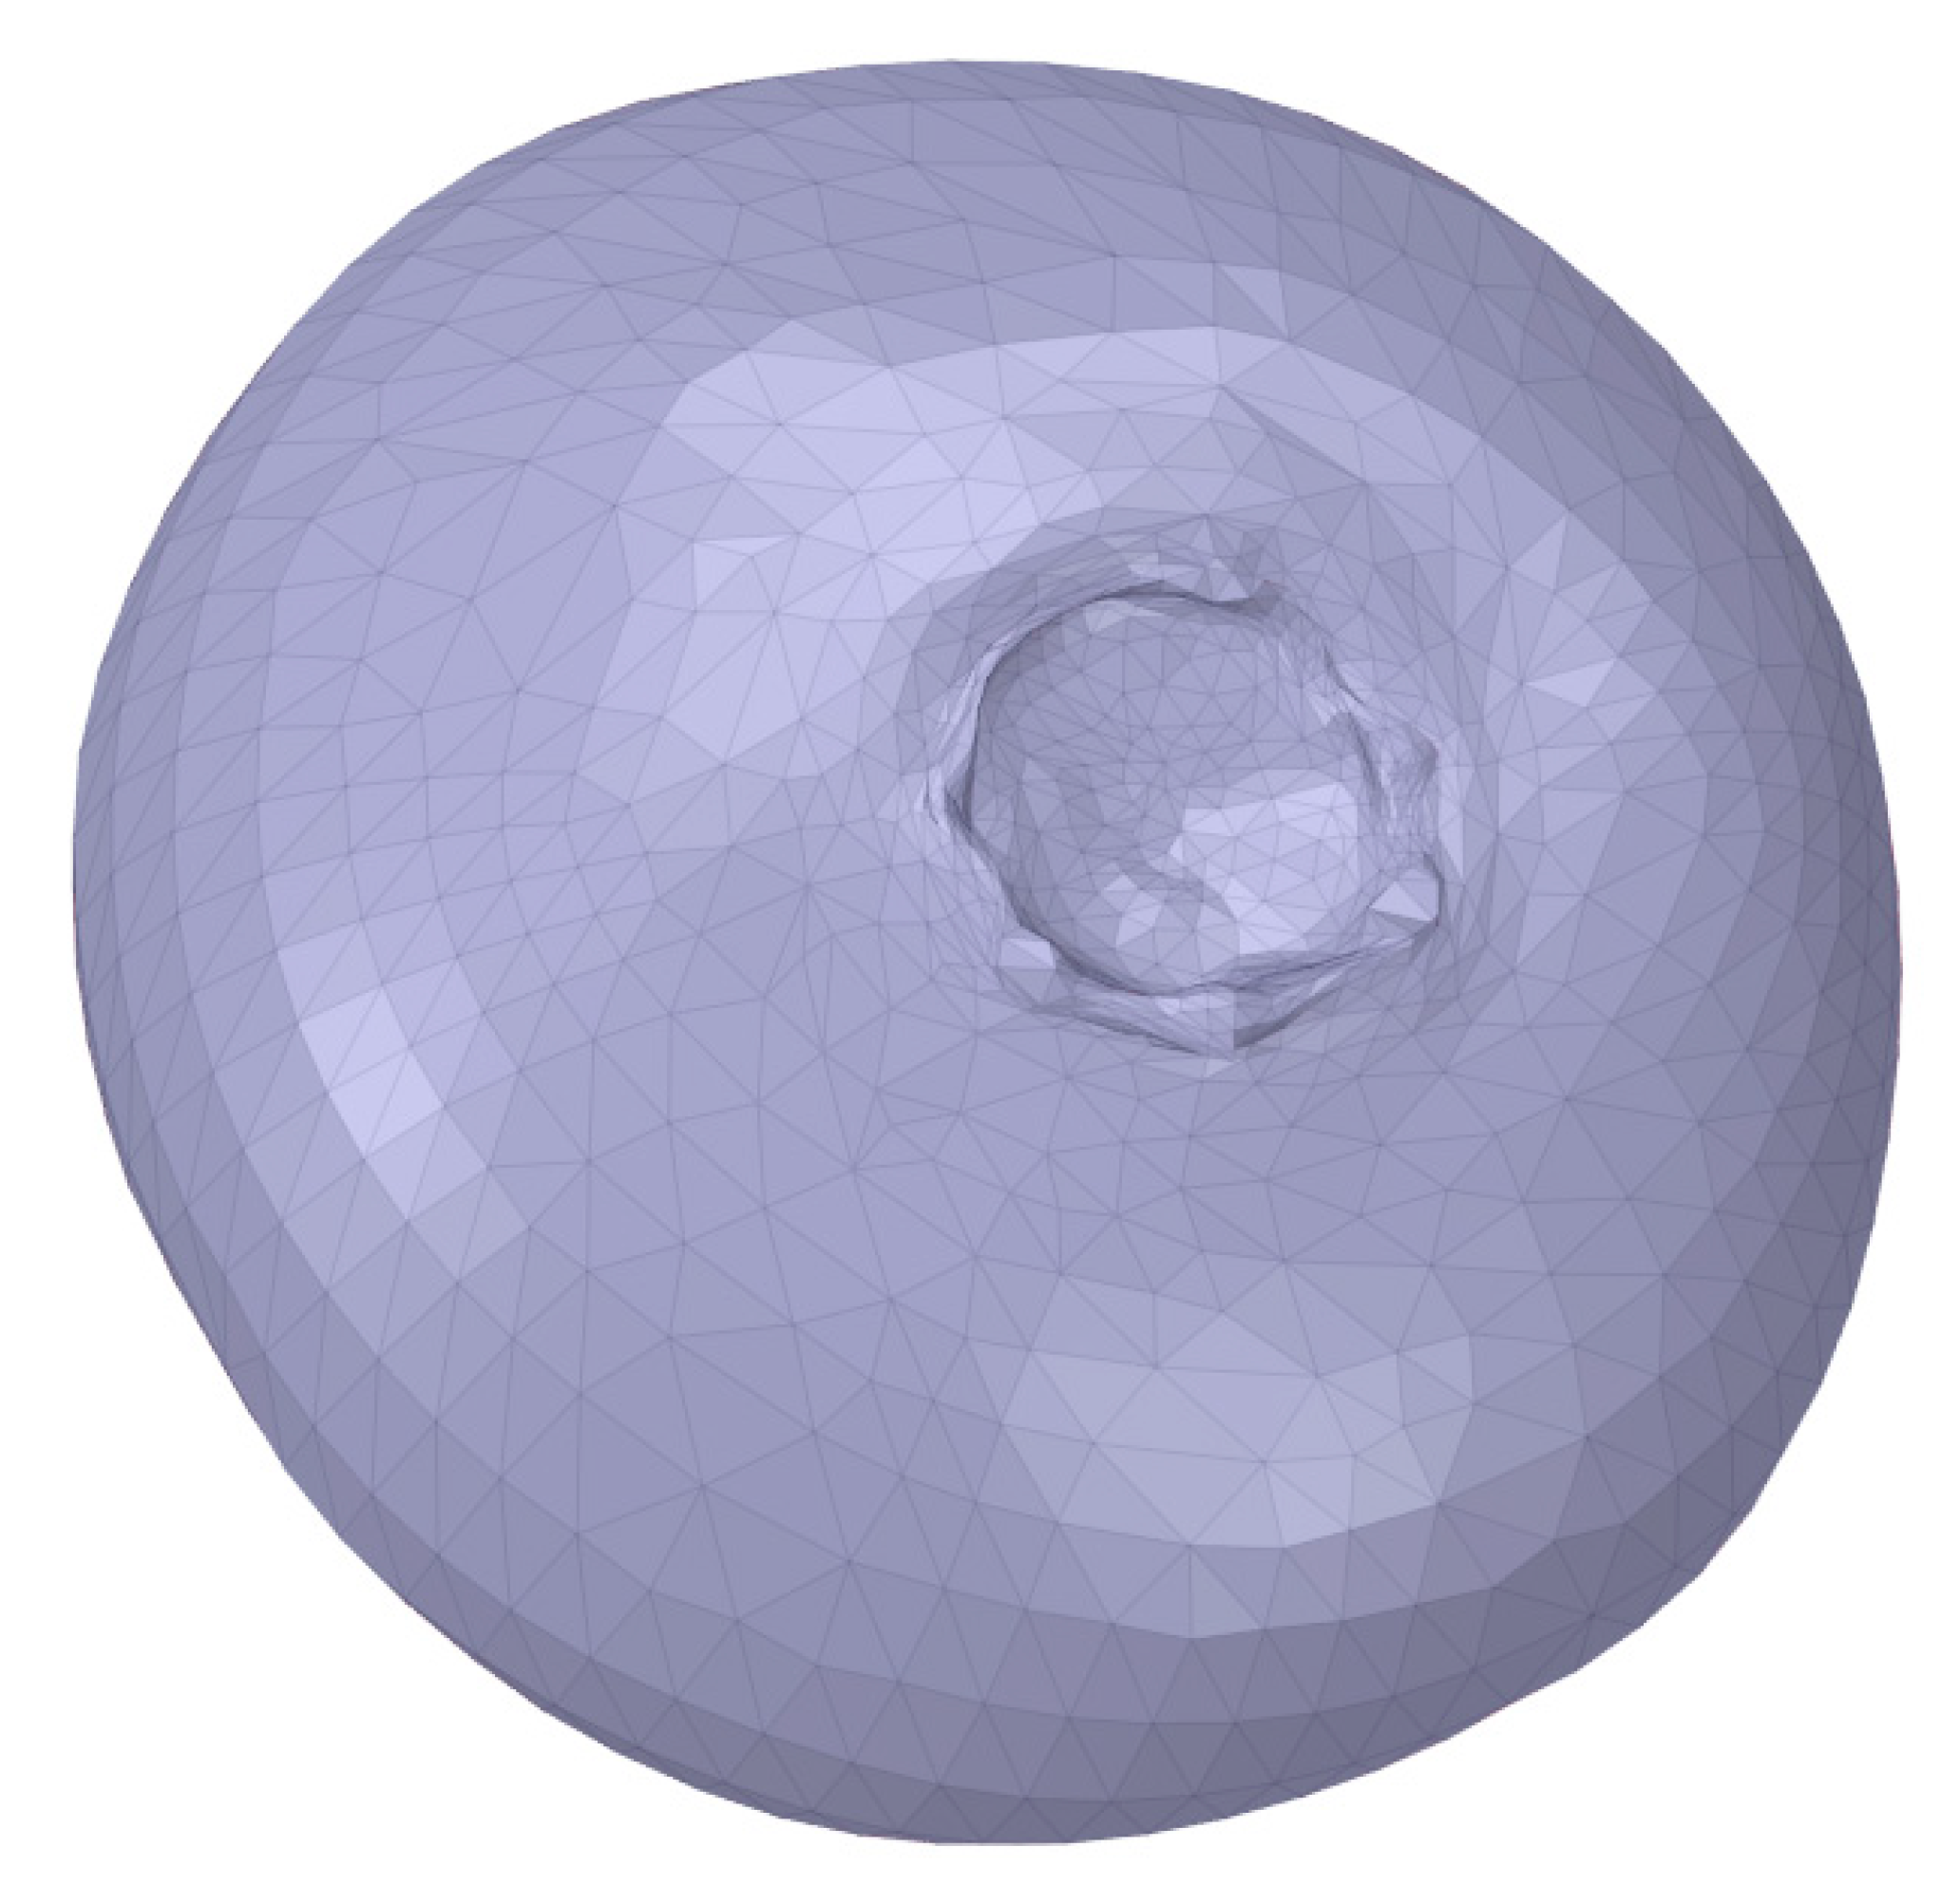
Figure 1. An example of a shape of a particle in Rocky DEM (Discrete Element Method).
Processes 08 01489 g001
Figure 2. Collisions of particles: (a) real, (b) numerical model—Δsn is the overlay of particles in the normal direction.
Processes 08 01489 g002
Figure 3. Vibrating conveyor [25].
Processes 08 01489 g003
Figure 4. The comparison of product movement between a shaken conveyor and a vibrating conveyor. (I)—shake conveyor—product movement. (II)—vibrating conveyor—product movement.
Processes 08 01489 g004
Figure 5. Average forces acting on the fruit in the normal direction vibrating transport.
Processes 08 01489 g005
Figure 6. Standard deviation of average force acting on the fruit in the normal direction vibrating transport.
Processes 08 01489 g006
Figure 7. Average forces acting on the fruit in the normal directionreciprocating transport.
Processes 08 01489 g007
Figure 8. Standard deviation of the average force acting on the fruit in the normal direction reciprocating transport.
Processes 08 01489 g008
Figure 9. Average forces acting on the fruit in tangential direction vibrating transport.
Processes 08 01489 g009
Figure 10. Standard deviation of the average force acting on the fruit in the tangential direction vibrating transport.
Processes 08 01489 g010
Figure 11. Average forces acting on the fruit in the tangential direction reciprocating transport.
Processes 08 01489 g011
Figure 12. Standard deviation of the average force acting on the fruit in the tangential direction reciprocating transport.
Processes 08 01489 g012
Figure 13. Values of the restitution coefficient of blueberry fruit during transport on a trough with vibrating motion and a trough with reciprocal motion.
Processes 08 01489 g013
Figure 14. The comparison of normal force on blueberry fruit during transport on the reciprocating chute (a) and on the vibrating chute (b).
Processes 08 01489 g014
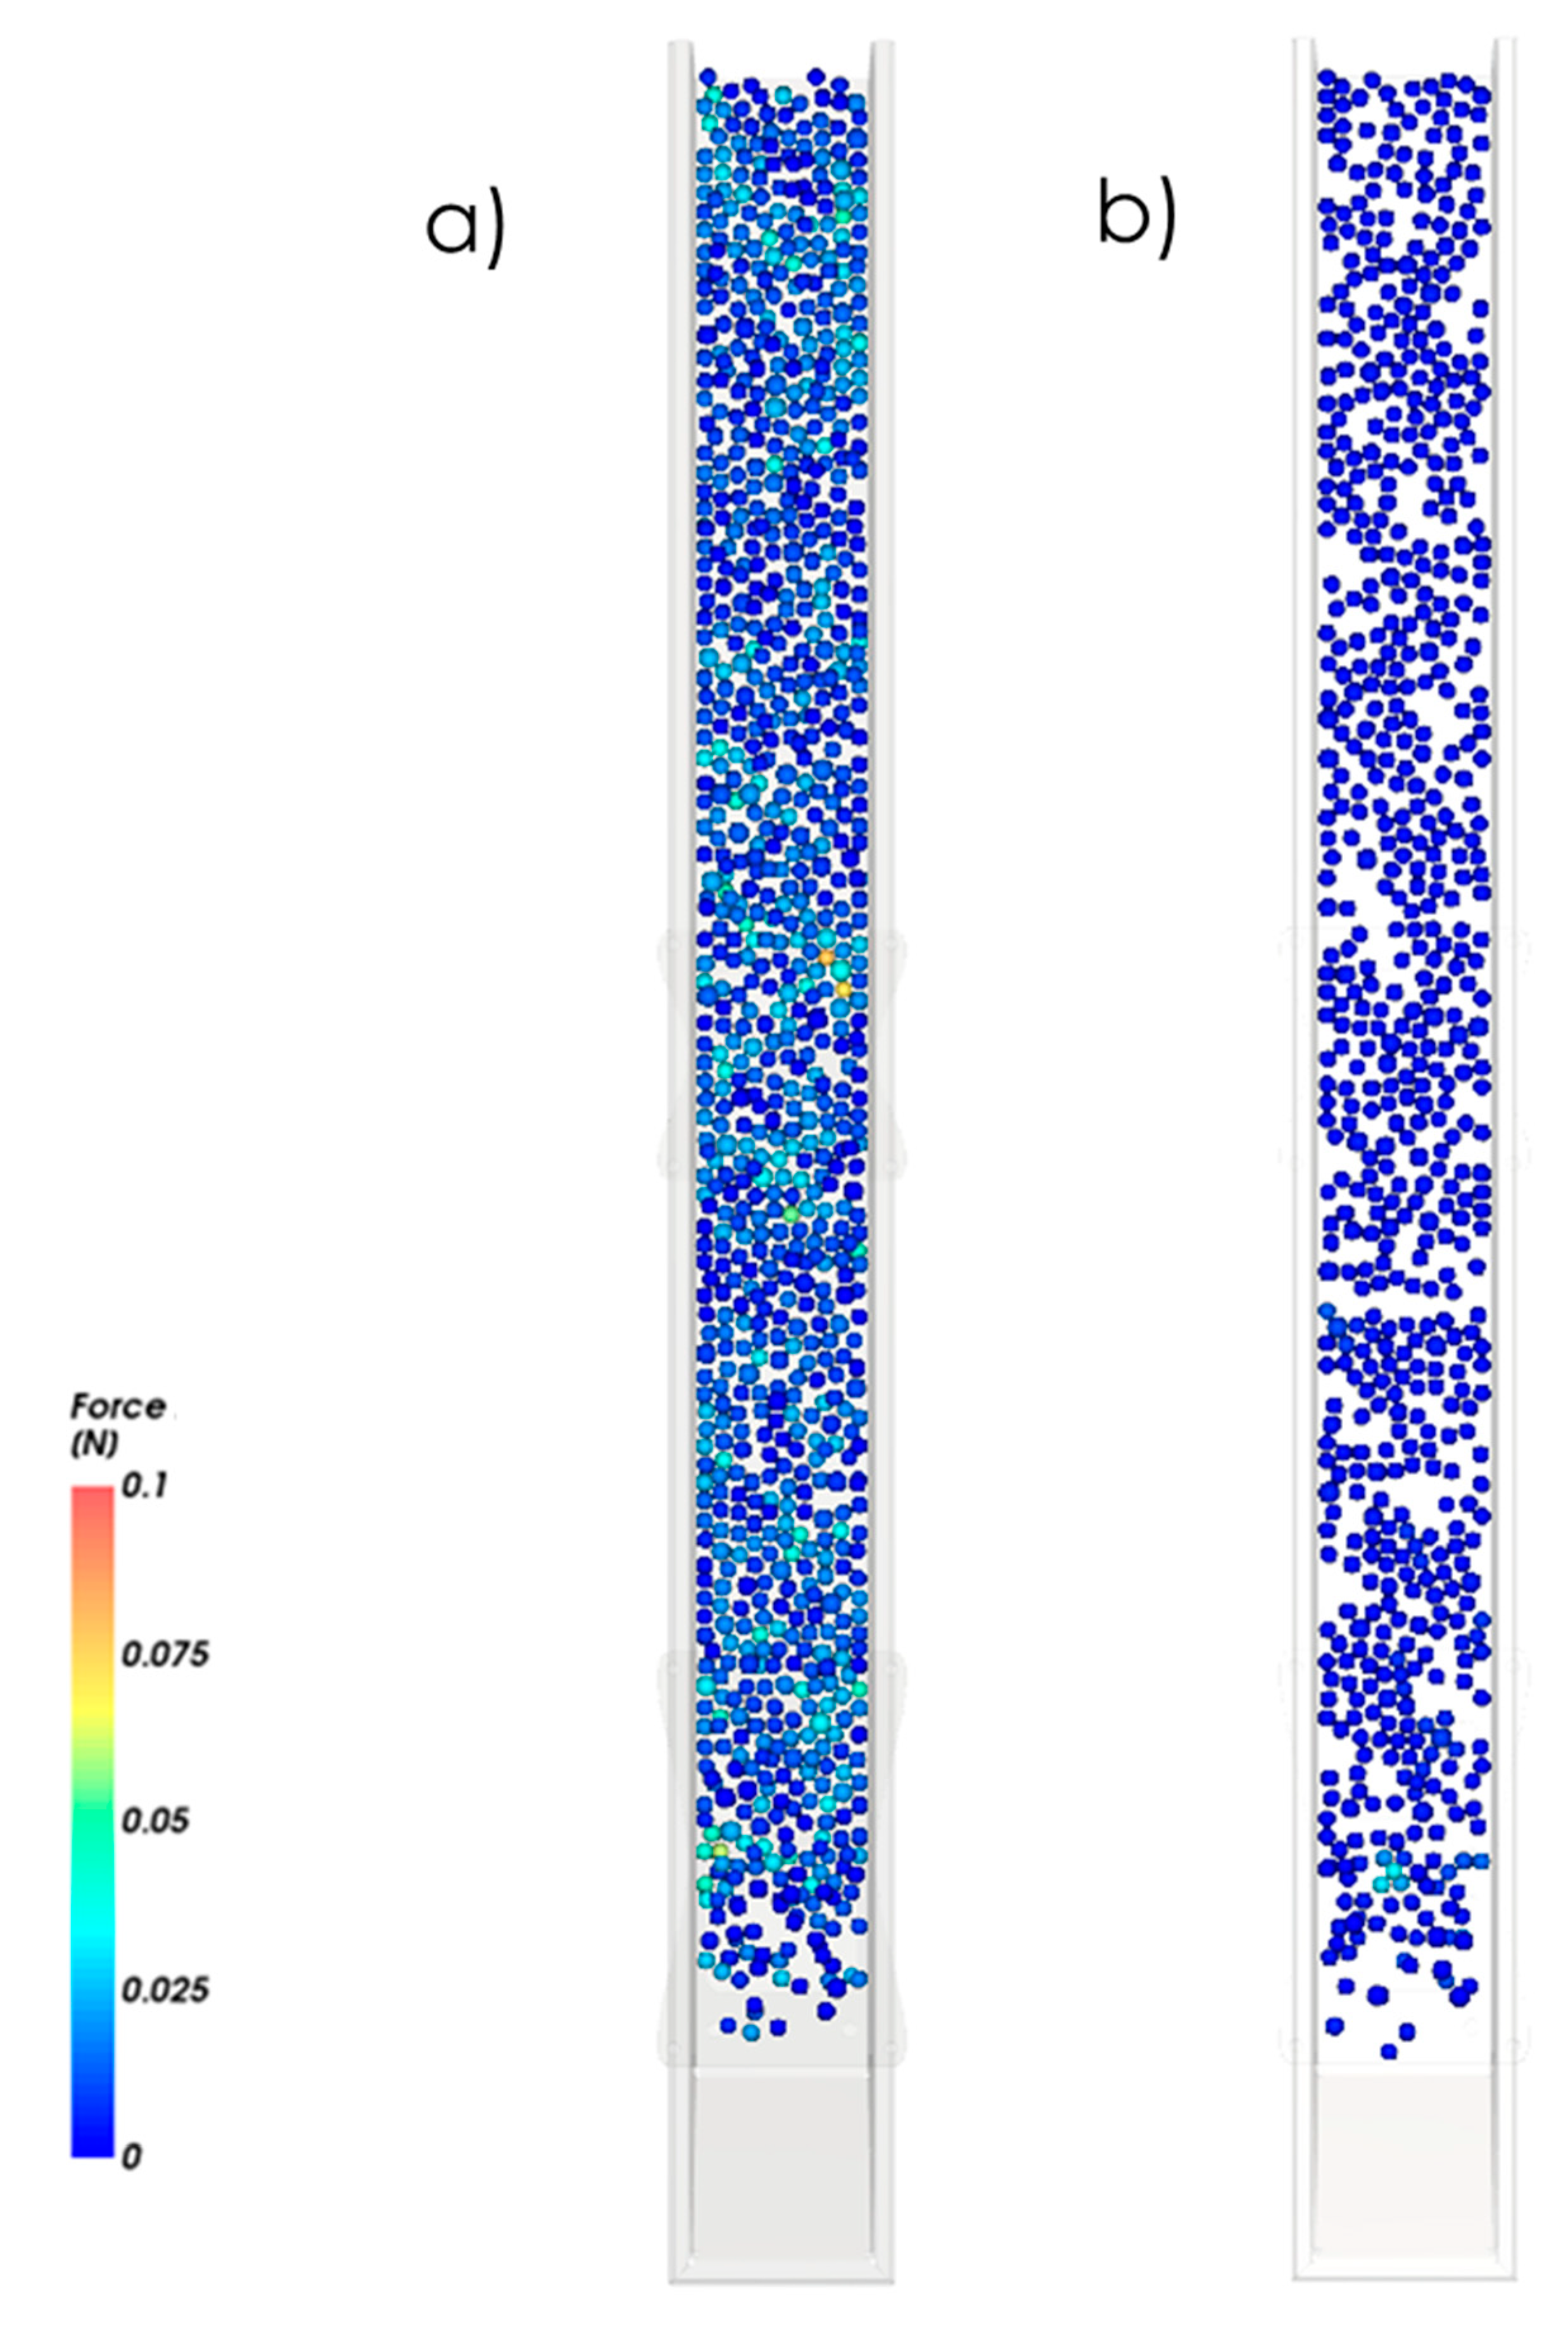
Figure 15. The comparison of tangential forces on blueberry fruit during transport on the reciprocating chute (a) and on the vibrating chute (b).
Processes 08 01489 g015
Figure 16. The comparison of the action of normal forces on blueberry fruit during transport on the reciprocating chute (a) and on the vibrating chute (b). The blueberry with an exceeded value of normal force is marked with a violet color.
Processes 08 01489 g016
Table 1. Summary of selected physical properties of blueberry fruit used in the model.
The VariableThe Value
The coefficient of static friction of blueberry walls0.6
The coefficient of dynamic friction0.6
The coefficient of static friction of blueberry–blueberry0.7
The coefficient of dynamic friction0.7
Bulk density, kg/m3640
Publisher’s Note: MDPI stays neutral with regard to jurisdictional claims in published maps and institutional affiliations.