Abstract
Foam materials have been widely used in various industrial applications, where higher and higher heat and mass transfer performances are pursued. However, the mechanism of many factors on the heat transfer performances is still unclear. The main purpose of this article is to investigate how the porous properties, porosity, cell size and the sample thickness affect the volumetric convective heat transfer. In this study, the single-blow method is used to determine the volumetric heat transfer coefficient of ceramics foam in the temperature range from 283 K to 323 K. In particular, sensitivity analysis of the foam porosity, cell size, velocity and the sample thickness on the volumetric heat transfer coefficient within the ceramics foam were all conducted. The results indicate that the sample thickness has a significant effect on the volumetric heat transfer coefficient which decreases with the sample thickness. In addition, the local thermal equilibrium phenomenon is verified and its influence on the volumetric heat transfer coefficient discussed. Based on the experimental data, a new correlation is proposed that includes sample thickness, porosity, superficial velocity and fluid properties. This study is crucial to the theory of the convective heat transfer inside the porous media, and can be used to guide the design and optimization of volumetric solar air receivers, compact heat exchangers, heat sinks, heat regenerators, packed bed reactors and so on.
1. Introduction
Foam materials usually have disordered and interconnected network structures, tortuous flow paths, high porosity, light weight, low pressure drop and large specific surface areas [1]. These unique physical properties make foam materials suitable for heat exchangers [2], heat sinks [3], volumetric solar air receiver [4], thermal energy storage [5], catalytic reactors [6], radiation burners [7] and hypersonic and re-entry vehicles [8]. Specifically, the large specific surface areas and internal tortuous flow paths of foam materials make it ideal for the enhancement of convective heat transfer. Because of these two distinguishing features, the convective heat transfer flux in a porous matrix can be remarkably large, and the volumetric heat transfer coefficient can reach at 105–106 Wm−3 K−1 [9] or even higher. The theory and detailed information of convective heat transfer inside the foam materials are crucial to the design and optimization of heat sinks, volumetric solar air receiver and so on. Unfortunately, the existing correlations have low accuracy in predicting the volumetric heat transfer coefficient within the foam materials. In fact, there are huge deviations [10] between these correlations.
To search for a generalized correlation, and then to calculate the volumetric heat transfer coefficient within the foam materials, scientists worldwide have made many experimental and numerical studies. Additionally, there have been many experimental studies about the convective heat transfer inside foam materials. Younis [11] experimentally measured the volumetric heat transfer coefficient between a stream of air and ceramic foam, alumina foams and cordierite foams. The sample thickness was 12–14 mm. The results show the volumetric heat transfer coefficient is mainly dependent on the superficial velocity and pore size. In addition, the heat transfer characteristic within the cordierite foams differed significantly from the alumina foams. The authors attributed this to the difference of the microstructure of the two materials. For the alumina foams, a correlation of Nusselt number about was obtained through the changing of pore diameter. However, the effect of was not investigated because the thickness is approximately fixed. On the same test rig, Fu [12] measured the volumetric heat transfer coefficient between air stream and cellular ceramics, which were made of mullite, YZA, SiC and cordierite. The sample thickness used was 12–14 mm. The effects of pore length scale and specimen thickness on the volumetric heat transfer coefficient were presented and discussed. An empirical correlation of Nu was also proposed, which is a function of the material, PPI (Pores Per Linear Inch) and specimen thickness. Specifically, Fu [12] concluded that the volumetric heat transfer coefficient increases with a decrease in the specimen thickness to the mean pore diameter ratio. Hwang [13] studied the flow and convective heat transfer features of aluminum foams, with the sample thickness of 60 mm. Empirical correlations were proposed based on the experimental data. Based on the experimental data from several researchers and an equivalent strut diameter (from Dul’nev’s unit cell model [14]) of open-cell foam as the characteristic length, Kamiuto [15] derived a Nusselt versus Peclet number correlation where the porosity and the nominal cell number density were involved. Zhang [16], Hernandez [17] and Zhang [18] also studied the volumetric heat transfer features of aluminum foams, the sample thickness were 50 mm, 50.8 mm and 110 mm respectively. Similarly, three empirical correlations were proposed. Dietrich [19] used the transient single-blow method to obtain the volumetric heat transfer coefficient of three porous media of silicon carbide, alumina, and mullite with the sample thickness of 50 mm and the superficial velocity ranging from 0.5 m/s to 1.5 m/s. The volumetric heat transfer coefficient was established by fitting the experimental data. Vijay [20] experimentally determined the volumetric heat transfer coefficient for alumina foams with different geometric parameters based on the transient heat transfer. To explore the volumetric solar air receiver, Fend [21] and Xia [22] experimentally investigated the convective heat transfer inside the ceramic foam (Xia [22] also studied Cu and Ni foam), and empirical correlations were unsurprisingly proposed. In addition, Fend [21] and Xia [22] used the sample thickness of 70 mm and 120 mm respectively.
On the other hand, researchers worldwide have made many numerical simulations to investigate the convective heat transfer within the foam materials. Constrained by the knowledge of the precise structure of real foam material and limited computational power, most of the numerical studies used idealized geometries, such as a periodic array of square rods [23], sphere pore [24], square cylinders [25], cubic model [26] and octet truss lattice geometry [27]. Wu et al. [9] investigated the convective heat transfer characteristics of air flow through ceramic foams, which was approximated by the Kelvin tetrakaidecahedron model, and argued that it is not proper to use the “mean volumetric heat transfer coefficient” and recommended to use the local volumetric heat transfer coefficient. With the numerical results, a correlation involving porosity, mean cell size and Reynolds number was proposed. Iasiello et al. [28] numerically investigated the thermally developed flow of air in an open-cell foam on a geometry of Kelvin tetrakaidecahedron foam, and presented a correlation involving the porosity and the Reynolds number. Saurish [29] used an immersed boundary method and realistic random periodic structures, and proposed a Nusselt correlation for open-cell solid foams. This correlation includes the porosity, Reynolds number and Prandtl number.
With the progress of related technologies, more and more researchers use the computed tomography to get the real structure of foam materials, and then investigate the flow and heat transfer inside it on the high performance computational platform. Petrasch et al. [30] obtained the real geometry of reticulate porous ceramics by using computed tomography and then studied the penetrability and interfacial heat transfer characteristics of this porous material by numerical simulation. Finally, a correlation involving Reynolds number and Prandtl number was proposed. Haussener [31] and Suter [32] did similar studies of porous ceramics, used the least-square fitting and obtained two different empirical correlations. Zafari [33] conducted numerical simulations on open cell metal foams and presented a correlation through a curve-fitting procedure. The correlation of Nusselt number is a function of porosity and Reynolds number. Ambrosio [34] conducted simulations on Kelvin’s ideal foam model and on tomography-based real foams, and concluded that the convection heat transfer coefficient slightly decreases with porosity, while the volumetric convection heat transfer coefficient markedly decreases. Liu [35] investigated the heat transfer of porous media at the pore-scale with the double-population thermal lattice Boltzmann (LB) method. The studied sample porosity was about 0.6, and had a thickness of 5 mm. A correlation was also proposed, where the Nusselt number was a function of Reynolds number only. Meinicke [36] numerically studied the single-phase hydrodynamics and conjugate heat transfer in cylinder shaped solid sponges, and literature data were used to validate the heat transfer coefficient. Iasiello [37] concluded that the heat transfer characteristics were very close for a low Reynolds number for an ideal structure and a real structure, and the heat transfer coefficient and the Nusselt number were consistent. However, a larger Reynolds number would result in a larger difference between the two structures. Vijay [38] concluded that a simplified foam structure could not represent real foam when considering a heat transfer via the foam tortuous structure. In fact, the exact use of geometric models and large computational demands can lead to limited numerical simulation. Nie [39] investigated the pressure drop and heat transfer through open cell foams with a 3D Laguerre–Voronoi model. A correlation with a form of for was proposed, where the coefficient increased with the porosity. Based on a geometrical model generated through X-ray micro-computed tomography (CT), Dixit [40] investigated the pressure drop and heat transfer of a small open-cell metal foam matrix with both experiment and simulation. Recent research articles on computational simulation of the digitized real open-cell metal foam structure were also listed. Based on the generalized Lévêque analogy [41], Gancarczyk et al. [42] derived a theoretical model describing heat transfer characteristics of the solid foams solely based on their geometric parameters, and the derived model was validated by the experimental data and within the accuracy of 25%.
To summarize the above-mentioned literatures, the interfacial heat transfer inside the foam materials has been extensively investigated both by experiments and numerical simulations. Additionally, a lot of empirical correlations were proposed. However, these correlations are so dispersed that none is universally reliable. By comparing with the data in the literature, we see that all of the correlations have the form of . Furthermore, there are three features of these correlations. Firstly, there are huge differences between the two coefficients and . Within the correlations from the experimental studies, the coefficient “c” ranges from 0.13 to 2.43, and the exponent “m” ranges from 0.42 to 1.18. The convective heat transfer coefficient obtained from the correlations differs in two orders of magnitude and even more. The second feature is, except that they have a similar form of , there is no other regularity among them. The third feature is that it seems the fidelity of these correlations is improving, because the coefficient is no longer a constant, but a function of the porosity or pore size. However, due to the complexity of foam structures, the influence of porosity, pore size and thickness on the volumetric heat transfer coefficient within foam materials is still unclear. In addition, the local thermal equilibrium and local thermal nonequilibrium phenomenon within porous media have been widely discussed in the literature [43,44,45,46,47,48], but have not been experimentally verified. Therefore, the convective heat transfer inside the foam materials is still worthy of further studies.
The main purpose of this article is to investigate how the foam properties, namely the porosity, cell size (note, the pore density or sometimes PPI, is usually used in the material industry, and the pore size or cell size is usually used as the characteristic length when the quantitative analysis is needed) and thickness, affect the convective heat transfer inside the ceramic foam material. In this study, the single-blow technique is used to experimentally determine the volumetric heat transfer coefficient between ceramics foam and air stream in the temperature range from 283 K to 323 K, and the superficial air velocity from 0.58–1.76 m/s. The foam properties, including the porosity, cell size and sample thickness—which has never been investigated before—were all parametrically studied. Their influences on the volumetric heat transfer coefficient, and the local thermal equilibrium within the ceramic foam materials were analyzed. The results show that both the cell size and sample thickness have significant effects on the volumetric heat transfer coefficient, and the porosity’s influence is relatively weak. More importantly, the local thermal equilibrium was firstly verified with experimental data, as well as its influential factors have been analyzed. Further, the experimental data were correlated in dimensionless form to offer an equation for estimating the volumetric heat transfer coefficients at a given superficial air velocity for any types of foam material. This correlation is crucial to the field of convective heat transfer inside the porous media, and can be used to guide the design and optimization of volumetric solar air receiver, compact heat exchanger, heat sink, heat regenerator, packed bed reactor and so on.
2. Single-Blow Method
2.1. Physical Problem
Figure 1 illustrates the studied physical problem. A porous matrix is placed within a channel. The air flows through the sample. The channel walls are well insulated to avoid any transverse heat transfer (the walls are treated as adiabatic in the following theoretical analysis). As long as there is a temperature difference between the stream of air and the porous matrix, the convective heat transfer between them will occur. Hitherto, only the single-blow transient testing technique can be used to determine the interfacial heat transfer coefficient between the airstream and porous matrix. Figure 1 is actually the test section of a single-blow test rig.
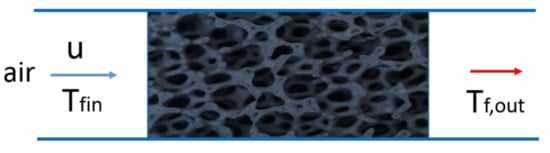
Figure 1.
Schematic of the physical model.
Although the sample materials are not strictly regulated by the single-blow method itself, the samples are generally porous media, or it can be approximated as porous media. In addition, the cross-section of the channel is not strictly defined. However, it usually has a circular or rectangular shape. In this study, the studied sample is silicon carbide ceramic foam, and has a circular shape (diameter 50 mm) and with thickness varying from 30 mm to 105 mm.
2.2. Single-Blow Method
Because of the extremely complicated microstructure of foam materials, the details of the flow field are generally considered immeasurable and therefore unknown. Strictly speaking, the flow field and the foam temperature are measurable. Sometimes the researchers do measure it, such as the literatures [13,42]. However, the measured data are of no values because nobody can explain whether the data are the fluid temperature, solid temperature or their mixture. Even if the data are deterministic the fluid or solid temperatures, they still do not have much value because both fluid and solid temperatures are spatially and temporally variables during the experiment. However, it is definite that the convective heat transfer coefficient can be obtained from the energy conservation principle. With the initial conditions, the measured airstream temperatures (upstream and downstream of the studied sample), the air velocity and the air and sample properties, the volumetric convective heat transfer coefficient can be deduced. This is the so called “single-blow method”. The following paragraphs introduce the theory and procedure of this method.
For easy analysis, some assumptions are made for the physical problem shown in Figure 1. The flow and heat transfer is one dimensional, and the airstream and the entire sample are always under the local thermal nonequilibrium state during the experiment. There is only convective heat transfer (radiation is ignored, because the maximum temperature is only 323 K) between the airstream and sample, and the convection heat transfer coefficient is assumed spatially and temporally constant when the superficial velocity is fixed (this means the is not a function of the time and location). The studied sample is spatially uniform and isotropic. In addition, the properties of fluid and solid are considered as constant. Based on these assumptions, a coupled and one-dimensional thermal transport equations can be established as follows,
where the subscript and refer to the fluid and solid phase respectively, , , , and are respectively the porosity, density, specific heat capacity and thermal conductivity. represents the temperature, is the airflow superficial velocity, is volumetric heat transfer coefficient.
The initial conditions are given as follows,
The boundary conditions used in this study are as follows,
where is the initial temperature, is the inlet air temperature. There is a sudden temperature change of the inlet air temperature at the beginning of the test, from to . This is realized by controlling the valves in Figure 2 and the procedure can be seen in Section 3.1.
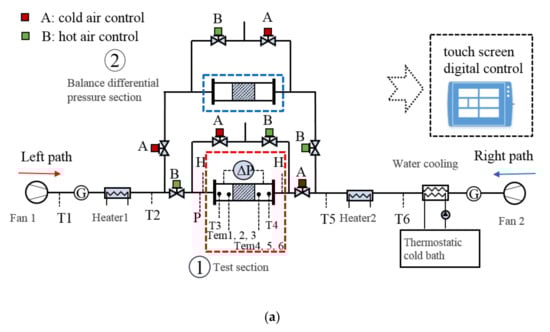
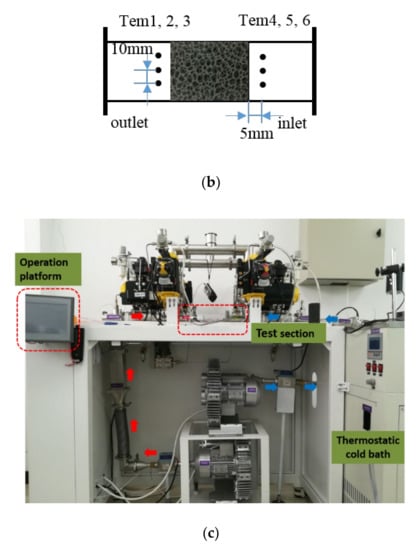
Figure 2.
Experimental system schematic (a), test section (b) test section and (c) physical diagram.
The volumetric heat transfer coefficient , which couples the Equations (1) and (2), is the desired parameter of the single-blow method. The following paragraphs describe how to solve the coupled one-dimensional equations and finally obtain the volumetric heat transfer coefficient.
The coupled one-dimensional Equations (1) and (2), together with the initial and boundary conditions (3) to (6), cannot be solved because the is unknown. However, by assigning a value to , the coupled one-dimensional equations can be solved by using a numerical method (such as the finite difference method), and then can predict the outlet air temperature. The measured outlet temperature can be used to validate the computed outlet air temperature, and the standard deviation can be calculated according to
where , are respectively the predicted and measured outlet air temperature, n is the number of time step.
The basic principle of solving the volumetric heat transfer coefficient is, assume a value to , solve the coupled one-dimensional equations, predict the outlet air temperature, and then repeatedly adjust the until the predicted outlet air temperature agree with the measured outlet air temperature within an acceptable tolerance. In this study, the objective standard deviation is set as 0.01. When the standard deviation is less than 0.01, then the corresponding is considered the desired volumetric heat transfer coefficient.
It is worth noting that the volumetric heat transfer coefficient obtained through the single-blow method was an average coefficient, because it was a constant in the governing equations, and is independent of time and position. The detailed procedure of solving the is showed in Figure 3.
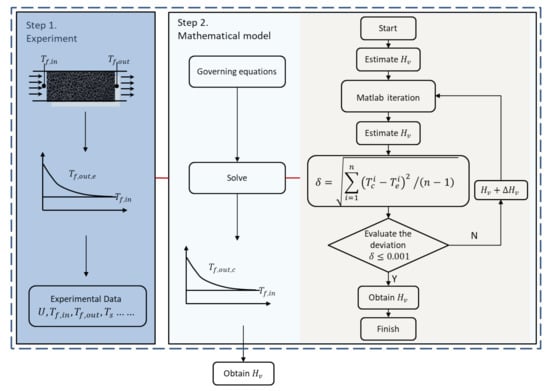
Figure 3.
The flow chart of single-blow method for solving volumetric heat transfer coefficient.
3. Experimental Apparatus and Procedure
3.1. Test Rig
A test rig, which was specially designed for studying the reciprocating flow and heat transfer inside the porous media, was used in this study. See Figure 2 for the schematic diagram, the test section and experimental apparatus of the test rig.
The test rig mainly consists of two assemblies which respectively provide controllable hot air and cold air to the test section. The first assembly, see the left part of Figure 2a, can be used to provide hot airstream to the test section, mainly consists of an inverter fan “fan 1”, a heater “heater 1”, a flow-meter, pneumatic valve and the pipe. The second assembly, see the right part of Figure 2a, can be used to provide cold airstream to the test section, mainly consists of an inverter fan “fan 2”, a thermostatic cold bath “thermostatic cold bath”, a heater “heater 2”, a flow-meter, pneumatic valve and the pipe. Six thermocouples are used to control the airstream temperature, which were placed at different positions as indicated in Figure 2b. In addition, several pneumatic valves are used to control the pipes of bypass and the test section. For a better controllability of the test rig, all the pipes were insulated by using aerogel insulation materials. The test section is cylindrical and has a diameter of 50 mm.
The range and uncertainty of all measuring equipment in the test rig can be seen in Table 1.

Table 1.
Uncertainty of apparatus inserted in the test rig and of the experimental measurements.
All the parts, including the heaters, pneumatic valves, inverter fans, the flowmeters and thermometers are all integrated into a touch screen. With this test rig, the reciprocating flow and temperature step changing can be realized. Of course, the single-blow transient test can be done on this test rig because the period of the reciprocating flow can be arbitrarily controlled.
3.2. Foam Sample
In this study, we bought the silicon carbide ceramic foam from the institute of metal research of the Chinese Academy of Sciences. We studied 54 types of samples, with different PPI (30–60), porosity (0.75–0.85) and thicknesses (30 mm–105 mm). The samples are cylindrical and all have a diameter of 50 mm. The structural parameters of the sample, including PPI, porosity and thickness are provided by the manufacturer. The micromorphology of the studied ceramic foam (see Figure 4) was obtained by using the scanning electron microscope (SEM). The mean cell size, pore diameter and strut diameter were also obtained through SEM. The studied samples, structural properties and thermal properties are respectively listed in Table 2, Table 3 and Table 4.
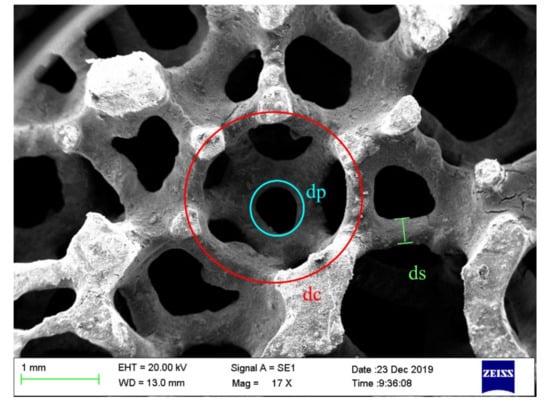
Figure 4.
Diagram of silicon carbide foam structure by SEM.
Table 2.
The type of the experimental sample.
Table 3.
Geometric parameters of silicon carbide.
Table 4.
Thermophysical properties of silicon carbide foam.
3.3. Experimental Procedure
In this experiment, we use the cold air to cool down the hot sample. The experimental process consists of two parts, namely preparing the initial conditions and conducting the transient test. It can be divided into three steps:
- i.
- Install the sample, sensors. Check all the facilities of the test rig. Confirm all the experimental parameters, including the initial temperature , the airstream temperature and the superficial velocity.
- ii.
- Prepare the initial conditions. Hot air is obtained to heat the foam until it reaches at the steady state (T = 323 K), this is realized by switching valve A to B and adjusting the frequency of fan 1 as well as the power of heater 1. It can be considered that the foam has a uniform temperature when the temperature difference at the inlet and outlet is less than 0.2 K, and last for 10 min.
- iii.
- Conduct the transient experiment. After the sample reaching at the steady condition, the heater 1 and fan 1 are quickly turned off and the valve B is switch to A at the same time, the temperature changes of the fluid before and behind foam material are recorded by thermocouples. For each sample, the above experiment with different superficial air velocities is performed, where the superficial air velocities varied between 0.58 m/s–1.76 m/s.
All the 54 samples, including six types of thickness, three types of porosity and three types of PPI, were all tested on this test rig within the superficial velocity varying from 0.58 to 1.76m/s. The data acquisition frequency of all the sensors, including the thermocouples, flowmeters and the differential pressure sensor, were set as 1 s.
4. Results and Discussion
4.1. Data Reduction
In this study, several parameters are used to characterize the convective heat transfer within the ceramics foam materials.
The superficial velocity is defined as:
where is the volume flow rate, is the channel diameter.
The mean cell size () is used as the characteristic length of the studied sample (the reason of using the mean cell size as characteristic length is the cell size can relatively easier to be measured than the pore size), and then the corresponding Reynolds number is defined as:
where , represents the air density and dynamic viscosity.
The Nusselt number can be expressed as follows:
According to the principle of the single-blow method (Section 2.2), the can be determined by iterating. In this paper, the MATLAB® software is used to solve this problem, and the numerical program is developed by using the partial differential equation (PDE) solver and the fminsearch algorithm from the MATLAB Toolbox. The objective of the standard deviation is set as 0.01 in this study.
The uncertainty of the experimental study is derived from the determination of the mean cell size, surface velocity and temperature measurements. The uncertainties of the directly measured parameters can be determined by the accuracy of the used instrument. In addition, the uncertainties of indirectly measured parameters are calculated using the definition from Xia [22]. Finally, the uncertainties are listed in Table 5:
Table 5.
Uncertainty of key parameters.
4.2. Local Thermal Equilibrium Phenomenon
For better analysis and comparison of the temperature change, we defined a dimensionless temperature as following:
where is the measured outlet air temperature, is the initial temperature (323 K), is the inlet air temperature (283 K).
Figure 5 consists of a lot of curves, which shows the relationships between the dimensionless temperature of different samples (different thickness, porosity and PPI) and the superficial velocities. For all the curves within Figure 5, we can see they have the same changing trend, that is, the dimensionless outlet air temperature starts from 0, then increases and approaches 1 at the end. In addition, the slope of the curves also starts from 0, then gradually increases, then slowly decreases and approaches 0 at the end. In the rear part (after 1 min) of the experiment, the average temperature difference between the sample and the air stream is a small value and thus the convective heat transfer between them is small. Because a small absolute temperature deviation can generally bring about a large relative deviation, this part of the experimental data is not considered in this study.
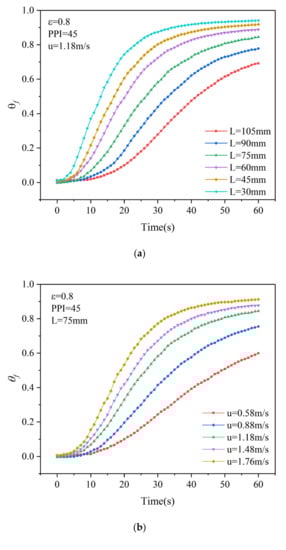
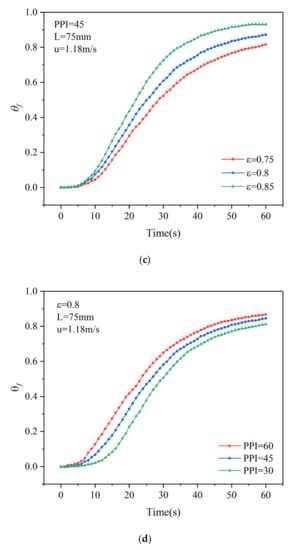
Figure 5.
The relationships between dimensionless temperature and (a) sample thickness, (b) superficial velocity, (c) porosity and (d) PPI.
In Figure 5, it is necessary to pay attention to the initial stage of all the curves, because it shows that the dimensionless outlet air temperature equals to 0 at the beginning, and it lasts for a while. This is an interesting phenomenon, and the two curves, namely the sample with thickness of 105 mm in the Figure 5a and the sample with thickness of 75 mm and velocity 0.58 m/s in the Figure 5b, are the most obvious cases, where it (refers to ) lasts for about 10 s. The state of “dimensional temperature equals to 0” is crucial, because it implies that the air temperature at the outlet is equal to the initial temperature of the studied sample. This state is called the “local thermal equilibrium”. In other words, this phenomenon clearly indicates that there exists the local thermal equilibrium zone within the studied sample during the experiment. Further, the longer “the dimensional temperature equals to 0”, the more considerable the local thermal equilibrium phenomenon exist within the studied sample. Although there are no experimental data to prove the exact local thermal equilibrium zone, we can still infer that the local thermal equilibrium zone locates at the rear part of the sample at the beginning stage of testing (because the air flow through the sample), and it is a dynamic zone and changing with time.
One thing needs to be clarified is that, because of the measurement errors, data rounding, etc., the dimensionless temperature is not strictly equal to 0. However, we can consider that there exists the local thermal equilibrium zone only if the dimensionless temperature is approximately equal to 0. Now we can use the dimensionless temperature to judge whether the local thermal equilibrium exists and how long it exists. Figure 5a–d shows the relationship between the dimensionless temperature’s changing regularity and the sample’s thickness, porosity, PPI and the superficial velocities. Figure 5a indicates the thicker of the specimen, the longer duration the local thermal equilibrium zone. Figure 5b indicates the higher of the superficial velocity, the shorter duration of the local thermal equilibrium zone. Figure 5c,d indicates the duration the local thermal equilibrium zone is weakly related with the sample’s porosity and cell size (within the studied range of porosity 0.75–0.85, and PPI 30–60).
Although the experimental data in Figure 5 clearly show that the local thermal equilibrium phenomenon does exist in the sample during the single-blow transient experiment, and this finding is in contradiction with one of the assumptions of the single-blown method, the volumetric heat transfer coefficient is still the best parameter for evaluating the convective heat transfer performance within porous media, and the single-blow method is so far the only feasible experimental method to measure it. Therefore, we continue to investigate the convective heat transfer within the ceramic foam material by using the single-blow method and the volumetric heat transfer coefficient, and regardless of the existence of the local thermal equilibrium phenomenon.
4.3. Effect of the Sample Pore Structure
Figure 6 presents the relationship between the volumetric heat transfer coefficient and the superficial velocity, pore density and porosity. The used samples in this figure have the thickness of 75 mm. From Figure 6, it can be clearly seen that the volumetric heat transfer coefficient increases with the increase of pore density. This can be explained by the following analysis. When the PPI increases, the mean cell size of the studied ceramic foam decreases, and thus the specific surface area increases [9,49]. The increase of specific surface area will greatly enhance the convective heat transfer within the studied sample. From the basic Newton’s law of cooling, it is a simple principle that the total convective heat transfer is proportional to the surface area. Therefore, increasing the PPI can significantly increase the volumetric heat transfer coefficient.
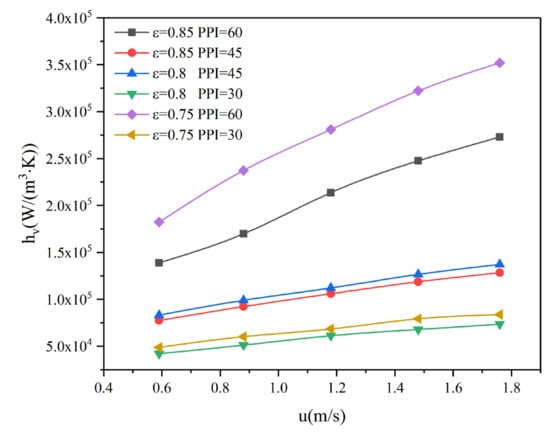
Figure 6.
The relationships between volumetric heat transfer coefficient and superficial velocity.
From Figure 6, it can be also seen that as the porosity decreases, the volumetric heat transfer coefficient increases. On the one hand, the increment is small when the PPI is low (PPI = 30, 45). We attribute this to the true velocity of the air flow, which is related with the porosity and can be approximately calculated through , and it is inversely related to the porosity. The velocity of true air increases with the decrease of porosity. Furthermore, the increment is larger when the PPI is high (PPI = 60). We attribute this to the specific surface area, which is strongly related with the PPI. Although the true air velocity is also affected by the porosity, the PPI’s influence on the specific surface area is greater.
In addition, there is also a feature in Figure 6. The cases where the volumetric heat transfer coefficients are smaller, where the local thermal equilibrium phenomena are more likely occur. For example, the cases of low superficial velocity, there are more likely that the local thermal equilibrium phenomena occur according to Figure 5b. As a matter of fact, there is no convective heat transfer any longer between the airstream and the strut surface where the local thermal equilibrium exists. Only if the local thermal equilibrium exists, no matter where it locates within the studied sample, it will decrease the volumetric heat transfer coefficient. Because the thermal equilibrium zone takes up the total volume of the sample, but it does not participate in the heat exchange. Therefore, from the origin definition of “volumetric heat transfer coefficient”, the numerator keeps the same (the total convection heat flux is fixed), and the denominator becomes larger (the existence of the thermal equilibrium zone makes the denominator larger), so the result “volumetric heat transfer coefficient” becomes smaller. The existence of the thermal equilibrium zone will result in the small volumetric heat transfer coefficient. However, not all the cases of small volumetric heat transfer coefficient are because of the existence of the thermal equilibrium zone. For example, the volumetric heat transfer coefficient of the sample with lower PPI and under higher superficial velocity is inherently lower compared with that of the sample with higher PPI.
4.4. Effect of the Sample Thickness
In Section 4.2, we presented the relationship of the dimensionless outlet air temperature and the sample thickness in Figure 5a. In addition, the local thermal equilibrium phenomenon was discussed. It is obvious that the sample thickness has a considerable effect on the volumetric heat transfer coefficient.
Figure 7 presents the volumetric heat transfer coefficients from the samples with porosity 0.85, PPI 60 and with different thicknesses. This figure clearly indicates that the volumetric heat transfer coefficient increases with the decreasing thickness. In fact, the volumetric heat transfer coefficient is very sensitive to the sample thickness. For example, under the same working conditions, the volumetric heat transfer coefficient of the sample with thickness of 30 mm is approximately three times of that of the sample with thickness of 105 mm. The influence of the sample thickness on the volumetric heat transfer coefficient, which is obtained from the single-blow method, is too large to ignore, the most plausible reason is the existence of the local thermal phenomenon during the single-blow transient experiment.
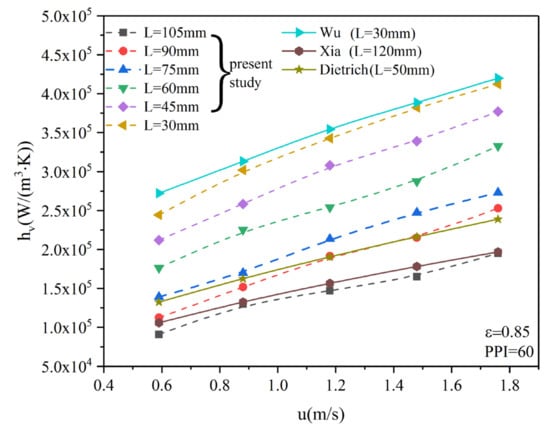
Figure 7.
The relationships between volumetric heat transfer coefficient and superficial velocity, sample thickness and comparison with literatures.
The influence of the sample thickness on the volumetric heat transfer coefficient is so large and startling that we use the data from the literature to validate our experimental data. Three correlations from different literatures (see Table 6) were used for comparison with this study. In this study, the Reynolds number, which was defined based on the mean cell size, ranges from 70 to 800, and the sample porosity varies from 0.75 to 0.85. These conditions indicate that the experimental data are comparable to that in the literatures. In this study, an exceptional condition is that the sample thickness ranges from 35 mm to 105 mm. The influence of the sample thickness on the volumetric heat transfer coefficients has not been investigated before.
Table 6.
The correlations and scope of application from other authors.
In Figure 7, three additional curves respectively from Wu [9], Dietrich [19] and Xia [22] are plotted together with the experimental data in this study. Figure 7 indicates all the presented curves have the same trend and most of the volumetric heat transfer coefficient values have the same order of magnitude, 105 W/(m3·K), but differ by about three times even under the same superficial velocity. This can be attributed to three factors. Firstly, there are differences between the studied samples. Wu [9] used the method of numerical simulation and idealized tetrakaidecahedron model. Dietrich [19] and Xia [22] used the single-blow method, which is also used in this study. However, the studied materials were different, the percentage of the open pores are obviously different judging from the pictures in the two literatures. The second factor is because of the adoption of the different characteristic length. For the characteristic length, Wu [9] used the mean cell size, Dietrich [19] used the hydraulic diameter (calculated from ) and Xia [22] used average strut diameter. The third factor, which is the most important, is the difference of the studied sample thickness. Although Wu [9] did not specify the sample thickness, a thickness of 30 mm can be inferred. Dietrich [19] and Xia [22] respectively used the sample thickness of 50 mm and 120 mm. In this study, the sample thickness ranges from 35 mm to 105 mm. Considering the above reasons, we think the difference between the volumetric heat transfer coefficient values in Figure 7, which differ of three times, is reasonable.
From Figure 7, we can conclude that the sample thickness, essentially, the local thermal equilibrium phenomenon has huge influence on the volumetric heat transfer coefficient value. Specifically, the trend is that the larger the used sample thickness, the lower the volumetric heat transfer coefficient value. Therefore, the local thermal equilibrium phenomenon is non-negligible, and deserves further investigations.
4.5. Heat Transfer Correlation
Considering the high possibility of local thermal equilibrium phenomenon within the foam materials in reality, and the sample thickness’s great influence on the volumetric heat transfer coefficient, we defined a new variable in this study.
where is named as the dimensionless thickness, is mean cell size or the characteristic length, is the thickness of the studied foam material.
Then, considering the relationships between the volumetric heat transfer coefficient and the superficial velocity, porosity and the air properties, and based on the experimental data, we proposed a new correlation. In this correlation, the Nusselt number is a function of the dimensionless thickness, porosity, and number.
Figure 8 presents the all the experimental data in this study and the predicted value according to the Equation (17). In this figure, all experimental data are within the 20% deviation of the correlation’s prediction. Therefore, the proposed correlation is in good agreement with the experimental data. In addition, this correlation indicates that the volumetric heat transfer coefficient is strongly dependent on the thickness, superficial velocity, pore density (namely the PPI, which directly affect the mean cell size), and weakly dependent on the porosity.
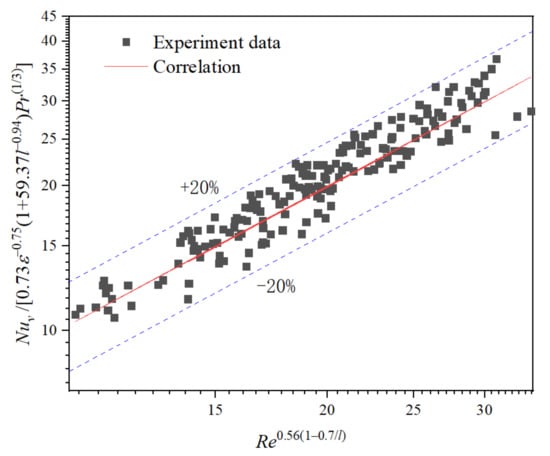
Figure 8.
Nusselt number vs. Reynolds number.
5. Conclusions and Future Work
In this study, we made a thorough investigation of the convective heat transfer between the airstream and the silicon carbide ceramic foam material by using the principle of the single-blow transient measuring technique. The studied samples have the thickness of 30–105 mm, porosity of 0.75–0.85, PPI of 30–60 and the superficial velocity of 0.58–1.76 m/s. The studies were made on a new test rig, which was originally designed for studying the reciprocating flow and heat transfer inside the porous media. The influences of the sample porosity, cell size, sample thickness and the superficial velocity on the volumetric heat transfer coefficient were all parametrically investigated. Four conclusions are summarized as follows:
- (1)
- The local thermal equilibrium phenomenon within the porous media is firstly verified by experiment. One of the theoretical assumptions of the single-blow transient techniques, “the airstream and the entire sample are always under the local thermal nonequilibrium state during the experiment”, is not true. The reason is that there exists the local thermal equilibrium zone within the sample during the experiment.
- (2)
- The local thermal equilibrium phenomenon is prone to occur within the foam materials, because the value of volumetric heat transfer coefficient within the foam materials can be easily reach at 105 W/(m3·K), while the superficial velocity is about 1 m/s (this air velocity is very small in the common engineering applications). When the thickness is large or the surface velocity is low, the local thermal equilibrium phenomenon is particularly considerable.
- (3)
- The single-blow transient measuring technique can still be used to obtain the volumetric heat transfer coefficient, and regardless of the local thermal equilibrium phenomenon. However, the existence of local thermal equilibrium zone will significantly decrease the value of volumetric heat transfer coefficient.
- (4)
- A new correlation includes the foam material’s thickness, porosity, the gas superficial velocity and the gas’s properties, and is considered more applicable. This correlation was built on the base of 54 types of sample (six types of thickness, three types of porosity, and three types of PPI) and a wide range of superficial velocity. The correlation agrees well with the experimental data.
These conclusions are crucial to the theory of convective heat transfer inside the porous media, and can greatly aid researchers in understanding influential factors of the heat transfer performance of porous media, and help engineers to design heat sinks, heat exchangers, volumetric solar air receivers and thermal energy storages with higher efficiency. Although the mean cell size of the studied foam is at the millimeter scale, the theory of local thermal equilibrium phenomenon is suitable to any types of porous media, and with any characteristic length. However, the proposed correlation is only based on the experimental data from the silicon carbide ceramic foam materials, and its accuracy of ±20% is not satisfactory yet. The experimental study of the local thermal equilibrium phenomenon is far from enough. In the future, the measuring and controlling accuracy of the test rig and its operation will be further optimized, and more porous media will be tested and investigated. In addition, more attentions will be paid on the local thermal equilibrium phenomenon.
Author Contributions
Conceptualization, L.Y. and Z.W.; data curation, H.L. and S.X.; formal analysis, Z.W.; funding acquisition, Z.W.; investigation, H.L. and S.X.; methodology, L.Y. and Z.W.; project administration, L.Y. and Z.W. and S.X.; writing—original draft, S.X. and H.L.; writing—review and editing, L.Y., Z.W. and S.X. All authors have read and agreed to the published version of the manuscript.
Funding
This project was financially supported by Natural Science Foundation of China (Grant No.51676180).
Acknowledgments
This work was support by the National Natural Science Foundation of China (Grant No. 51676180).
Conflicts of Interest
The authors declare no conflict of interest.
Nomenclature
| A | Surface area [m2] |
| Specific surface area [m2 m−3] | |
| c | Constant |
| Thermal capacity [J kg−1 K−1] | |
| d | Cell diameter |
| Mean cell size [m] | |
| Pore diameter | |
| Strut diameter | |
| Convective heat transfer coefficient [W m−2 K−1] | |
| Volumetric heat transfer coefficient [W m−3 K−1] | |
| L | Sample thickness |
| Nusselt number based on | |
| P | Pressure [Pa] |
| q | Heat flux [W m−2] |
| Q | Total heat flux [W m−2] |
| Re | Reynolds number () |
| Temperature difference | |
| x | Coordinate along thickness direction |
| l | Dimensionless thickness |
| Velocity | |
| Greek symbols | |
| Thermal conductivity [W m−1 K−1] | |
| Porosity | |
| Dimensionless outlet air temperature | |
| Density [kg m−3] | |
| Dynamic viscosity [kg m−1 s−1] | |
| Residual error | |
| Subscripts | |
| Computational | |
| exp | Experimental |
| m | Equilibrium |
| eff | Effective |
| f | Fluid |
| s | Solid |
| t | Thickness |
| in | Inlet |
| out | Outlet |
| Volumetric | |
| 0 | Refers to t = 0 or Z = 0 |
References
- Zhao, C.Y. Review on Thermal Transport in High Porosity Cellular Metal Foams with Open Cells. Int. J. Heat Mass Transf. 2012, 55, 3618–3632. [Google Scholar] [CrossRef]
- Odabaee, M.; Hooman, K. Metal Foam Heat Exchangers for Heat Transfer Augmentation from a Tube Bank. Appl. Therm. Eng. 2012, 36, 456–463. [Google Scholar] [CrossRef]
- Feng, S.S. An Experimental and Numerical Study of Finned Metal Foam Heat Sinks under Impinging Air Jet Cooling. Int. J. Heat Mass Transf. 2014, 77, 1063–1074. [Google Scholar] [CrossRef]
- Behar, O.; Khellaf, A.; Mohammedi, K. A Review of Studies on Central Receiver Solar Thermal Power Plants. Renew. Sustain. Energy Rev. 2013, 23, 12–39. [Google Scholar] [CrossRef]
- Cao, Z.; Wei, B. α-Fe2O3/Single-Walled Carbon Nanotube Hybrid Films as High-Performance Anodes for Rechargeable Lithium-Ion Batteries. J. Power Sources 2013, 241, 330–340. [Google Scholar] [CrossRef]
- Chueh, W.C.; Falter, C.; Abbott, M.; Scipio, D.; Furler, P.; Haile, S.M.; Steinfeld, A. High-Flux Solar-Driven Thermochemical Dissociation of CO2 and H2O Using Nonstoichiometric Ceria. Science 2010, 330, 1797–1801. [Google Scholar] [CrossRef]
- Bouma, P.H.; De Goey, L.P.H. Premixed Combustion on Ceramic Foam Burners. Combust. Flame 1999, 119, 133–143. [Google Scholar] [CrossRef]
- Salas, K.I.; Waas, A.M. Convective Heat Transfer in Open Cell Metal Foams. J. Heat Transf. Trans. ASME 2007, 129, 1217–1229. [Google Scholar] [CrossRef]
- Wu, Z.; Caliot, C.; Flamant, G.; Wang, Z. Numerical Simulation of Convective Heat Transfer between Air Flow and Ceramic Foams to Optimise Volumetric Solar Air Receiver Performances. Int. J. Heat Mass Transf. 2011, 54, 1527–1537. [Google Scholar] [CrossRef]
- Kribus, A.; Gray, Y.; Grijnevich, M.; Mittelman, G.; Mey-Cloutier, S.; Caliot, C. The Promise and Challenge of Solar Volumetric Absorbers. Sol. Energy 2014, 110, 463–481. [Google Scholar] [CrossRef]
- Younis, L.B.; Viskanta, R. Experimental Determination of the Volumetric Heat Transfer Coefficient between Stream of Air and Ceramic Foam. Int. J. Heat Mass Transf. 1993, 36, 1425–1434. [Google Scholar] [CrossRef]
- Fu, X.; Viskanta, R.; Gore, J.P. Measurement and Correlation of Volumetric Heat Transfer Coefficients of Cellular Ceramics. Exp. Therm. Fluid Sci. 1998, 17, 285–293. [Google Scholar]
- Hwang, J.J. Measurement of Interstitial Convective Heat Transfer and Frictional Drag for Flow across Metal Foams. J. Heat Transf. 2002, 124, 120–129. [Google Scholar] [CrossRef]
- Kamiuto, K. Study of Dul’nev’s Model for the Thermal and Radiative Properties of Open-Cellular Porous Materials. JSME Int. J. Ser. B Fluids Therm. Eng. 1997, 40, 577–582. [Google Scholar] [CrossRef]
- Kamiuto, K.; Yee, S.S. Heat Transfer Correlations for Open-Cellular Porous Materials. Int. Commun. Heat Mass Transf. 2005, 32, 947–953. [Google Scholar] [CrossRef]
- Zhang, H.; Tan, J.; Zhang, L. Measurement of Volumetric Convective Heat Transfer Coefficient in Porous Aluminum. J. Chem. Ind. Eng. 2004, 55, 1710–1713. [Google Scholar]
- Hernández, Á.R.Á. Combined Flow and Heat Transfer Characterization of Open Cell Aluminum Foams. Master’s Thesis, University of Puerto Rico, San Juan, Puerto Rico, 2005. [Google Scholar]
- Zhang, W.; Li, N.; He, D. Inversion Analysis of Volumetric Heat Transfer Coefficient for Porous Aluminum. Chin. J. Mater. Res. 2007, 21, 20–24. [Google Scholar]
- Dietrich, B. Heat Transfer Coefficients for Solid Ceramic Sponges—Experimental Results and Correlation. Int. J. Heat Mass Transf. 2013, 61, 627–637. [Google Scholar] [CrossRef]
- Vijay, D.; Goetze, P.; Wulf, R.; Gross, U. Forced Convection through Open Cell Foams Based on Homogenization Approach: Steady State Analysis. Int. J. Therm. Sci. 2015, 98, 381–394. [Google Scholar] [CrossRef]
- Fend, T.; Hoffschmidt, B.; Pitz-Paal, R.; Reutter, O.; Rietbrock, P. Porous Materials as Open Volumetric Solar Receivers: Experimental Determination of Thermophysical and Heat Transfer Properties. Energy 2004, 29, 823–833. [Google Scholar] [CrossRef]
- Xia, X.-l.; Chen, X.; Sun, C.; Li, Z.-h.; Liu, B. Experiment on the Convective Heat Transfer from Airflow to Skeleton in Open-Cell Porous Foams. Int. J. Heat Mass Transf. 2017, 106, 83–90. [Google Scholar] [CrossRef]
- Kuwahara, F.; Shirota, M.; Nakayama, A. A Numerical Study of Interfacial Convective Heat Transfer Coefficient in Two-Energy Equation Model for Convection in Porous Media. Int. J. Heat Mass Transf. 2001, 44, 1153–1159. [Google Scholar] [CrossRef]
- Krishnan, S.; Murthy, J.Y.; Garimella, S.V. Direct Simulation of Transport in Open-Cell Metal Foams. Am. Soc. Mech. Eng. 2005, 128, 793–799. [Google Scholar]
- Kuwahara, F.; Yamane, T.; Nakayama, A. Large Eddy Simulation of Turbulent Flow in Porous Media. Int. Commun. Heat Mass Transf. 2006, 33, 411–418. [Google Scholar] [CrossRef]
- Ghosh, I. Heat-Transfer Analysis of High Porosity Open-Cell Metal Foam. J. Heat Transf. 2008, 130, 034501. [Google Scholar] [CrossRef]
- Ekade, P.; Krishnan, S. Fluid Flow and Heat Transfer Characteristics of Octet Truss Lattice Geometry. Int. J. Therm. Sci. 2019, 137, 253–261. [Google Scholar] [CrossRef]
- Iasiello, M.; Cunsolo, S.; Bianco, N.; Chiu, W.K.S.; Naso, V. Developing Thermal Flow in Open-Cell Foams. Int. J. Therm. Sci. 2017, 111, 129–137. [Google Scholar] [CrossRef]
- Das, S.; Sneijders, S.; Deen, N.G.; Kuipers, J.A.M. Drag and Heat Transfer Closures for Realistic Numerically Generated Random Open-Cell Solid Foams Using an Immersed Boundary Method. Chem. Eng. Sci. 2018, 183, 260–274. [Google Scholar] [CrossRef]
- Petrasch, J.; Meier, F.; Friess, H.; Steinfeld, A. Tomography Based Determination of Permeability, Dupuit-Forchheimer Coefficient, and Interfacial Heat Transfer Coefficient in Reticulate Porous Ceramics. Int. J. Heat Fluid Flow 2008, 29, 315–326. [Google Scholar] [CrossRef]
- Haussener, S.; Coray, P.; Lipinski, W.; Wyss, P.; Steinfeld, A. Tomography-Based Heat and Mass Transfer Characterization of Reticulate Porous Ceramics for High-Temperature Processing. J. Heat Transf. Trans. ASME 2010, 132, 023305. [Google Scholar] [CrossRef]
- Suter, S.; Steinfeld, A.; Haussener, S. Pore-Level Engineering of Macroporous Media for Increased Performance of Solar-Driven Thermochemical Fuel Processing. Int. J. Heat Mass Transf. 2014, 78, 688–698. [Google Scholar] [CrossRef]
- Zafari, M.; Panjepour, M.; Davazdah Emami, M.; Meratian, M. Microtomography-Based Numerical Simulation of Fluid Flow and Heat Transfer in Open Cell Metal Foams. Appl. Therm. Eng. 2015, 80, 347–354. [Google Scholar] [CrossRef]
- Ambrosio, G.; Bianco, N.; Chiu, W.K.S.; Iasiello, M.; Naso, V.; Oliviero, M. The Effect of Open-Cell Metal Foams Strut Shape on Convection Heat Transfer and Pressure Drop. Appl. Therm. Eng. 2016, 103, 333–343. [Google Scholar] [CrossRef]
- Liu, Z.; Wu, H. Pore-Scale Study on Flow and Heat Transfer in 3D Reconstructed Porous Media Using Micro-Tomography Images. Appl. Therm. Eng. 2016, 100, 602–610. [Google Scholar] [CrossRef]
- Meinicke, S.; Wetzel, T.; Dietrich, B. Scale-Resolved CFD Modelling of Single-Phase Hydrodynamics and Conjugate Heat Transfer in Solid Sponges. Int. J. Heat Mass Transf. 2017, 108, 1207–1219. [Google Scholar] [CrossRef]
- Bailon-Cuba, J.; Emran, M.S.; Schumacher, J. Aspect Ratio Dependence of Heat Transfer and Large-Scale Flow in Turbulent Convection. J. Fluid Mech. 2010, 655, 152–173. [Google Scholar] [CrossRef]
- Vijay, D.; Goetze, P.; Wulf, R.; Gross, U. Homogenized and Pore-Scale Analyses of Forced Convection Through Open Cell Foams. Int. J. Heat Mass Transf. 2018, 123, 787–804. [Google Scholar] [CrossRef]
- Nie, Z.; Lin, Y.; Tong, Q. Numerical Investigation of Pressure Drop and Heat Transfer through Open Cell Foams with 3D Laguerre-Voronoi Model. Int. J. Heat Mass Transf. 2017, 113, 819–839. [Google Scholar] [CrossRef]
- Dixit, T.; Ghosh, I. Simulation Intricacies of Open-Cell Metal Foam Fin Subjected to Convective Flow. Appl. Therm. Eng. 2018, 137, 532–544. [Google Scholar] [CrossRef]
- Schlunder, E.U. Analogy between Heat and Momentum Transfer. Chem. Eng. Process. Process Intensif. 1998, 37, 103–107. [Google Scholar] [CrossRef]
- Gancarczyk, A.; Iwaniszyn, M.; Piątek, M.; Sindera, K.; Korpyś, M.; Jodłowski, P.J.; Łojewska, J.; Kołodziej, A. Interfacial Heat and Momentum Transfer Relation for Porous Media. Int. J. Therm. Sci. 2018, 132, 42–51. [Google Scholar] [CrossRef]
- Quintard, M.; Whitaker, S. Local Thermal-Equilibrium for Transient Heat-Conduction—Theory and Comparison with Numerical Experiments. Int. J. Heat Mass Transf. 1995, 38, 2779–2796. [Google Scholar] [CrossRef]
- Kim, S.J.; Kim, D.; Lee, D.Y. On the Local Thermal Equilibrium in Microchannel Heat Sinks. Int. J. Heat Mass Transf. 2000, 43, 1735–1748. [Google Scholar] [CrossRef]
- Alazmi, B.; Vafai, K. Constant Wall Heat Flux Boundary Conditions in Porous Media under Local Thermal Non-Equilibrium Conditions. Int. J. Heat Mass Transf. 2002, 45, 3071–3087. [Google Scholar] [CrossRef]
- Nield, D.A.; Kuznetsov, A.V.; Xiong, M. Effect of Local Thermal Non-Equilibrium on Thermally Developing Forced Convection in a Porous Medium. Int. J. Heat Mass Transf. 2002, 45, 4949–4955. [Google Scholar] [CrossRef]
- Xu, H.J.; Gong, L.; Zhao, C.Y.; Yang, Y.H.; Xu, Z.G. Analytical Considerations of Local Thermal Non-Equilibrium Conditions for Thermal Transport in Metal Foams. Int. J. Therm. Sci. 2015, 95, 73–87. [Google Scholar] [CrossRef]
- Zhang, W.; Bai, X.; Bao, M.; Nakayama, A. Heat Transfer Performance Evaluation Based on Local Thermal Non-Equilibrium for Air Forced Convection in Channels Filled with Metal Foam and Spherical Particles. Appl. Therm. Eng. 2018, 145, 735–742. [Google Scholar] [CrossRef]
- Wu, Z.; Caliot, C.; Bai, F.; Flamant, G.; Wang, Z.; Zhang, J.; Tian, C. Experimental and Numerical Studies of the Pressure Drop in Ceramic Foams for Volumetric Solar Receiver Applications. Appl. Energy 2010, 87, 504–513. [Google Scholar] [CrossRef]


Publisher’s Note: MDPI stays neutral with regard to jurisdictional claims in published maps and institutional affiliations. |
© 2020 by the authors. Licensee MDPI, Basel, Switzerland. This article is an open access article distributed under the terms and conditions of the Creative Commons Attribution (CC BY) license (http://creativecommons.org/licenses/by/4.0/).