Article

Starting Conditions of Particle Migration in Tight Sandstone Reservoir Development

School of Mechatronic Engineering and Automation, Shanghai University, Shanghai 200444, China
*
Author to whom correspondence should be addressed.
Processes 2020, 8(11), 1491; https://doi.org/10.3390/pr8111491
Submission received: 19 October 2020 / Revised: 12 November 2020 / Accepted: 16 November 2020 / Published: 18 November 2020
(This article belongs to the Special Issue Fluid Dynamics, Multi Phase Flow, and Thermal Recovery Methods)

Abstract

:
In the tight sandstone oil production stage, the migration of particles will not only block the oil path and throat, but also block the wellbore and damage the equipment. Based on the theory of non-Newtonian fluid, hydrodynamics, the extended Derjaguin Landau Verwey Overbeek (DLVO) theory and the JKR (the model of Johnson–Kendall–Roberts) contact theory, the mathematical model and quantitative analysis of the critical condition of the particle separation from the surface due to the influence of oil flow in the fracture environment are presented in this paper. A theoretical model with pressure gradient as the core parameter and particle size, crack size and various contact forces as variables is established. By adding the formula of non-Newtonian fluid and taking the consistency coefficient and fluidity index as the contrast relation, the change rule of particle migration under the influence of non-Newtonian fluid is obtained. Effective prevention and control measures for the purpose of effectively preventing particle migration are also put forward. The results show that with the increase in the fluidity index, the pressure gradient decreases obviously; with the increase in the consistency coefficient, the pressure gradient increases obviously; and with the increase in particle size, the pressure gradient first decreases and then increases, thus creating a U-shaped curve. The lowest pressure gradient exists under the fixed condition.

1. Introduction

With the large-scale commercial production of tight sandstone oil and gas in the United States, Canada, Australia and other countries, tight sandstone oil has become a highlight and a hot field of unconventional oil and gas exploration and development around the world. By 2020, the production of oil sands in Canada, deep-water oil and gas under salt in Brazil, and tight oil in the United States will probably reach 1.5 × 10⁸ t, 2.5 × 10⁸ t and 1.5 × 10⁸ t respectively [1]. The unconventional pattern of “marine facies” in North America has led to the global unconventional oil and gas exploration and development process. The unconventional innovation of “continental facies” in China will provide a theoretical basis for the onshore oil and gas exploration and development, especially for the construction of the oil and gas production bases of China’s onshore (4000–5000) × 104 t level, providing an important resource guarantee and ensuring an increase in production and stability of supply [1]. From the current published literature, researchers have carried out extensive research on the reservoir formation state, production mode and basic laws of tight sandstone reservoirs, and have produced a series of important research results, which have greatly promoted the improvement, and development of unconventional oil and gas geology.
In 1993, Miranda and Underdown carried out core displacement experiments. A new critical velocity analysis method was used to conduct core analysis of oil and gas reservoir formation and to quantitatively analyze the damage of particle migration to the bottom layer [2]. In 1996, Maini et al. studied the composition and properties of common clay minerals in a reservoir, and discussed the formation damage caused by the decrease in permeability caused by the stress and migration of particles in these cases [3]. In 1999, Guo and Norman studied the effect of salinity on particle migration in oil-water multiphase flow and realized it as the change of oil recovery ratio. Due to the migration of particles, the pores are blocked or dredged, thereby affecting oil recovery. They concluded that particle mobility and oil recovery ratio have a certain correlation [4]. In 2000, Neaman et al. studied the particles in the Jordan Valley, looking for the movement rule of particles in different components and of different sizes, and concluded that calcite particles are the most likely to migrate in non-layered silicate minerals. Among the layered silicate minerals, palygorskite is the easiest to migrate in the topsoil. On the other hand, in the subsoil, kaolin is the easiest to migrate [5]. In 2001, Bedrikovetsky et al. showed that the solid and liquid particles dispersed in the injected water were trapped by porous media, which may have significantly increased the hydraulic resistance of the flow, reduced the permeability, and caused oil well damage. A mathematical model of deep-seated filtration with two empirical parameters of filtration coefficient and formation damage coefficient was therefore established [6]. In 2005, Hayatdavoudi studied the critical conditions of particle migration and sand liquefaction, and concluded that when the particle acceleration of loose sand or fine particles exceeds the critical value of 0.19 g, the possibility of fine particle migration and sand liquefaction is greater [7]. In 2010, Civan studied the influence of temperature on the migration and deposition of particles in porous media and the formation damage it caused, and concluded that temperature change has a significant impact on formation damage, with more serious formation damage at high than at low temperatures [8]. In 2015, Huang et al. studied the injection of nanoparticles in the oil extraction process to improve particle stability, reduce pressure drop in the flow path, and increase oil recovery. Experiments show that the flow water with nanoparticles is cleaner, and the pressure drop in the flow passage is smaller [9]. In 2019, Kanimozhi et al. simulated particle migration in the process of fluid phase change, and concluded that during the process of phase change, particles moved slightly due to the change of temperature among other reasons [10].
In recent years, due to the shortage of petroleum resources, research on tight oil reservoirs has received more extensive attention from all walks of life, and a large number of research results have been produced. Xiao et al. studied the influence of temperature and pressure on the carbon dioxide adsorption and storage capacity in tight oil reservoirs [11]. Yi and Afshin studied the recovery and utilization of water in shale oil reservoir mining [12]. Xiaoyong et al. studied the methods of enhancing oil recovery in tight oil reservoirs, and compared the oil recovery with different injection methods [13]. Afshin and Behnam studied a special oil reservoir and simulated six injection methods to compare their recovery factors [14]. Afshin studied the addition of polymers in water to increase oil displacement efficiency, and compared the effects of polymer concentration and formation failure coefficient on oil recovery [15].
Particle movement has numerous adverse effects on the production of tight sandstone oil, which not only leads to a sharp decline in permeability, but also to excessive wear of equipment. The purpose of this study is therefore to study the critical starting conditions of large-scale particle separation in the oil displacement stage, so as to better understand the mechanism of particle separation and its effective control in production.
Many experiments and field studies have shown that the permeability of tight sandstone oil in the process of water flooding is seriously reduced, because the large-scale migration of particles leads to the plugging of narrow holes in porous media [4,5,6]. Particles in the fluid will also lead to wear and premature failure of downhole and surface equipment. Production interruption and equipment replacement greatly increase the production cost. For these reasons, the study of the relevant laws of particle movement infers that the coping methods and control measures in actual production are key to ensuring the high and stable production of oil wells.
We found that previous studies focused on Newtonian fluid media. However, the actual fluid in which the particles are located is non-Newtonian fluid-petroleum. To date, there has been little research on the law of particle migration in non-Newtonian fluid media. Theoretically, we use non-Newtonian fluid, the Derjaguin Landau Verwey Overbeek (DLVO) theory and the coupling effect of extended DLVO and hydrodynamic force to quantitatively explain the chemical and physical critical starting conditions of particle separation [16]. Specifically, if the adhesion force times force arm applied to the fine particles is greater than the splitting power times force arm, it will remain in the adhesion state; otherwise, the particles will fall off the surface. The modeling results are more in line with the actual situation. This paper mainly studies the problems listed below.
There are few reports of oil as the medium in the previous studies. Because the oil medium is a non-Newtonian fluid, the experimental model will be more suitable for the actual production situation by adding relevant equations and variables. From the change of the main variables of non-Newtonian fluid, we aim to find the migration law of particles when these variables change.

2. Motion Conditions of Particles in Non-Newtonian Fluid

The pore and fracture are the main storage space and migration channel of particles, and particles adhere to the fracture surface under the action of adhesive force. In the process of oil displacement in oil field production, the particles adhering to the fracture surface will be affected by oil flow. When the external conditions meet a certain critical value, the particles will move. The corresponding mechanical model has the following assumptions: (1) the fracture surface is a smooth plane; (2) the fluid obeys the Poiseuille theorem (viscous fluid is incompressible, the Reynolds number is not large, and the flow pattern is laminar flow) [17]; and (3) the particle shape is a circular sphere.
As shown in Figure 1, the fluid flows horizontally in it. The forces acting on the particles on the contact surface under the action of fluid include the resistance Fd in the horizontal direction, the lift Fl, the contact force Fa and the friction Ff as well as the gravity Fg. Because the particle size is small (less than 40 nm) and the gravity effect is weak, the gravity effect is ignored for the convenience of calculation.

2.1. Drag Force and Lift Force

2.1.1. Drag Force

In the article by O’Neil [18], the sphere moves or rotates at a uniform speed in a linear shear fluid, in the case of contact between the sphere and the plane, for the coupling of the forces exerted on the sphere and the wall by the shear motion of the fluid, a simple expression is obtained. It can be concluded that in the laminar flow state, the expression Fd of the resistance of fine particles adhering to the crack surface can be calculated (1) [18,19,20] as:
F d   =   1.7009 × 6 π μ r 2 u / z ,
The first coefficient (1.7009) is determined by the width of the fracture, μ is the apparent viscosity of the fluid, r is the particle radius, and u is the fluid velocity in the y direction.

2.1.2. Lift Force

According to Saffman [20], the sphere makes a uniform shear motion in a very viscous uniform liquid, its velocity is measured parallel to the flow line and relative to the flow line through the center. It is found that there is a lifting force in the z direction. From this, we can get the expression of the lift force Fl on the fine particles adhering to the crack surface in the laminar flow state (2) [18,19,20] as follows:
F l   =   81.2 ρ 1 μ r 3 u / z 1.5 ,
The Equations (1) and (2) are calculated by the theoretical model proposed by Goldman, O’Neill and Saffman [16,17,18], where ρ 1 is the density of the fluid, and u / z is the shear rate of the fluid at the center of the fine particle, which comes from the Poiseuille Law [17]:
u z = Δ p 2 μ L H 2 r ,
where ∆p is the pressure difference at both ends of the crack; L is the crack length; and H is the crack width.

2.2. Non-Newtonian Fluid

Since oil is a non-Newtonian fluid, the formula is given according to the power-law fluid model [21]:
μ   =   K 1 u z n 1 ,
where K1 is the consistency coefficient and n is the fluidity index. We substitute Equation (4) into Equations (1)–(3) to obtain:
F d   =   1.7009 × 6 π r 2 K 1 u / z n ,
F l   =   81.2 ρ 1 K 1 r 3 u / z n + 2 2 ,
u z = Δ p 2 K 1 L H 2 r 1 n .

2.3. Contact Force

In the past, the traditional DLVO theory was often used to calculate the interaction force of the spherical plane model, that is, only the double electric layer repulsion and the van der Waals force were considered. However, the non DLVO forces, such as the hydrophobic force, the water resultant force and the Bron repulsion force, are also included in the fluid of the spherical plane model. Bron repulsion force is usually caused by the overlap of electron clouds. In the hydrophobic and hydrophilic forces, Lewis acid-base force is the main force, which is formed by the interaction of the electron donor and the acceptor in the medium [16]. At present, the understanding of non-DLVO force is far less than that of DLVO force. However, it has a great influence on the starting conditions of particle migration, and therefore has practical significance.
Using the extended DLVO theory, the total interaction energy between particles and the crack surface is a combination of electrostatic (EDL) force, Lifshitz van der Waals (LW) force, Lewis acid base (AB) force and Born force. The adhesion Fa is determined by the interaction energy and distance between the fine particles and the contact surface [22]:
F a = ϕ a h = ϕ EDL + ϕ LW + ϕ AB + ϕ BR h ,
Among them, Fa is the total interaction energy between the fine particles and the contact surface; ϕ EDL , ϕ LW , ϕ AB and ϕ BR are the interaction of EDL force, LW force, AB force and Born force respectively; and H is the distance between the fine particles and the contact surface. Assuming that the surface potential is constant, the ϕ EDL between the fine particles and the fracture surface can be approximated by using the equation of Hogg et al. [23] For ball plane systems:
ϕ EDL   =   π ε r ε 0 r 2 ψ 1 ψ 2 ln 1 + exp ( κ h ) 1 exp κ h + ψ 1 2 + ψ 2 2 ln 1 exp 2 κ h ,
where εr is the relative permittivity of the solution (for 298 K crude oil, εr = 2.48); ε0 is the permittivity of the free space (8.854 × 10⁻¹² CV−1m−1); ψ1 and ψ2 are the surface potentials of fine particles and fracture surfaces respectively; and κ is the reciprocal of the Debye length, which can be given as [22]:
κ   =   e 2 n j z j 2 ε r ε 0 k b T = 2 e 2 N A I ε r ε 0 k b T ,
Among them, e, kb and NA are the basic charge (1.602 × 10⁻¹⁹ C), Boltzmann constant (1.38 × 10⁻²³ J/K) and Avogadro number (6.02 × 10²³ mol−1), nj and zj are the quantity concentration and electrovalence of the j-th ion in the solution, I is the ion strength, and T is the temperature in Kelvin (298 K).
For the interaction between the ball and the contact surface, the following equation [23] can be used to estimate ϕLW:
ϕ LW   =   A 132 6 2 r h + r h h + 2 r ln h + 2 r h ,
A 132   =   24 π h 0 2 γ 1 LW γ 3 LW γ 2 LW γ 3 LW ,
Among them, A132 is the effective Hamaker constant of (1-article)-(3-liquid medium)-(2-fracture) system; h0 is the particle separation distance, which is estimated to be (0.15) nm [23]; γLW is the Lifshitz-van der Waals (non-polarity) part of the surface tension.
ϕ AB of the spherical plane system can be calculated by the following relation [23]:
ϕ AB   =   2 π r λ AB ϕ AB h = h 0 exp h 0 h λ AB ,
where λAB is the correlation length of the petroleum molecules, which is generally considered to be between 1 and 2 nm [22]; ϕ AB (h = h0) is the interaction energy of the Lewis acid-base (AB) at h0, calculated by [23]:
ϕ AB h = h 0 = 2 γ 3 + γ 1 + γ 2 γ 3 + γ 3 γ 1 + + γ 2 + γ 3 + γ 1 + γ 2 γ 1 γ 2 + ,
Among them, γ+ and γ are the surface tension components of the electron acceptor (polarity) and electron donor (polarity), respectively. The surface tension parameters (γLW, γ+ and γ) can be calculated from the contact angle (42.5°) [22,24].
Finally, the ϕ BR in the spherical plane system is determined by the following equation [25]:
ϕ BR = A 132 δ 6 7560 8 r   +   h 2 r   +   h 7 + 6 r h h 7 ,
where δ is the Born collision parameter, usually specified as 0.5 nm [16].

2.4. Particle Separation Conditions

Under the action of oil flow, particles move from the surface in three ways: horizontal movement, vertical movement and rolling. The critical condition of horizontal movement and vertical movement is force balance in the horizontal and vertical directions, and the critical condition of rolling is moment balance. It is found that in laminar flow, the main moving mode is rolling [26], and the moment balance expression is as follows:
F d L n =   F n a ,
F n =   F a F L ,
where Ln is the lever arm of the horizontal force, Fn is the total force in the vertical direction, Fa is the interaction force between the particles and the contact surface, and a is the area radius of the deformation of the contact circle between the particles and the plane. According to the previous theoretical model, the following formula can be used:
L n =   0.4 r + r 2 a 2 ,
The area radius can be estimated by the JKR theory, and the formula is as follows [27]:
a   =   0.63 × 4 F n r K 2 1 3 ,
K 2 = 4 3 1 ν 1 2 E 1 + 1 ν 2 2 E 2 ,
where K2 is the contact elastic modulus, E1 and E2 are the Young’s modulus of particles and surfaces respectively, and ν1 and ν2 are the Poisson’s ratio of particles and surfaces respectively.
When the fluidity index n = 4/7, substituting Equations (5)–(7) and (17)–(20) into Equation (16) can obtain the initial moving pressure gradient of particles:
Δ p L = F a ρ 1 1 2 K 1 1 2 r 3 / 162.4 + F a ρ 1 1 2 K 1 1 2 r 3 / 162.4 2 + 0.07117 K 1 1 4 K 2 1 4 ρ 1 1 2 r 1 3 1 2 1 3 + F a ρ 1 1 2 K 1 1 2 r 3 / 162.4 F a ρ 1 1 2 K 1 1 2 r 3 / 162.4 2 + 0.07117 K 1 1 4 K 2 1 4 ρ 1 1 2 r 1 3 1 2 1 3 4 3 / [ 2 K 1 ( H 2 r ) 1 ] .

3. Particle Transport Caused by Non-Newtonian Fluid

(1)
The main forces of particles in the fluid are drag and lift. Their strength and change trend determine the difficulty of particles moving in the fluid to a certain extent. When K1 = 1.2, n = 0.57 and H = 40 μm, the drag and lift increase with the increase in particle size. The difference is that the curve of drag is closer to the first-order relationship, while the curve of lift is closer to the second-order relationship, as shown in Figure 2.
(2)
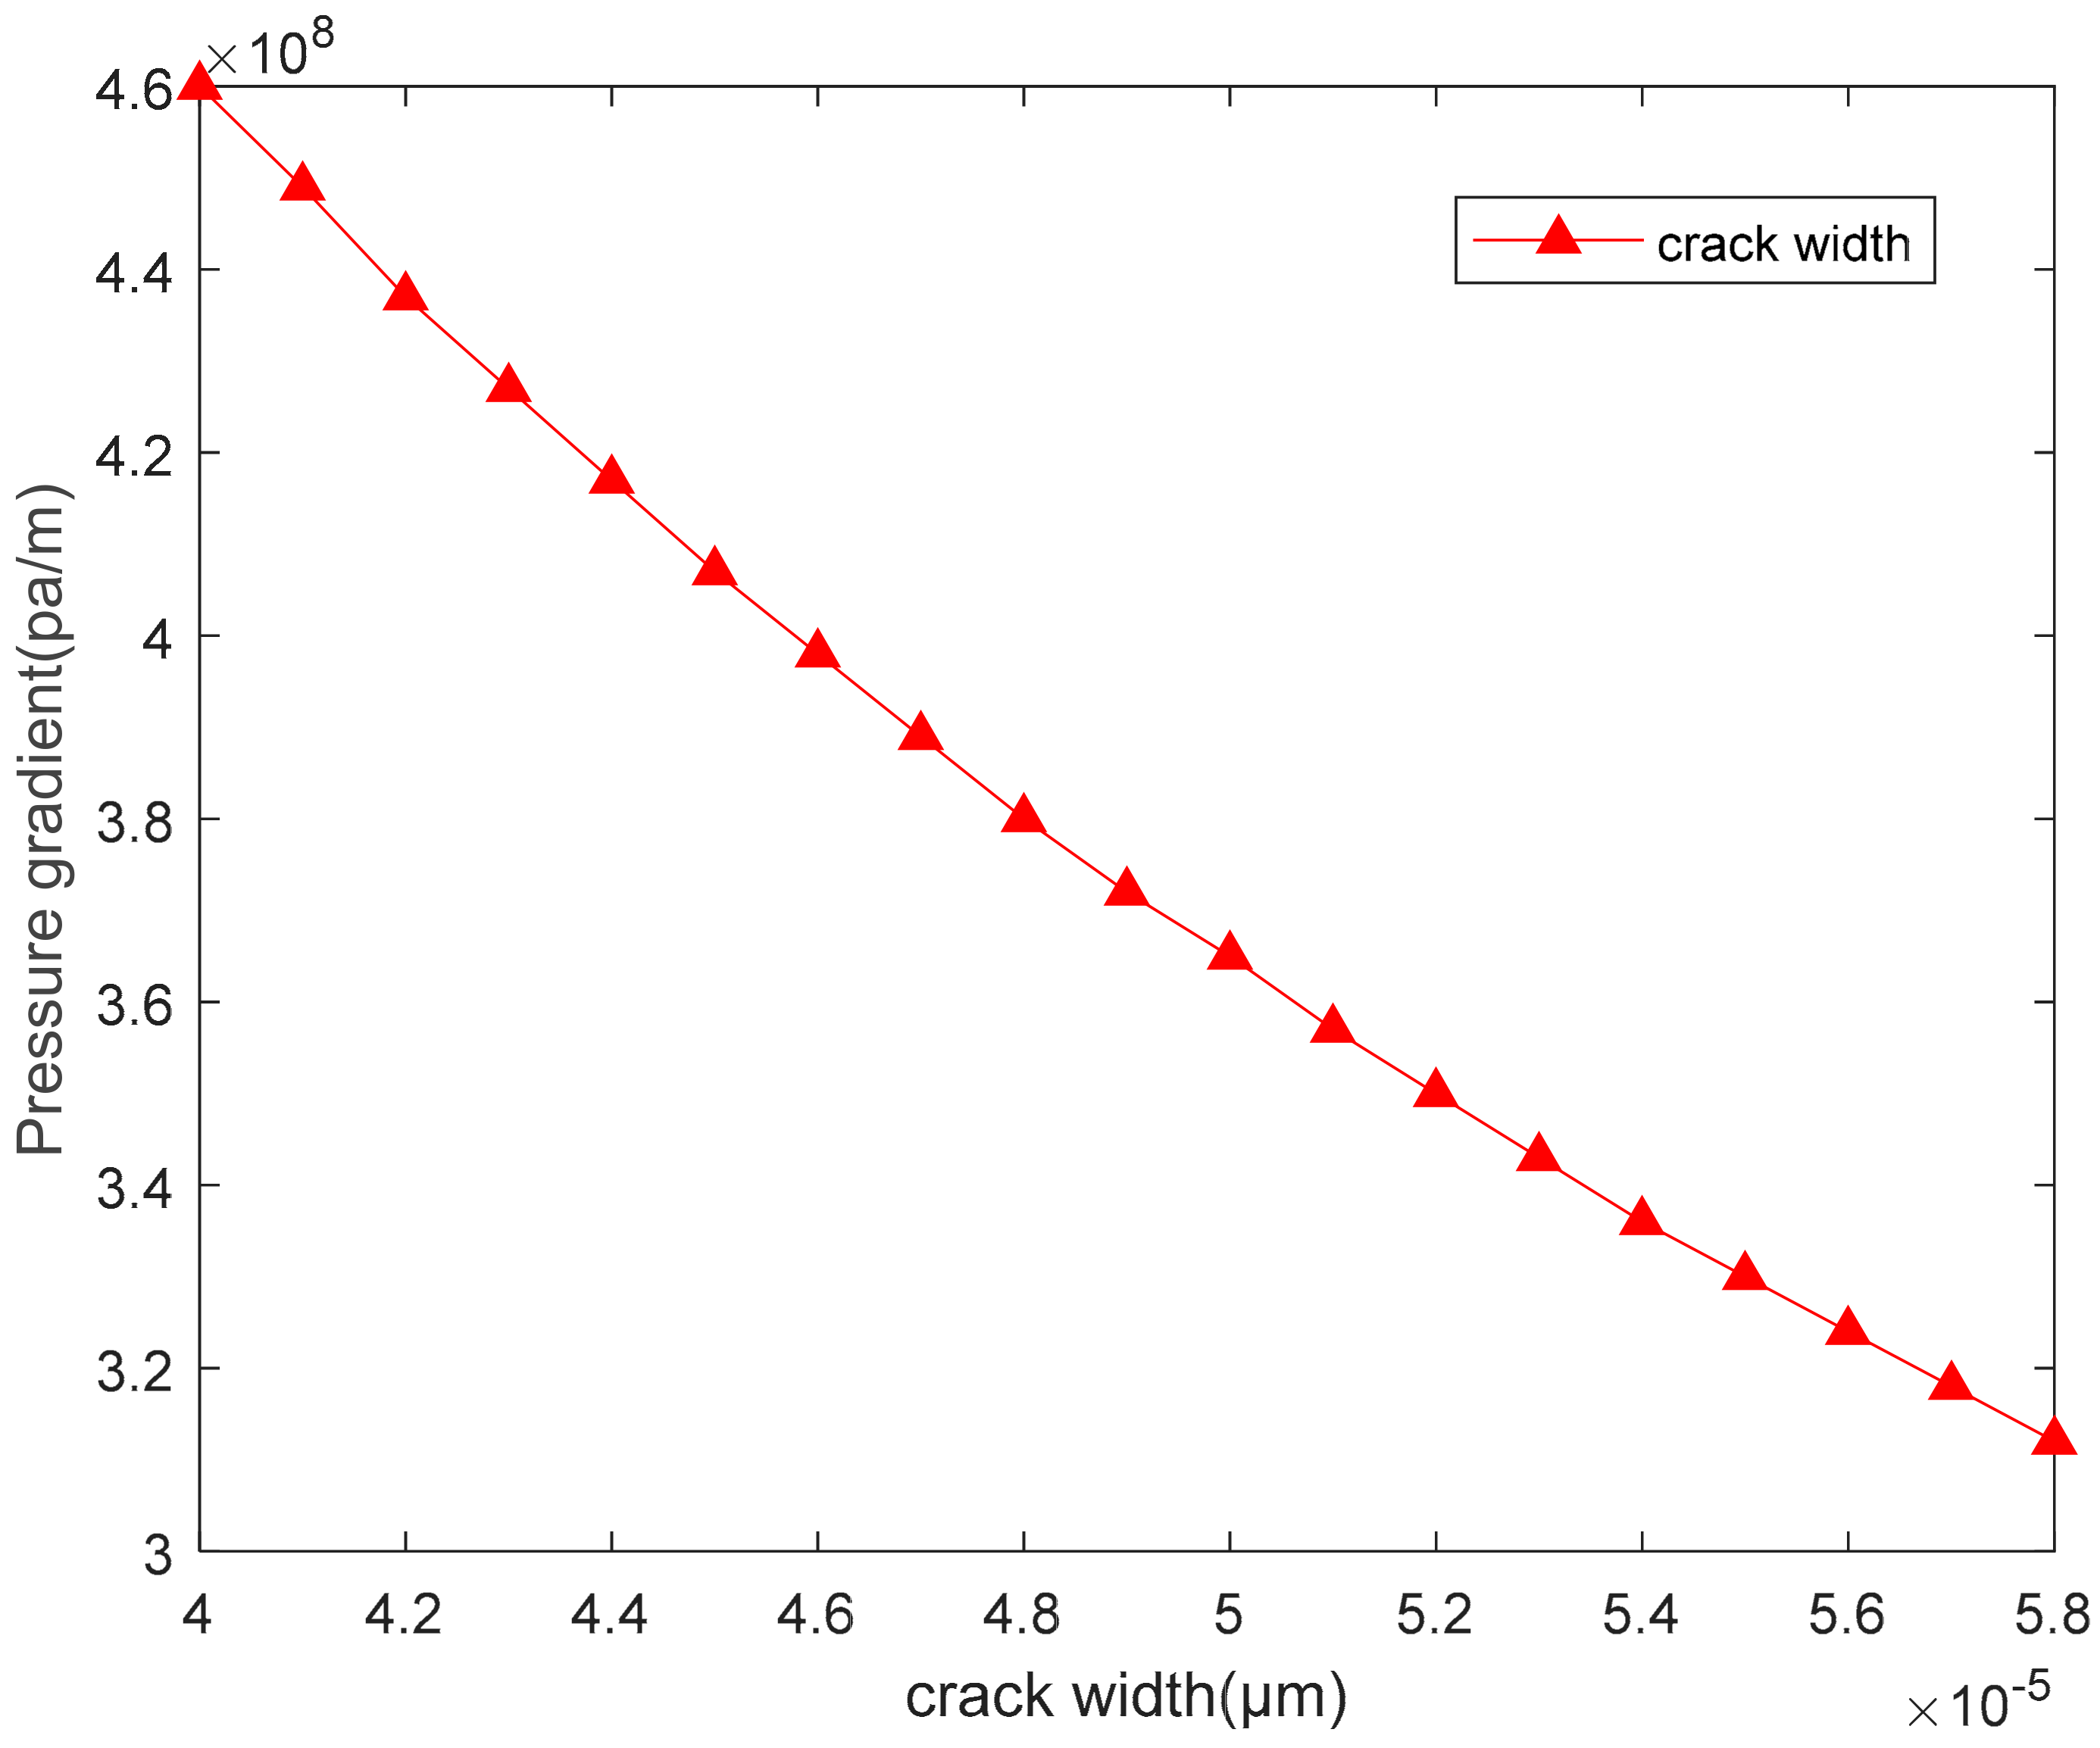
In the process of oil production, the pressure is usually fixed, while the output is uncertain. Therefore, this paper considers that using the flow rate as the standard prediction method has little effect on the actual production, so it is better to use the pressure gradient as the variable to predict the oil production and formation damage. Secondly, in the process of oil production, the width of the passage through which the fluid passes is very different, and the fracture is very heterogeneous. Because the width of each fracture is not uniform and the velocity differs, it is difficult to make statistical comparisons for alignment, but the pressure gradient in each fracture is similar in theory and close to the overall pressure gradient. Considering the above reasons, it is more suitable to use the pressure gradient as the starting condition of particle migration, and to reasonably predict the formation damage caused by particle migration. When K1 = 1.2, n = 0.57 and r = 1 μm, the change of crack width will affect the starting conditions of particles, according to Figure 3, it is found that with the increase in the crack width, the pressure gradient decreases continuously. This indicates that in a wider environment, the particles will become easier to move, as shown in Figure 3.
(3)
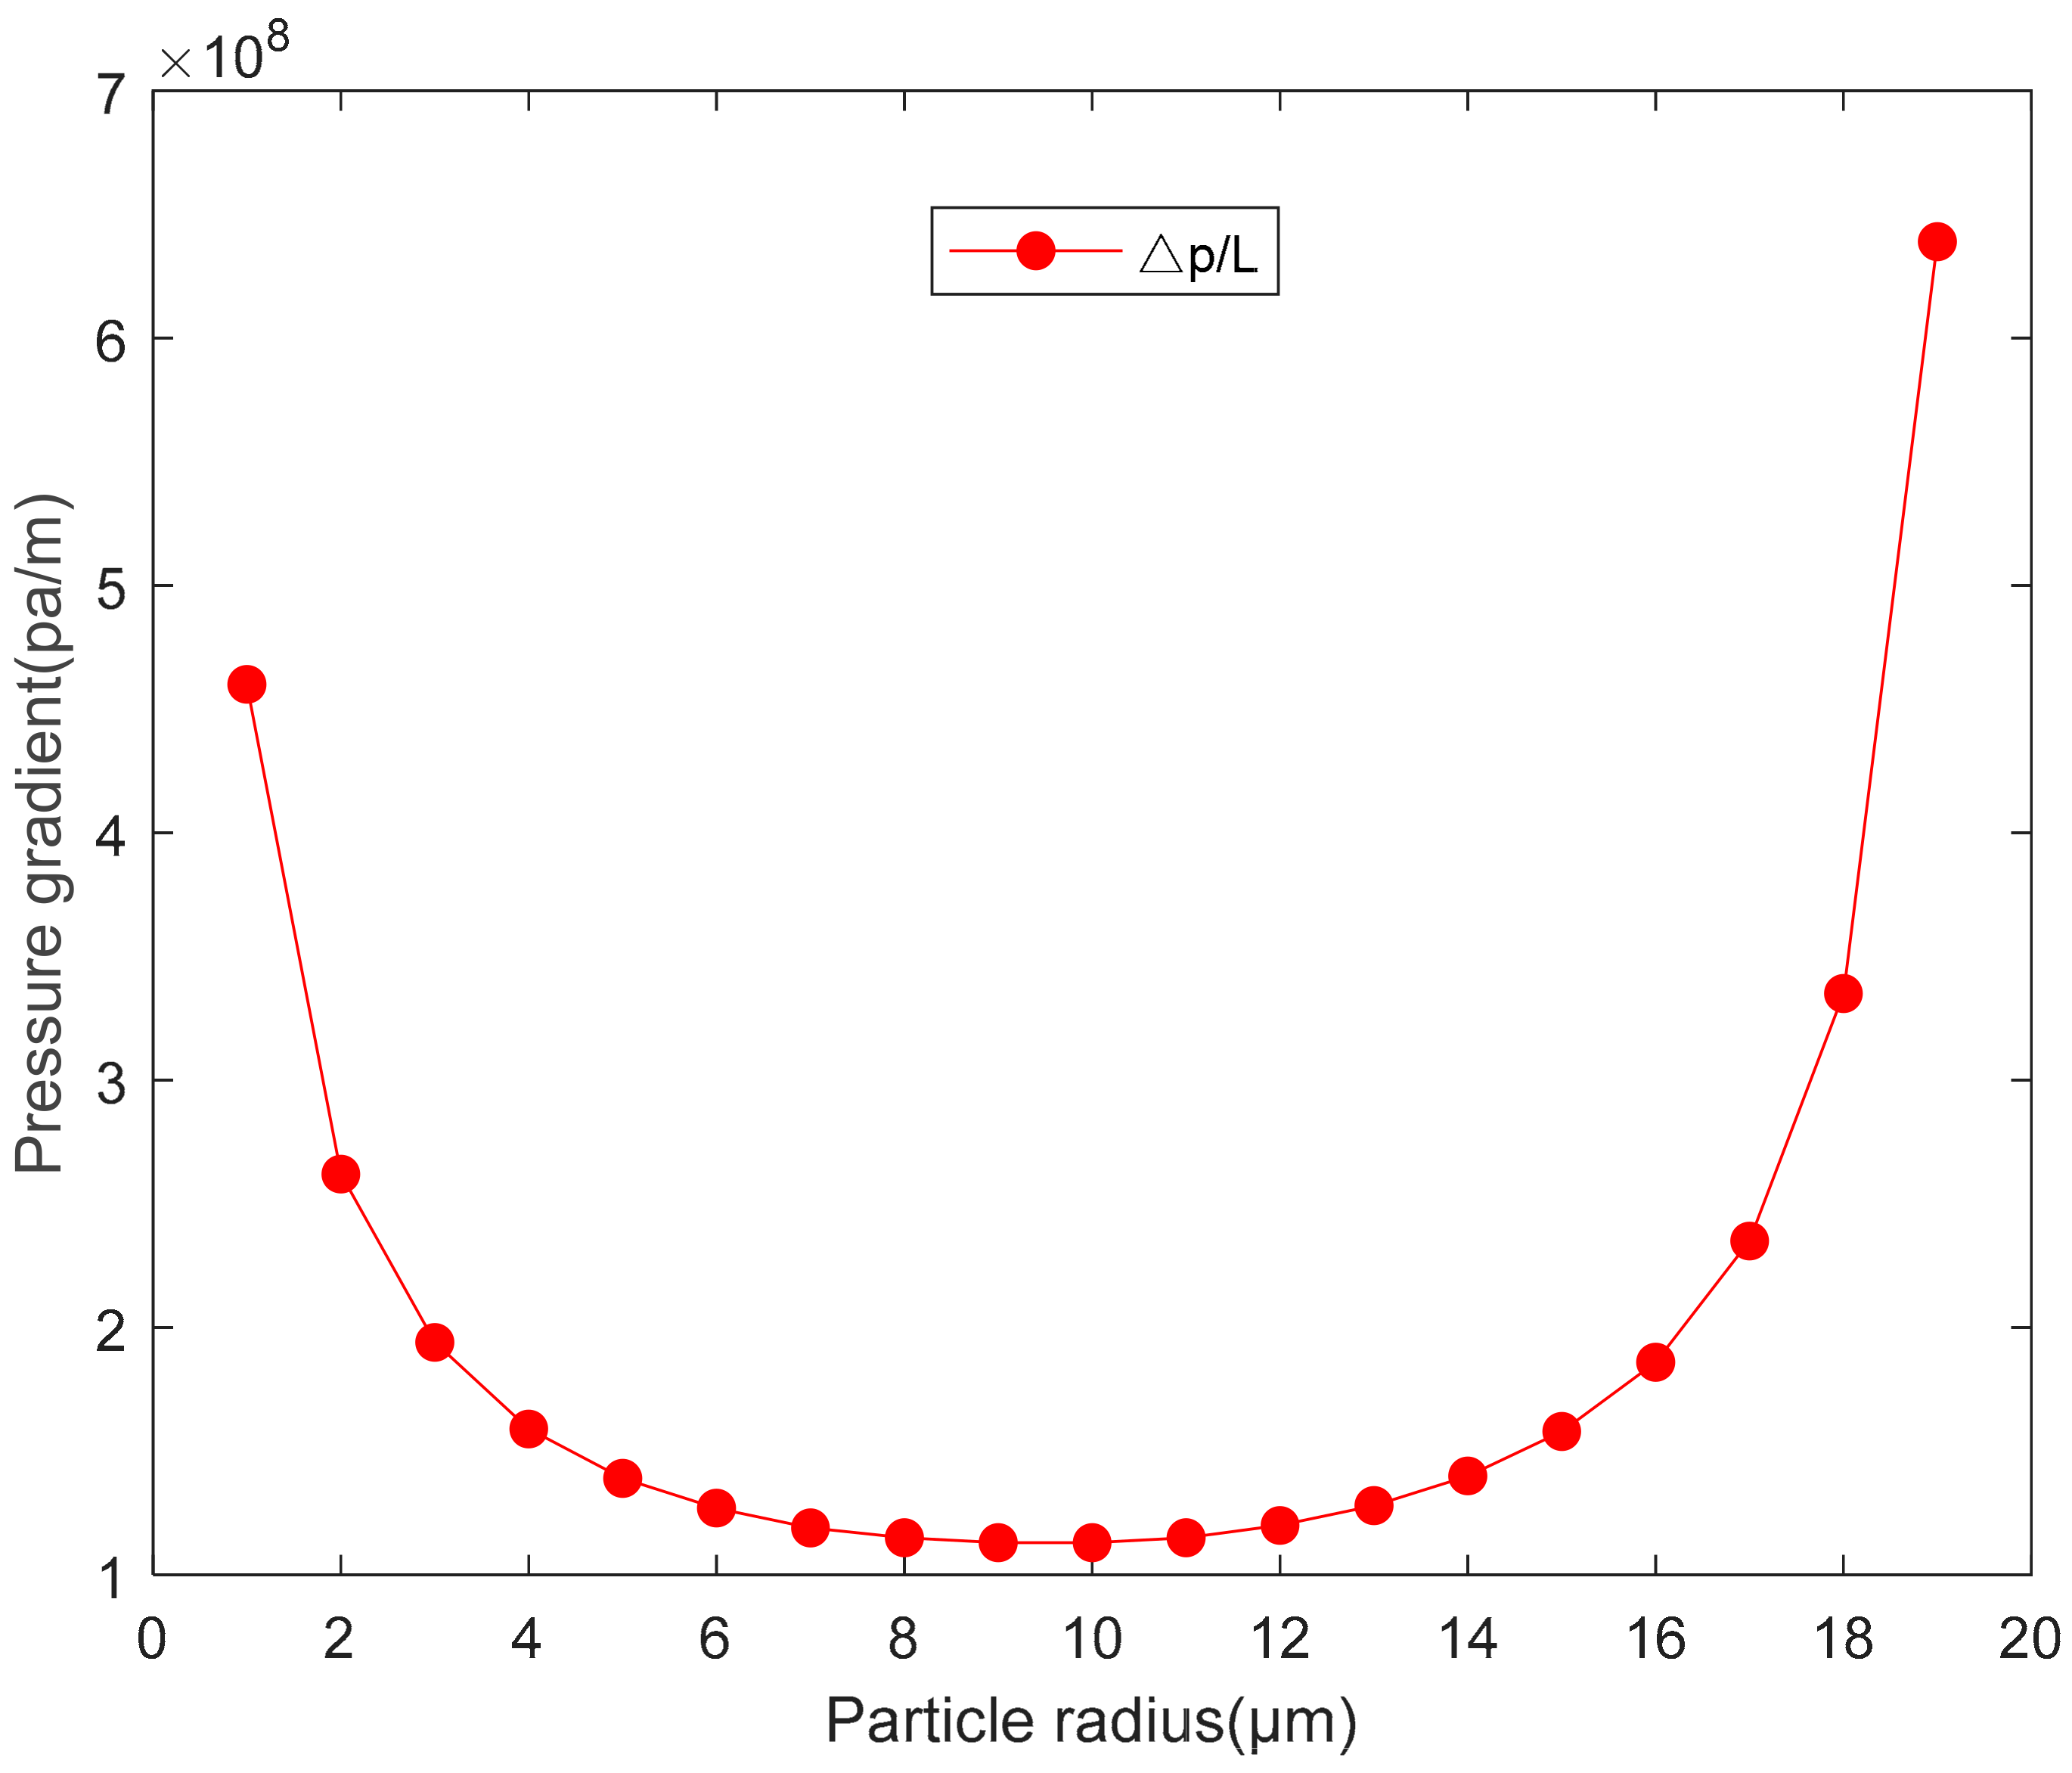
When K1 = 1.2, n = 0.57 and H = 40 μm, as the particle size changes, the starting conditions of the particles will first increase and then decrease. The curve is U-shaped, and there are boundary conditions for particle activation. Based on the results, we can predict the minimum pressure gradient at which particles of various sizes start to migrate, as shown in Figure 4.

4. Effect of Non-Newtonian Fluid with Different Parameters on Particle Migration

In the process of oil production, the fluid in the flow channel is non-Newtonian fluid. The study of the change of non-Newtonian fluid parameters will play a guiding role in high and stable oil production.
(1)
When n = 0.57 and H = 40 μm, the increase in the consistency coefficient will accelerate the growth of resistance and lift. It can be seen that a larger consistency coefficient will lead to greater resistance and lift. When the consistency coefficient increases, the curve of the pressure gradient decreasing with the increase in particle size obviously moves up, as shown in Figure 5. When K1 is increased from 0.8 to 1.2, the drag force and lift force are almost equal from the original, and finally the drag force increases by 65% and the lift by force 39%.
(2)
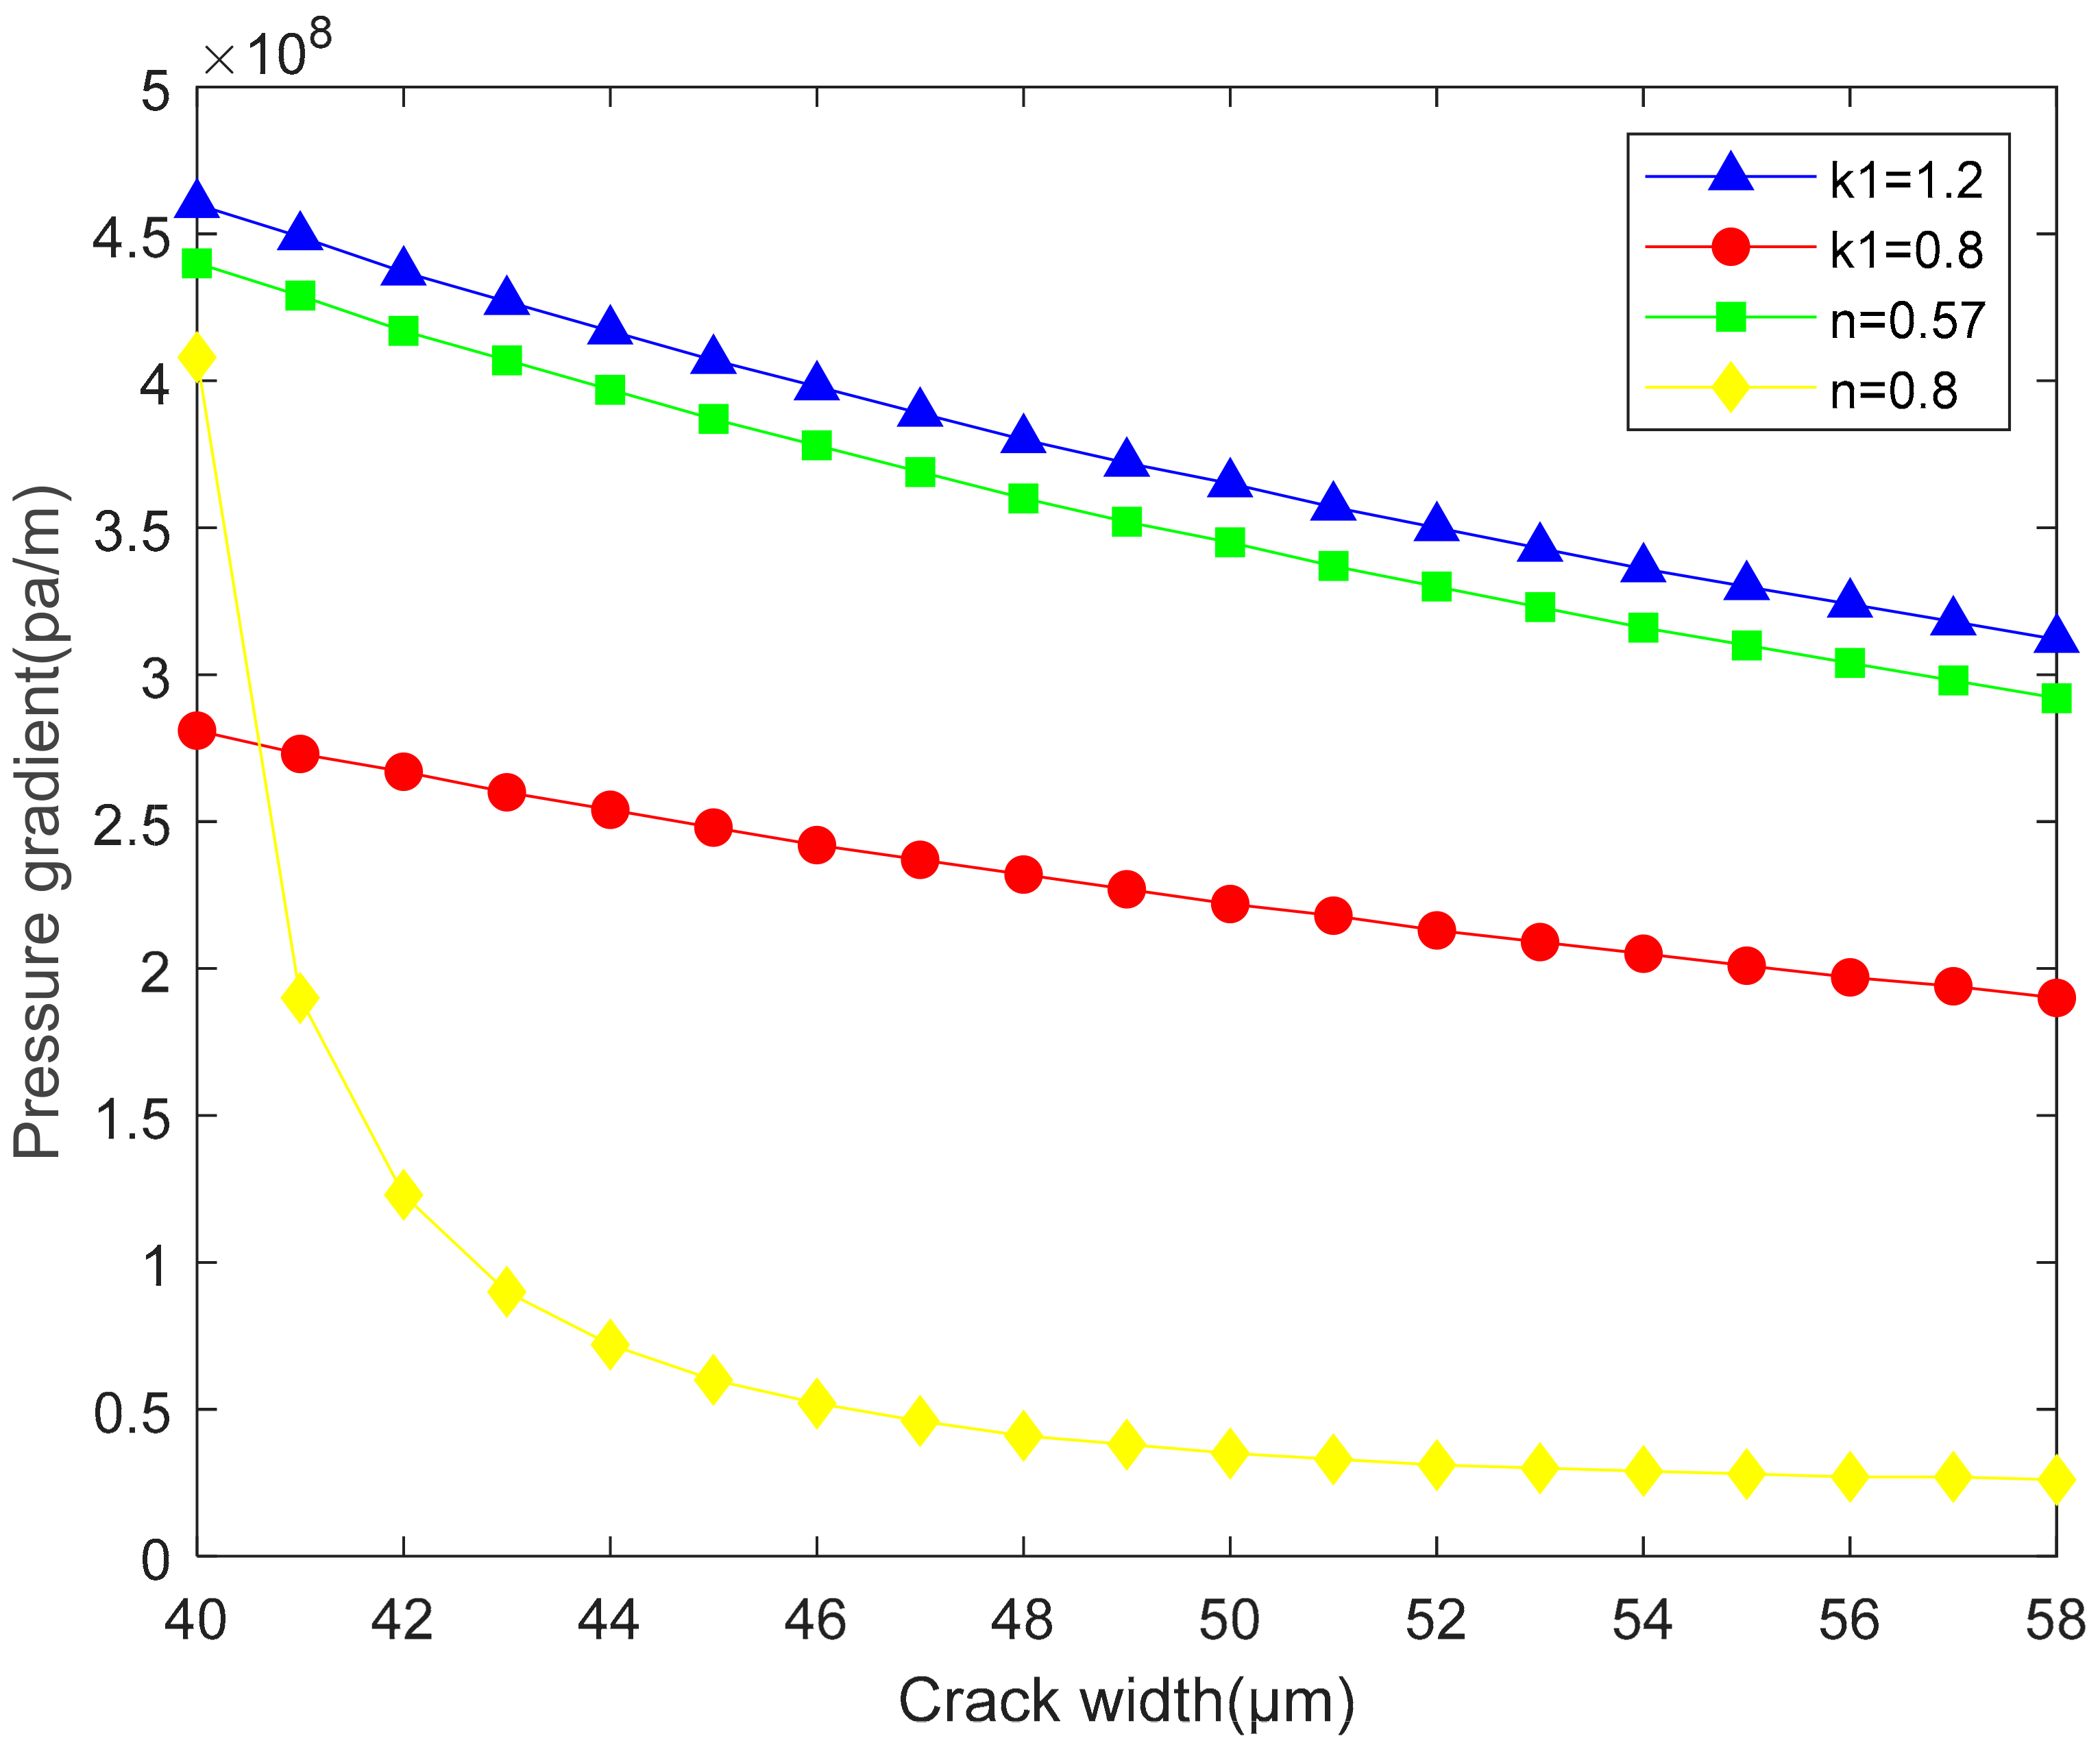
Under the condition that the r = 1 μm. When the fluidity index increases, the curve of the pressure gradient decreasing with the increase of crack width obviously moves down, and it increases the trend of bending and the speed of decline, which is closer to Type C. As the consistency coefficient increases, the curve moves up obviously, but the starting conditions of particles decrease with the increase of cracks. As shown in Figure 6. When k1 increases from 0.8 to 1.2, the final pressure gradient of the curve increases by 65%. When n increases from 0.57 to 0.8, the curve eventually drops to 9% of the original.
(3)
When K1 = 1.2 and H = 40 μm, according to the figure below, with the increase in the fluidity index, the curve of the pressure gradient changing with particle size moves down obviously, the lowest point of the curve decreases obviously, and particle migration becomes easier, as shown in Figure 7. When n is increased from 0.57 to 0.8, the pressure gradient at the lowest point of the curve is reduced to 49% of the original.
(4)
When n = 0.57 and H = 40 μm, with the increase in the consistency coefficient, the curve of the pressure gradient with the change in particle size obviously moves up, and the lowest point of the curve rises. It can be seen that with the increase in the consistency coefficient, the migration of particles becomes easier, as shown in Figure 8. When K1 increases from 0.8 to 1.2, the pressure gradient at the lowest point of the curve increases by 66%.

5. Experimental Demonstration

Samples of particles were collected near the wellbore of Jiangsu Oilfield, and particles with a diameter of less than 40 μm were screened out using a mesh screen. After the particles were placed in an oven at 60 °C for 48 h, the particles were stored in a dry and clean plastic bag.
The experimental research background is the crude oil used, but due to the complexity of the crude oil composition, the consistency coefficient and fluidity index are difficult to control, this experiment uses a polymer solution to simulate the crude oil environment. This experiment uses a common industrial fluid, polyacrylamide (HPAM) solution, with different concentrations to meet the required consistency coefficient and fluidity index. The solution was degassed before use and filtered through a 0.5 μm membrane to remove any entrained particles >0.5 μm in size.
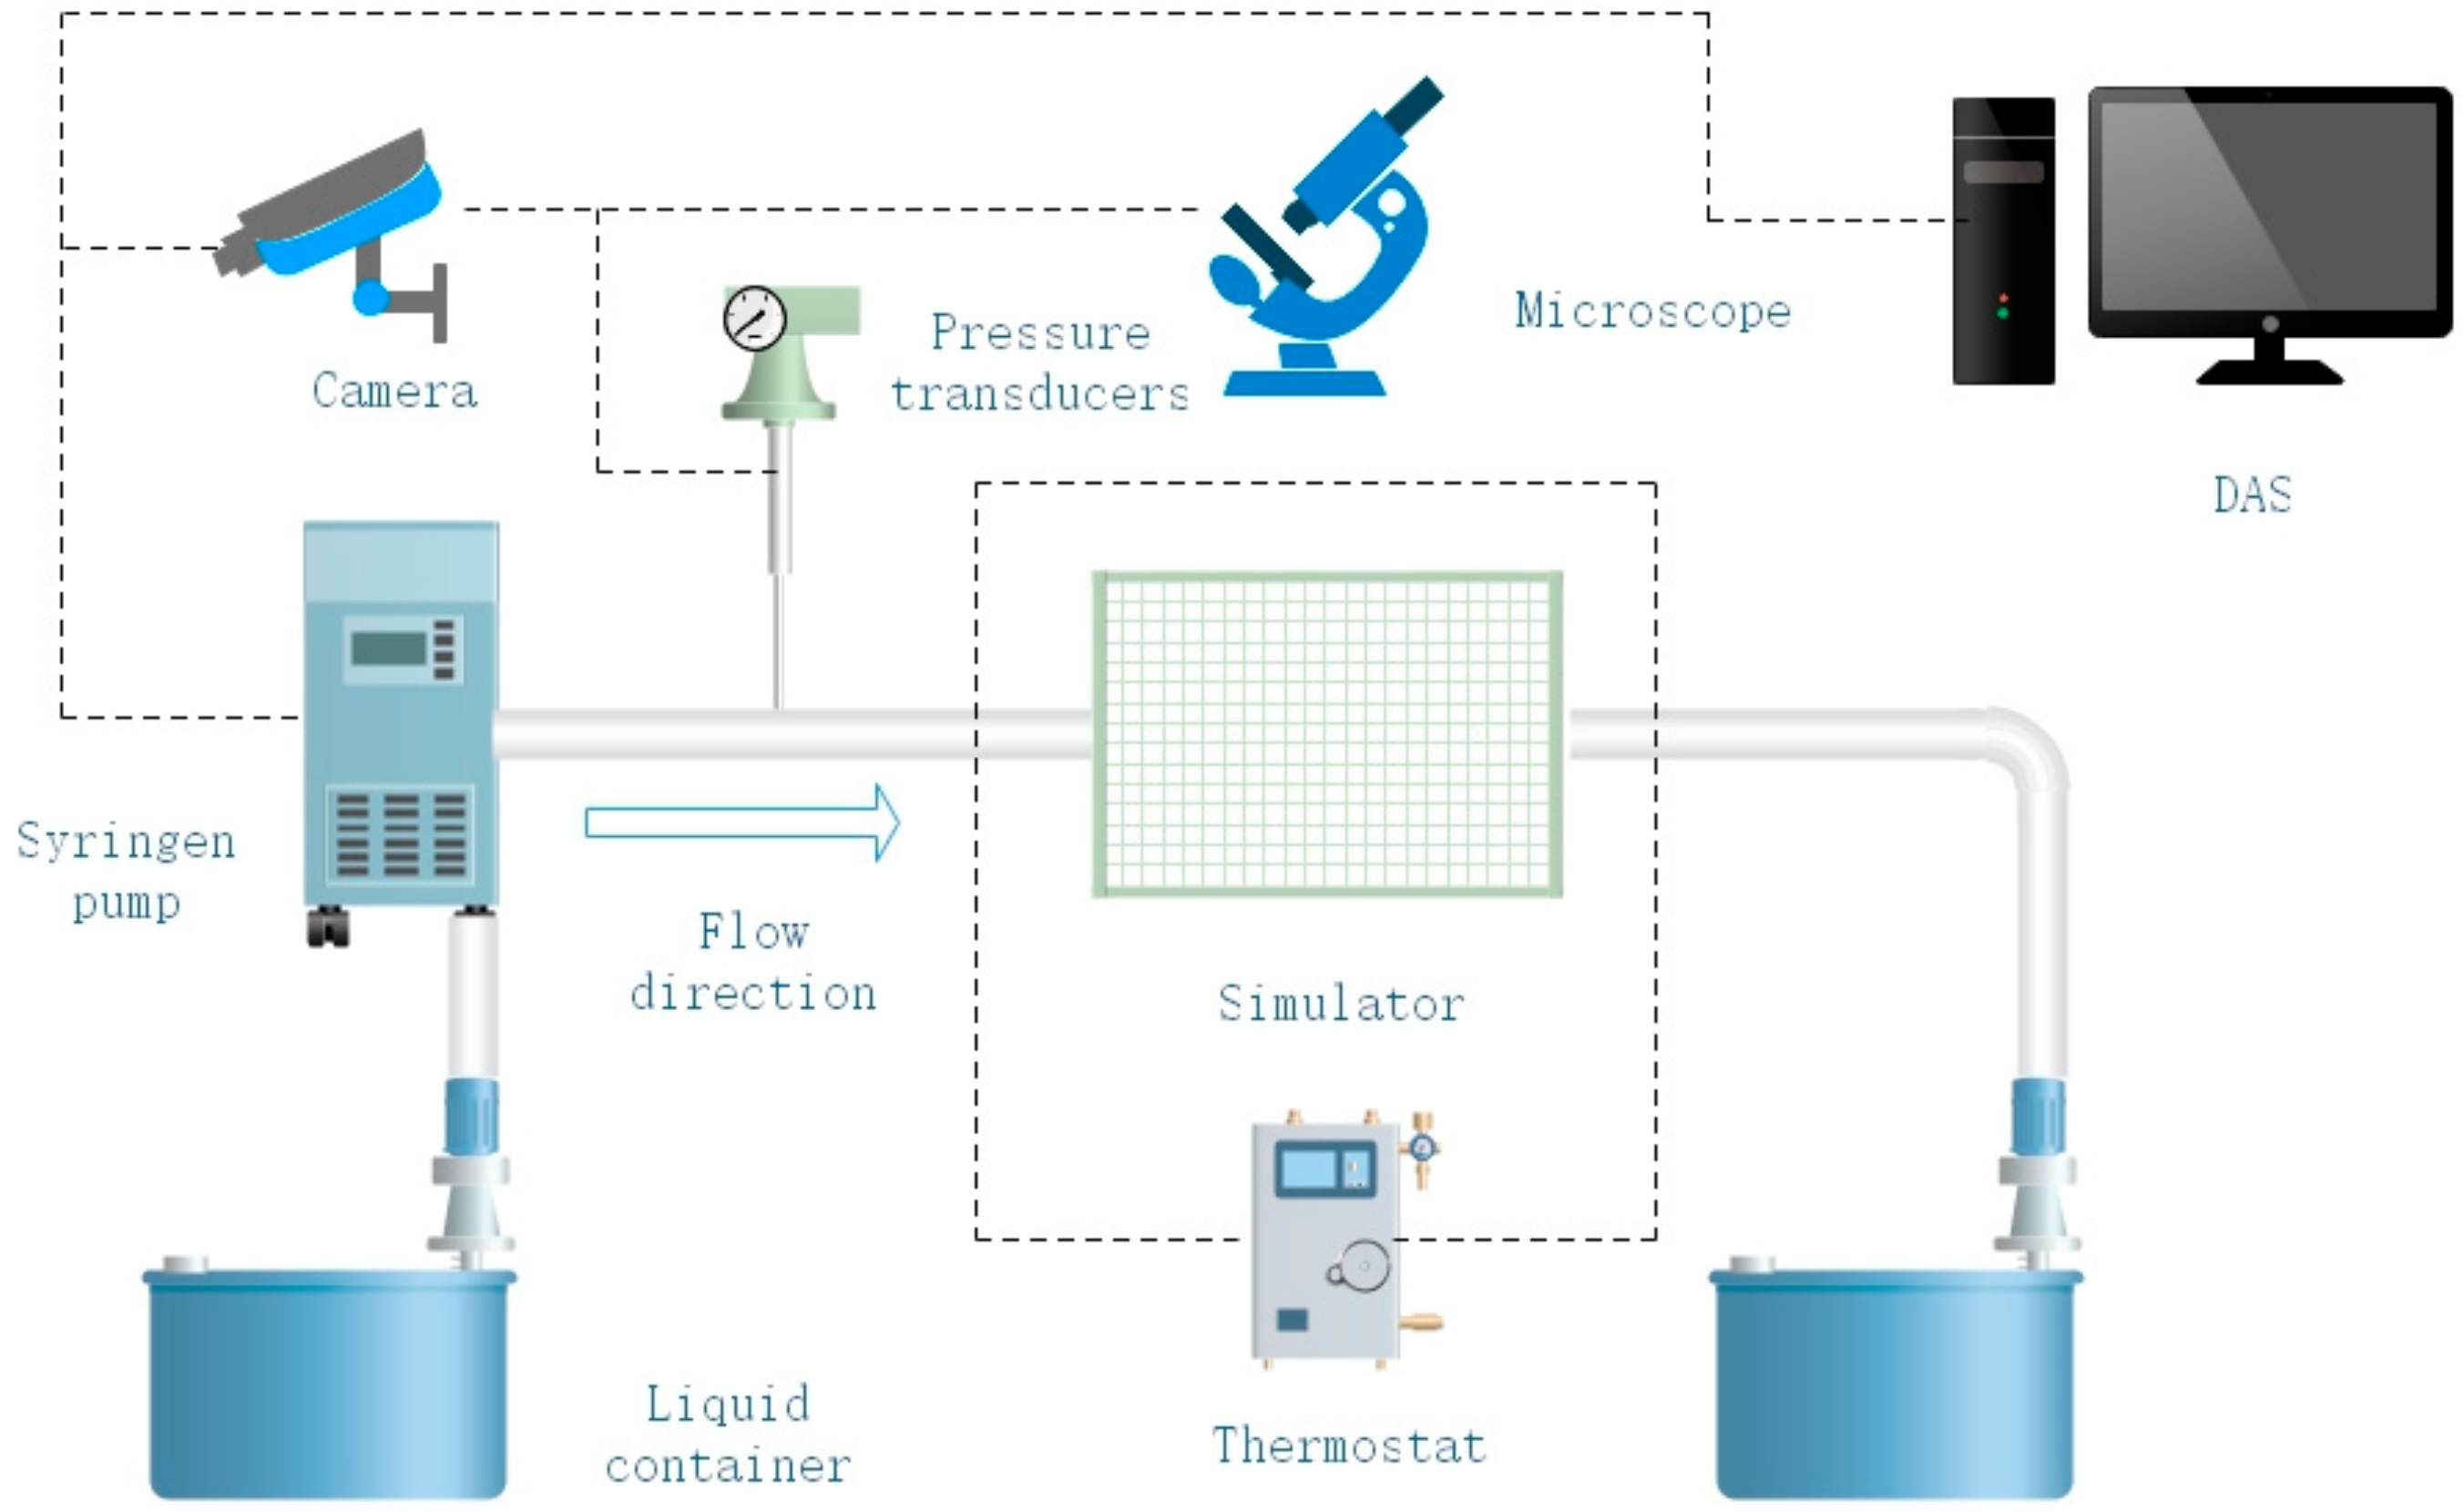
The schematic diagram of the device used in the particle migration experiment is shown in Figure 9. The experimental equipment mainly consists of two reservoirs, a syringe pump, a pressure sensor, a shale simulation device, a temperature controller, a camera, a microscope and it consists of a data acquisition system. A syringe pump is used to inject fluid through the shale simulation device at a constant pressure, and the reservoir on the right continuously collects the effluent fluid. Pressure sensors respectively monitor the pressure at the inlet of the fluid sample. The outlet pressure is maintained at atmospheric pressure. The pressure is digitized and transmitted to the data analysis department and the data is recorded in real time.
The shale simulation device is mainly composed of two parallel pieces of quartz glass, and the distance between the parallel pieces is determined by the metal flakes between the quartz glass, that is, the simulated crack distance. Place experimental particles between the quartz glass and observe with a microscope. We use a video recorder to simultaneously record the time when the particles disappear and the pressure difference between the two sides of the device.
Due to the complex existence of particles, they sometimes overlap or form agglomerates. Sometimes new observation methods and calculation methods are needed. For example, the observation of shadows during imaging [28].
In order to prevent the particles from swelling and dissolving during the experiment, the following preparations should be made before the experiment. Use the filtered and degassed test solution to soak the particles under vacuum for 48 h and place them in a 3 MPa container. Before the experiment, put the test particles into the shale fracture simulation device, and inject the test device with a low-pressure solution for 3 h to ensure stable conditions.
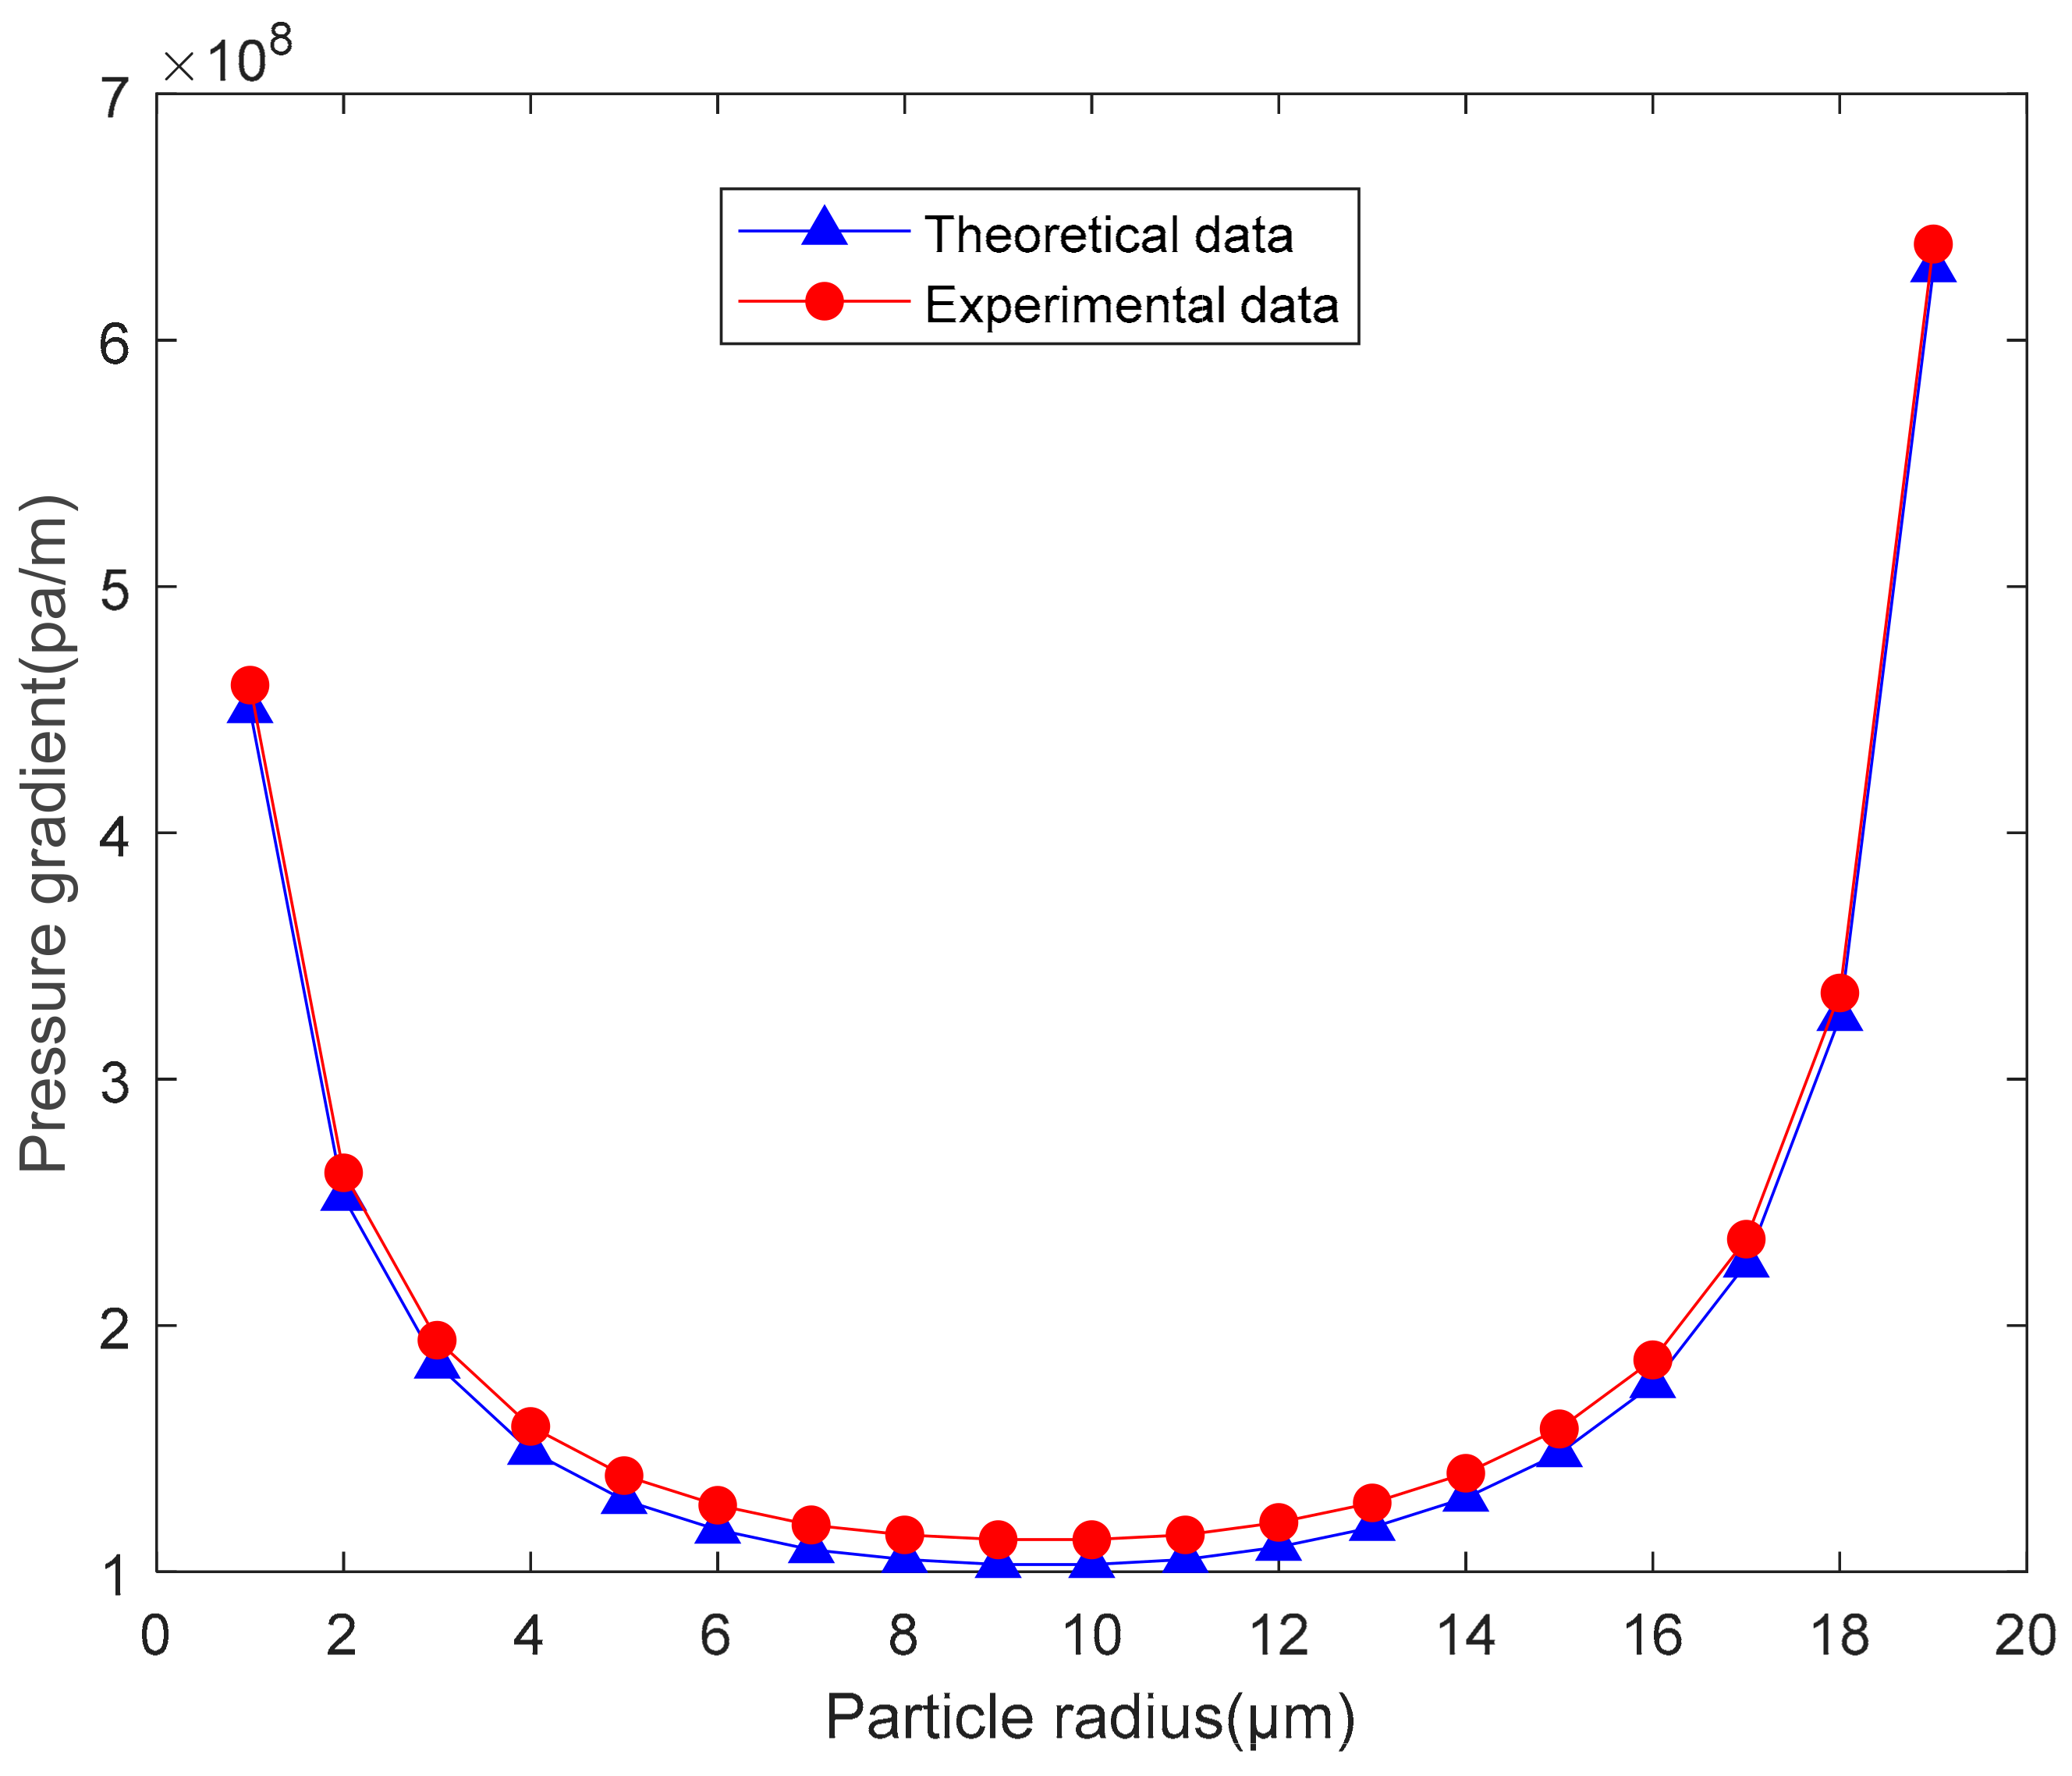
Before quantitatively analyzing the starting conditions of particle migration, the model parameters were determined. Part of it is measured in the laboratory, and the rest of the data refers to the literature [29,30,31]. The types of particles include organic particles and clay particles. The elastic modulus of organic particles is 3.3~8.2 Gpa. Clay minerals are composed of kaolinite. The elastic modulus of kaolinite is 46.2~62.6 Gpa. The Poisson’s ratio of organic matter is 0.15 to 0.49. The Poisson’s ratio of kaolinite is 0.26~0.33. The Lifshitz-van der Waals components, electron acceptor and electron donor components of the surface energy of organic matter are 45.6 mJ/m2, 0.1 mJ/m2 and 6.1 mJ/m2, respectively. The Lifshitz-van der Waals components of kaolinite surface energy, electron acceptor and electron donor components are 70.2 mJ/m2, 0 mJ/m2 and 44.7 mJ/m2, respectively. The composition of crude oil is complex, and various parameters vary widely. The parameters are based on actual tests. If the measurement is difficult, please refer to the information and take reasonable values. The Lifshitz-van der Waals components, electron acceptor and electron donor components of crude oil surface energy are 25.4 mJ/m2, 0 mJ/m2 and 0 mJ/m2, respectively. The density of crude oil is around 0.86 g/cm3. The viscosity of crude oil varies greatly, ranging from 1 to 100 Mpa. The relative permittivity of crude oil is 2.48. The consistency factor is 1.2. The fluidity index is 0.57. After starting the experiment, increase the pressure by 0.1 Mpa every hour, and ensure that the pressure gradually increases to prevent the sudden increase in pressure from changing the flow of fluid. Analyze and record the experimental video results. Draw Figure 10.
As shown in Figure 9, the polymer solution is injected into the shale simulation equipment by a pump at a constant pressure, and the input pressure is detected and recorded by a pressure sensor. The video recorder records the particle position at the time. Every hour, the pressure increases by 0.1 Mpa. Find and record the moving particles by comparing the picture at that time with the picture one hour ago. Figure 10 is drawn based on the recorded results and compared with the theoretical curve. As shown in Figure 10, as the particle size changes, the initial conditions of the particles will first increase and then decrease. The curve is U-shaped, and there are boundary conditions for the initial particle, but the theoretical curve moves up slightly.
(1)
There is a chart showing that the experimental results are generally consistent with the theoretical results, and the theoretical calculations reasonably predict the actual situation.
(2)
Since there are many differences between the glass plane and the actual crack plane, the actual crack is rougher.
(3)
Since the particles in theory are perfectly spherical and differ from the actual particles, the actual particles have more tips and protrusions and are more likely to migrate due to the movement of the fluid. The experimental curve is also clearly above the theoretical curve. On the one hand, the error produced by the experimental design is formed.
Comparing the experimental results with model predictions shows that the model prediction results are less than the experimental results. The prediction error in using this model is due to the simplified consideration of the actual situation. The model assumes that the particles are spherical and have smooth surfaces. The actual particles are irregular and have very complex shapes. The surface shape of the particle affects the contact form between the particle and the surface. Thereby changing the adhesion. The surface shape of the particle has a certain effect on drag, lift and the complex flow field around the particle. As a result, the pressure gradient required for the activation of irregular particles is greater than the pressure gradient required for the activation of spherical particles. The actual surface roughness of the contact surface is not uniform, and the surface roughness has an influence on the force generated by the particles and the surface. Consider the experimental results, in the case of uneven surface roughness. The pressure gradient required for particle activation increases. Although there are errors between experimental and theoretical predictions, the boundary conditions used to predict particle startup meet the demand.

6. Conclusions

(1)
The starting pressure gradient of particles in fractures decreases first and then increases with the increase in particle size, and the starting pressure gradient of particles with the same particle size in fractures with different fracture width also differs; specifically, the larger the fracture width is, the smaller the starting pressure gradient of the particles is.
(2)
Based on the theory of this paper, when designing a reasonable interval of oil production pressure gradient, the principle of improving the permeability of the maximum fracture width should be given priority, and the maximum pressure gradient should be controlled, so as to effectively prevent the migration of particles.
(3)
According to the theory of this paper, the risk of formation damage in each stage of oil well operation can be reduced, the damage of permeability caused by fine particle migration can be avoided, the damage of equipment caused by impurities can be effectively reduced, and stable production can be effectively achieved.
(4)
The non-Newtonian fluid coefficient has a significant effect on the particle migration curve. With the increase in the fluidity index, particle migration becomes easier, while with the increase in the consistency coefficient, particle migration becomes more difficult. It is thus very important to consider the influence of the production environment on the fluidity index and the consistency coefficient in production.
(5)
The objects studied in previous articles are often the state of motion and initial conditions of uniform particles under the influence of Newtonian fluid in the pore structure. However, for the gap structure, different gap size, different particle size, quantitative research in non-Newtonian fluid is insufficient. This article intends to study the starting conditions of particle migration under the influence of non-Newtonian fluid under different gap sizes and different particle sizes.
The migration of particles will cause a series of problems such as blockage channel and equipment damage. The production site requires certain prevention and control of particle migration. The physical aspect is mainly to prevent and control particle migration by controlling the pressure gradient. However, the production site is different from laboratory experiments. There is this discrete fracture network in the reservoir. According to model prediction, the larger the fracture, the easier the particles will move. Therefore, the largest fracture measured on site is the prevention and control target. According to theory, we need to predict the boundary conditions of particle migration and determine the pressure gradient. Particles smaller than this pressure gradient rarely migrate. In terms of chemistry, we can greatly increase the difficulty of particle migration by injecting stabilizers to change the parameters that mainly affect particle migration in the theoretical model, such as increasing surface adhesion.

Author Contributions

J.S. has carried on the theory and the deduction experiment verification and the article writing, X.Z. carries on the supervision and the examination to this article. All authors have read and agreed to the published version of the manuscript.

Funding

This work is supported by the Natural Science Foundation of China (51574161).

Conflicts of Interest

The authors declare that they have no conflicts of interest.

Nomenclature

Fddrag force (N)
Fllift force (N)
μapparent viscosity of the fluid (Pa·s)
rparticle radius (m)
u/zshear rate of the fluid at the center of the fine particle (s−1)
ρldensity of the fluid (kg/m3)
∆ppressure difference at both ends of the crack (pa)
Lcrack length (m)
Hcrack width (m)
K1consistency coefficient
nfluidity index
Facontact force (N)
ϕatotal interaction energy (J)
hdistance between the fine particles and the contact surface (m)
ϕEDLEDL force (J)
ϕLWLW force (J)
ϕABAB force(J)
ϕBRBorn force (J)
ε0permittivity of the free space (c/(V*m))
εrrelative permittivity
ψ1, ψ2surface potentials of fine particles and fracture surfaces respectively (V)
κreciprocal of the Debye length (m−1)
eElectronic charge (C)
Njconcentration of the J~(th) ion in solution (m−3)
ZjValence state of the J~(th) ion in solution
N0Avogadro constant
Iion strength (mol/L)
KbBoltzmann constant (J/K)
Ttemperature (K)
A132effective Hamaker constant of (1-particle)-(3-liquid medium)-(2-fracture) system (J)
h0particle separation distance (m)
γLWLifshitz-van der Waals (non-polarity) part of the surface tension (J/m2)
δBorn collision parameter (m)
λABcorrelation length of the petroleum molecules (m)
ϕAB (H = H0)interaction energy of the Lewis acid-base (AB) at H0 (J/m2)
γ+, γsurface tension components of the electron acceptor (polarity) and electron donor (polarity) (J/m2)
Fntotal force in the vertical direction (N)
Lnlever arm of the horizontal force (m)
aarea radius of the deformation of the contact circle between the particles and the plane (m)
K2contact elastic modulus (Pa)
E1, E2Young’s modulus of particles and surfaces respectively (Pa)
ν1, ν2Poisson’s ratio of particles and surfaces respectively

References

  1. Zou, C.; Zhu, R.; Wu, S. Types, characteristics, genesis and prospects of conventional and unconventional hydrocarbon accumulations: Taking tight oil and tight gas in China as an instance. Acta Pet. Sin. 2012, 33, 173–187. [Google Scholar]
  2. Miranda, R.M.; Underdown, D.R. Laboratory Measurement of Critical Rate: A Novel Approach for Quantifying Fines Migration Problems. In Proceedings of the SPE Production Operations Symposium, Oklahoma City, OK, USA, 21–23 March 1993. [Google Scholar]
  3. Maini, B.; Wassmuth, F.; Schramm, L.L. Fines Migration in Petroleum Reservoirs. Adv. Chem. 1996, 251, 321–375. [Google Scholar]
  4. Tang, G.Q.; Morrow, N.R. Influence of brine composition and fines migration on crude oil/brine/rock interactions and oil recovery. J. Pet. Sci. Eng. 1998, 24, 99–111. [Google Scholar] [CrossRef]
  5. Neaman, A.; Singer, A.; Stahr, K. Dispersion and migration of fine particles in two palygorskite-containing soils of the Jordan Valley. J. Plant Nutr. Soil Sci. 2000, 163, 537–547. [Google Scholar] [CrossRef]
  6. Bedrikovetsky, P.; Marchesin, D.; Shecaira, F.; Souza, A.; Milanez, P.; Rezende, E. Characterisation of deep bed filtration system from laboratory pressure drop measurements. J. Pet. Sci. Eng. 2001, 32, 167–177. [Google Scholar] [CrossRef]
  7. Hayatdavoudi, A. Formation Sand Liquefaction: A Mechanism for Explaining Fines Migration and Well Sanding. J. Energy Resour. Technol. 2005, 127, 181–190. [Google Scholar] [CrossRef]
  8. Civan, F. Non-isothermal Permeability Impairment by Fines Migration and Deposition in Porous Media including Dispersive Transport. Transp. Porous Media 2010, 85, 233–258. [Google Scholar] [CrossRef]
  9. Huang, T.; Clark, D.E. Enhancing Oil Recovery With Specialized Nanoparticles by Controlling Formation-Fines Migration at Their Sources in Waterflooding Reservoirs. SPE J. 2015, 20, 743–746. [Google Scholar] [CrossRef]
  10. Kanimozhi, B.; Prakash, J.; Pranesh, R.V.; Mahalingam, S. Numerical and experimental investigation on the effect of retrograde vaporization on fines migration and drift in porous oil reservoir: Roles of phase change heat transfer and saturation. J. Pet. Explor. Prod. Technol. 2019, 9, 2953–2963. [Google Scholar] [CrossRef] [Green Version]
  11. Hu, X.; Xie, J.; Cai, W.; Wang, R.; Davarpanah, A. Thermodynamic effects of cycling carbon dioxide injectivity in shale reservoirs. J. Pet. Sci. Eng. 2020, 195, 107717. [Google Scholar] [CrossRef]
  12. Yi, J.; Afshin, D. Using Photo-Fenton and Floatation Techniques for the Sustainable Management of Flow-Back Produced Water Reuse in Shale Reservoirs Exploration. Water Air Soil Pollut. 2020, 231. [Google Scholar] [CrossRef]
  13. Hu, X.; Li, M.; Peng, C.; Davarpanah, A. Hybrid Thermal-Chemical Enhanced Oil Recovery Methods; An Experimental Study for Tight Reservoirs. Symmetry 2020, 12, 947. [Google Scholar] [CrossRef]
  14. Afshin, D.; Behnam, M. A simulation study to control the oil production rate of oil-rim reservoir under different injectivity scenarios. Energy Rep. 2018, 4, 664–670. [Google Scholar]
  15. Afshin, D. Parametric Study of Polymer-Nanoparticles-Assisted Injectivity Performance for Axisymmetric Two-Phase Flow in EOR Processes. Nanomaterials 2020, 10, 1818. [Google Scholar] [CrossRef]
  16. Israelachvili, J.N. Intermolecular and Surface Force; Academic Press: London, UK, 1992. [Google Scholar]
  17. Sutera, S.P.; Skalak, R. The History of Poiseuille’s Law. Annu. Rev. Fluid Mech. 1993, 25, 1–20. [Google Scholar] [CrossRef]
  18. O’Neill, M.E. A sphere in contact with a plane wall in a slow linear shear flow. Chem. Eng. Sci. 1968, 23, 1293–1298. [Google Scholar] [CrossRef]
  19. Goldman, A.J.; Cox, R.G.; Brenner, H. Slow viscous motion of a sphere parallel to a plane wall—I motion through a quiescent fluid. Chem. Eng. Sci. 1967, 22, 637–651. [Google Scholar] [CrossRef]
  20. Saffman, P.G. The lift on a small sphere in a slow shear flow. J. Fluid Mech. 1965, 22, 385–400. [Google Scholar] [CrossRef] [Green Version]
  21. Ostwald, W. de Waele-Ostwald equation. Kolloid Z. 1929, 47, 176–187. [Google Scholar] [CrossRef]
  22. Bergendahl, J.; Grasso, D. Prediction of colloid detachment in a model porous media: Thermodynamics. AIche J. 1999, 45, 475–484. [Google Scholar] [CrossRef]
  23. Van Oss, C.J.; Chaudhury, M.K.; Good, R.J. Interfacial Lifshitz-van der Waals and polar interactions in macroscopic systems. Chem. Rev. 1998, 88, 921–947. [Google Scholar] [CrossRef]
  24. Brant, J.A.; Childress, A.E. Assessing short-range membrane-colloid interactions using surface energetics. J. Membr. Sci. 2002, 203, 257–273. [Google Scholar] [CrossRef]
  25. Ruckenstein, E.; Prieve, D.C. Adsorption and desorption of particles and their chromatographic separation. Alche J. 1976, 22, 276–283. [Google Scholar] [CrossRef]
  26. Bergendahl, J.; Grasso, D. Prediction of colloid detachment in a model porous media: Hydrodynamics. Chem. Eng. Sci. 2000, 55, 1523–1532. [Google Scholar] [CrossRef]
  27. Johnson, K.L.; Kendall, K.; Roberts, A.D. Surface energy and the contact of elastic solids. Proc. R. Soc. A Math. Phys. Eng. Sci. 1971, 324, 301–313. [Google Scholar]
  28. Jakubowski, M.; Antonowicz, A.; Janowicz, M.; Sterczyńska, M.; Piepiórka-Stepuk, J.; Poreda, A. An assessment of the potential of shadow sizing analysis and Particle Image Velocimetry (PIV) to characterise hot trub morphology. J. Food Eng. 2016, 173, 34–41. [Google Scholar] [CrossRef]
  29. Gercek, H. Poisson’s ratio values for rocks. Int. J. Rock Mech. Min. Sci. 2007, 44, 1–13. [Google Scholar] [CrossRef]
  30. Hedan, S.; Hubert, F.; Prêt, D.; Ferrage, E.; Valle, V.; Cosenza, P. Measurement of the elastic properties of swelling clay minerals using the digital image correlation method on a single macroscopic crystal. Appl. Clay Sci. 2015, 116–117, 248–256. [Google Scholar] [CrossRef]
  31. Schembre, J.M.; Kovscek, A.R. Mechanism of Formation Damage at Elevated Temperature. J. Energy Resour. Technol. 2005, 127, 171–180. [Google Scholar] [CrossRef]
Figure 1. Force on particles in fluid.
Processes 08 01491 g001
Figure 2. Drag force and lift force.
Processes 08 01491 g002
Figure 3. Pressure gradient changes with crack width.
Processes 08 01491 g003
Figure 4. Pressure gradient critical changes with particle size.
Processes 08 01491 g004
Figure 5. Variation of different consistency coefficients.
Processes 08 01491 g005
Figure 6. Change in the pressure gradient with crack width for different fluidity indexes.
Processes 08 01491 g006
Figure 7. Pressure gradient change under different fluidity indexes.
Processes 08 01491 g007
Figure 8. Pressure gradient changes under different consistency coefficients.
Processes 08 01491 g008
Figure 9. Schematic diagram of the experiment.
Processes 08 01491 g009
Figure 10. Theoretical and experimental comparison of different particle sizes.
Processes 08 01491 g010
Publisher’s Note: MDPI stays neutral with regard to jurisdictional claims in published maps and institutional affiliations.