Abstract
Controlling rabies among free-roaming street dogs has been a huge challenge in many parts of the world. Vaccination is a commonly used strategy to control rabies, however, sufficient vaccination coverage is very challenging when it comes to street dogs. Also, dog rabies data is scarce, making it difficult to develop proper strategies. In this study, we use a logistic growth incorporated epidemic model to understand the prevalence of rabies in the dog population of Dhaka, Bangladesh. The study shows that, the basic reproduction number for dog rabies in Dhaka lies between to and the environmental carrying capacity lies approximately between 58,110 to 194,739. Considering the vaccination and neuter programs administered in the last decade, we attempt to explain rabies transmission among dogs in this population. We found that the high basic reproduction number is associated with high environmental carrying capacity and vice versa. Further, we compare different type of control strategies, viz., constant vaccination, pulse vaccination, and optimal vaccination strategies. In the case of high environmental carrying capacity, vaccination, and neuter strategy is not sufficient for controlling rabies in street dogs, whereas carrying capacity control through waste management coupled with vaccination and neuter is more effective.
1. Introduction
Rabies is a zoonotic viral infection that is transmitted through the bites and scratches of foxes, dogs, bats, raccoons, cats, etc. It infects the central nervous system and ultimately leads to a fatal infection of the brain and spinal cord in almost all the cases if not treated before clinical manifestations occur. Rabies takes a heavy toll on human lives every year around the world, mainly in Asia and Africa, and more than of such fatalities are attributed to dog-mediated rabies [1]. According to a data driven empirical study conducted in 2008, rabies kills about 2100 people every year in Bangladesh [2], which was times higher than the World Health Organization (WHO) prediction.
Rabies is associated with certain dog-keeping practices and responsible ownership which vary with the cultural and economic conditions of a society [3,4,5,6]. Wandeler classified dogs into three categories: owned well-supervised (fully controlled by their owner); owned but poorly supervised, community dog, (partially controlled by owner); feral, free-roaming dog, (fully independent and unrestricted) [7]. In this study, we refer to the latter two categories of dogs as free-roaming street dogs (FRSDs). Free-roaming dogs are associated with the transmission of a number of zoonotic pathogens through dog bite injuries [8]. The worldwide population of domestic dogs is estimated at approximately 700 million, with around 75% classified as free-roaming [9].
The FRSDs have access to environmental resources such as waste food around markets and garbage dumps, and their mating is not controlled. As a result, their reproduction rate is higher than that of fully controlled dogs. Further, these poorly managed free-roaming dogs are not regularly vaccinated, and their lifespan is comparatively short [10]. Therefore, rabies in this dog population follows different dynamics compared to well-supervised dogs and demands particular attention [11]. A substantial amount of research has been carried out investigating rabies transmission and control management in well-supervised dogs [12,13]. In contrast, rabies transmission in FRSDs and the idea about controlling the disease is relatively less understood. Existing literature suggests that controlling rabies in FRSDs is technically more difficult and require further attention from the scientific and policy making communities [14,15,16].
The international community has set a global target of having no human deaths from dog-transmitted rabies by 2030 [4]. Bangladesh has been continuing to work towards its goal of eliminating rabies by 2020. In order to control rabies, mass dog culling was implemented in the major towns of Bangladesh during early 2012, but this approach turned out to be a failure and rabies infections still remained endemic [17]. The culling methods have been proven to be ineffective for a number of reasons [13,18,19,20,21]. For example, culling cannot distinguish between the vaccinated and non-vaccinated dogs. As a result, culling may result in a reduction of the number of vaccinated dogs and increase the proportion of susceptible dogs above the threshold for herd immunity [22,23]. As a result, Bangladesh stopped mass culling in 2012 [21]. Another program has been launched by the Obhoyaronno Bangladesh Animal Welfare Foundation (OBAWF) in Dhaka city with the objective of controlling rabies using the Catch-Neuter-Vaccinate-Release (CNVR) strategy. This program requires a substantial financial support. In addition, the success of this program requires a solid knowledge of the dog population size, which is a very challenging task in the case of FRSDs [21].
During the CNVR program in 2012 and 2013, a free-roaming dog population estimation study was conducted in Dhaka, the capital city of Bangladesh, the ratio of free-roaming dogs to humans was reported to be 1:828 [21]. However, the report of [24], 2016, showed that this ratio was 1:193, suggesting about four-fold increase just in three years. A major portion of theses dogs are free-roaming, which includes 39.2% community dogs and 44.5% stray dogs [12].
Regular immunization is a widely used technique to control the transmission of rabies within dogs [1]. Regular immunization is expected to be more efficient in controlling rabies if the birth rate of dogs is controlled, as suggested in [12]. However, the regular immunization concept in the case of FRSDs does not seem to be feasible, as it incurs major costs and continuous efforts as the street dog population is quickly renewed due to high birth rate and short life spans. One possible cheap and sustainable way to control the FRSDs population in such settings could involve controlling dogs’ access to food waste and garbage dumps, while another could involve improving food waste management [13]. Baquero et al. [15] suggested that carrying out the reduction through food waste management is the most effective way to modify the population dynamics of FRSDs. Therefore, the use of vaccinations as an additional control in conjunction with waste management may help to achieve the desired outcome in controlling rabies in FRSDs.
Mathematical models are often used to acquire quantitative insights into the epidemiological characteristics of infectious diseases and to develop cost-effective control strategies. There are a large number of mathematical models focusing on the transmission dynamics of rabies in wildlife animals such as foxes and raccoons [25,26,27,28,29,30]. Several other mathematical models considering the dog-human transmission of rabies have been proposed in recent years [12,14,16,31,32,33,34,35,36,37]. These studies have focused on the transmission of rabies within dogs and to humans and suggested different control strategies to limit this transmission. Zhang et al. [31] studied the transmission of rabies within domestic dogs and from domestic dogs to humans in China, and the authors suggested that reducing the dog birth rate and increasing dog immunization coverage may be effective ways to control rabies. Another mathematical model focusing on domestic and free-roaming dogs suggested that rabies incidence can be reduced by increasing the vaccination rate of domestic dogs and reducing the free-roaming dog population [14]. In another recent sophisticated study conducted by Shigui Ruan [12], the author introduced a rabies transmission model with increasing complexity.
The data driven study of epidemics and population dynamics is based on time series data of infection prevalence. However, no such data are available for rabies in FRSDs. So, using mathematical modeling tools, we inferred key parameters of the dog population and its rabies dynamics.
In this study, we investigated the transmission dynamics of rabies within dogs in the presence of different vaccination and sterilization strategies to investigate the effectiveness of vaccination in stopping the endemic spread. Besides the CNVR program, we also considered food waste management as another control measure to reduce the carrying capacity. We then analyzed the model to investigate whether these combined control measures could be effective in stopping the spread or significantly reducing the incidence of rabies that is mainly caused by FRSDs. To the best of the authors’ knowledge, these combined control measures have not been considered in any previously proposed mathematical models addressing rabies transmission in dogs, especially in free-roaming street dogs.
2. Materials and Methods
2.1. Basic Model
Dogs in low and middle income countries are usually free roaming street dogs living on food waste, which is a determinant of the carrying capacity of the dog population [7,13,15]. In our model, we divide dogs into three compartments: susceptible (S); exposed (E); infectious (I). We assume the logistic growth of dog population relates the growth rate with carrying capacity. We assume that only susceptible dogs give birth to susceptible newborns at the rate r. The carrying capacity is D. The growth term is modeled in such a way that the number of newborns depends on susceptible dogs only, while all dogs contribute to the limitations in available resources. The per-capita transition rate, is a product of the contact rate and transmission probability at each contact. In addition, homogeneous mixing of dogs is considered, so the probability that a susceptible dog will meet an infected dog is considered to be . Therefore, the transition rate of dogs from the susceptible to exposed compartment is . Dogs remain exposed for a period of years on average. Following [31], we assume, fraction of the exposed dogs (E) become infectious at the rate , while the rest do not become infectious and instead return to the susceptible compartment at the rate . The parameters m and represent the normal and disease related death rates, respectively. With these assumptions, the rabies transmission model is given by
where . The model (1) has a disease-free equilibrium(DFE), .
The basic reproduction number, , is the average number of new rabid dogs due to a single rabid dog introduced in DFE. We use the next generation matrix method and follow the notations developed by Van den Driessche and Watmough [32] in calculating the basic reproduction number.
termed as next generation matrix [32] gives the expected number of secondary infected dogs in each compartment produced by a single rabid dog. The spectral radius of is the basic reproduction number , which is reasonable from the perspective of an epidemic due to the following.
The eigenvalues of the Jacobian of the system (1) at DFE are: and
here, the first value is clearly negative, while the other two are negative if and at least one is positive if . Therefore, is locally asymptotically stable for and unstable for .
In addition, the model has another equilibrium
which is biologically relevant only when . Here,
The expression of shows that when , the population reaches the carrying capacity; however, if , then the short lifespan of infected dogs hinders the total population to reach the carrying capacity. If , then the dog population will become extinct. A similar indication can be observed from the stability of .
A stability investigation of requires tedious mathematical analysis; therefore, we used the numerical software MATCONT [38] to investigate the stability of this equilibrium. Due to their importance in epidemic outbreaks, and are chosen as bifurcation parameters.
The bifurcation analysis provides an integrated view of the dynamics of the model (1). It reveals that is stable and rabies persists for (see Figure 1). The figure shows several ranges of values for and for a given r. The endemic equilibrium that is stable in region II bifurcates on the Hopf curve emitting a stable limit cycle through supercritical Hopf bifurcation, resulting in the formation of region III. As a result, the system exhibits periodic oscillations when the values of and are chosen from this region. The size of the limit cycle that emerged from the Hopf bifurcation increases in the direction of increasing , which finally disappears via a saddle homoclinic bifurcation on the homoclinic curve and thus, region IV is born. As a result, the values of and chosen from region IV lead to total extinction of the population, suggesting that the values of and corresponding to this region are unreasonably large compared to r.
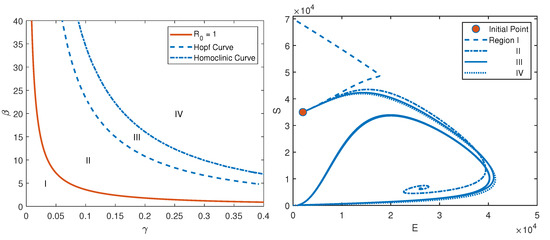
Figure 1.
()-parameter plane for . Below the solid orange curve (region I), the system remains disease-free, whereas, rabies persists beyond this curve. Region III represents the ranges for and , which lead to periodic oscillatory solutions. The population becomes extinct in region IV. The figure on the right shows the trajectories corresponding to the four different regions of the bifurcation diagram.
2.2. Controlling Rabies
The above analysis shows that the dynamics of model (1) are largely controlled by the parameter r in association with and . Therefore, one can speculate that the spread of rabies can be hindered by controlling the birth rate, or by securing the newborns, for example through vaccination. We experiment on three different vaccination strategies: One is continuous vaccination, in which the susceptible population is vaccinated at a constant rate. The next one is pulse vaccination, which refers to vaccinating a fraction of the entire susceptible population in a single pulse applied every years. And, the last one is time dependent vaccination accompanied with carrying capacity control.
2.2.1. Continuous Vaccination Model
Here, we assume that dogs are vaccinated and neutered at the rate k and move to the class R. As there are vaccines that need booster dose after 2–3 years, while the street dog life span is only 3 years, we assume vaccine provides permanent immunity.
The basic reproduction number reduces to,
From the expression for , we find that it increases with and decreases with k. For , we can easily find that, i.e., the threshold for k is a linear function of . This shows that vaccination coverage should be high in the case of a high transmission rate.
2.2.2. Pulse Vaccination Model
Here, we present the pulse vaccination model derived from model (1). According to this strategy, a fraction of the entire susceptible dog population is vaccinated in a single pulse every years [39], where the value of k is such that .
2.2.3. Optimal Control Model
In this section, we intend to explore strategies apart from vaccination that can be used independently or in combination with vaccination to reduce virus transmission among the dog population effectively. We consider vaccination and moderated growth rate through waste management as potentially effective two control measures. As we intend to limit the growth rate by reducing the carrying capacity, we aim to enhance the second-order term in the logistic growth model, since a decrease in carrying capacity can alternatively be achieved by increasing this term. We assume can increase the second-order term times at maximum, where and are constants, that depends on how much stress can be applied to suppress growth. In our simulation, we assume , which means the impact of limiting of resources (second order term in the logistic growth) can be increased a maximum of 10 times by implementing carrying capacity control.
We assume the vaccine is provided at the rate , where . The model including the above two controls reduces to the following.
Though our objective is to reduce rabid dogs, it is neither possible to reduce and maintain the growth rate at zero nor to vaccinate all dogs. So, we construct a cost functional as follows to balance between the two competing aims of reducing rabid dogs and implementing control measures.
Here, T is the final time; C is a constant representing the cost associated with each infected dog and plausible human infections resulted from the infected dog; and are the costs associated with the implementation of the controls and respectively. Our aim is to identify the time dependent piece-wise continuous controls and that minimize the cost subject to the system (8). Two time-dependent controls govern the dynamics of the system so as to minimize the numbers of infected dogs as well as the cost in order to implement the controls.
Mathematically speaking, the aim is to determine the optimal controls and such that
Such an optimal control pair exists (Please see the Appendix B for details) and the necessary conditions to be satisfied by the optimal control are derived from Pontryagin’s Maximum Principle [40]. We construct the Hamiltonian, given by,
Here, and are called adjoint variables and given by the following system of ordinary differential equations.
with transversality conditions,
Finally, the optimal controls are characterized by and , which gives
In order to numerically solve the optimal control system, we use the Forward–Backward Sweep method [41]. We assume , . We assume to understand the relative importance of controlling carrying capacity and vaccination. The controls cannot be effective, i.e., as we can neither reduce the growth rate to zero through waste food management, nor vaccinate all of the dogs at once. We assume that does not exceed . refers to the continuous vaccination rate, which has been reported to be 0.09 in [31] and in [42]. As this study deals with street dogs, we assume it does not exceed . Here, we present the details of a simulation to observe the optimal control strategies for a period of 5 years.
3. Parameterization
The population dynamics of street dogs is very different from that of domestic well-supervised dogs. Yearly net per-capita growth is assumed to be [16]. The life-span of a street dog is about 3 years [43], which is much shorter than that of a domestic dog [31]. So we assume per year. We assume a 2 month incubation period [31], i.e., . The probability of clinical outcome . Infectious lifetime is assumed to be days [43], which gives a disease related death rate . Street dog rabies related parameters are described in Table 1. We now infer the carrying capacity, D, and transmission rate, , as well as in Dhaka.

Table 1.
Parameter values for numerical simulation.
From the data, we observe that the dog population almost doubled just in 3 years from 2013 to 2016, i.e., according to our model . We are now especially interested in which value of and D lead to that particular growth over 3 years. Assuming the population was at equilibrium in 2013, we simulated our model for , with different values of D. It should be noted that the initial conditions in 2013 were adapted according to the CNVR campaign outcome before the simulation [21]. The whole process is summarized in the following.
- Step 1:
- Find all possible values of endemic equilibrium for and to be used as initial condition.
- Step 2:
- Update the initial condition as . Here, 6665 is the number of dogs vaccinated and neutered during 2012∼2013 CNVR program [21].
- Step 3:
- Run the model for each and associated initial condition found in Step 2 to find the value of D that produces 37,009 dogs in 2016 [24].
The above algorithm gives us plausible pairs to explain the rabies epidemic and dog population dynamics in Dhaka from 2013 to 2016, which is portrayed in Figure 2.
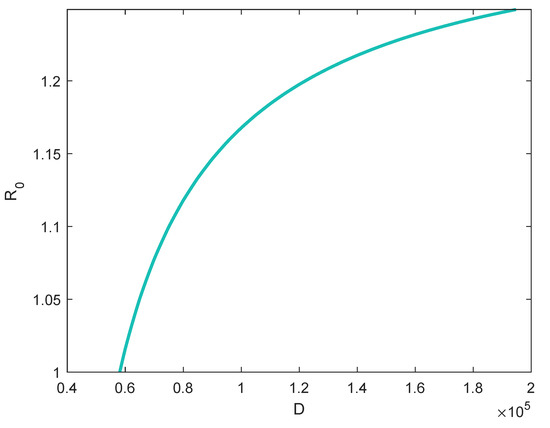
Figure 2.
The curve shows the pairs that explain dog population growth between the years 2013 and 2016 in Dhaka city, where is the basic reproduction number and D is the environmental carrying capacity of dogs.
4. Results and Discussion
The model considered in this study is concerned with rabies transmission among FRSDs. The analyses show that a rabies outbreak is not possible for . For , an epidemic takes off. We consider reducing the dog carrying capacity as a means of reproduction control in addition to vaccination as possible effective control measures. The effect of carrying capacity on the dog population has already been established [7,15]. Reducing shelters and food sources through waste management could be a cheap way to reduce dog turn over [7,15,44]. Here, we examine theoretically whether this method is effective in controlling rabies transmission.
For each pair shown in Figure 2 we find a distribution of dog population for four different compartments for the year 2016. In further analysis, we use this as the initial condition and simulate model from 2016. It is worth mentioning here that there was another CNVR program in 2016, in which of the dogs in the North and of dogs in the South of Dhaka were vaccinated [2,17]. We update the initial conditions considering the vaccination that was administered in 2016. We then used these updated initial conditions to simulate the model with constant vaccination, the pulse vaccinating model, and the model that introduce optimal vaccination along with carrying capacity control. We simulated these models for a period of 5 years, where the value of was chosen as and along with two types of vaccination coverage ( and ). In order to make a comparison, we simulated the model for no vaccination as well. These results are presented in Figure 3A–D.
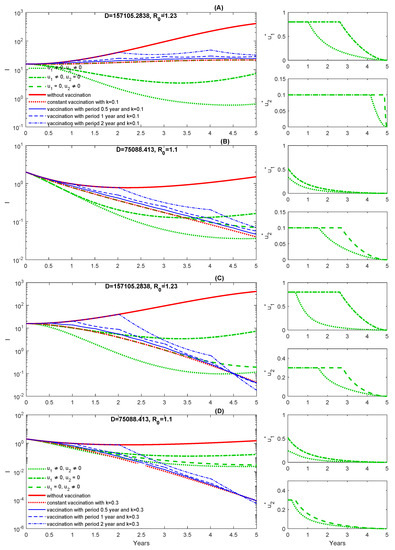
Figure 3.
Different types of control strategies are compared for (A) vaccination coverage, and basic reproduction number , (B) , , (C) ,, and (D) ,. The corresponding optimal control strategies are presented on the right most column of each figure.
The red dotted and solid lines in Figure 3 show the number of infected dog population that is obtained from the constant vaccination model with and without vaccination. The blue lines show the number of infected dog population for pulse vaccination at three different rates, and the green lines show this dog population with optimal controls (viz. carrying capacity control, and vaccination, ). We simulated the optimal control model under three different scenarios: when both and are implemented, when only is implemented, and finally when only is implemented. The corresponding values of the time dependent controls are shown on the right panel. In our simulations, we refer to as low transmission setting and to as high transmission setting. Similarly, we refer to as low vaccination rate and to as high vaccination rate.
We notice that the implications of different controls used in this study may provide a significantly better dog rabies scenario compared to no control at all; however, when we look further into the details, we see that one produces better results in reducing the number of rabid dogs than the other. Note that their performance also depends on the transmission settings as well as on the vaccination rates.
We find that both the constant and pulse vaccination corresponding to low vaccination rate reduce the number of rabid dogs greatly; however, the optimal control model where the vaccination is accompanied by carrying capacity control produces even a better result. This is true both in low and high transmission settings (see Figure 3A,B). It is worth mentioning that the carrying control alone (when only is implemented) is shown to be more promising compared to constant and pulse vaccinations in high transmission settings, as opposed to low transmission. This indicates that the carrying capacity control alone may not be a reliable strategy to control rabies in general, and signifies the simultaneous implementation of vaccination and carrying capacity control. In contrast, the pulse vaccination is shown to be more promising compared to other control strategies in the case of a high vaccination rate (see Figure 3C,D). It is true both in low and high transmission settings; however, it should be noted that vaccinating FRSDs at the rate of 30% every year is obviously a quite challenging task.
5. Conclusions
We studied a dog population model of rabies transmission dynamics to investigate the role of vaccination and dog population management in controlling rabies. The analysis of the basic model showed that the birth rate of dogs significantly affects the dog dynamics and rabies transmission in FRSDs. This quantity is directly associated with an upper limit of the transmission coefficient, in other words an upper limit of the basic reproduction number at which the dog population gets extinct; therefore, it was primarily expected that reducing this quantity may help to control or reduce the spread of rabies. The idea was validated by the results of the advanced model, where we found that carrying capacity reduction significantly reduces the number of rabid dogs; however, this control measure alone was not effective enough to control rabies, and it showed different performances under different transmission settings and vaccination rates as follows.
Corresponding to a low vaccination rate, the vaccination was found to dominate other control measures in low transmission setting, whereas the carrying capacity reduction was found to play a dominant role in the case of high transmission setting; therefore, the carrying capacity control was expected to be a good supplementary control measure. It leads us to conclude that simultaneous implementation of vaccination and carrying capacity control could be a reliable approach to control rabies in FRSDs. This notion is supported by the results corresponding to the low vaccination rate, as shown in Figure 3A,B. In contrast, an alternative scenario was observed in the case of a high vaccination rate, where the pulse vaccination was found to dominate other control measures both in low and high transmission settings; however, vaccination at the proposed rate of 30% every year is obviously a quite challenging task for FRSDs [17], as the maximum vaccination rate in Dhaka was 26% in 2016 [2]. Therefore, we recommend the simultaneous use of carrying capacity control and vaccination as control measures.
In conclusion, the results of this study demonstrate that vaccines alone should not be considered as the sole instrument to control rabies in FRSDs. The carrying capacity control obtained through food waste management should also be considered as an additional control measure. Food waste control requires mass education and awareness, and may not be equally effective in all communities as some FRSDs might have an alternative food source [6,45,46]. Community specific studies considering specific cultural practices towards FRSDs and available food sources may help to identify more appropriate control measures. The results of this study should encourage similar efforts to raise community awareness against dumping food waste in the undesignated area, leaving food garbage opens for dogs to access or feeding street dogs. It is also important to implement the suggested guidelines as a means to realize appropriate control measures for communities. Finally, the model parameters were estimated on a trial basis due to a shortage of data. These parameters could be estimated more accurately when there are sufficient data and hence, leading to better accuracy of the predicted results.
Author Contributions
Conceptualization, M.M.A. and M.I.A.; methodology, M.M.A., M.H.I. and C.O.; validation, M.H.I. and M.I.A.; formal analysis and investigation, M.M.A. and M.H.I.; data curation, M.H.I. and M.I.A.; writing—original draft preparation, M.M.A., C.O. and M.H.I.; writing—review and editing, M.H.I. and C.O.; visualization, M.M.A. and M.H.I.; supervision, project administration and funding acquisition, C.O. All authors have read and agreed to the published version of the manuscript.
Funding
Chunyoung Oh was supported by the National Research Foundation of Korea(NRF) grant funded by the Korea government(2020R1I1A306562711).
Conflicts of Interest
The authors declare no conflict of interest.
Appendix A. Basic Reproduction Number 0
Here, the matrix of new infection terms and the matrix of transition terms are given by,
Calculating the derivatives of and at yields and .
Appendix B. Existence of Optimal Control
Theorem A1.
Proof.
First, the system (8) is bounded in the positive orthant and for each control pairs there exists solutions for the corresponding state variable. Thus the set of controls and the state variables is nonempty. By construction, the control set U is convex and closed. Next, the integrand of the objective functional is linear in state variables and quadratic in controls , and thus is convex. Further, we choose , and then, the integrand of the objective functional satisfies the following.
These assures the existence of optimal control and completes the proof [40].
References
- New Global Framework to Eliminate Rabies. Available online: https://www.who.int/news/item/10-12-2015-new-global-framework-to-eliminate-rabies (accessed on 15 October 2020).
- Hossain, M.; Ahmed, K.; Bulbul, T.; Hossain, S.; Rahman, A.M.; Biswas, N.U.; Nishizono, A. Human rabies in rural Bangladesh. Epidemiol. Infect. 2012, 140, 1964–1971. [Google Scholar] [CrossRef]
- Awuni, B.; Tarkang, E.; Manu, E.; Amu, H.; Ayanore, M.A.; Aku, F.Y.; Ziema, S.A.; Bosoka, S.A.; Adjuik, M.; Kweku, M. Dog Owners’ Knowledge about Rabies and Other Factors That Influence Canine Anti-Rabies Vaccination in the Upper East Region of Ghana. Trop. Med. Infect. Dis. 2019, 4, 115. [Google Scholar] [CrossRef] [PubMed]
- Fahrion, A.S.; Taylor, L.H.; Torres, G.; Müller, T.; Duürr, S.; Knopf, L.; de Balogh, K.; Nel, L.H.; Gordoncillo, M.J.; Abela-Ridder, B. The Road to Dog Rabies Control and Elimination—What Keeps Us from Moving Faster? Front. Public Health 2017, 5, 103. [Google Scholar] [CrossRef] [PubMed]
- Wallace, R.M.J.; Nakazawa, Y.; Recuenco, S.; Bakamutumaho, B.; Osinubi, M.; Tugumizemu, V.; Blanton, J.D.; Gilbert, A.; Wamala, J. The impact of poverty on dog ownership and access to canine rabies vaccination: Results from a knowledge, attitudes and practices survey, Uganda 2013. Infect. Dis. Poverty 2017, 6, 97. [Google Scholar] [CrossRef] [PubMed]
- Fielding, W.J.; Gall, M.; Green, D.; Eller, W.S. Care of Dogs and Attitudes of Dog Owners in Port-au-Prince, the Republic of Haiti. J. Appl. Animal Welf. Sci. 2012, 15, 236–253. [Google Scholar] [CrossRef] [PubMed]
- Wandeler, A.I. Ecological and Epidemiological Data Requirements for the Planning of Dog Rabies Control, Kuwert, Ernst and Mérieux, Charles and Koprowski, Hilary and Bögel, Konrad; Springer: Berlin/Heidelberg, Germany, 1985; pp. 657–661. [Google Scholar]
- Pastoret, P.; Van Gucht, S.; Brochier, B. Eradicating rabies at source. Rev. Sci. Tech. Int. DES Epizoot 2014, 33, 509–519. [Google Scholar]
- Lauren, M.S.; Sabine, H.; Lisa, M.C.; Paolo, D.; Rupert, J.Q.; Lisa, M.C. The Effectiveness of Dog Population Management: A Systematic Review. Animals 2019, 9, 1020. [Google Scholar]
- Sunil, K.P. Population ecology of free-ranging urban dogs in West Bengal, India. Acta Theriol. 2001, 46, 69–78. [Google Scholar]
- Anna, M.C.; Joel, S.B.; Machunde, A.B.; Christopher, J.W.; Supriya, D.M.; Rachel, M.S.; Felix, J.L.; Lisa, J.F. Ecology and Demography of Free-Roaming Domestic Dogs in Rural Villages near Serengeti National Park in Tanzania. PLoS ONE 2016, 11, e0167092. [Google Scholar]
- Ruan, S. Modeling the transmission dynamics and control of rabies in China. Math. Biosci. 2017, 286, 65–93. [Google Scholar] [CrossRef]
- Taylor, L.H.; Wallace, R.M.; Balaram, D.; Lindenmayer, J.M.; Eckery, D.C.; Mutonono-Watkiss, B.; Parravani, E.; Nel, L.H. The role of dog population management in rabies elimination—A review of current approaches and future opportunities. Front. Vet. Sci. 2017, 4, 1009. [Google Scholar] [CrossRef] [PubMed]
- Hou, Q.; Jin, Z.; Ruan, S. Dynamics of rabies epidemics and the impact of control efforts in Guangdong Province, China. J. Theor. Biol. 2012, 300, 39–47. [Google Scholar] [CrossRef] [PubMed]
- Baquero, O.S.; Akamine, L.A.; Amaku, M.; Ferreira, F. Defining priorities for dog population management through mathematical modeling. Prev. Vet. Med. 2015, 123, 121–127. [Google Scholar] [CrossRef] [PubMed]
- Leung, T.; Davis, S.A. Rabies Vaccination Targets for Stray Dog Populations. Front. Vet. Sci. 2017, 4, 52. [Google Scholar] [CrossRef] [PubMed]
- Ghosh, S.; Rana, M.S.; Islam, M.K.; Chowdhury, S.; Haider, N.; Kafi, M.A.H.; Ullah, S.M.; Shah, M.R.A.; Jahan, A.A.; Mursalin, H.S.; et al. Trends and clinico-epidemiological features of human rabies cases in Bangladesh 2006–2018. Sci. Rep. 2020, 10. [Google Scholar] [CrossRef]
- Yoak, A.J.; Reece, J.F.; Gehrt, S.D.; Hamilton, I.M. Optimizing free-roaming dog control programs using agent-based models. Ecolog. Modell. 2016, 341, 53–61. [Google Scholar] [CrossRef]
- Hossain, M.; Bulbul, T.; Ahmed, K.; Ahmed, Z.; Salimuzzaman, M. Five-year (January 2004–December 2008) surveillance on animal bite and rabies vaccine utilization in the Infectious Disease Hospital, Dhaka, Bangladesh. Vaccine 2011, 29, 1036–1040. [Google Scholar] [CrossRef]
- Villa, P.D.; Kahn, S.; Stuardo, L.; Iannetti, L.; Nardo, A.D.; Serpell, J.A. Free-roaming dog control among OIE-member countries. Prevent. Vet. Med. 2010, 97, 58–63. [Google Scholar] [CrossRef]
- Tenzin, T.; Ahmed, R.; Debnath, N.C.; Ahmed, G.Y. Free-roaming dog population estimation and status of the dog population management and rabies control program in Dhaka City, Bangladesh. PLoS Neglected Trop. Dis. 2015, 9, e0003784. [Google Scholar] [CrossRef]
- Moreira, E.D.; Mendes, S.; Verena, M.; Sreenivasan, M.; Nascimento, E.G.; Pontes, C.L. Assessment of an optimized dog-culling program in the dynamics of canine Leishmania transmission. Vet. Parasitol. 2004, 122, 245–252. [Google Scholar] [CrossRef]
- Nunes, C.M.; Felix, L.; Valeria, M.; Borges, P.H.; Perri, S.H.V.; Maria, A.A.; Dias, F.E.F.; Burattini, M.N. Dog culling and replacement in an area endemic for visceral leishmaniasis in Brazil. Vet. Parasitol. 2008, 153, 19–23. [Google Scholar] [CrossRef] [PubMed]
- Amit, C. Report of Roaming Dog Survey of Dhaka City Corporation, Bangladesh. Stray Feral. Anim. Popul. Collect. 2016, 5, 1–11. [Google Scholar]
- Dimitrov, D.T.; Hallam, T.G.; Rupprecht, C.E.; Turmelle, A.S.; McCracken, G.F. Integrative models of bat rabies immunology, epizootiology and disease demography. J. Theor. Biol. 2007, 245, 498–509. [Google Scholar] [CrossRef] [PubMed]
- Sterner, R.T.; Smith, G.C. Modelling wildlife rabies: Transmission, economics, and conservation. Biol. Conserv. 2006, 131, 163–179. [Google Scholar] [CrossRef]
- Asano, E.; Gross, L.J.; Lenhart, S.; Real, L.A. Optimal control of vaccine distribution in a rabies metapopulation model. Math. Biosci. Eng. 2008, 5, 219. [Google Scholar] [PubMed]
- Gordon, E.R.; Curns, A.T.; Krebs, J.W.; Rupprecht, C.E.; Real, L.A.; Childs, J.E. Temporal dynamics of rabies in a wildlife host and the risk of cross-species transmission. Epidemiol. Infect. 2004, 132, 515–524. [Google Scholar] [CrossRef] [PubMed]
- Bingham, J. Canine rabies ecology in southern Africa. Emerg. Infect. Dis. 2005, 11, 1337. [Google Scholar] [CrossRef]
- Keller, J.P.; Gerardo-Giorda, L.; Veneziani, A. Numerical simulation of a Susceptible-Exposed-Infectious space-continuous model for the spread of rabies in raccoons across a realistic landscape. J. Biol. Dyn. 2013, 7, 31–46. [Google Scholar] [CrossRef]
- Zhang, J.; Jin, Z.; Sun, G.; Zhou, T.; Ruan, S. Analysis of Rabies in China: Transmission Dynamics and Control. PLoS ONE 2011, 6, e20891. [Google Scholar] [CrossRef]
- Van den Driessche, P.; Watmough, J. Reproduction numbers and sub-threshold endemic equilibria for compartmental models of disease transmission. Math. Biosci. 2002, 180, 180. [Google Scholar] [CrossRef]
- Diekmann, O.; Heesterbeek, J.A.P.; Roberts, M.G. The construction of next-generation matrices for compartmental epidemic models. J. R. Soc. Interface 2009, 7, 873–885. [Google Scholar] [CrossRef] [PubMed]
- Zhang, J.; Jin, Z.; Sun, G.; Sun, X.; Ruan, S. Modeling seasonal rabies epidemics in China. Bull. Math. Biol. 2012, 74, 1226–1251. [Google Scholar] [CrossRef] [PubMed]
- Zinsstag, J.; Lechenne, M.; Laager, M.; Mindekem, R.; Oussiguéré, A.; Bidjeh, K.; Rives, G.; Tessier, J.; Madjaninan, S.; Ouagal, M. Vaccination of dogs in an African city interrupts rabies transmission and reduces human exposure. Sci. Transl. Med. 2017, 9, eaaf6984. [Google Scholar] [CrossRef] [PubMed]
- Asamoah, J.K.; Oduro, F.T.; Bonyah, E.; Seidu, B. Modelling of rabies transmission dynamics using optimal control analysis. J. Appl. Math. 2017, 2017, 1–23. [Google Scholar] [CrossRef]
- Ndii, M.Z.; Amarti, Z.; Wiraningsih, E.D.; Supriatna, A.K. Rabies epidemic model with uncertainty in parameters: Crisp and fuzzy approaches, IOP Publishing. IOP Conf. Ser. Mater. Sci. Eng. 2018, 332, 012031. [Google Scholar] [CrossRef]
- Dhooge, A.; Govaerts, W.; Kuznetsov, Y.A. MATCONT: A MATLAB package for numerical bifurcation analysis of ODEs. ACM Trans. Math. Softw. (TOMS) 2003, 29, 141–164. [Google Scholar] [CrossRef]
- Pei, Y.; Li, S.; Li, C.; Chen, S. The effect of constant and pulse vaccination on an SIR epidemic model with infectious period. Appl. Math. Modell. 2011, 35, 3866–3878. [Google Scholar]
- Fleming, W.H.; Rishel, R.W. Deterministic and Stochastic Optimal Control; Springer: Berlin/Heidelberg, Germany, 1975. [Google Scholar]
- Lenhart, S.; Workman, J.T. Optimal Control Applied to Biological Models; Chapman and Hall CRC: London, UK, 2007. [Google Scholar]
- Kitala, P.M.; Mcdermott, J.J.; Coleman, P.G.; Dye, C. Comparison of vaccination strategies for the control of dog rabies in Machakos District, Kenya. Epidemiol. Infect. 2002, 129, 215–222. [Google Scholar] [CrossRef]
- Hampson, K.; Dushoff, J.; Bingham, J.; Brückner, G.; Ali, Y.H.; Dobson, A. Synchronous cycles of domestic dog rabies in sub-Saharan Africa and the impact of control efforts. Proc. Nat. Acad. Sci. USA 2007, 104, 7717–7722. [Google Scholar] [CrossRef]
- Tiwari, H.K.; Robertson, I.D.; O’Dea, M.; Vanak, A.T. Demographic characteristics of free-roaming dogs (FRD) in rural and urban India following a photographic sight-resight survey. Sci. Rep. 2019, 9, 16562. [Google Scholar] [CrossRef]
- Kachani, M.; Heath, D. Dog population management for the control of human echinococcosis. Acta Trop. 2014, 139, 99–108. [Google Scholar] [CrossRef] [PubMed]
- Toukhsati, S.R.; Phillips, C.J.C.; Podberscek, A.L.; Coleman, G.J. Semi-Ownership and sterilization of Cats and Dogs in Thailand. Animals 2012, 2, 611–627. [Google Scholar] [CrossRef] [PubMed]


Publisher’s Note: MDPI stays neutral with regard to jurisdictional claims in published maps and institutional affiliations. |
© 2020 by the authors. Licensee MDPI, Basel, Switzerland. This article is an open access article distributed under the terms and conditions of the Creative Commons Attribution (CC BY) license (http://creativecommons.org/licenses/by/4.0/).