Abstract
The contamination of soil and water bodies with mercury from anthropogenic sources such as mining and industry activities causes negative effect for living organisms due to the process of bioaccumulation and biomagnification through the food chain. Therefore, the need for remediation of contaminated areas is extremely necessary and very desirable when it is cost-effective by using low-cost sorbents. This paper compares the sorption abilities of natural and iron-modified zeolite towards Hg(II) ions from aqueous solutions. The influence of pH, solid/liquid ratio (S/L), contact time, and initial concentration on the sorption efficiency onto both zeolites was investigated. At the optimal pH = 2 and S/L = 10, the maximum amount of sorbed Hg(II) is 0.28 mmol/g on the natural zeolite and 0.54 mmol/g on the iron-modified zeolite. It was found that rate-controlling step in mass transfer is intraparticle diffusion accompanied by film diffusion. Ion exchange as a main mechanism, accompanied with surface complexation and co-precipitation were included in the Hg(II) sorption onto both zeolite samples. This is confirmed by the determination of the amount of sorbed Hg(II) and the amount of released exchangeable cations from the zeolite structure as well as by the scanning electron microscopy (SEM) and energy dispersive X-ray analysis (EDS) of saturated zeolite samples. In a wide pH range, 4.01 ≤ pH ≤ 11.08, the leaching of Hg(II) was observed in the amount of only 0.28–0.78% from natural zeolite and 0.07–0.51% from iron-modified zeolite indicating that both zeolites could be used for remediation purposes while the results suggest that modification significantly improves the sorption properties of zeolite.
1. Introduction
Environmental mercury pollution is a serious problem due to its high mobility in the environment and extreme toxicity to human health. The main sources of mercury emissions into the environment comes from natural (volcanic emissions, mineral deposits), anthropogenic (coal combustion, mining processing), and reemitted resources (already mercury contaminated sites) where the most significant are the anthropogenic ones. From all mentioned sources, mercury is emitted into the atmosphere, soils, or water systems where it remains permanently due to its non-biodegradable properties [1,2,3]. It could appear in inorganic forms such as Hgo, Hg(I), Hg(II), as well as in organic forms such as non-volatile mono methyl-mercury (CH3Hg+) and volatile dimethyl-mercury [(CH3)2Hg]. Methylation of Hg(II) takes place in anoxic conditions under the influence of reducing bacteria present in the soil. The formed mono methyl-mercury poses a greater danger than Hg(II) due to higher mobility and the tendency of bioaccumulation and biomagnification through the food chain [4,5]. Thus, in soils and aquatic sediments, mercury species can be trapped by clays and more often by organic matter such as fluvic and humic acids in acidic soils [2,5]. On the other hand, trapped mercury can be released into the environment and undergo complex physical, chemical, and biological transformations and distributed into the deeper layers of the soil, towards even groundwater [1,2,3]. Therefore, the World Health Organization has given a recommendation on the maximum permissible concentration of mercury in drinking water of the amount up to 1 μg/L [6]. This value indicates the extremely high toxicity of mercury in all its forms and suggests the need for remediation in already existing contaminated sites or preventing the spread of contamination from these sites. The most vulnerable areas are groundwater and aquifers that can be contaminated by the percolation of mercury leachate from polluted soils and sediments [7]. In order to prevent the migration of its species from contaminated soil to deeper soil layers, various ex situ and in situ remediation techniques are used [1,2,8]. Ex situ methods involve the excavation of contaminated soil, sediment, or waters as well as the subsequent removal of mercury by a suitable remediation technique. In contrast, in situ methods are applied at the site of contamination, commonly in the form of permeable reactive barrier filled with a material that will immobilize the mercury or by sprinkling the soil with active material. When comparing both, in situ methods are more easily feasible and their limitation is that the immobilizing material must have a high affinity for mercury without the possibility of releasing trapped mercury from its structure. Therefore, the choice of material is very challenging because it should be very efficient, capable of keeping mercury inside the structure, and compatible with the environment without causing additional environmental pollution [9]. According to the literature, activated carbon seems to be highly efficient in mercury sorption, but the costs of its preparation indicate that it does not belong to cost-effective sorbents [10,11]. Therefore, environmentally-friendly sorbents such as natural zeolite can be promising since various sorbents are easily available today. Natural zeolites are naturally occurring materials and are recognized as efficient materials in environment remediation [12,13,14]. They are compatible with nature since they do not introduce additional contaminations to the environment. The structure of zeolites consists of the three-dimensional frameworks of SiO4 and AlO4 tetrahedra. The negative charge of the zeolite structure is a consequence of the isomorphous replacement of Si4+ with Al3+ which is balanced by the presence of exchangeable cations, primarily Na, K, Ca, and Mg. These cations have the ability to participate in the ion exchange process with heavy metals cations in the solutions. Additionally, modifications of zeolites with acids, bases, surfactants, and inorganic salts are performed in order to enhance their sorption capacity towards cationic, anionic, and organic compounds [12].
Inorganic compounds such as Fe or Mn oxide and oxyhydroxide have shown a strong affinity for heavy metal ions since they possess oxygen-containing functional groups that are responsible for interactions with heavy metals through chemical sorption or redox reactions [11,15]. Thus, many researchers have confirmed a significant increase in the sorption capacity of modified zeolite with Fe(III) salts towards Cu(II), Mn(II), Zn(II), Pb(II), and Cd(II) [16,17,18,19,20,21]. Regarding the removal of Hg(II), Chojancki et al. [22] applied natural zeolites, while Gebremedhin-Haile et al. [23] and Misaelides and Godelistas [24] applied zeolite pretreated with NaCl. The results of their investigations showed that pretreatment with NaCl improves zeolite sorption properties.
The present study compares the sorption properties of natural (NZ) and iron-modified zeolite (FeZ) towards Hg(II) from aqueous solutions through the investigations of different parameters that affect the sorption processes, as well as the elucidate sorption and mass transfer mechanism. In order to assess the possible application of the NZ and FeZ for the in situ remediation of mercury-contaminated groundwater or soil, beside sorption experiments, the retention strength of sorbed mercury in saturated zeolite is investigated by using the standard leaching test in different pH values.
2. Materials and Methods
2.1. Sample Preparation and Characterization
The starting sample, natural zeolite (NZ) was collected from the Zlatokop deposit (Vranjska Banja, Serbia). The sample was milled, sieved, and a particle size fraction of 0.6–0.8 mm was separated. Thereafter, the sample was washed in ultrapure water and dried at 60 °C.
Iron-modified zeolite (FeZ) was prepared via the treatment of NZ according to the procedure published previously [21]. Briefly, the procedure consisted of 3 separated stages. Firstly, the sample was mixed with a 1 mol/L Fe(NO3)3·9H2O freshly prepared solution by dissolving iron salt in an acetate buffer at pH = 3.6, followed with 1 mol/L NaOH and 4% NaNO3 solutions. The prepared sample was dried at 40 °C and kept in a desiccator until use. Detailed physico-chemical characterization of both, NZ and FeZ (chemical composition, scanning electron microscopy with energy dispersive X-ray analysis (SEM/EDS), X-ray diffraction ˙(XRD), Fourier-transform infrared spectroscopy (FTIR), BET (Brunauer, Emmett and Teller) specific surface area, thermogravimetry and derivative thermogravimetry(TG/DTG) was performed and explained in detail in a previously published paper [21]. The mineralogical composition of natural zeolite was primarily clinoptilolite (minimum 80%) with quartz, feldspar, and carbonates as accompanying minerals, as determined by XRD analysis. It was observed that the modification caused a slight decrease in crystallinity (XRD), the broadening of characteristic hydroxyl bands, O-H stretching (FTIR), a slight increase in the specific surface area and a significant increase in pore volume (BET), as well as a higher mass loss (TG/DTG). Chemical analysis showed an almost double increase in the amount of iron while the amount of sodium increased three times, which was also confirmed by the analysis of the elemental composition of the NZ and FeZ surfaces (SEM/EDS). The main exchangeable cation was calcium for NZ and sodium for FeZ sample. The increase in the point of zero charge for FeZ (pHpzc = 9.8 ± 0.1) by three pH units in relation to NZ (pHpzc = 6.8 ± 0.1) was a consequence of the increase in the net negative charge of zeolite due to the modification process. Thus, the purpose of the modification process was to increase the zeolite sorption sites by the sorption of Fe hydroxyl species on the negative zeolite surface, among which Fe3(OH)45+ dominates at pH = 3.6. The binding mechanism of Fe hydroxyl species can be described as follows [25]:
where: S is Si or Al and Fez+ are a Fe-hydroxyl species.
The purpose of the NaOH addition was to hydroxylate the sorbed Fe species since in the alkaline medium Fe(OH)4− species dominates. In this way, negative Fe oxo- and hydroxo-complexes are formed whose charge is compensated by sodium ions. Thus, beside zeolite -SiOH and -AlOH Brønsted acid sites, the negative surface charge increased due to the presence of additional -FeOH acid sites.
The measurement of the cation exchange capacity (CEC) of NZ and FeZ was conducted by standard US EPA SW-846 Method 9080 (1 M sodium acetate, pH = 7) [26]. The determined CEC value was 1.42 meq/g for NZ and 1.64 meq/g for FeZ, respectively.
Scanning electron microscopy (SEM) analysis and energy dispersive X-ray analysis (EDS) of saturated zeolites at different magnifications were performed using JEOL JSM 6490LV SEM coupled with an Oxford INCA EDS system, consisting of an Oxford INCA PentaFET3 Si(Li) detector and INCA Energy 350 processing software. The samples were coated with carbon to make them conductive. In addition, backscattered electrons mode (BSE) was used in order to distinguish newly-formed Hg-containing phases which appear brighter than others.
2.2. Sorption Experiments
The salt, Hg(NO3)2·H2O, p.a. Kemika, was used for the preparation of stock solutions, from which the solutions of lower concentrations were prepared by dilution in ultrapure water. The pH of solutions was adjusted by adding a few drops of 0.1 or 1 mol/L HNO3. All experiments were performed in batch mode by using an incubator shaker at a room temperature of 25 °C. The concentration of Hg(II) before and after the performed experiments was determined by using Flame Atomic Absorption Spectrophotometer (PinAAcle 900F).
2.3. Effect of pH
The effect of the solution pH on the sorption efficiency of Hg(II) onto NZ and FeZ was studied in the narrow pH range of 2.09–2.30. The initial concentration of the Hg(II) solution was 4.006 mmol/L. A total of 1.000 g of NZ or FeZ was mixed with 100 mL of the prepared Hg(II) solution during 24 h (solid/liquid ratio was 10 g/L) and at 230 rpm. After equilibration, the suspensions were filtered, the remaining concentration of Hg(II) was determined by atomic absorption spectrometry (AAS), and the equilibrium pHe was measured.
2.4. Effect of Solid/Liquid Ratio
The effect of the solid/liquid ratio, S/L, on the sorption efficiency of Hg(II) onto NZ and FeZ was performed at optimal pH = 1.98, determined on the basis of a previous experiment (effect of pH). The initial concentrations of the Hg(II) solution was 4.056 mmol/L.
Different mass of the NZ in the range of 0.2–3.6 g (S/L = 2, 6, 10, 14, 18, 26, 30, 36 g/L) and FeZ in the range of 0.2–1.8 g (S/L = 2, 6, 10, 14, 18 g/L) was mixed with 100 mL of the prepared Hg(II) solution during 24 h and at 230 rpm. After equilibration, the suspensions were filtered and the concentration of Hg(II) in the equilibrium was determined by AAS and the equilibrium pHe was measured.
2.5. Effect of Initial Concentration
The effect of the initial concentration on the amount of sorbed Hg(II) per gram of NZ and FeZ as well as the sorption efficiency was performed at an optimal pH ≈ 2.00 and S/L = 10 g/L, determined on the basis of a previous experiments. The initial concentrations of solutions for the sorption of Hg(II) onto NZ and FeZ were in the range of 0.461–12.258 mmol/L and initial pHs of prepared solution were 1.99 < pH < 2.01. Therefore, 1.000 g of NZ or FeZ was mixed with 100 mL of Hg(II) solution during 24 h and at 230 rpm. After equilibration, the suspensions were filtered and the concentration of Hg(II) in the equilibrium was determined by AAS and the equilibrium pHe was measured. In addition, in all filtrates the concentration of released exchangeable cations (Na, K, Ca, and Mg) were determined by means of ion chromatography (Metrohm 761 Compact IC).
2.6. Effect of Contact Time
The effect of contact time on the amount of sorbed Hg(II) per gram of NZ and FeZ as well as sorption efficiency was performed at an optimal pH ≈ 2.00 and S/L = 10 g/L. The initial Hg(II) concentration of 7.917 mmol L with pHo = 1.98 for sorption onto NZ and 9.933 mmol/L with pHo = 1.99 for sorption onto FeZ were selected on the basis of the previous conducted experiments (effect of initial concentration) in order to achieve the maximum amount of sorbed Hg(II) onto NZ and FeZ. Experiments were conducted by mixing 20.000 g of NZ or FeZ with 2 L of prepared Hg(II) solution during 24 h and at 550 rpm. In the desired time interval, samples were collected, filtered, and the remaining concentrations of Hg(II) were determined by means of AAS and the equilibrium pHs were measured. The total sampling volume was less than 5–6% of the total solution volume.
2.7. Leaching Experiments
The saturated samples from the previous experiment (effect of contact time) were collected, washed in ultrapure water, dried in order to examine their leaching properties, and marked as NZHg and FeZHg. The leaching of Hg(II) from saturated samples was examined according to the standard leaching method DIN 38414 [27] in ultrapure water in the wide pH range 2.00–12.05 adjusted by a small addition of 0.1 mol/L of HNO3 or 0.1 mol/L of KOH. The mass of 1.000 g of NZHg or FeZHg was mixed with 10 mL of ultrapure water (S/L = 100) with different initial pHs over 24 h at 25 rpm and 25 °C. After 24 h suspensions were filtered and the concentration of leached Hg(II) was determined in filtrates by using AAS, the final pH values of filtrates were also measured.
2.8. Calculation of Characteristic Parameters
The amount of Hg(II) sorbed on zeolite in time t (0 h < t < 24 h), qt (mmol/g) as well as the removal efficiency in time t expressed in percentage, αt (%), were calculated by Equations (4) and (5):
where co and ct are the concentrations of Hg(II) at t = 0 and time t (mmol/L), V is the volume of the solution (L), and m is the mass of zeolite (g).
In the case when t = 24 h then ct = ce, qt = qe and αt = αe where ce is the concentration of Hg(II) in the equilibrium, qe is the experimentally observed amount of Hg(II) sorbed on zeolite in the equilibrium, and αe is the removal efficiency in equilibrium (%).
The amount of Hg(II) leached from saturated zeolite, qleach (mmol/g) and the percentage of Hg(II) leached from saturated zeolite, αleach (%) were calculated by Equations (6) and (7):
where cleach is the concentration of the Hg(II) leached from zeolite (mmol/L).
2.9. Modeling of Kinetic Data
Different kinetic models are very useful for determining the rate controlling step in mass transfer during the sorption process. Two applied reaction kinetic models, Pseudo-first-order, PFO (Lagergen), and Pseudo-second-order, PSO (Ho), consider the chemical reaction to be a rate controlling step. The nonlinear equation of Pseudo-first-order is given by Equation (8) [28,29]:
where qm is the maximum sorption capacity obtained from the model (mmol/g) and k1 is the constant of the PFO (1/min).
The nonlinear form of the Pseudo-second-order is given by [28,29]:
in which k2 is the rate constant of the PSO [g/(mmol∙min)].
Sorption processes by using micro and mesoporous materials like natural zeolites are often limited by mass transfer due to the existence of cavities and pores inside the zeolite particle. In well-agitated systems, the diffusion of a substance from the bulk to the particle surface can be neglected, therefore the rate controlling step in the sorption process can be attributed to the film or intraparticle diffusion. Film or intraparticle diffusion control sorption rates can be established by applying different diffusion models.
Thus, the Bangham model suggests intraparticle diffusion as the only rate controlling step according to the equation in nonlinear form [30]:
where mz is the mass of sorbent per liter of solution (g/L), while kb and αb (αb < 1) are the Bangham’s constants.
Vermeulen’s approximation also considers intraparticle diffusion as a rate controlling step and is given as follows [31]:
where Di is the intraparticle diffusion coefficient (cm2/min) and rp is the sorbent particle radius (cm).
The Weber–Morris model enables one to distinguish film diffusion from intraparticle diffusion by using linear Equation (12) [32]:
where kWM is the Weber–Morris diffusion constant [mmol/(g∙min1/2)] and I corresponds to the thickness of the boundary layer (mmol/g).
If I = 0 then the film diffusion is the only rate controlling step, otherwise both film and intraparticle diffusion could be considered. The proportion of film and intraparticle diffusion can be calculated according to Equation (13) [32]:
where RC is the relative coefficient expressed in %. Higher RC values indicate that film diffusion has a larger proportion in the overall mass transfer process.
Knowing the value of kWM, the diffusion coefficient, Di can be calculated as follows:
where dp is the particle diameter (cm).
The double-exponential model (DEM) describes two-step sorption kinetic by non-linear equation [33]:
where B1 and B2 are the sorbed concentration of sorbate in the rapid and slow step (mmol/L) while kB1 and kB2 are the rapid and slow rate constants (1/min).
The overall sorption rate, r in [mmol/(g∙min)] is a sum of the rapid, r1 and slow, r2 steps [33]:
In addition, the percentage of sorbed in rapid (RF) and in slow (SF) steps can be calculated as follows [33]:
For modeling sorption kinetic data by non-linear regression analysis, the Mathcad 14 software was used. Non-linear regression analysis was applied because using the original equation achieves greater accuracy than by transforming the equation into a linear form [34]. The agreement of the experimental data modeled by linear regression analysis was estimated using the linear regression coefficient, R2 while modeled by non-linear regression analysis was evaluated using the non-linear regression coefficient, r2, as well as two error functions, non-linear chi-square test (χ2) and root mean square error (RMSE) [35]:
Smaller values of error functions are an indicator of better agreement of predicted values, qm with experimentally determined ones, qe.
3. Results and Discussion
3.1. Effect of pH
The pH of the suspension is one of the most important parameters that affect the sorbent surface charge as well as type of metal species. Figure 1 illustrates the distribution of mercury species in relation with pH based on the hydrolysis constants represented by Equations (21)–(23) [36,37]:
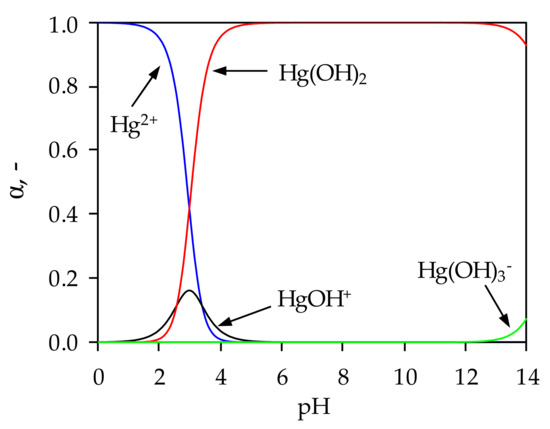
Figure 1.
Distribution of Hg(II) species as a function of pH.
From Figure 1 it is clear that below pH = 2.9 the dominant species is Hg2+, the HgOH+ species exists in the range 1.5 < pH < 4.5, while Hg(OH)3- appears at pH > 13.2. Precipitation of Hg(II) begins at pH = 2.4, and the proportion of Hg(OH)2 increases with a further increase in pH, and pH range 4.7 < pH < 13.2 Hg(II) exists completely in the form of Hg(OH)2. This suggests that the mercury sorption would take place in a very narrow pH range if the influence of precipitation is to be completely excluded.
For this reason, sorption experiments were not performed above pH = 2.4 and below pH = 2 due to degradation and dissolution of the zeolite structure. In order to determine the optimal pH for Hg(II) sorption onto NZ and FeZ, it was necessary to calculate the pH value at which precipitation starts to occur (pHppt). The pHppt values depend on the mercury solubility product constant, Ksp = 3.2 × 10⁻²⁶ and the initial mercury concentration according to Equation (24) [37,38]:
The measured pHe and calculated pHppt values for the given initial Hg(II) concentration as well as removal efficiency, α as a function of pHo are shown in Figure 2a,b.

Figure 2.
(a) pHe vs. pHo after sorption of Hg(II) onto NZ and FeZ. (b) The effect of pHo on removal efficiency, α of Hg(II) onto NZ and FeZ.
At pHo = 2.30 in Figure 2a, the pHe values for both NZ and FeZ are above the calculated pHppt which confirms that the precipitation of mercury in the form of hydroxide occurs in the solution while at pHo = 2.09 precipitation is excluded. Therefore, pHo = 2.09 is selected as the optimal pH for Hg(II) sorption onto NZ and FeZ, at which the obtained efficiency is 57% for NZ and 81% for FeZ (Figure 2b).
3.2. Effect of S/L Ratio
The determination of the optimal S/L ratio is also an important parameter that needs to be considered in the design of sorption processes. Dependence of the removal efficiency, α of Hg(II) sorption onto NZ and FeZ for different solid/liquid (S/L) ratios is shown in Figure 3.
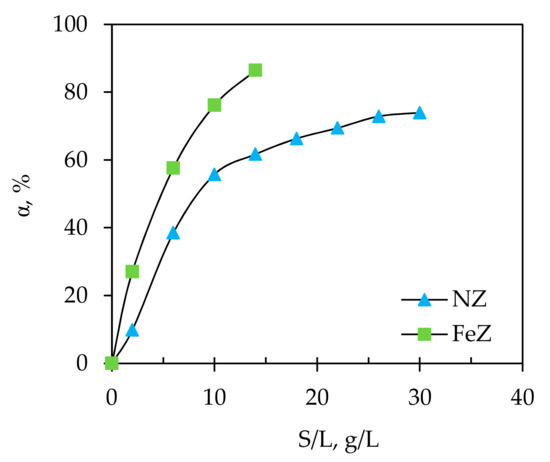
Figure 3.
The effect of solid/liquid ratio (S/L) ratio on removal efficiency, α of Hg(II) onto NZ and FeZ.
Firstly, a rapid and then gradual increase in α values for NZ were observed with plateau reached at S/L > 26 g/L. For FeZ, the increase in α was rapid, but without achieving plateau since above S/L = 18 g/L, precipitation occurs and the measured equilibrium pH was higher than the calculated pHppt. The increase in removal efficiency is connected with a higher mass of zeolite in the same volume of suspension, i.e., an increase in the number of available active sorption sites. Although higher S/L ratios give better removal efficiency, they also cause an increase in the pH of the suspension which can lead to mercury precipitation. For an initial Hg(II) concentration of 4.056 mmol/L used in this experiment, the pHppt value calculated by Equation (30) is compared in Figure 4 with the pHe after the sorption of Hg(II) onto NZ and FeZ at different S/L ratios.

Figure 4.
Comparison of pHe with pHppt and pHo after the sorption of Hg(II) onto NZ and FeZ at different S/L ratios.
As the S/L ratio increases, the equilibrium pHe of the suspensions also increase. The increase in pH is due to both effects of mercury sorption on zeolites and the exchange of H+ with exchangeable cations. At S/L = 18 g/L for FeZ and S/L = 36 g/L for NZ, mercury precipitation was observed since the measured equilibrium pHe of the suspensions was higher than the calculated pHppt. This indicates that determining the optimal S/L ratio is one of the key parameters in order to avoid precipitation with achieving maximum efficiency by using a minimum dose of zeolite.
Therefore, according to Figure 3, at a given experimental condition, the maximum removal efficiency of 74% for NZ is achieved at S/L = 30 g/L while for FeZ this value was 87% at S/L = 14 g/L. This indicates that even with twice higher amount of NZ compared to FeZ, the same efficiency is not achieved, which justifies the natural zeolite modification process. Taking into account the S/L ratio at which mercury precipitate in suspension with FeZ, the S/L ratio of 10 g/L is selected as optimal since at S/L = 14 g/L the pHppt is very close to the conditions under which precipitation occurs. In order to compare the results with FeZ, further experiments on NZ were conducted at the same S/L = 10 g/L.
3.3. Effect of Contact Time
It is important to know the minimum contact time required to achieve maximum sorbent removal efficiency in the shortest possible time. The effect of contact time on the amount of Hg(II) sorbed on NZ and FeZ as well as the removal efficiency is presented in Figure 5.
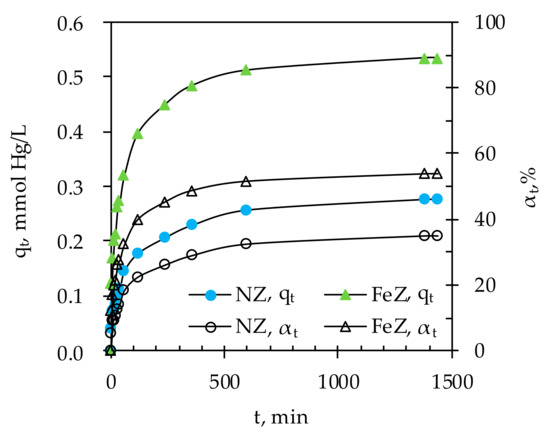
Figure 5.
The amount of Hg(II) sorbed on NZ and FeZ as well as the removal efficiency in relation to contact time.
The results show that sorption of Hg(II) onto both NZ and FeZ takes place in two stages, the initial stage within 240 min accompanied by rapid increases in qt and αt, followed by a second stage with a gradual increase in qt and αt until equilibrium is reached. The observed two sorption stages suggest that the initial sorption is rapid due to the readily available active sorption sites, and becomes slower as a consequence of Hg(II) sorption at less available sites. A minimum contact time of 600 min is required to achieve a maximum removal efficiency of 35% or 0.28 mmol Hg/g of NZ and 54% or 0.53 mmol Hg/g of FeZ for the given experimental conditions. Under the used experimental conditions, precipitation of Hg(II) was not possible since the measured pHe was lower than the calculated pHptt (results are not shown here).
The existence of two stages during the sorption of Hg(II) indicates a possible change in the sorption mechanism that can be established by determining the sorption rate controlling step. For this purpose, two reactions (Pseudo-first-order, Pseudo-second-order) and four diffusions (Bangham, Vermeulen’s approximation, Weber–Morris, and Double-exponential) kinetic models were applied on kinetic sorption data.
For all applied models, specific parameters are obtained by nonlinear regression analysis except with the Weber–Morris model. Calculated parameters are summarized in Table 1 and fitting of experimental points with models are presented in Figure 6a,b.

Table 1.
Kinetic models constantss and error analysis for Hg(II) sorption onto NZ and FeZ.

Figure 6.
(a) Fitting of experimental data with Pseudo-first-order model (PFO), Pseudo-second-order (PSO), Vermeulen’s approximation, double-exponential model (DEM), and the Bangham model. (b) Fitting of experimental data with the Weber–Morris model.
By comparing regression coefficient as well as values of RMSE and χ2 for PFO and PSO, results suggest that the PSO is better applicable to experimental results for NZ and FeZ. However, since the values of qe differ from those obtained from the model, qm it indicates that rather film or intraparticle diffusion could be the rate controlling step.
Therefore, the kinetic results were processed using the Bangham model. Although the correlation indicators are satisfactory, the curve that describe this model (Figure 6a) indicates that this model does not fit well enough with the experimental results, which confirms that intraparticle diffusion is not the only rate controlling step.
Furthermore, the application of the Vermenulen’s approximation shows good fitting in the whole observed time interval (Figure 6a) which confirms the similarity of qe and qm as well as r2. From the above, it could be concluded that intraparticle diffusion is the only rate controlling step. However, the values of the agreement indicators, RMSE and χ2, are the highest in comparison with all other tested models. Therefore, two other models have been applied that should provide to define the rate controlling step of Hg(II) sorption onto NZ and FeZ.
In this light, the experimental data were processed using the Weber–Morris model and the graphical plot qt vs. t1/2 is shown in Figure 6b. Since the plot shows multilinearity over the entire duration of the sorption process with satisfactory values of regression coefficients for each stages, this indicates that both film and intraparticle diffusion are involved in Hg(II) sorption on NZ and FeZ (I > 0). In order to better understand which mechanism is more dominant, the results shown in Table 1 confirm that kWM1 > kWM2, as well as Di1 > Di2, which confirms that the intraparticle diffusion is the rate controlling step. This is supported by the calculated relative coefficient (RC), which indicates that the contribution of the film diffusion is only 3% for NZ and 10% for FeZ.
The existence of two stages of Hg(II) sorption onto NZ and FeZ was also confirmed by applying the Double-exponential model. Calculated parameters kb1 > kb2, B1 > B2 as well as r1 > r2, for both NZ and FeZ indicate faster sorption of Hg(II) in the first stages controlled by film diffusion than that in second stage which is controlled by intraparticle diffusion. Furthermore, the mentioned constants (kb1, kb2, B1, B2) are almost doubly higher in the case of FeZ compared with NZ, which is a consequence of more available active sites in FeZ due to modification. These observations are consistent with the obtained sorption capacities (Figure 5). The number of readily available active sites is higher at the beginning, in the faster stage of the process, indicating that sorption in the second stage of the process takes place inside the structure of the zeolite particle. The values of RF and SF for both NZ and FeZ indicate that the major Hg(II) is sorbed at a slower stage which is controlled by intraparticle diffusion. In comparison with other models, Double-exponential model shows the best fitting with experimental results based on the highest obtained value of r2 and the smallest values of RMSE, χ2, as well as the identical value of qe and qm. Based on this, the main mechanism of mass transfer is intraparticle diffusion, accompanied by film diffusion.
3.4. Effect of Initial Concentration
An examination of the effect of the initial concentration makes it possible to determine the concentration range of the contaminant in which the zeolite shows the effective sorption capacity for the given experimental conditions. The influence of initial Hg(II) concentration on the amount of Hg(II) sorbed per gram of NZ and FeZ, as well as on removal efficiency is presented in Figure 7a,b.

Figure 7.
(a) The amount of Hg(II) sorbed per gram of NZ and FeZ vs. co and (b) the removal efficiency of Hg(II) vs. co.
An almost linear increase in qe was observed with an increase in initial concentration up to 6 mmol/L for FeZ while an increase in qe for NZ was gradual in the whole range of investigated initial concentrations. It can also be noted that for co > 8 mmol Hg/L for NZ and co > 10 mmol Hg/L for FeZ there is no further increase in qe with the increase initial Hg(II) concentration since all available sorption sites are saturated. This indicates that NZ is effective for Hg(II) concentrations up to 8 mmol/L while FeZ up to 10 mmol/L. According to Figure 7a, the maximum amount of sorbed Hg(II) was achieved by establishing plateau and equals 0.28 mmol of Hg/g for NZ and 0.54 mmol of Hg/g for FeZ.
When analyzing the removal efficiency in Figure 7b, a decreasing trend can be noticed with an increase in initial Hg(II) concentration, i.e., the highest removal efficiencies of 76% for NZ and 92% for FeZ are obtained for the lowest initial concentration of 0.47 mmol Hg/L. Significant efficacy observed for FeZ, especially for low Hg(II) concentrations makes it a very promising sorbent for the remediation of a mercury contaminated environment.
The almost double amount of Hg(II) sorbed per gram of FeZ relative to NZ is due to a modification that caused an increase in the amount of iron content as well as the net negative surface charge of the zeolite particle which is compensated by the presence of exchangeable alkali and alkaline earth cations, among which sodium dominates [21]. The Figure 8 shows relationships between in-going Hg(II) ions and out-going zeolite exchangeable cations (Na, K, Ca, and Mg) as well as pHe in the function of initial Hg(II) concentration.

Figure 8.
The relation between sorbed Hg(II) ions and released exchangeable cations and pHe in function of initial Hg(II) concentration.
The results show almost a twice total released concentration of exchangeable cations from FeZ than from NZ, which can be attributed to twice the amount of Hg(II) sorbed onto FeZ compared to NZ. The main exchangeable cation was Na for FeZ while for NZ, it was Ca. For both zeolite samples, a nonstoichiometric relationship between the released exchangeable cations and sorbed Hg(II) was observed. The reason for that could be attributed to the very low initial pH values (1.99 < pHo < 2.01) of Hg(II) solutions with an extremely high concentration of H+ ions, which are easily exchangeable with cations from the zeolite structure. However, with an increase in the initial concentration of Hg(II) for both zeolite, the competition effect is less pronounced, since the difference between the amount of released exchangeable cations and the sorbed Hg(II) decreases. This is supported by the results of pHe measurements, which decrease with increasing initial Hg(II) concentration, where the maximum measured pHe was lower than the calculated pHptt value. Smaller increase in pH observed for NZ was due to the release of dominant Ca, which shows a hydrolyzing effect [21].
When comparing the CEC values for NZ (1.42 meq/g) and for FeZ (1.64 meq/g), it was observed that the zeolites are not completely saturated with Hg(II) since the maximum amount of sorbed Hg(II) expressed in meq/g is 0.56 for NZ and 1.08 for FeZ, respectively. Since the experimentally obtained amounts of sorbed Hg(II) are less than those determined via CEC values, this also confirms the competitive effect of Hg2+ and HgOH+ (Figure 1) with H+ ions.
It is well known that a surface of zeolite particle has a charge depending on the pH value of the surrounding medium. The point of zero charge, pHpzc of both zeolite samples is previously determined and equals 6.8 ± 0.1 for NZ and 9.8 ± 0.1 for FeZ [21]. This means that both zeolites become positively charged below the pH of pHpzc due to protonation reaction with H+ ions according to reactions:
Reaction (Equation (25)) represents protonation of NZ while both reactions (Equations (25) and (26)) take place for the FeZ sample. The uptake of Hg(II) onto NZ and FeZ could be described by ion exchange reactions whereby mono or binuclear complexes are formed as follows [39]:
where: X is Ca or Mg, and Y Na or K.
The proposed ion exchange reactions (Equations (27)–(30)) take place for the NZ sample, while reactions (Equations (27)–(32)) take place for the FeZ sample. Therefore, the main mechanism of Hg(II) sorption is the ion exchange of Hg(II) species with zeolite exchangeable cations, but under the experimental conditions, pH = 2, the competition of Hg2+ and HgOH+ (Figure 1) with H+ ions cannot be excluded, which results in the protonation of the active zeolite sites according to the reactions (Equations (25) and (26)). The confirmation whether the ion exchange only mechanism is responsible for Hg(II) sorption onto NZ and FeZ can be confirmed by SEM/EDS analysis of zeolites surfaces, which follows below.
Scanning electron microscopy with energy dispersive X-ray analysis (SEM/EDS) was used to gain insight into surface morphology and semi-quantitative surface chemical composition, while backscattered electrons mode (BSE) was used to provide information on the distribution, distinguishing the newly formed phases on the surface of a zeolite particle saturated with Hg(II). BSE image with nine marked surfaces for NZHg and eight marked surfaces for FeZHg are shown in Figure 9, while a mass percentage of the detected elements on the marked surfaces are listed in Table 2 and Table 3.

Figure 9.
Backscattered electrons mode (BSE) images of NZHg and FeZHg with marked surfaces (Spectra, Sp) for energy dispersive X-ray (EDS) analysis.
Table 2.
Mass percentage values of the detected elements on the nine marked surfaces (Spectra, Sp) for NZHg.
Table 3.
Mass percentage values of the detected elements on the eight marked surfaces (Spectra, Sp) for FeZHg.
For both NZHg and FeZHg, results show almost uniform elemental composition on all observed spectra except for iron and sodium, whose values fluctuate depending on the observed area. The mean values of iron mass percentages on the surface for all spectra are higher for the FeZHg compared to NZHg, which is a consequence of the modification. After saturation, among exchangeable cations, Ca dominates on the surface of both zeolite samples but with a higher mean mass percentage for NZHg. It is interesting to note that the mean mass percentage of Na on the surface of FeZHg is low, which is in agreement with the results of monitoring the concentration of exchangeable cations during the sorption process (Figure 8) where Na+ was the dominant exchangeable cation in the FeZ sample. These results confirm that Na is exchanged with Hg(II) and H+ ions, and that ion exchange is involved in the sorption process of Hg(II) onto zeolites. The binding of Hg(II) onto zeolites is supported by the results of mass percentages of Hg(II), whose values are very similar on all observed spectra, with it being almost twice higher for FeZHg than for NZHg, which agrees with the experimentally obtained sorption capacities.
Unevenly distributed white agglomerates observed in Figure 9, especially in case of FeZHg, indicate the formation of a new phase on the surface of both zeolite samples. In order to expand the analysis, the magnifications of 1600× for NZHg and at 1900× for FeZHg were made. EDS analysis at selected three points inside and outside the agglomerates is performed, as shown in Figure 10 and Figure 11, and the mass percentage of the detected elements are listed in Table 4 and Table 5.

Figure 10.
SEM secondary electron image (left) and corresponding backscattered electron image with three marked points for saturated NZHg (right).

Figure 11.
SEM secondary electron image (left) and corresponding backscattered electron image with three marked points for saturated FeZHg (right).
Table 4.
Mass percentage values of the detected elements on the three marked points (Spectra, Sp) for NZHg.
Table 5.
Mass percentage values of the detected elements on the three marked points (Spectra, Sp) for FeZHg.
The results show that formed agglomerates on both NZHg and FeZHg consist mainly of mercury and oxygen. The analyzed point outside the agglomerates also contains mercury on both zeolite samples but in a smaller mass percentage. This indicates that mercury is sorbed over the entire surface of the particle, where some sites on the surface are more energy efficient, i.e., they act as active centers for crystal formation and growth probably in the form of HgO or Hg(OH)2. When saturation conditions are reached, Hg(OH)2 can precipitate or transform into the HgO form [37,40]. The resulting formations are irregular in shape because the sorption process was conducted under well-mixed conditions. Lu et al. described the removal of mercury via surface complexation model and formation of Hg(OH)2 complexes on the surface active sites of the Mn-Fe(hydro)oxides [41].
Taking into account all the above it could be concluded that the sorption mechanism of Hg(II) onto both zeolites includes mainly ion exchange accompanied with surface complexation and co-precipitation of different mercury phases such as oxide and hydroxide. Although it was confirmed that precipitation could not occur in the bulk solution, looking at the micro level, the zeolite surface pH may differ from the surrounding pH due to the releasing of exchangeable cations from the zeolite structure which can lead to formation precipitates.
Misealides et al. in their studies [24,42] of mercury binding onto natural zeolites, in a wide range of concentrations, found that the sorption mechanism involves ion exchange, adsorption, and Hg precipitation, most likely in the form of HgO which is consistent with our observations.
3.5. Leaching Properties of the Mercury Saturated Zeolites
Leaching properties of saturated NZHg and FeZHg were conducted in order to determine the possible application of NZ and FeZ for in situ remediation of mercury contaminated sites. The leaching test is conducted in ultrapure water in the pH range 2.00–12.05 according to the standard leaching method DIN 38414 [25]. The results of the amount of leached Hg(II) from saturated zeolites are shown in Figure 12.

Figure 12.
Amount of leached Hg(II) from saturated NZHg and FeZHg as a function of pHo as well as pHe as a function of pHo.
Results presented in Figure 12 show that in a wide pH range, 4.01 ≤ pH ≤ 1.08, the leaching of mercury was observed in a small amount, only 0.28–0.78% from NZHg and 0.07–0.51% from FeZHg. This indicates that mercury is firmly bound to the both zeolites. At extreme pH conditions, pH ≤ 3.02 and pH ≥ 12.05, leaching of mercury in an amount of 4–7% occurs from both zeolites. Generally, heavy metals can easily be released at acidic pH values, while at alkaline pH values they form insoluble hydroxides. In our case, at pH ≤ 3.02, leaching occurs due to the high quantity of hydrogen ions which displace the mercury from the zeolite structure. At pH = 2.00 and pH = 3.02, an increase in pH by 0.4 pH units is observed, while for all other pHo values a decrease in pH is observed which tends to pH ≈ 4.5 and could be attributed to the hydroxylation of mercury species bound to the zeolite surface. The reason for leaching at extremely high pH ≥ 12.05 is due to the rupture of Si-O bonds (desilication) and degradation of the zeolite structure resulting in an increase in leached mercury. When comparing the percentage of leached mercury at all observed pH values, it can be noticed that the percentage of leached mercury is higher from NZHg than from FeZHg, which suggests a higher affinity of Hg(II) towards FeZ. Furthermore, the amount of leached mercury in relation to the amount of bound mercury to NZ and FeZ is not significant at 4.01 ≤ pH ≤ 11.08 which suggests that NZ and especially FeZ have the ability to bind and retain mercury in its structure in a wide pH range. This indicates that both NZ and FeZ could be applied for in situ remediation of a mercury contaminated environment.
4. Conclusions
This study provided valuable information on Hg(II) sorption onto NZ and FeZ. It was noted that the sorption of Hg(II) was highly sensitive to the effect of pH and S/L ratio, especially onto FeZ, where pH ≈ 2 and S/L = 10 were found to be optimal for both zeolites. The quantity of removed Hg(II) onto FeZ was found to be twice higher than onto NZ (0.28 mmol Hg/g and 0.54 mmol Hg/g). A determination of the relationship between released exchangeable cations and sorbed Hg(II) as well as a comparison of the CEC value with the maximum amount of sorbed Hg(II) confirmed the competition effect between Hg(II) species and H+ ions onto both zeolite. The mechanism of Hg(II) sorption onto both zeolites was attributed mainly to the ion exchange, accompanied with surface complexation, which was especially pronounced for FeZ. The agglomerates on the FeZ surface were confirmed by SEM/EDS analysis, indicating possible co-precipitation. The rate-controlling step in the sorption process on heterogeneous surface of both zeolites included intraparticle diffusion accompanied by film diffusion. The leaching test confirmed the leaching of Hg(II) in extreme pH conditions, pH ≤ 3.02 and pH ≥ 12.05, indicating a moderate ability of zeolites to retain Hg(II) under these conditions. In a wide pH range, 4.01 ≤ pH ≤ 11.08, the amount of leached Hg(II) was not significant indicating that both zeolites were an effective materials for binding and retaining Hg(II) in their structure. In conclusion, both zeolites could be used in remediation purposes and the results suggest that modification significantly improves the sorption properties of zeolite.
Author Contributions
Conceptualization, investigation, methodology, formal analysis, writing—original draft preparation M.U.; writing—review and editing, M.U., T.Č., I.N., and M.T. All authors have read and agreed to the published version of the manuscript.
Funding
This work has been fully financially supported by the bilateral Croatian-Slovenian project “Natural modified sorbents as materials for remediation of mercury contaminated environment” (2020–2023) and the research program “Groundwater and Geochemistry (P1-0020)”.
Acknowledgments
We are also thankful to the Geological Survey of Slovenia for performing the SEM/EDS analysis.
Conflicts of Interest
The authors declare no conflict of interest.
References
- Xu, J.; Garcia Bravo, A.; Lagerkvist, A.; Bertilsson, S.; Sjöblom, R.; Kumpiene, J. Sources and remediation tehniques for mercury contaminated soil, review. Environ. Int. 2015, 74, 42–53. [Google Scholar] [CrossRef]
- Wang, J.; Feng, X.; Anderson, C.W.N.; Xing, Y.; Shang, L. Remediation of mercury contaminated sites—A review. J. Hazard. Mater. 2012, 221–222, 1–18. [Google Scholar] [CrossRef]
- Han, C.; Wang, W.; Xie, F. Study of the leaching of mercuric oxide with thiosulfate solutions. Metals 2016, 6, 206. [Google Scholar] [CrossRef]
- Tejada Tovar, C.; Villabona Ortiz, Á.; Garcés Jaraba, L.E. Kinetic and adsorption mercury removal using cassava (Manhiot esculenta) and lemon (Citrus limonum) waste modified with citric acid. Ing. Univ. Bogotá (Columbia) 2015, 19, 283–298. [Google Scholar]
- Davis, A.; Bloom, N.S.; Quee He, S.S. The environmental geochemistry and bioaccessibility of mercury in soils and sediments: A review. Risk Anal. 1997, 17, 557–569. [Google Scholar] [CrossRef] [PubMed]
- Al-Ghouti, M.; Da’ana, D.; Abu-Dieyeh, M.; Khraisheh, M. Adsorptive removal of mercury from water by adsorbents derived from daze pits. Sci. Rep. 2019, 9, 15327–15340. [Google Scholar] [CrossRef]
- Mayas, D.C.; Scheibe, T.D. Groundwater contamination, subsurface processes, and remediation methods: Overview of the special issue of Water on Groundwater contamination and remediation. Water 2018, 10, 1708. [Google Scholar] [CrossRef]
- Robles, I.; Lakatos, J.; Scharek, P.; Planck, Z.; Hernández, G.; Solís, S.; Bustos, E. Characterization and remediation of soils and sediments polluted with mercury: Occurrence, transformations, environmental considerations and San Joaquin’s Sierra Gorda Case. In Environmental Risk Assessment of Soil Contamination; Hernandez Soriano, M.C., Ed.; IntechOpen: New York, NY, USA, 2014; pp. 827–850. [Google Scholar] [CrossRef]
- Thiruvenkatachari, R.; Vigneswaran, S.; Naidu, R. Permeable reactive barrier for groundwater remediation. J. Ind. Eng. Chem. 2008, 14, 145–156. [Google Scholar] [CrossRef]
- Silva, H.S.; Ruiz, S.V.; Granados, D.L.; Santángelo, J.M. Adsorption of mercury(II) from liquid solutions using modified activated carbons. Mater. Res. 2010, 12, 129–134. [Google Scholar] [CrossRef]
- Xia, M.; Chen, Z.; Li, Y.; Li, C.; Ahmad, M.N.; Cheema, W.A.; Zhu, S. Removal of Hg(II) in aqueous solutions through physical and chemical adsorption principles, review. RSC Adv. 2019, 9, 20941–20953. [Google Scholar] [CrossRef]
- Wang, S.; Peng, Y. Natural zeolites as effective adsorbents in water and wastewater treatment. Chem. Eng. J. 2010, 156, 11–24. [Google Scholar] [CrossRef]
- Shi, W.; Shao, H.; Li, H.; Shao, M.; Du, S. Progress in the remediation of hazardous heavy metal-polluted soils by natural zeolite. J. Hazard. Mater. 2009, 170, 1–6. [Google Scholar] [CrossRef] [PubMed]
- Misealidis, P. Application of natural zeolites in environmental remediation: A short review. Microp. Mesopor. Mater. 2011, 144, 15–18. [Google Scholar] [CrossRef]
- Awad, F.S.; AbouZied, K.M.; Abou El-Maaty, W.M.; El-Wakil, A.M.; El-Shall, M.S. Effective removal of mercury(II) from aqueous solutions by chemically modified graphene oxide nanosheets. Arab. J. Chem. 2020, 13, 2659–2670. [Google Scholar] [CrossRef]
- Doula, M.K. Removal of Mn2+ ions from drinking water by using Clinoptilolite and a Clinoptilolite-Fe oxide system. Water Res. 2006, 40, 3167–3176. [Google Scholar] [CrossRef] [PubMed]
- Dimirkou, A. Uptake of Zn2+ ions by a fully iron-exchanged clinoptilolite. Case study of heavily drinking water samples. Water Res. 2007, 41, 2763–2773. [Google Scholar] [CrossRef]
- Doula, M.K. Synthesis of a clinoptilolite-Fe system with high Cu sorption capacity. Chemosphere 2007, 67, 731–740. [Google Scholar] [CrossRef]
- Han, R.; Zou, L.; Zhao, X.; Xu, Y.; Xu, F.; Li, Y.; Wang, Y. Characterization and properties of iron oxide-coated zeolite as adsorbent for removal of copper (II) from solution in fixed bed column. Chem. Eng. J. 2009, 149, 123–131. [Google Scholar] [CrossRef]
- Kragović, M.; Daković, A.; Sekulić, Ž.; Trgo, M.; Ugrina, M.; Perić, J.; Gatta, G.D. Removal of lead from aqueous solutions by using the natural and Fe(III)-modified zeolite. Appl. Surf. Sci. 2012, 258, 3667–3673. [Google Scholar] [CrossRef]
- Ugrina, M.; Vukojević Medvidović, N.; Daković, A. Characterization and environmental application of iron-modified zeolite from the Zlatokop deposit. Desalin. Water Treat. 2015, 53, 3557–3569. [Google Scholar] [CrossRef]
- Chojancki, A.; Chojancka, K.; Hoffmann, J.; Górecki, H. The application of natural zeolites for mercury removal: From laboratory tests to industrial scale. Miner. Eng. 2004, 17, 933–937. [Google Scholar] [CrossRef]
- Gebremedhin-Haile, T.; Olguín, M.T.; Solache-Ríos, M. Removal of mercury ions from mixed aqueous metal solutions by natural and modified zeolitic minerals. Water Air Soil Pollut. 2003, 148, 179–200. [Google Scholar] [CrossRef]
- Misealides, P.; Godelitsas, A. Removal of heavy metals from aqueous solutions using pretreated natural zeolitic materials: The case of mercury(II). Toxicol. Environ. Chem. 1995, 51, 21–29. [Google Scholar] [CrossRef]
- Doušová, B.; Grygar, T.; Martaus, A.; Fuitová, L.; Koloušek, D.; Machovič, V. Sorption of AsV on aluminosilicates treated with FeII nanoparticles. J. Colloid Interface Sci. 2006, 302, 424–431. [Google Scholar] [CrossRef] [PubMed]
- US EPA. Cation-Exchange Capacity of Soils (Ammonium Acetate): Test Methods for Evaluating Solid Waste. SW-846, Method 9080; US EPA, Office of Solid Waste and Emergency Response: Washington, DC, USA, 1986.
- DIN 38414 S4 German Standard Procedure for Water, Wastewater and Sediment Testing—SLUdge and Sediment. Determination of Leachability; Institute Institut für Normung: Berlin, Germany, 1984.
- Kumar Vasanth, K. Linear and non-linear regression analysis for the sorption kinetics of methylene blue onto activated carbon. J. Hazard. Mater. B 2006, 137, 1538–1544. [Google Scholar] [CrossRef] [PubMed]
- Kumar, D.; Gaur, J.P. Chemical reaction- and particle diffusion-based kinetic modeling of metal biosorption by a phormidium sp.-dominated cyanobacterial mat. Bioresour. Technol. 2011, 102, 633–640. [Google Scholar] [CrossRef]
- Bangham, D.H.; Sever, V. An experimental investigation of the dynamical equation of the process of gass-sorption. Philos. Mag. 1925, 49, 935–944. [Google Scholar] [CrossRef]
- Helferich, F. Ion Exchange; Mc Graw-Hill Inc.: New York, NY, USA, 1962; pp. 250–322. [Google Scholar]
- Apiratikul, R.; Pavasant, P. Sorption of Cu2+, Cd2+, and Pb2+ using modified zeolite from coal fly ash. Chem. Eng. J. 2008, 144, 245–258. [Google Scholar] [CrossRef]
- Wilczak, A.; Keinath, T.M. Kinetics of sorption and desorption of copper(II) and lead(II) on activated carbon. Water Environ. Res. 1993, 65, 238–244. [Google Scholar] [CrossRef]
- Foo, K.Y.; Hameed, B.H. Insight into the modelling of adsorption isotherm systems, review. Chem. Eng. J. 2010, 156, 2–10. [Google Scholar] [CrossRef]
- Vijayaraghavan, K.; Padmesh, T.V.N.; Palanivelu, K.; Velan, M. Biosorption of nickel(II) ions onto Sargassum wightii: Application of two-parameter and three-parameter isotherm models. J. Hazard. Mater. B1 2006, 33, 304–308. [Google Scholar] [CrossRef] [PubMed]
- Nazarenko, V.A.; Antonovich, V.P.; Nevskaja, E.M. Metal Ions Hydrolysis in Dilute Solutions; Atomizad: Moscow, Russia, 1979; pp. 34–47. [Google Scholar]
- Powell, K.J.; Brown, P.L.; Byrne, R.H.; Gajda, T.; Hefter, G.; Sjöberg, S.; Wanner, H. Chemical speciation of environmentally significant heavy metals with inorganic ligands part 1: The Hg2+– Cl−, OH−, CO32−, SO42−, and PO43− aqueous systems. Pure Appl. Chem. 2005, 77, 739–800. [Google Scholar] [CrossRef]
- Minceva, M.; Fajagar, R.; Markovska, L.; Meshko, V. Comparative study of Zn2+, Cd2+, and Pb2+ removal from water solution using natural clinoptilolitic zeolite and commercial granulated activated carbon. Equilibrium and adsorption. Sep. Sci. Technol. 2008, 43, 2117–2143. [Google Scholar] [CrossRef]
- Strumm, W.; Morgan, J.J. Aquatic Chemistry, Chemical Equilibria and Rates in Natural Waters, 3rd ed.; John Wiley & Sons: New York, NY, USA, 1996; pp. 533–573. [Google Scholar]
- Chai, L.; Wang, Q.; Wang, Y.; Li, Q.; Yang, Z.; Shu, Y. Thermodynamic study on reaction path of Hg(II) with S(II) in solution. J. Cent. South Univ. Technol. 2010, 17, 289–294. [Google Scholar] [CrossRef]
- Lu, X.; Huangfu, X.; Ma, J. Removal of trace mercury(II) from aqueous solution by in situ formed Mn-Fe(hydro)oxides. J. Hazard. Mater. 2014, 280, 71–78. [Google Scholar] [CrossRef] [PubMed]
- Misealides, P.; Godelitsas, A.; Charistos, V.; Ioannou, D.; Charistos, D. Heavy metal uptake by zeoliferous rocks from Metaxades, Thrace, Greece: An exploratory study. J. Radioanal. Nucl. Chem. 1994, 183, 159–166. [Google Scholar] [CrossRef]


Publisher’s Note: MDPI stays neutral with regard to jurisdictional claims in published maps and institutional affiliations. |
© 2020 by the authors. Licensee MDPI, Basel, Switzerland. This article is an open access article distributed under the terms and conditions of the Creative Commons Attribution (CC BY) license (http://creativecommons.org/licenses/by/4.0/).