1. Introduction
The coating of particulate materials is an important process for various industries, including the chemical, food and pharmaceutical industries [
1]. Coating is frequently used for protective or functional purpose [
2,
3]. Additionally, the visual properties of the particles can also be changed [
4]. Therefore, through coating processes, various properties can be achieved, such as stabilization of active substances, enhanced mechanical properties, masking of taste and odor, improved optical appearance, and defined drug release profile in the human body [
5]. Among different particulate materials, fine particles have come to be of major interest lately. Many industrial sectors are expected to find applications and take advantage of the new functionalities and many desirable properties attributed to ultrafine particles, e.g., their use as drug delivery carriers [
6].
Application of the coating layer to the surface of a particle is a complex process [
5]. Typically, a suspension or solution is sprayed onto the particles, after that, every single particle is wrapped by the liquid film. New solid layers are formed after the liquid in the film has evaporated, which results in coating of the particles. Specifically, depending on the apparatus used and the coating material conditions, the process may comprise the following steps: droplet formation, wetting, spreading, evaporation, and drying [
7].
Fluidization is one of the most important techniques in the particle formation process because it possesses the advantages of high heat and mass transfer rates, good mixing and homogeneity. With the increasing progress of experimental methods and mathematical models in recent years, the spray fluidized bed coating of particulate materials is becoming an established industrial process [
8,
9]. Despite this, fluidized bed coating without severe agglomeration is typically limited to particle sizes larger than 100 μm [
5]. On the one hand, the reason for this is that fine powders fluidize poorly due to their strong interparticle cohesive forces, exhibiting channeling, lifting as a plug and forming “rat holes” when aerated [
10]. On the other hand, when using ordinary two-fluid nozzles, the spray is composed of droplets with an average diameter of 40 μm or more [
11], which can be considered to be large droplets relative to the particle size. Hence, an over-wetted particle surface will result in strong cohesive forces of liquid bridges that hold particles together after the particles collide with each other during the drying process. These are converted to solid bridges upon drying, fixing the structure of agglomerates that will not break in the subsequent steps [
12].
To overcome these issues, conventional methods can be optimized by improving the particles or modifying the fluidized bed. Thereby, powders can be granulated with larger particles in order to enhance the fluidization, drying and coating process in the fluidized bed [
13]. Otherwise, fluidization can also be assisted by a variety of mechanisms such as vibration, mechanical agitation, sound and magnetic force to improve the flowability of cohesive particles [
6,
14,
15]. Such approaches are effective in the formation of coating layers, but they also have the disadvantage of limited application ranges. When granulating the fine particles with coarse ones, the high concentration of easily fluidized material will finally influence the product purity. Additionally, most assistance techniques require complicated modifications to the traditional fluidized bed configuration that might demand large additional costs.
Recently, several researchers have tried to coat fine particles by using different apparatuses for under various operating conditions. For instance, a Wurster fluidized bed was used by Ichikawa et al. [
16] along with 12 μm cornstarch as the core particles and composite of polymers as the coating material. The corresponding product only contained 3 wt.% agglomerates. However, there were still some ineluctable problems when using this method: for example, sufficiently prolonged release properties could not be obtained. Watano et al. [
6,
17] tried the rotating fluidized bed using fine cornstarch particles. In this case, the cohesive cornstarch particles behaved like particles that could be well fluidized because the centrifugal forces on increased the apparent particle weight. This led to cornstarch being successfully coated nearly without agglomeration. However, this method required a complex apparatus and a significant amount of energy caused by the huge pressure drop through the particles. Chen et al. [
18,
19] proposed a way in which core materials were pretreated by deposition of nano-particles on the surface of fine particles. The addition of a nano-particle surface coating reduces the cohesive behavior so that fine particles can fluidize in a conventional fluidized bed and good quality coating product may be obtained. Nevertheless, the pretreatment process was inefficient and time-consuming, which is a big drawback in large-scale industrial production. The recent work of Hampel et al. [
20] developed a new method that combined two particle formulation processes: spray drying and coating. The idea was to spray fine particles to be coated together with coating solution means of a two-fluid nozzle, aiming at the generation of droplets with only one contained particle at the nozzle outlet. After evaporation of the water in such a droplet, a thin solid film is built on the particle surface. This innovative, low-cost and easy-to-implement method could avoid the occurrence of agglomeration to a certain extent, but partly coated or even uncoated products appeared under certain process conditions.
As indicated by the previous experiments conducted in a fluidized bed, a difficulty lies in successfully fluidizing the original fine particles. Previous research by Ichikawa et al. demonstrated that the bottom-spray Wurster bed is an effective way of improving the fluidization behavior of cohesive fine particles [
16]. However, as mentioned earlier, large spray droplets lead to the formation of agglomerates, so that individual coating of fine particles still be a challenge and this work is focus on the topic.
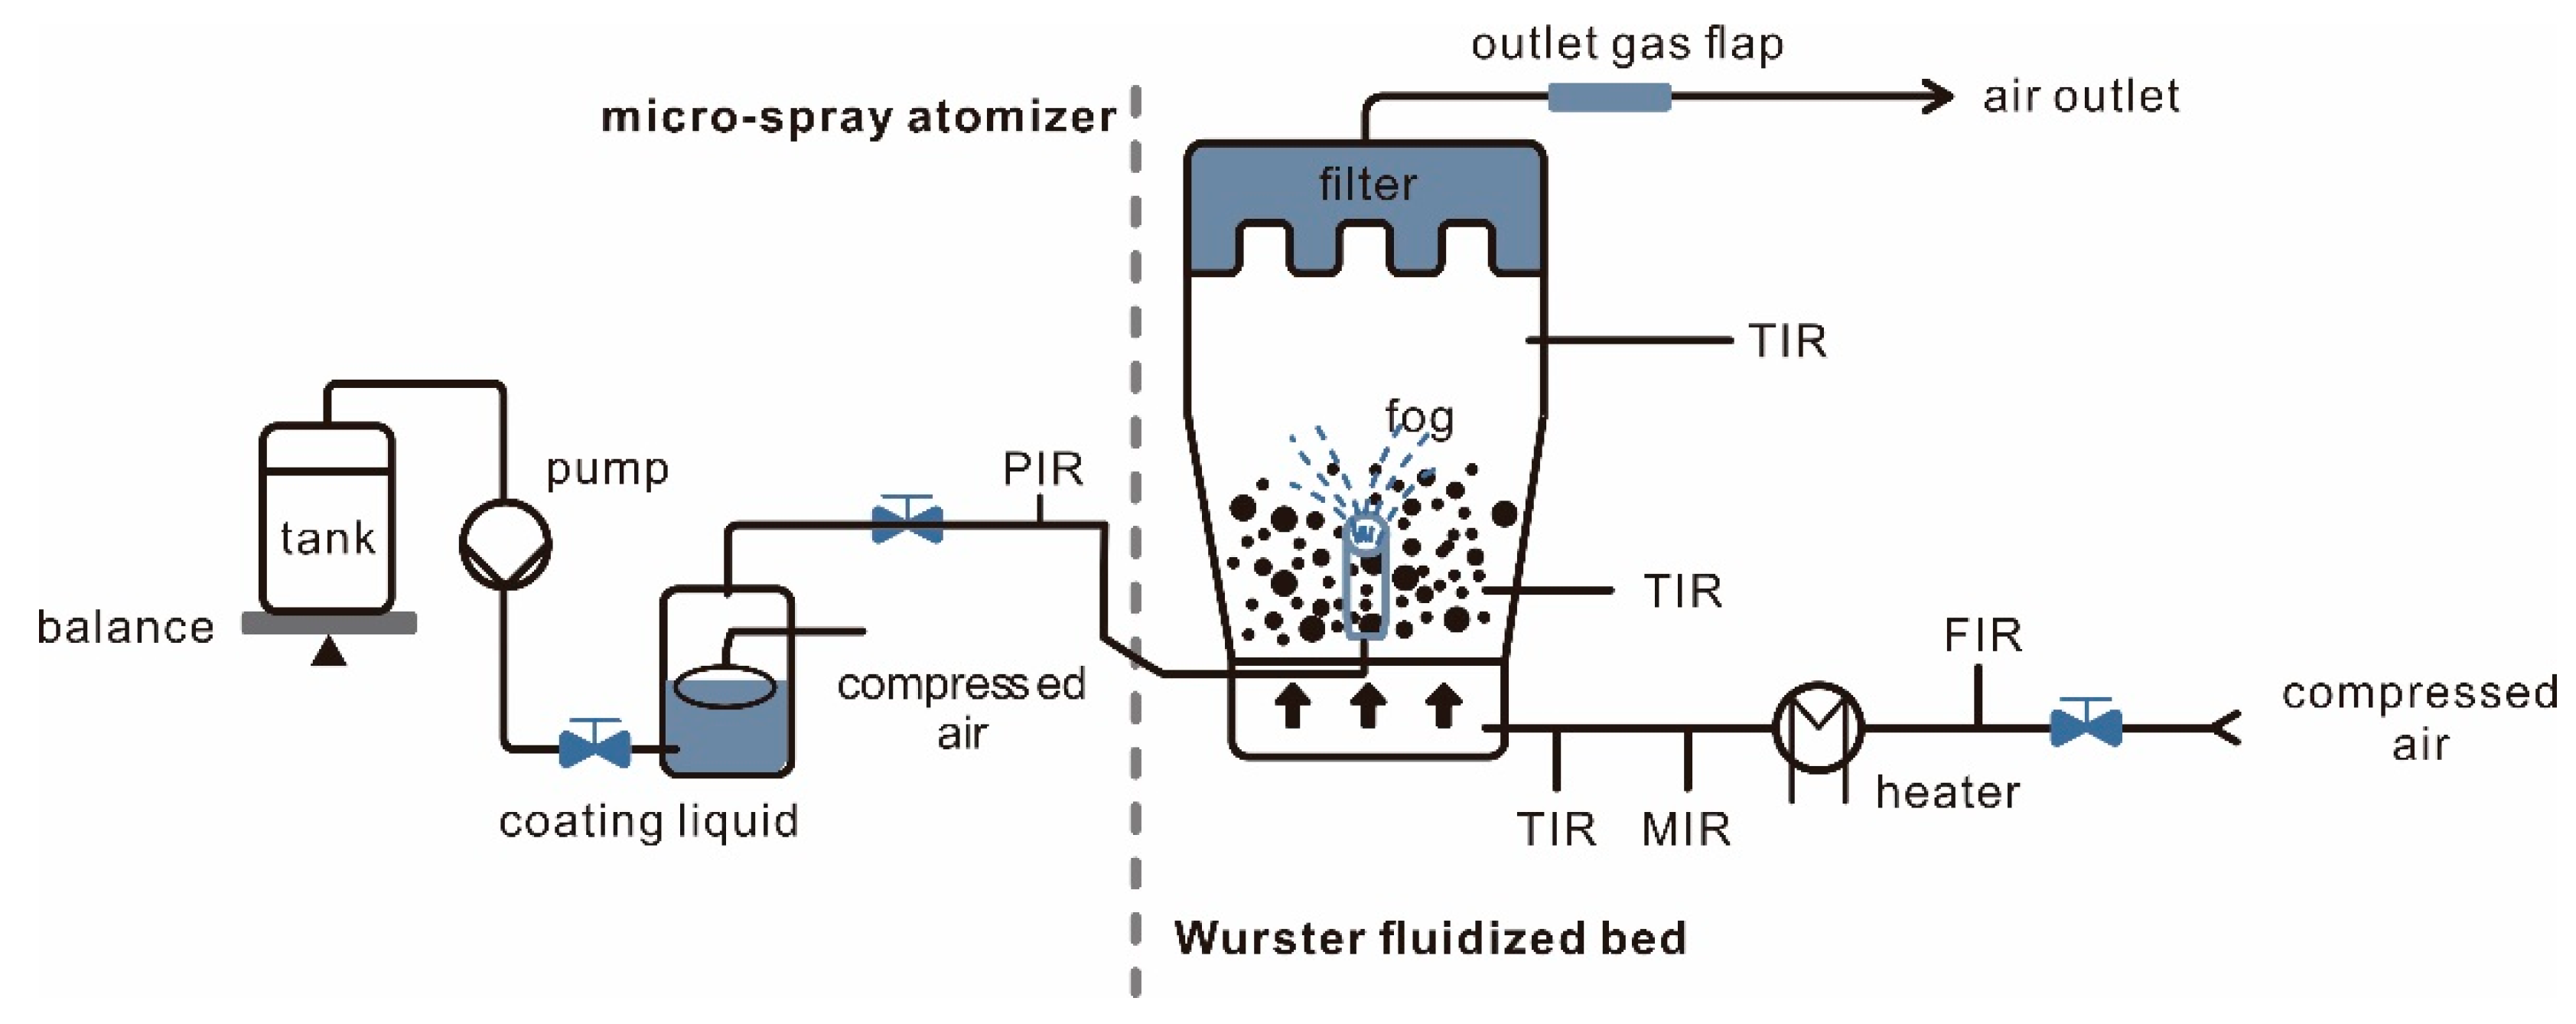
A radical change from conventional spray to aerosol for coating process in fluidized bed is presented in this work. The aerosol, generated by a recently developed method [
21,
22], was supplied into the chamber of a Wurster fluidized bed from the bottom. It was recently shown that ultrathin coating can be easily produced on large particles in a traditional fluidized bed by such an aerosol [
23]. Here, the coating of fine particles was in focus. The working hypothesis was that aerosol with diameters 10–100 times smaller than regular sprays would be more suitable for fine particles and enable uniform coating layers and without the excessive agglomeration that traditional spray fluidized bed particle coating systems show.
In this work, investigations will be presented on the effect that operating conditions such as core material size, air temperature, coating material concentration and the presence of the additive in coating solution have on efficacy of the presented process to produce coated fine particles. Finally, the influence of operating conditions on the resulting product quality will be described and discussed; the strengths and weaknesses of the novel aerosol coating process to its conventional counterpart will be summarized.
3. Results and Discussion
The coating process in a fluidized bed is complex. It involves an ingenious balance between mixing, wetting and drying, which depends on several parameters such as air temperature and flow rate, sprayed solution rate, coating solution composition and many other factors [
1,
28,
29,
30]. All the above variables have a decisive effect on the quality of the product. Comprehensive experimental and numerical research has been done in the past few years for large particles coated in fluidized beds with conventional nozzles to explain the effect of these variables.
From the past studies it is clear that: (1) the rise of inlet air temperature enhances the drying of wet particles during the coating; (2) more uniform dispersion of coating solution droplets in the equipment results in more uniform layers on the particle surfaces; (3) growth of coating layer thickness depends on the flow rate of the coating solution. Despite the many results on the coating of large particles (diameter > 200 μm) in the literature, less attention has been paid to the investigation of the coating parameters of fine particles. However, with the help of the novel aerosol atomizer, the coating of fine particles is easier, so it is possible to make a systematic investigation of the effects of important operating parameters on the coating performance.
3.1. Effect of Particle Size
As mentioned earlier, large particles and small particles usually behave differently in fluidized bed coating. This difference is usually caused by the imperfect fluidization of small particles. In this study, in order to enhance the fluidization of small particles, the Wurster fluidized bed was used. At the same time, the new aerosol generator was also applied in the coating process for both kinds of particles. The experimental results show that both large and small particles could be coated under the usage of aerosol, but there are still some differences.
Particle size distributions of uncoated and coated glass particles are plotted in
Figure 7a. Average particle sizes of small and large coated particles are 66 μm and 215 μm respectively, with the original particles at 63 μm and 202 μm, as mentioned before. This implied that most of the particles were individually coated. In addition, the agglomeration rate ϕ were 5.4% and 6.8%, respectively, when using the calculation method from
Section 2.4. These results all prove that both large particles and small particles could be successfully coated without severe agglomeration by the novel method.
Figure 7b shows the evolution of the average particle diameter for the product samples. The absolute growth value of large particles is higher than that of small particles. On the other hand, the growth interval of small particles is mainly concentrated in the first 40 min and particle diameter is stabilized after that, while large particles can continue to grow for nearly 90 min.
SEM images with different magnification of product (shown in
Figure A1 of
Appendix A) reveal the larger and smaller glass beads were both coated by NaB, proving the successful coating of particles by the novel coating process with aerosol. The corresponding coating coverage as shown in
Figure 8 reveals that both large and small particles were almost completely covered, with the mean coverage value of large particles being 99.2% and that of small particles being 99%. Since this is close to unity, the coverage had a very small standard deviation in both cases.
Smaller particle size results in a relatively lower yield, as shown in
Table 3; 13.59% for glass cores of 63 μm as compared with 21.51% for glass cores of 202 μm. The loss of coating material is mainly attributed to the collected fines in the filter above the fluidized bed. Because the droplet size of the aerosol is extremely small, it was easy to be dried by hot air and entrained to the filter by the fluidization gas.
From the above results, it can be seen that both large and small particles can be properly fluidized in the modified Wurster equipment, and uniform coating can be obtained when the aerosol generator replaces the conventional two-fluid nozzle. However, it is worth noting that due to the extremely small size of the aerosol, it takes a longer time for the core particles to obtain an almost complete coating compare to the conventional coating process. Moreover, according to experimental observations, small particles would rather stick to the wall of the fluidized bed due to electrostatic and other micro-scale forces, which might explain why the coverage rate is slightly lower than that of large particles.
3.2. Effect of Air Inlet Temperature
Hot fluidized gas passing through the distributor plate and the fluidization chamber is responsible for drying of the particles by heat and mass transfer to the fluidized bed. Based on previous experience, higher temperature during the process favors drying, leading to rapid evaporation of droplets. In comparison, when temperature is lower, the evaporation rate of the coating solution decreased, leading to slight agglomeration. A moderate coating process in the modified fluidized bed is only obtained when wetting and drying reached a proper balance. The above conclusions are also applicable to the use of traditional nozzles for large particles. However, the balance is more difficult to maintain when using fine particles, and the temperature control the coating of fine fluidized particles using the aerosol generator is more challenging.
The particle size distribution results for small glass particles when air inlet temperature increased from 50 °C to 90 °C are plotted in
Figure 9a. Product size does not have obvious differences as temperature changes; mean particle size is 67.5 μm, 66.8 μm, 66 μm, 65.7 μm and 65.8 μm respectively.
Figure 9a also indicates the slight difference of agglomeration ratios (13.1%, 8.6%, 5.4%, 3.6% and 3.4% based on the PSD results). It can be seen that the overall agglomeration rate is at a relatively low level, but there are still more agglomerated particles under low temperature conditions than at high temperature.
As depicted in
Figure 9b, in each case, faster growth is achieved at the beginning of the experiment. After 60 min, average particle size is still increasing. The process is stopped at 180 min with fluctuating average particle diameters of approximately 66 μm in the product.
SEM images shown in
Figure A2 of
Appendix A that clearly illustrate that during the coating process in the modified fluidized bed, agglomeration hardly happened. At the lowest temperature of 50 °C, coating quality was though worse than at higher temperature. When particles are coated at a higher temperature, the images show a better coating structure. To differentiate the coating performance at the above five temperatures, coating coverage calculation based on SEM images has been carried out and the results are shown in
Figure 10. It is seen that the coating coverage tends to increase with the fluidized bed temperature, though with a maximum at 70 °C (with coating coverage of 86% for 50 °C, 88% for 60 °C, 99% for 70 °C, 94% for 80 °C and 92% for 90 °C).
The influence of temperature on the yield of the aerosol coating process is shown in
Table 4. The results indicate that when the temperature is too high, the yield may be much lower than at moderate temperature; 13.59% for the temperature of 70 °C as compared with 8.83% for the temperature of 90 °C. It is known that temperature may be a critical factor that can affect process yield even when using a two-fluid nozzle. In fact, when the aerosol generator is used, because the aerosol has smaller droplet size, the temperature causes a more noticeable effect on the yield. Higher temperature results in the loss of coating material due to rapidly evaporation before deposition and coating can take place on the surface of the cohesive fluidized particles, which allows the aerosol droplets to be directly dried into fine powder and then quickly blown out of the fluidization chamber with the airflow.
In summary, it can be seen that the evaluation indicators of coated products are susceptible to temperature changes. At low temperature, some aerosol droplets cannot be dried in time. So even though the droplets are very small when the aerosol generator is applied, liquid bridges between the particles may still lead to agglomeration. On the contrary, agglomeration is negligible at high temperature, but the loss of coating solution by overspray may cause lower solution yield. Therefore, in the case of various process parameters being adjusted, it is particularly important to first determine an appropriate range of mild temperatures to obtain high-quality products.
3.3. Effect of Coating Solution Viscosity
To investigate the influence of coating solution viscosity on coating speed and process time with the same core particles as before, an additive was mixed into the coating solution. As mentioned above, the additive used was HPMC, which is suitable for the agglomeration of excipients and also plays an important role as a coating material in the pharmaceutical industry. The concentration of HPMC in the solution should be carefully selected. Due to its extremely high viscosity, HPMC is usually used as an agglomerating binder with more than 4 wt% in the solution [
31]. In this study of coatings, less HPMC was added to the NaB solution, namely zero to 1.5%.
The influence of coating solution viscosity on coating performance was experimentally investigated by adding different mass fraction of HPMC (with a relationship between HPMC mass fraction and solution viscosity, as can be seen in
Table 1), and the corresponding results are discussed in the following.
Figure 11a indicates that more HPMC in the solvent makes the size distribution of coated glass particles slightly different and somewhat narrows. The average size of the final coated particles decreased monotonically from 66 μm to 64.8 μm when the HPMC mass fraction in the NaB solution was increased from 0% to 1.5%.
Figure 11b shows the evolution of average particle size with different viscosity of the coating solution. In these experiments, a much more quicker particle growth is achieved when the coating solution has a higher viscosity. A fluctuating steady state is reached in only 20 min for 1.5 wt% HPMC, compared to 40 min for 0% HPMC. On the other hand, higher solution viscosity results in smaller final particle size. The process stops after 180 min with particle size growth from 1.8 μm to 3 μm.
With traditional two-fluid nozzles, higher viscosity of the coating solution can increase the rate of undesired agglomeration in the course of coating processes. However, the novel aerosol atomizer can generate small aerosol droplets, which makes it difficult to produce solid bridges at a suitable process temperature even when the solution viscosity is high. The present results confirm that the agglomeration rate remains small even at high viscosity of the coating solution (agglomeration rate of 2.99% for 0.5 wt% HPMC, 2.32% for 1 wt% HPMC and 1.24% for 1.5 wt% HPMC based on the PSD).
SEM images of coated particles are shown in
Figure A3 of the
Appendix A. It appears that the increase in viscosity of the solution decreases significantly the overall average coverage of particles, with increasing differences among individual particles of the population. In general, island growth is observed, and patchy particles are obtained. In the case of 1.5 wt% HPMC, the overall coverage is only 21%. In addition to the decrease in coverage, the coating layers also gradually become compact and brittle as the viscosity increases.
Figure 12 shows the coverage results evaluated from the SEM images at different HPMC concentrations.
As the solution viscosity increases, the coverage shows a downward trend. One explanation is that after the high-viscosity liquid dries on the surface of the particles, the dense and compact coating layers break off due to collisions between particles. Finally, the growth and breakage of the coating layer reach an equilibrium at a certain surface coverage, which may be quite low. To verify this conjecture, an additional experiment has been conducted with 5 wt% of HPMC. During this experiment, the yield of the solution has been evaluated every 10 min. Results are plotted in
Figure 13. It can be seen that the yield decreases to zero 60 min, that is, the rate of coating layer formation becomes equal to the rate of dried coating layer breakage. This trend is stronger when introducing HPMC to increase the viscosity of the solution; it is, therefore, not easy to obtain a coating product with 100% coverage in such cases.
In summary, agglomeration can be avoided by the innovative coating system even when the particles are fine and the coating solution is sticky. Sticky solution may even increase the coating rate by promoting the deposition of aerosol droplets on the surface of core particles. At the same time, however, coating layers are denser and more compact than at low viscosity. Such dense coating layers seem to be brittle, and are more likely to break off after collisions between particles and with walls in the Wurster fluidized bed, which results in low product coverage and uneven overall coating of patchy product particles.
3.4. Effect of Aerosol Inlet Position
In this study, the aerosol was introduced into the fluidized bed from the bottom by means of a copper inlet tube through the distributor plate. When using a Wurster fluidized bed with a traditional two-fluid nozzle, the distance between the nozzle outlet and the bottom distributor plate can affect the coating quality. Similarly, in the novel coating system, aerosol and fluidized particles move concurrently in riser, so the inlet position of aerosol may affect its contact time with the particles. Therefore, the influence of aerosol inlet position on the experimental results was explored using three different copper tubes with lengths of 6 cm, 7 cm and 8 cm, respectively.
As can be seen from the particle size distributions in
Figure 14, the inlet tube of 8 cm has a minor effect in altering the particle size, showing scarce agglomeration and only a slight change in average particle size. With a decrease of the inlet tube length to 7 cm, the amount of larger agglomerates increased slightly. Results based on calculated from graphs verify that decreasing the tube length from 8 cm to 6 cm results in a slightly increased particle size from 66 μm to 67.5 μm, and the proportion of agglomeration increases significantly from 5.4% to 13.2%. The reason for this behavior is that the shorter tube increases the residence time of droplets in the Wurster riser, but it also increases the humidity in regions with many particles, so agglomeration is more likely to occur.
As depicted in
Figure 14b, the experiment reaches steady state after around 60 min with average particle size of approximately 67.5 μm in the product when the copper tube is 6 cm. Compared to the 7 cm and 8 cm experiments, the growth rate is faster at beginning, and the average particle size is slightly larger at steady state.
SEM images of the final product (
Appendix A,
Figure A4) show good coating of the glass particles for all investigated aerosol inlet tube lengths. The related coating coverage shown in
Figure 15 ranges from 99.8% to 99%. All three conditions have a small standard deviation, which means the particle coverage is relatively uniform.
Table 5 indicates that a longer aerosol tube results in lower yield; 13.59% for a copper tube of 8 cm as compared with 23.13% for 6 cm. It can be seen that the closer the aerosol outlet is to the bottom distributor plate, the less coating solution is lost; therefore, the use rate is the highest in this case.
The above results show that, similar to the conventional bottom spray coating system, when the coating process is conducted with the novel aerosol generator, the position at which the generated aerosol is introduced into the fluidized bed influences the results. Due to higher particle concentration at the bottom of the Wurster fluidized bed [
32], when aerosol enters the fluidized bed at a lower position, the frequency of contacts with particles and the probability of particles capturing aerosol droplets rise. Eventually, the process yield will also increase. However, it is worth noting that a too-low inlet position will also cause the humidity of the dense zone of bed to increase, with a potential increase in the agglomeration.
4. Conclusions
A novel coating process in a Wurster fluidized bed combined with an aerosol atomizer was presented in this study. It was shown by a series of experiments that different operation parameters influence the particle growth behavior. The experiments have shown the feasibility of using aerosol to produce a coating layer on fluidized particles. It should be noted that submicron aerosol droplets have been used rather than conventional two-fluid nozzle spray with droplet diameters of tens of microns. Due to the extremely small diameter of aerosol droplets, even very small core particles could be individually coated and without severe agglomeration. In addition, in the industrial field, due to the extremely small aerosol droplets, the resulting coating layer is ultrathin, and the yield of the new coating process was determined to be 15–20% under different conditions, which is considered to be improvable. The yield in this study may be enhanced by the recycling of entrained solids or better equipment design, especially when scaling up the experiment plant.
Coating performance was characterized from both microscale (SEM) and macroscale (PSD, yield) points of view. Different operation parameters such as particle size, air temperature, coating solution viscosity and aerosol inlet position in the Wurster riser have an influence on product quality. The main conclusions are as follows:
Both conventionally large particles and smaller particles that are difficult to coat in conventional equipment can be coated without agglomeration in a Wurster fluidized bed with the help of an aerosol generator. The highest growth rate is observed at the beginning of the novel process. Over time, the growth rate decreases gradually until a quasi-steady state has been reached.
The temperature of the fluidizing gas has a significant impact on the quality of the coated product. A decrease in temperature may increase the agglomeration rate, while excessively high temperature will lower the use of coating solution and the coating rate. Moderate temperature can maintain reasonable yield and low agglomeration ratio.
Particle growth rate was observed to increase with the increase of coating solution viscosity. Higher viscosity aerosol is easier to adhere to the particles. Unfortunately, this is accompanied by the creation of compact and dense coating layers, which are more likely to break down due to collisions with other particles and walls in the Wurster fluidized bed. Equilibrium between coating layer growth and breakage may result in lower coverage when the solution viscosity is high, and in patchy product particles.
The position where coating aerosol is introduced into the fluidized bed has an impact on the use rate of the coating solution. When aerosol is fed close to the bottom distributor plate, it interacts with the particles in a dense zone of the equipment, hence the use rate is higher. Meanwhile, the agglomeration rate also slightly increases.
In summary, the use of very small aerosol droplets enables the coating of fine particles without severe agglomeration in a Wurster fluidized bed. This novel approach of potential interest for pharmaceutical, food, catalyst and other industries, where it may contribute to the development of new products based on coated fine particles.


