Article

Design and Fabrication of Partially Foamed Grid Structure Using Additive Manufacturing and Solid State Foaming

1
Research Institute of Advanced Materials, Seoul National University, Seoul 151-744, Korea
2
School of Mechanical and Aerospace Engineering, Seoul National University, Seoul 151-744, Korea
3
School of Chemical and Biological Engineering and Institute of Chemical Processes, Seoul National University, Seoul 151-744, Korea
*
Authors to whom correspondence should be addressed.
Processes 2020, 8(12), 1594; https://doi.org/10.3390/pr8121594
Submission received: 21 October 2020 / Revised: 1 December 2020 / Accepted: 1 December 2020 / Published: 3 December 2020
(This article belongs to the Special Issue Foam Matrix Composites: Preparation and Application)

Abstract

:
A partially foamed lattice structure based on synthetic polymers was considered as a functionally graded materials due to their unique properties. In this study, a copolymer is manufactured to be porous functional materials by physical foaming technology, using carbon dioxide. Through morphological characterization, using scanning electron microscope, we identified a potential to fabricate partially foamed structures with micropores. We showed that variation of post-foaming temperature can tune the pore size distribution in the range of 0.9 to 30 μm. Thermal data of the foam grid from differential scanning calorimeter showed some shifts in glass transition, cold crystallization, and melting points. Mechanical strength and thermal conductivity were also measured to find rationale of thermal insulation with tunable mechanical strength and to elucidate the actual 3D lattice foam of a copolymer.

1. Introduction

Polymer foams have wide applications due to their light weight, resistance to impact, high thermal insulation, and damping properties. Construction, automotive, aerospace, packaging, electronics, and medical industries are the main users of the material [1,2,3,4,5,6]. It was initially developed as a means to reduce costs and the amount of plastic polystyrene used in manufacturing processes [3], and much progress has been made ever since: Polymer foams are now expanding their usage as high strength-to-weight ratio and functional materials.
The basic foaming methodology involves dissolving blowing agents in polymers at a high pressure and then depressurizing to bring about phase separation to induce nucleation and cell growth, ultimately leading to the formation of porous structures. In particular, the physical foaming based on the carbon dioxide (CO2) has broad application area, owing to its behavior as sub- and/or super-critical fluids, and the use of CO2 as an environmentally benign foaming agent has been under intense investigation. To name a few, there are the foaming of glassy or semi-crystalline polymers with CO2 for the formation of porous structures via phase inversion [7], or multiscale porous structures for insulation applications [8,9]. The plasticization of the polymer brought about by the dissolved blowing agent is a valuable processing aid [10]. Solid-state foaming is a process in which foaming occurs while the polymer remains in the solid state throughout the entire process. This is different from conventional polymer foaming processes where the polymer is heated to molten state. Solid-state foaming with both sub- and super-critical CO2 has been investigated as a blowing agent for the amorphous ABS copolymer materials [11]. The advantage is that the dissolution and foaming steps can be controlled independently. The liquid CO2 can also be used to achieve a high solubility of foaming agents in polymers. Recently, a two-step foaming process has been reported, using liquid CO2 in batches at extremely high pressures [12,13].
Rapid prototyping, or additive manufacturing technology, has boomed and demonstrated advantages in 3D complex structure, especially objects with high surface area, mesh, and cavity, compared with injection molding products. Integrated additive manufacturing and solid state foaming technique was applied to increase functionality, cell density, and porosity for fundamental and biomedical applications [9,14]. Recently, a copolymer (Polyethylene Terephthalate–Polyethylene Naphthalate, PET–PEN) for additive manufacturing has emerged as an environmentally benign material, for kitchen and decoration applications. Vacuum insulation panels (VIPs) are promising future thermal insulators for their outstanding insulation performance [15]. The thermal conductivity of the core material in VIPs depends on the external pressing load. Because the filled core material of typical VIPs functions as a supporting structure to the atmospheric compression, to name a few, polycarbonate staggered beam and pillar supports have been used as an alternative to typical filler materials like glass wool, fumed silica, polyurethane foam, and phenolic foam [16,17].
As the core material of VIP, a copolymer lattice with low thermal conductivity and high mechanical strength can be used [18]. The purpose of this paper is to characterize the thermal and mechanical properties and provide data for a 3D grid covered with gradient foam, which is an alternative geometry for core material in vacuum insulation panels. These are useful for the design and fabrication of other complex polymeric foam structures, which have tunable strength and functionality in diverse applications.

2. Experimental Apparatus and Method

2.1. Material and Foaming Process

While the ultimate goal of current study is to fabricate arbitrary 3D structures with controlled thermal and mechanical properties by additive manufacturing combined with physical foaming process, using CO2, the physical foaming process was separately tested mainly by using the base filaments for additive manufacturing. The diameter of cylindrical filament is usually around 1.75 mm, larger than the depths of CO2 penetration under current experimental conditions. Therefore, the ribs in the 3D grid structure would be approximated to the filaments by adopting the characteristic length, L c , widely used in analyzing transport phenomena. This simplification is not only useful for approximating the sorption/foaming behavior but also for providing guidelines on the additive manufacturing parameters. In this study, we examine the physical CO2 foaming of the PET–PEN (9:1) copolymer filaments (Kolon Plastics, Kimchun, Korea, true density of 1.33 g/cm3) with a diameter of 1.75 mm, a nontoxic and environmentally friendly material. Copolymer material selection was also carried out considering the possibility of nanopores’ creation [4,8].
Detailed foaming procedures were found from the previous publications [9,11]. Briefly, liquid CO2 (99.95%, Hyupshin Gas Industry, Seoul, Republic of Korea) maintained at 5 MPa and 20 °C was supplied to a pressure vessel containing samples, and compressed to 10 MPa. Then, the pressure vessel was immersed in a cold ethanol/water bath maintained at a temperature of −20 °C and a pressure of 10 MPa during the sorption process by continuous pumping under automatic pressure regulation. Various sorption times were applied from 4 to 336 h to trace the sorption kinetics. After the pressure vessel was depressurized abruptly at ~100 MPa/s, samples were taken out from the vessel and immersed into a bath set at designated foaming temperatures of Tf for 3 min. Quenching is performed in the ethanol/water mixture at −20 °C for 1 min, to freeze any further cell or pore growth. The foaming temperature, Tf, was varied from 20 to 100 °C to observe for its dependence on the foaming trend. In order to prevent the distortion of outer shape during the post-foaming, a jig for holding the sample was made by additive manufacturing. Finally, samples were wiped out to remove the residual ethanol/water mixture and dried at room temperature. A gravimetric method was used to measure the sorption kinetics and the amount of CO2 absorbed; weighed on a scale (EPG214, Ohaus, Pine Brook, NJ, USA) before and after each sorption process.

2.2. Measurements

In order to understand the resulting cross-sectional structure, samples were cryo-fractured, using liquid nitrogen, and the cut surface was sputter-coated with platinum of ~15 nm thickness. Then, the samples were observed with a field emission scanning electron microscope (FEM–SEM, SUPRA 55VP model). The bulk density, ρ f o a m , was measured by the weight displacement method [11]. The samples were first weighed on an analytical scale (EPG 214, Ohaus), and the volume of water displaced by the sample was then measured. The relative density, ρ r , can be calculated by using the following formula:
  ρ r = ρ f o a m ρ s ,
where ρ s denotes the density of solid copolymer (1.33 g/cm3). In order to find the characteristics of foams, the pore size distribution has measured from the SEM images and analyzed by using the ImageJ (NIH) and MorphoLibJ package libraries. The effective pore diameters were calculated from the measured cross-sectional areas, based on the formula d p o r e = ( 4 A / π ) , assuming circular pores, where A is the cross-sectional area, and d p o r e is the effective diameter. The cell nucleation density, N 0 , i.e., the number of cells per unit volume of the foam, can be estimated from the following correlations [12];
N 0 = ( n A ) 3 / 2 ( 1 ρ r ) ,
where n is number of cells in the probe volume, and A is probe area.
For thermal characterization, two-cycle tests were performed for as-foamed samples, using differential scanning calorimetry (Model Discovery, TA Instrument) based on the ASTM (American Society for Testing and Materials) standard (D3417-83, D3418-82). In order to estimate a degree of crystallinity, the following equation was used.
Degree of Crystallinity = (∆Hm − ∆Hc)/∆Hm,max,
where ∆Hm is the measured heat of fusion and ∆Hc is the heat of crystallization. Assuming an enthalpy of fusion 140.0 J/g for a 100% crystalline copolymers with infinite crystal thickness (i.e., ∆Hm,max = 140.0 J/g taken here). In order to investigate further the weight ratio of organic components and the thermal stability at high temperature, the degree of thermal decomposition was measured, using an SDT analyzer (simultaneous differential scanning calorimeter and thermo-gravimetric analysis, Universal V4.5A model, TA Instruments). The derivative weights of specimens were measured for the temperature range of 30–600 °C, with heating rate of 10 °C/min, under nitrogen atmosphere.
Compression tests were performed to evaluate the mechanical properties of the fabricated structures. A universal material testing machine (UTM, LR 50K model, LLOYD Instruments, West Sussex, UK) was used for mechanical strength measurement, and at least four specimens were prepared for each experimental group. The crosshead speed was set based on the ASTM standard (ASTM D695).
Thermal conductivity was measured to estimate the thermal insulation performance. For the thermal property measurements, the transient plane source method (Hot Disk Thermal Constants Analyzer, TPS3500, Göteborg, Sweden), based on ISO standard (ISO 22007-2:2015), was used for two equivalent specimens prepared.

3. Results and Discussion

3.1. Sorption Kinetics and Microstructural Characteristics

Sorption tests were conducted to find the saturation time of the copolymer filament. It has found that the estimated saturation time is around 20 days, as shown in Supplementary Materials Figure S1. This means that, in this study, based on partial sorption process by a fixed time of 24 h, the experimental error due to the concentration change is small during a short time delay of less than 1 min from immediately after decompression to the start of the foaming process. It facilitated the formation of gradient foam in the copolymer.
Figure 1 shows typical photographs before and after the post-foaming of typical 3D-printed structures. Figure 1c is a fractured cross-sectional view and shows simple regular 3D structures with well-foamed ribs, while the post-foaming did not change significantly the overall shape at post-foaming temperature of Tf = 60 °C.
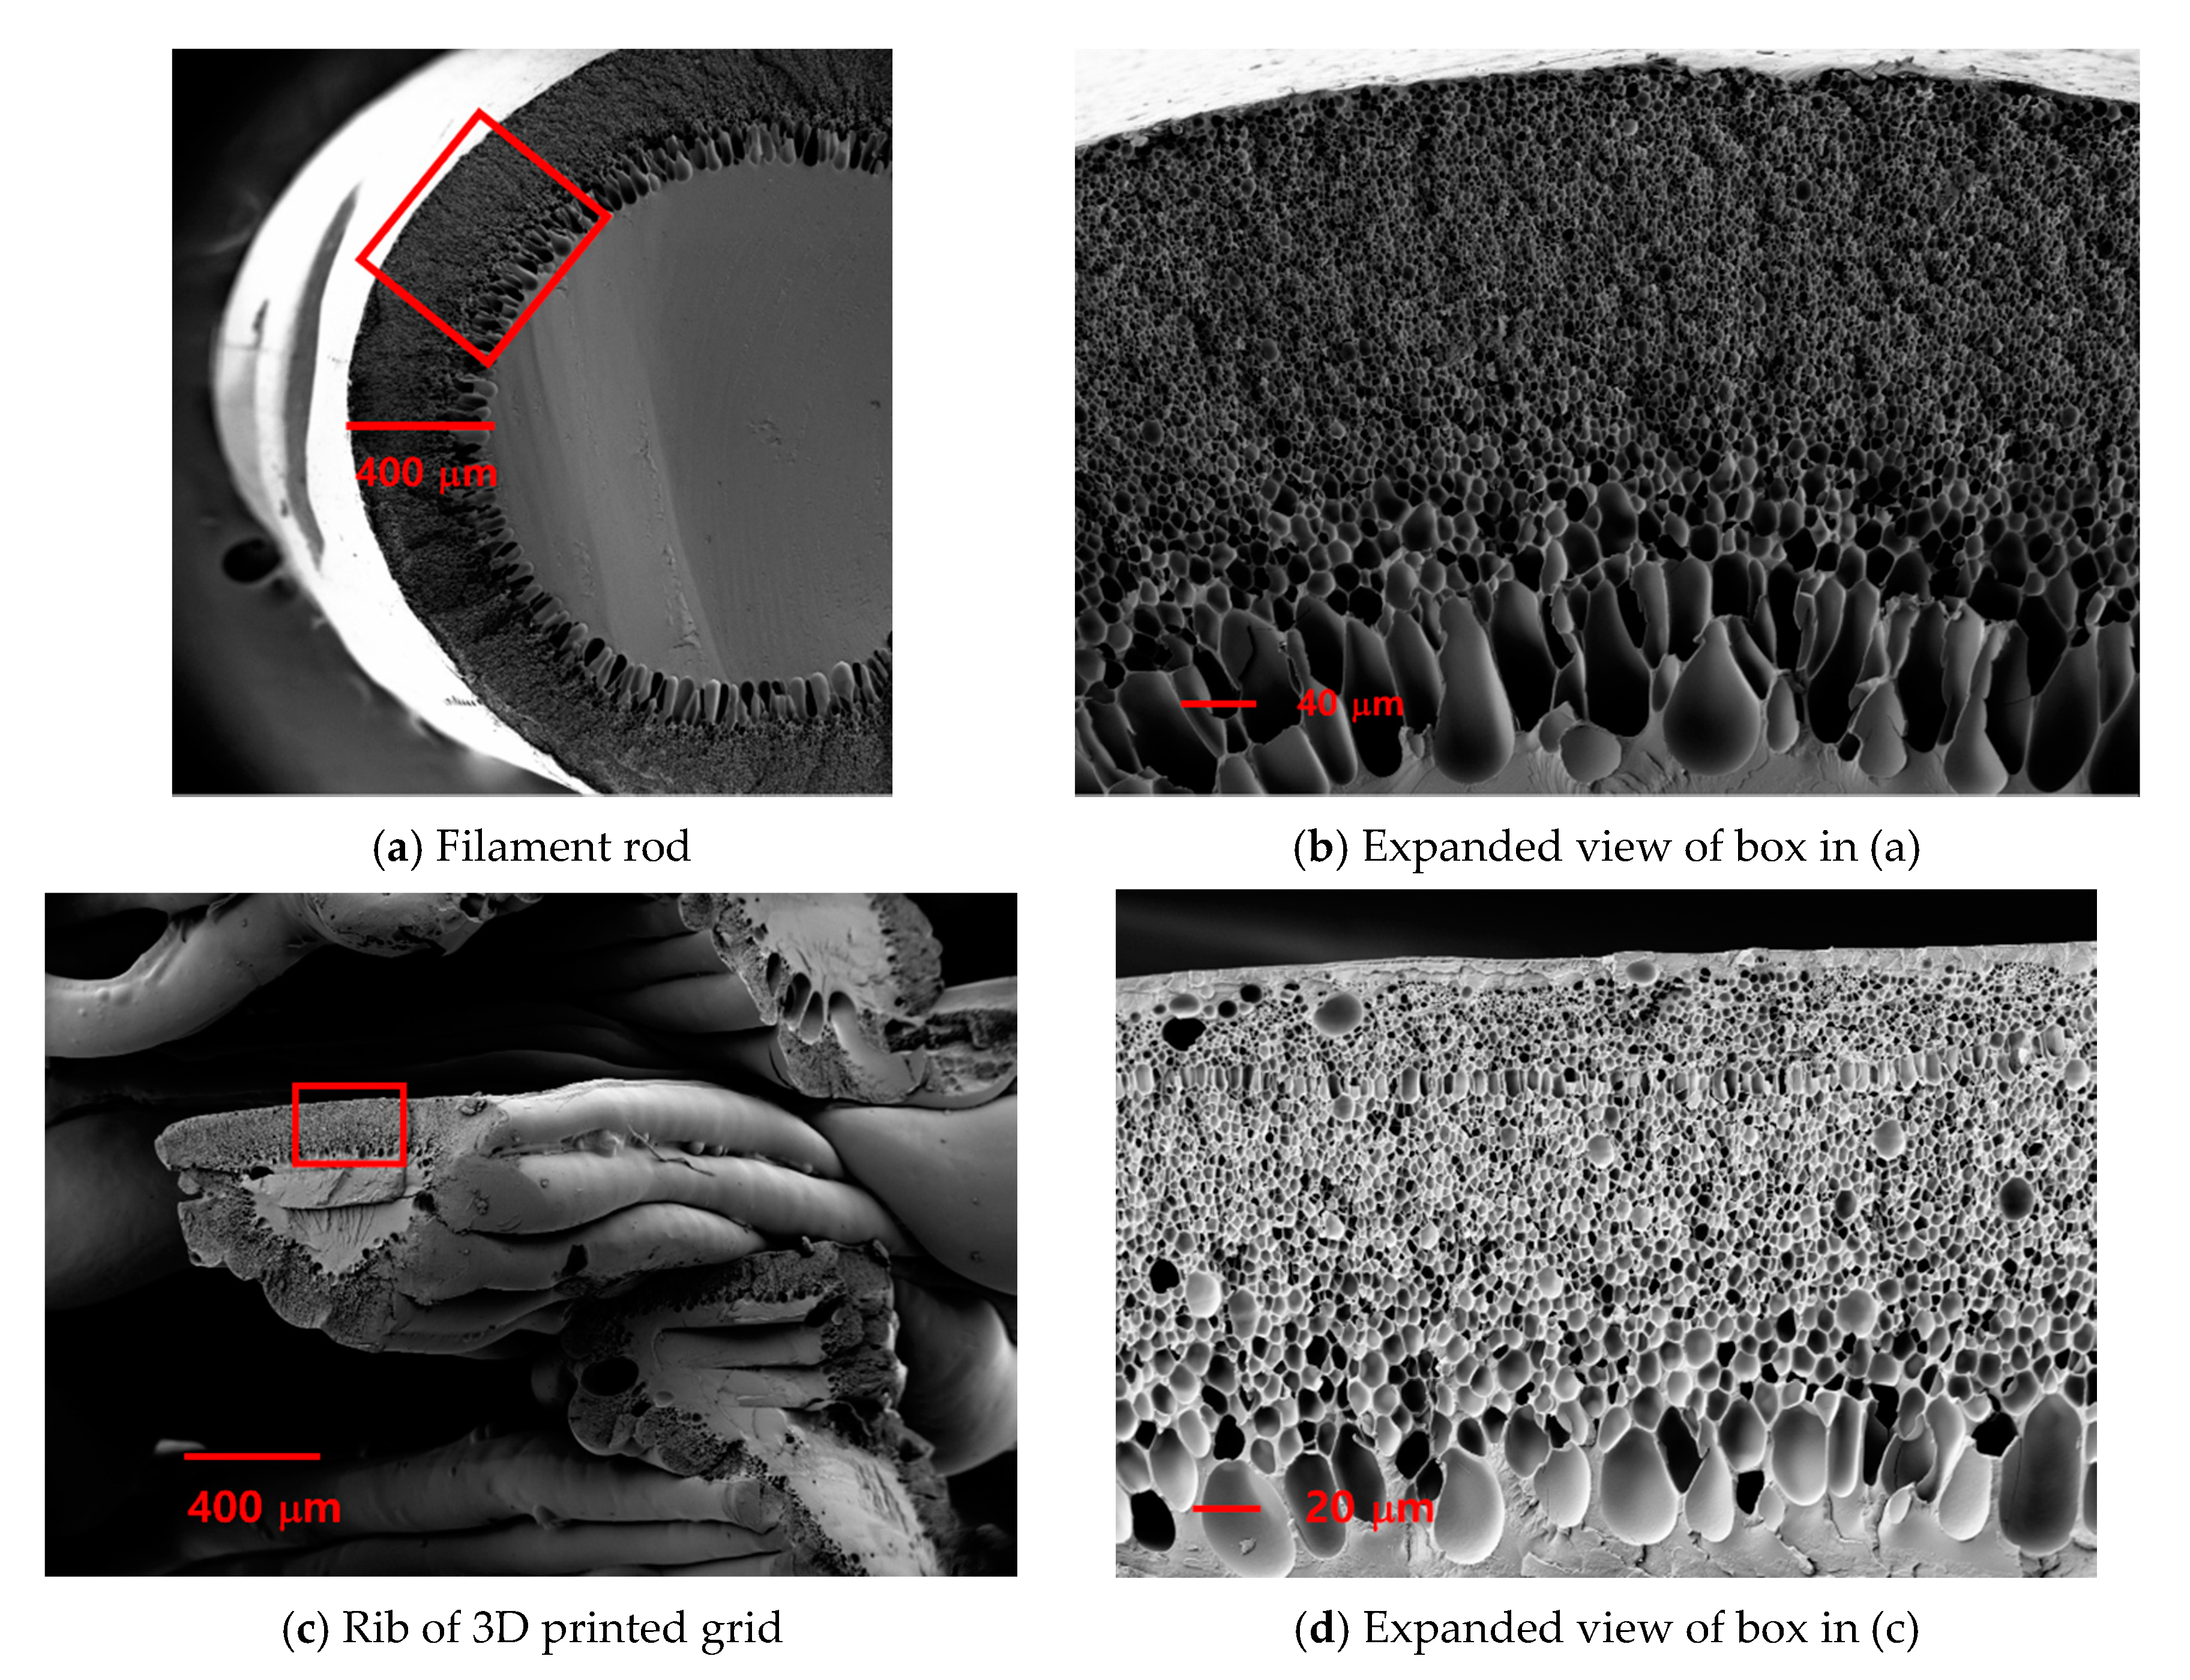
Figure 2 shows the cross-sectional SEM images for cylindrical rod and rib in the 3D structure. Figure 2b,d shows expanded views of the boxes in Figure 2a,c, respectively. The overall configuration of actual foamed 3D grid in Figure 2c is very complex compared to that of cylindrical filament rod. However, the zoomed-in images for the foamed region show more detailed shapes. Note that the SEM images shown are almost similar in morphology and feature a gradient foam except between the manufacturing layers. Therefore, as a fundamental investigation of the gradient foam, we could have assumed that the filament of cylindrical rod as a substitute object for actual rib member inside 3D-printed structure. It is seen that partial CO2 sorption under current experimental conditions induced gradient foaming along radial direction of the cylindrical copolymer filaments. In general, the penetration depth in partial sorption will depend on the pressure, temperature, and sorption time. After a quick pressure relief, the CO2 in the saturated sample becomes unstable and tends to foam. Thus, the concentration gradient and temperature distribution induce a foam gradient. The CO2 concentration at the filament surface will be quite high just before depressurization. However, on depressurizing, it decreases rapidly in the outer region, and the temperature of environmental gas surrounding polymer will change due to the Joule–Thomson effect (temperature reduction that accompanies depressurization). It causes reduction in ductility as CO2 leaves the copolymer matrix, making the diffusion process will be suppressed. Although the residual CO2 in the penetration depth of filaments is apt to diffuse the subsequent post-foaming process, on the contrary, it tends to incur the distribution of gradual pore sizes. Finally, the cells of gradient foam were obtained through the interactions of several parameters. In short, it can be seen that the gradient foam characteristics of the filament rod shown in Figure 2a, i.e., the foaming depth and pore size distribution, are similar in the 3D-printed structures shown in Figure 2c. Moreover, they can be estimated with correction parameters in design and fabrication of arbitrary freeform foam by additive manufacturing and physical foaming processes, using CO2, by adopting the “specified” characteristic length.
The effects of post-foaming temperature on the pore characterization are represented in Figure 3. The cell nucleation density, ρ r , gradually increases up to the post-foaming temperature of 80 °C, but abruptly increases at 100 °C; that is higher than the glass transition temperature of the copolymer. The number-averaged pore diameter, d p o r e , obtained from image analysis increases very slowly as 3.08 m, 3.12 m, 3.99 m, 4.57 m, and 5.26 m, respectively, as T f increases from 20, 40, 60, 80, to 100 °C, respectively. Although we might have expected a very small fraction of sub-micron pores from further high-resolution SEM images [12], we have estimated the pore size distributions from the SEM images. The relative density, ρ r , gradually reduced up to the post-foaming temperature of 80 °C, but largely decreased at 100 °C, due to asymmetric big pores near the inner boundary.

3.2. Calorimetric and Pyrolysis Analyses

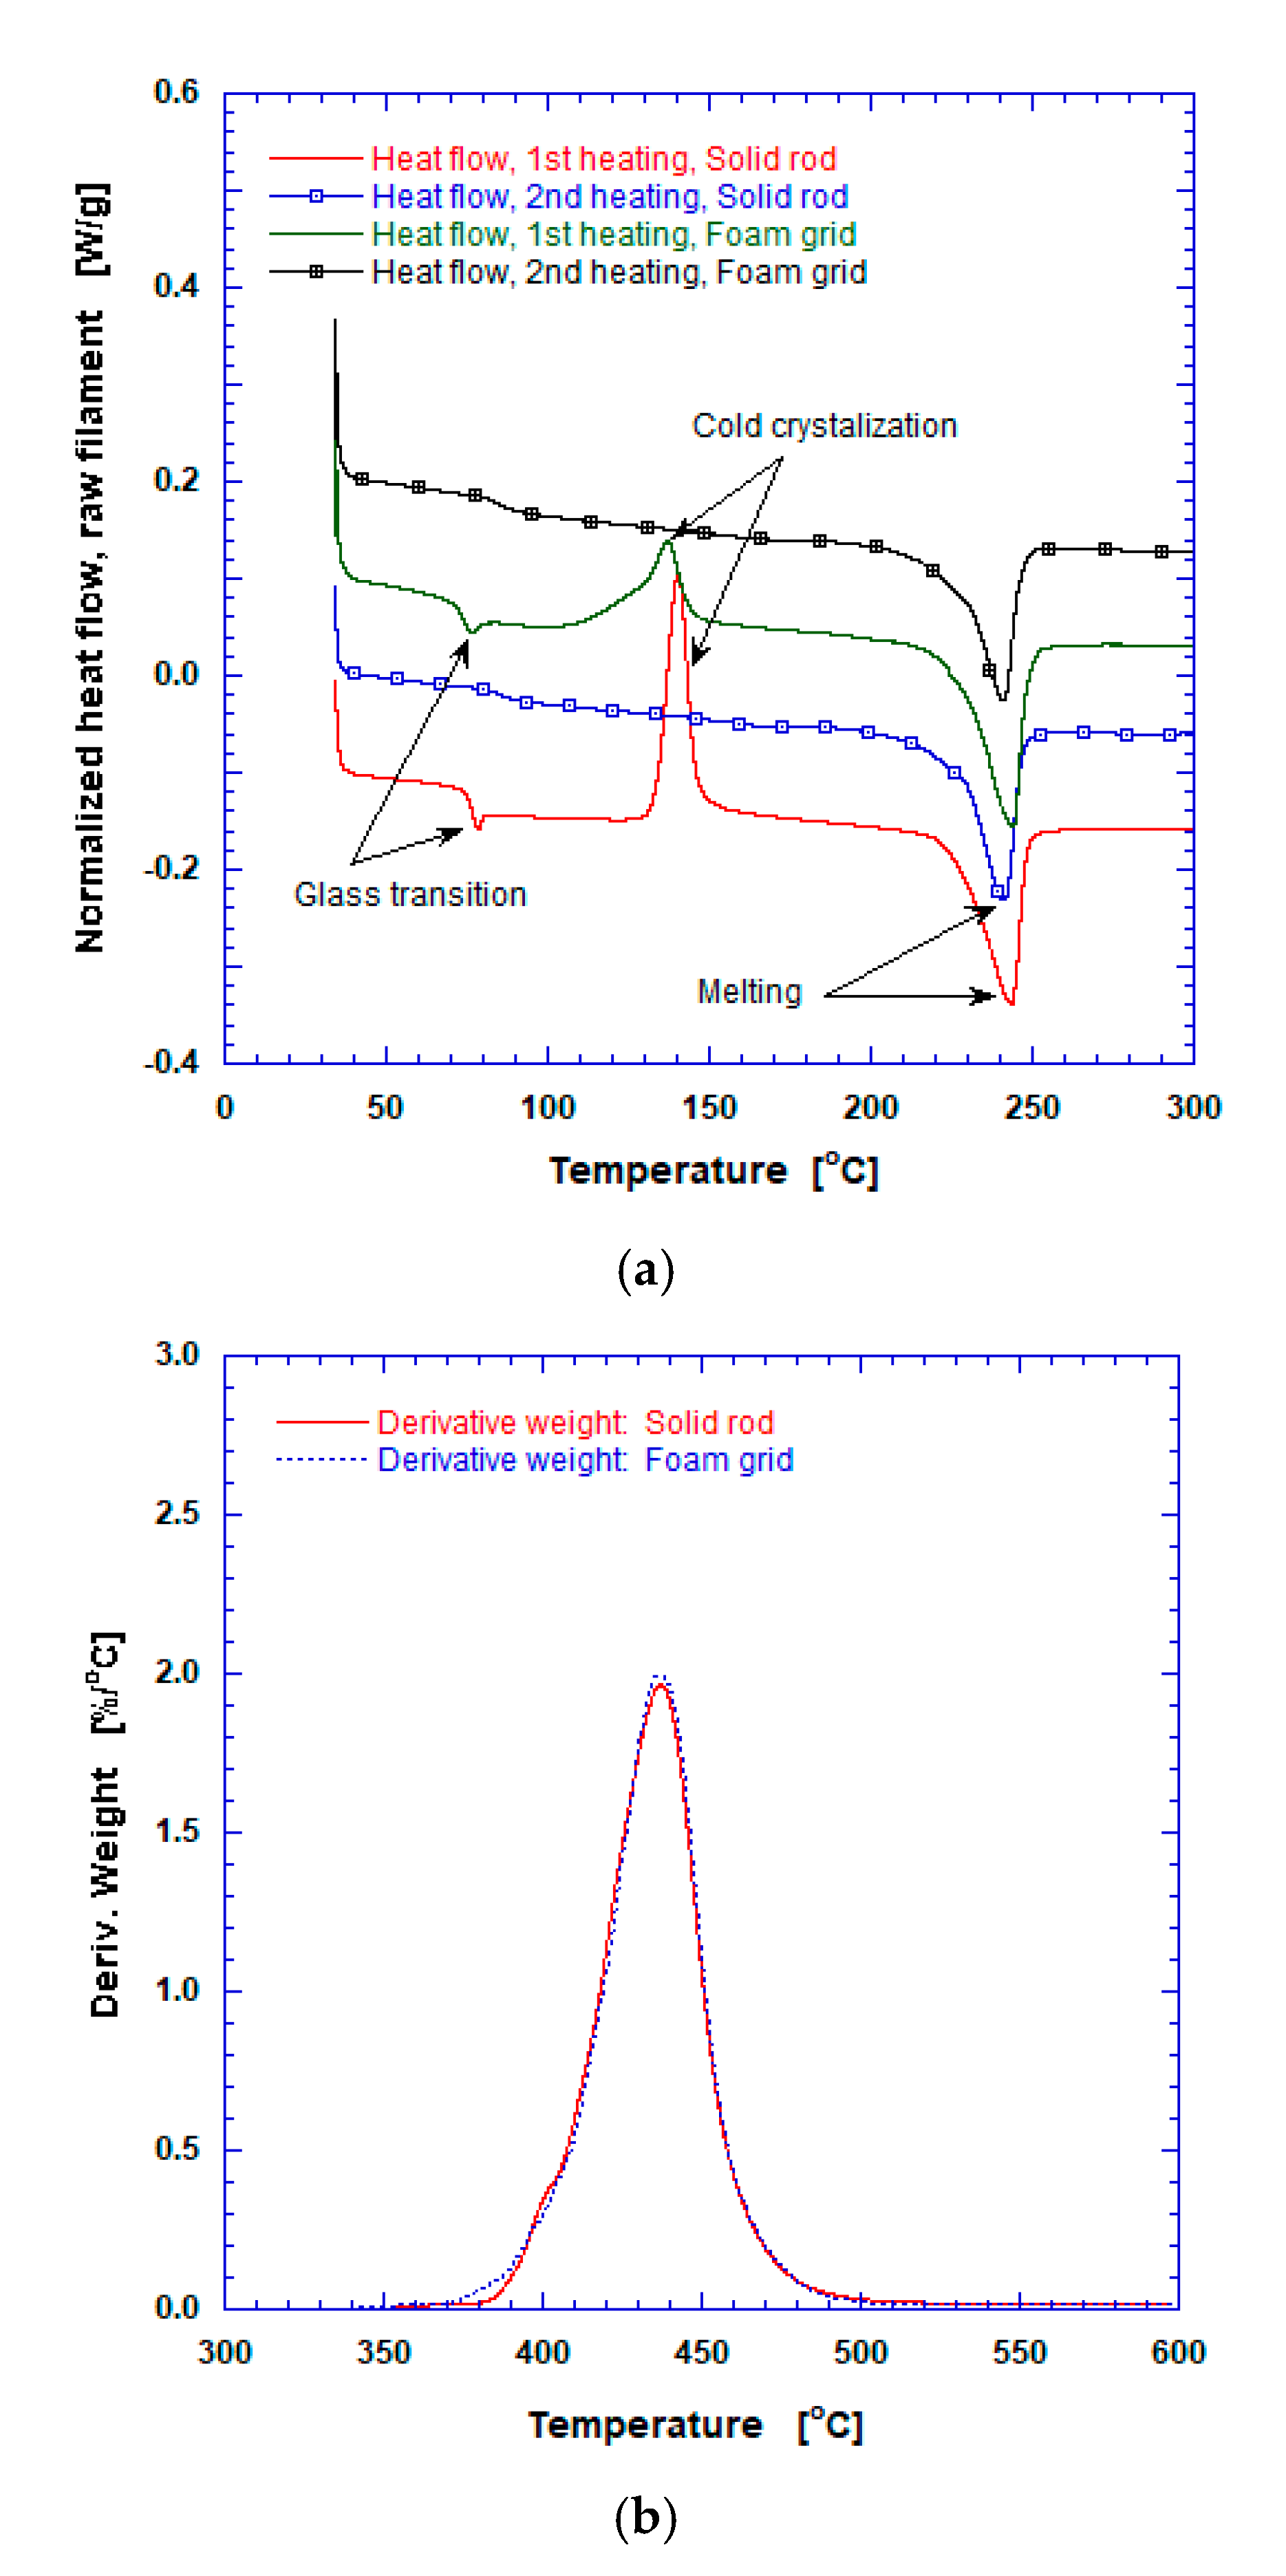
Thermal analyses were performed for both pristine solid rod and foamed grid structure as shown in the left of Figure 4a (temperature range from 34 up to 300 °C). Two-cycle tests were conducted to investigate the detailed states of the copolymer, i.e., for experimental measurements of glass transition temperatures for the first and second cycles, using differential scanning calorimetry. The analysis was performed in a nitrogen environment. The sample of 3–5 mg in weight was used. The first cycle was completed by first heating the sample from 34 to 300 °C, at a rate of 5 °C/min, holding it at 300 °C for 60 min, and then cooling to 34 °C at the same rate. Moreover, the second cycle was repeated in an identical manner after sufficiently stabilized condition.
During heating of the solid sample, as seen from Figure 4a, the initial glass transition took place at 75.9 °C. The crystalline melting process shows an endothermic peak at 241.4 °C. The thermal transitions observed at temperature peak of 140.5 °C is related to cold crystallization, of which endothermic energy is 28.61 J/g. The cold crystallization was caused by the rearrangement of molecular chains in the crystalline copolymer layer. It was supported by increased mobility during the manufacturing and heating processes. From the thermo-grams, the first and second exothermic peak energies were obtained as 3.56 and 32.17 J/g, respectively. The degree of crystallinity was observed to increase from 2.5 to 9.0%. During the cooling process (not shown in Figure 4) in the first cycle, exothermic energy of 33.1 J/g, with the peak center at 169.5 °C, was due to cooling crystallization of the copolymer. In the second cycle, two characteristic features found in the innovative bead foam in PLA [19] were not observed in this copolymer, i.e., neither the exothermic peak due to cold crystallization nor double melting peaks appeared eminently. On the other hand, the foamed grid samples with gradient foam show clear difference in the first heating stage in that lower cold crystallization occurred due to rearrangement of molecular chains by the solid-state foaming process and lower crystalline peak. By the second heating, for both solid and foamed samples, there were no glass transition and cold crystallization. Pyrolysis measurements were performed by using an SDT (simultaneous DSC/TGA (differential scanning calorimetery/thermos-gravimeteric analysis)) analyzer for non-foamed solid filament rod and foamed 3D grid structure. From the pyrolysis curve shown in Figure 4b, we see that the copolymer starts to evaporate near 360 °C and has maximum weight loss rate at 437.1 °C (~2.0 wt.%/°C). A major pyrolysis event takes place between 380 and 520 °C, where most of latent heat of evaporation is consumed. The thermal decomposition rate of filament material increases rapidly, to above about 380 °C, resulting in a large loss of mass, so the upper limit of operating temperature for 3D-printed lattices, using the filament, should be set sufficiently lower than 380 °C. In this study, the nozzle temperature for fabricating 3D grid structure was 270 °C. There were also no significant differences between solid rod and foamed grid structure, except for initial melting.

3.3. Mechanical Compressive Stress

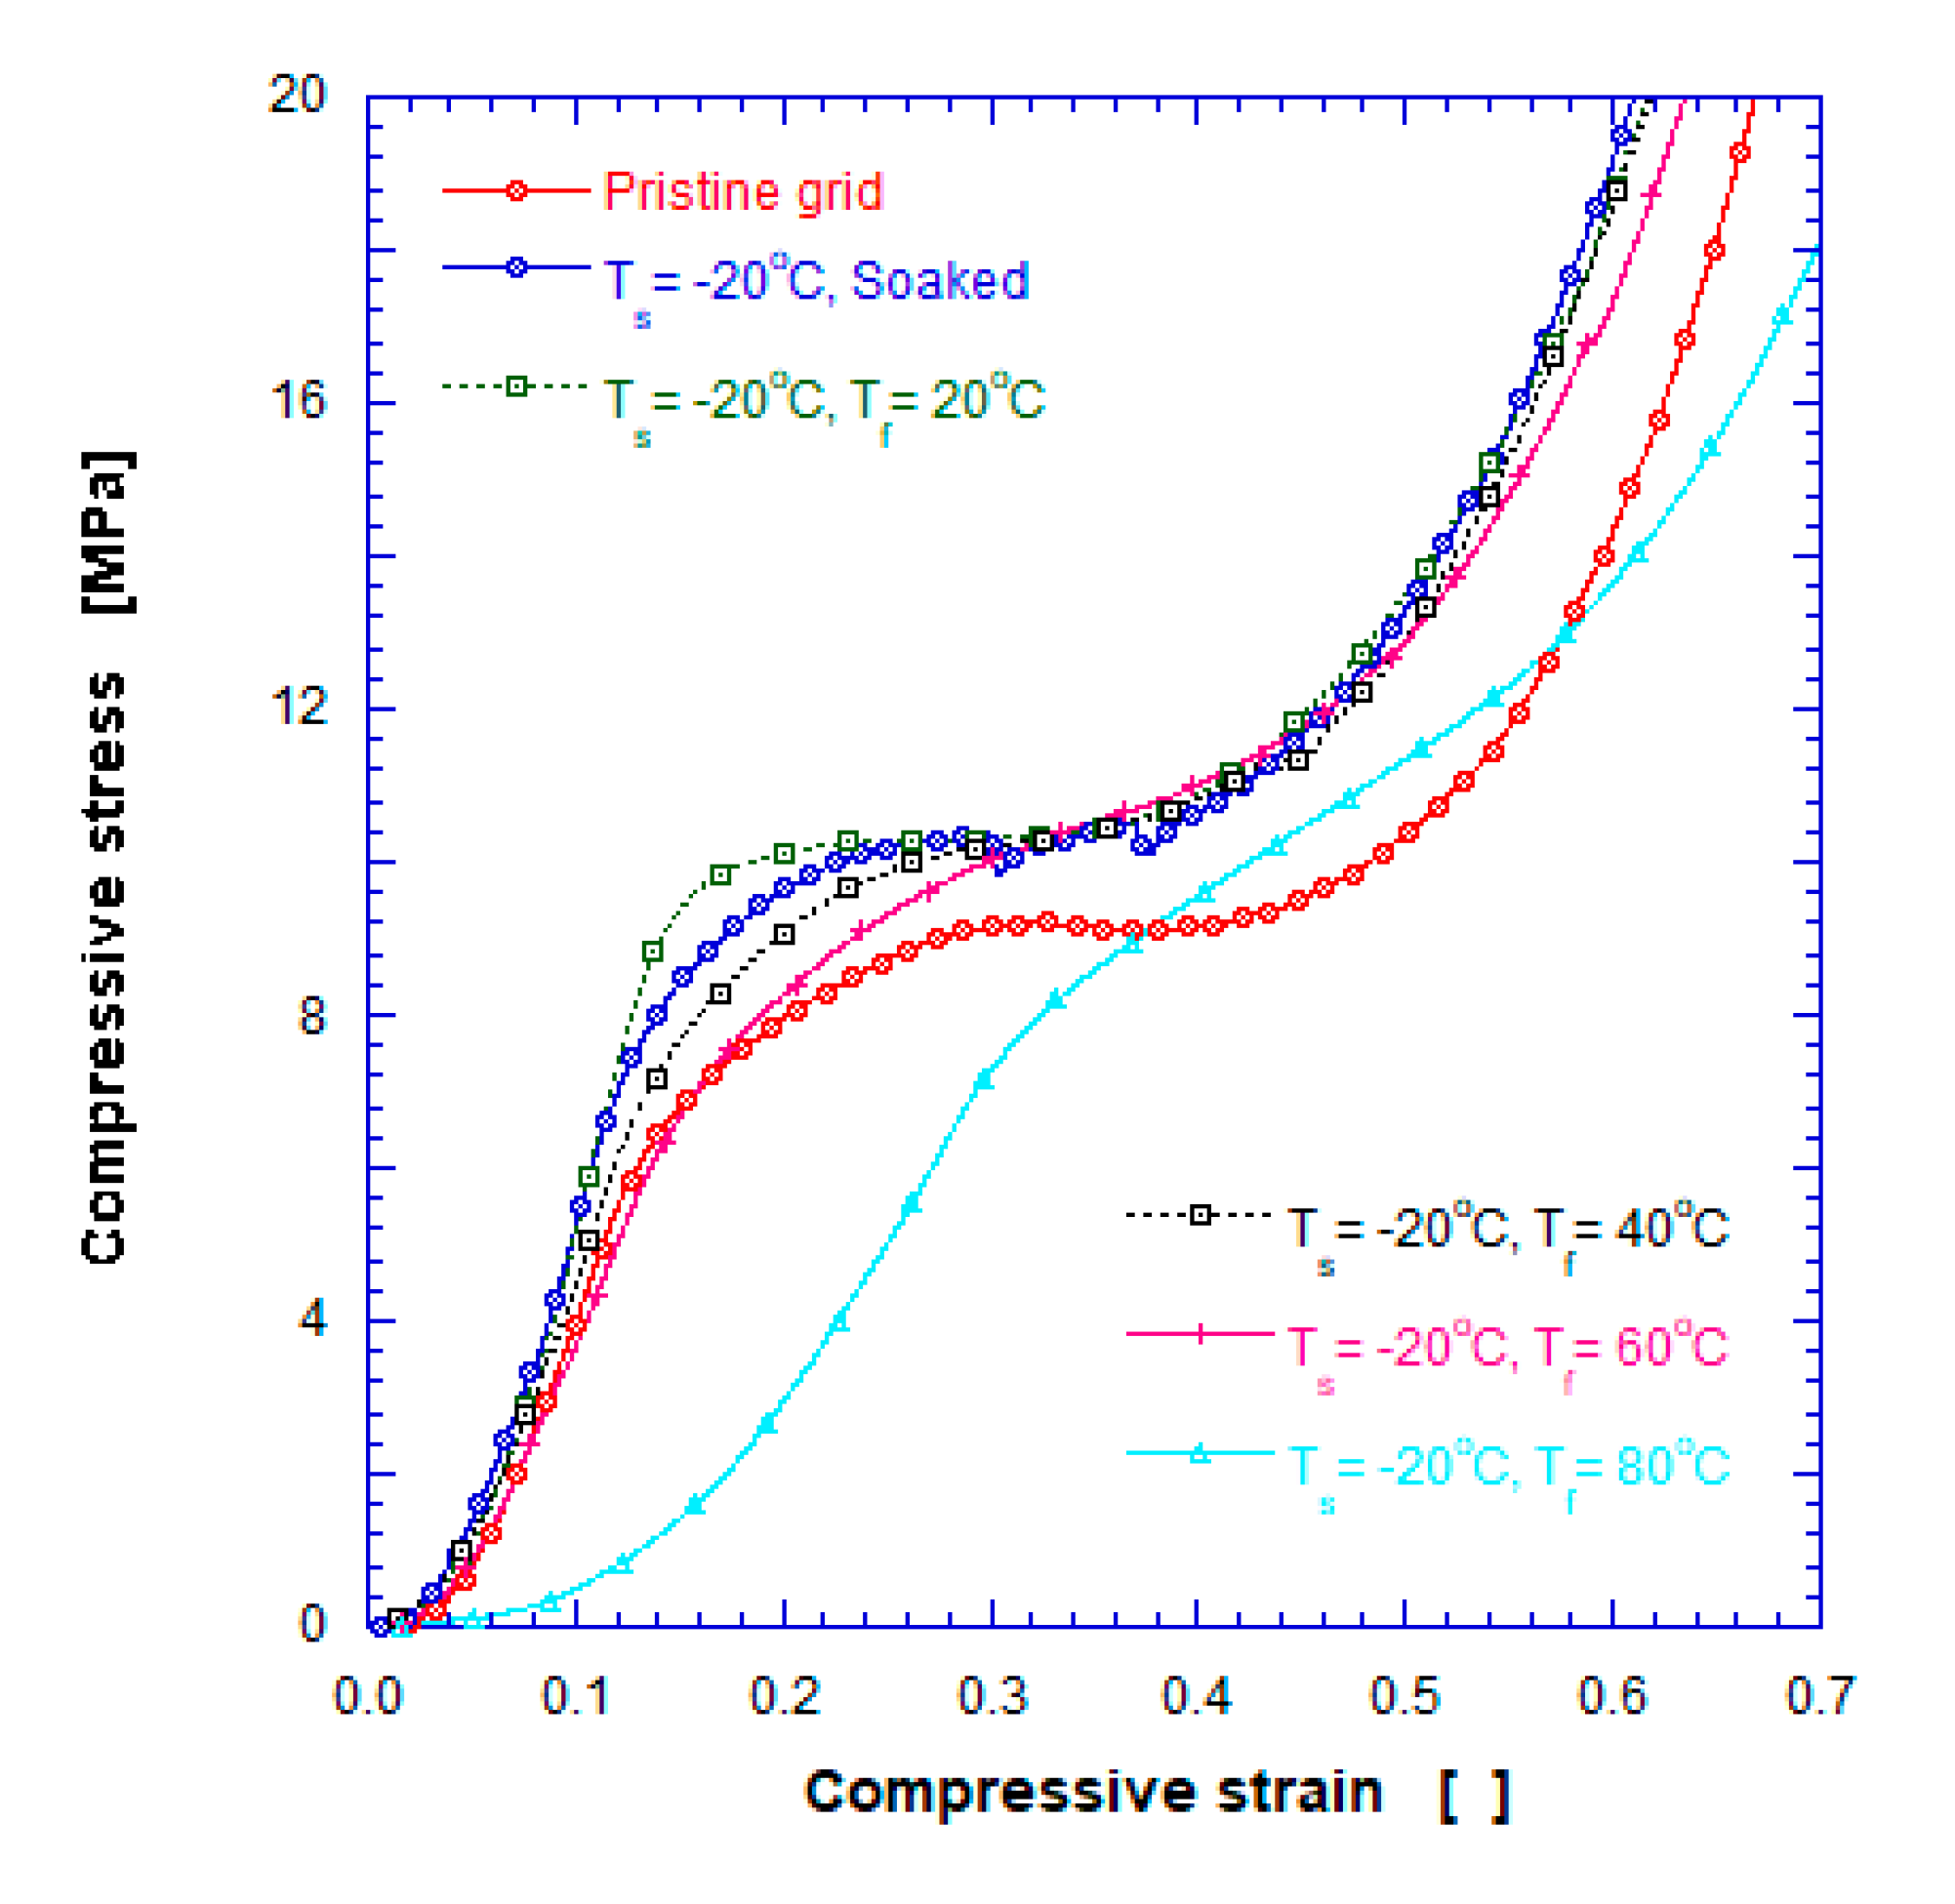
It is important to understand the mechanical properties of 3D lattices fabricated by additive manufacturing and physical CO2 foaming technologies. Figure 5 shows typical results of the compression test obtained in this study. You can see the compression strength is higher than that of insulation foams. The main reasons for increased mechanical strength is the 3D-printed solid structure of the crystalline copolymer due to soaking, which has a relatively strong force between melt-bonding layers. The pristine specimen before compression test has the dimension of 36.0 × 36.0 × 5.4 mm3. The maximum compressive deflection was limited to 4.0 mm, to protect the measuring equipment from overload during compression. In the compression test, the freeform specimens showed linear elastic behavior in the compressive strain range of 0.04 to 0.12 and a flat region with nearly constant compressive stress in the strain range of 0.22 to 0.40 mm/mm. Since the spaces between the polymer matrix ribs can withstand the high strain that maintains the connection, the specimen did not rupture until strain reached about 40% during compression.
It was observed that the elastic modulus increases as the post-foaming temperature increases. The maximum compressive stress increased by about 13.5%, from 9.20 to 10.44 MPa. The compressive modulus of elasticity is 75.06 and 98.56 MPa for the pristine and soaked samples. It is also 108.09, 77.87, 61.55, and 47.09 MPa at the post-foaming temperature of 20, 40, 60, and 80 °C, respectively. Note that the 3D foamed grid structure can be adopted as a core material in VIPs because the compressive strain or deformation due to atmospheric pressure is less than 5% except for the Tf of 100 °C from Figure 5. It was not found that the formation of the nanoscale structure did, but it may be possible by adjusting foaming conditions. Further study on the mechanisms of the cell size and void distribution control is under way.

3.4. Thermal Conductivity

Various thermal insulation systems taking advantage of different types of thermal insulation materials on both organic and inorganic bases are being designed and tested, and new methods for analyzing the properties of insulation material and system are being devised. In order to increase the thermal insulation performance in a vacuum insulation system, voids were formed around the outer surface of the core material. Even though thermal conductivity is a very important property in heat transfer, it is rare for gradient foam. Therefore, we measured it between two equivalent samples, like Figure 1, not in vacuum but at atmosphere, using the transient plane source method [20,21].
The effects of average thermal conductivity and heat capacity on post-foaming temperature are shown in Figure 6. It was found that thermal conductivity decreases quite slowly as the post-foaming temperature increases and has around 0.06~0.08 W/m∙K in the range of this study. The slow decrease in thermal conductivity is considered to occur mainly due to the un-foamed skin thickness. In the post-foaming temperature of 100 °C, there is a significant decrease in thermal conductivity, due to porosity increase by big pores near the outer edge of central solid copolymer. The heat capacity also decreased with the post-foaming temperature. Further results for thermal insulation performance of the 3D grid structures will be evaluated in future studies.

4. Conclusions

In this study, we fabricated a micro-porous structure, using additive manufacturing with copolymer and solid-state foaming technologies. Following a morphological investigation, we identified a potential to fabricate macroscale gradient foam structures with micropores, since they have suitable qualities for functioning as thermal insulation material with tunable mechanical strength. Variation of post-foaming temperature could tune the pore size distribution in the range of 0.9 to 30 μm, and, possibly, the post-foaming temperature higher than the glass transition temperature could ameliorate thermal insulation performance. For the 3D grid structure, it was found that the compressive strength can withstand about 4 MPa at a strain of 0.1. It was confirmed that samples made by using additive manufacturing and solid-state foaming can be used as a core material for VIPs that must withstand external atmospheric pressure. We found that the compressive stress of CO2-soaked samples increased higher than that of pristine. From the measurements using transient plane source method, it was found that the thermal conductivity decreases as the post-foaming temperature increases, having around 0.06~0.08 W/m∙K at atmosphere in the range of this study. Through the study’s results, we demonstrated freeform foam structures for better thermal insulation with tunable mechanical strength for vacuum insulation.

Supplementary Materials

The following are available online at https://www.mdpi.com/2227-9717/8/12/1594/s1. Figure S1: CO2 Sorption kinetics in the copolymer considered [22].

Author Contributions

Conceptualization, B.K.P. and Y.-W.L.; methodology, B.K.P.; validation, D.E.K. and B.K.P.; formal analysis, D.E.K.; investigation, D.E.K.; data curation, B.K.P. and Y.-W.L.; writing—original draft, B.K.P.; writing—review and editing, D.E.K. and C.-J.K.; supervision, Y.-W.L.; project administration, B.K.P. and C.-J.K.; funding acquisition, B.K.P. All authors have read and agreed to the published version of the manuscript.

Funding

This research has supported by Grant (NRF-2018R1A2B2008196) from National Research Foundation of Korea funded by Ministry of Science and ICT of Korea government.

Conflicts of Interest

The authors declare that there is no conflict of interests regarding the publication of this paper.

References

  1. Lee, S.T. Polymeric Foams: Innovations in Process, Technologies and Products; CRC Press: Boca Raton, FL, USA, 2017. [Google Scholar]
  2. Maio, E.D.; Kiran, E. Foaming of polymers with supercritical fluids and perspectives on the current knowledge gaps and challenges. J. Supercrit. Fluids 2018, 134, 157–166. [Google Scholar] [CrossRef]
  3. Martini, J.E.; Waldman, F.A.; Suh, N.P. The Production and analysis of microcellular thermoplastic foams. SPE Tech. Pap. 1982, 28, 674. [Google Scholar]
  4. Guo, H.; Kumar, V. Some thermodynamic and kinetic low-temperature properties of the PC-CO2 system and morphological characteristics of solid-state PC nanofoams produced with liquid CO2. Polymer 2015, 56, 46–56. [Google Scholar] [CrossRef]
  5. Xia, T.; Xi, Z.; Tao Liu, T.; Zhao, L. Solid state foaming of poly(ethylene terephthalate) based on periodical CO2-renewing sorption process. Chem. Eng. Sci. 2017, 168, 124–136. [Google Scholar] [CrossRef]
  6. Yu, J.; Song, L.; Chen, F.; Fan, P.; Sun, L.; Zhong, M.; Yang, J. Preparation of polymer foams with a gradient of cell size: Further exploring the nucleation effect of porous inorganic materials in polymer foaming. Mater. Today Commun. 2016, 9, 1–6. [Google Scholar] [CrossRef]
  7. Kiran, E. Morphological modifications and formation of morphologically-gradient polymers in dense fluids. In Proceedings of the 5th International Symposium on High Pressure Process Technology and Chemical Engineering, Segovia, Spain, 24–27 June 2007; pp. 1–10. [Google Scholar]
  8. Forest, C.; Chaumont, P.; Cassagnaua, P.; Swoboda, B.; Sonntag, P. Polymer nano-foams for insulating applications prepared from CO2 foaming. Prog. Polym. Sci. 2015, 39, 1721–1741. [Google Scholar] [CrossRef]
  9. Park, B.K.; Hwang, D.J.; Kwon, D.E.; Yoon, T.J.; Lee, Y.-W. Fabrication and Characterization of Multiscale PLA Structures Using Integrated Rapid Prototyping and Gas Foaming Technologies. Nanomaterials 2018, 8, 575. [Google Scholar] [CrossRef] [Green Version]
  10. Zhou, C.; Wang, P.; Li, W. Fabrication of functionally graded porous polymer via supercritical carbon dioxide foaming. Compos. Part B 2011, 42, 318–325. [Google Scholar] [CrossRef]
  11. Yoon, T.J.; Kong, W.; Kwon, D.E.; Park, B.K.; Lee, Y.-W. Preparation of solid-state micro- and nanocellular acrylonitrile-butadiene-styrene (ABS) foams using sub- and supercritical CO2 as blowing agents. J. Supercrit. Fluids 2017, 124, 30–37. [Google Scholar] [CrossRef]
  12. Ono, T.; Wu, X.; Horiuchi, S.; Furuya, T.; Yoda, T. Two-step foaming process for production of PMMA nanocellular polymer foams via ultra-high pressure and rapid depressurization. J. Supercrit. Fluids 2020, 165, 104963. [Google Scholar] [CrossRef]
  13. Martin-de Leon, J.; Bernardo, V.; Rodriguez-Perez, M.A. Key production parameters to obtain transparent nanocellular PMMA. Macromol. Mater. Eng. 2017, 302, 1700343. [Google Scholar] [CrossRef]
  14. Kakumanu, V.; Sundarram, S.S. Dual pore network polymer foams for biomedical applications via combined solid state foaming and additive manufacturing. Mater. Lett. 2018, 213, 366–369. [Google Scholar] [CrossRef]
  15. Jelle, B.P. Traditional, state-of-the-art and future thermal building insulation materials and solutions—Properties, requirements and possibilities. Energy Build. 2011, 43, 2549–2563. [Google Scholar] [CrossRef] [Green Version]
  16. Choi, B.; Yeo, I.; Lee, J.; Kang, W.K.; Song, T.H. Pillar-supported vacuum insulation panel with multi-layered filler material. Int. J. Heat Mass Transf. 2016, 102, 902–910. [Google Scholar] [CrossRef]
  17. Kwon, J.S.; Jang, C.H.; Jung, H.; Song, T.H. Vacuum maintenance in vacuum insulation panels exemplified with a staggered beam VIP. Energy Build. 2010, 42, 590–597. [Google Scholar] [CrossRef]
  18. Park, B.K.; Kim, C.-J.; Lee, Y.W. Characterization of Gradient Foam Using Additive Manufacturing and Gas Foaming Technologies. In Proceedings of the 4th International Conference on Manufacturing Technologies (ICMT 2020), Seattle, DC, USA, 17–20 January 2020; Abstract MC20-321-A. Available online: http://icmt.org/icmt2020.html (accessed on 16 October 2020).
  19. Nofar, M.; Ameli, A.; Park, C.B. Development of polylactide bead foams with double crystal melting peaks. Polymer 2015, 69, 83–94. [Google Scholar] [CrossRef]
  20. ISO (the International Organization for Standardization). ISO 22007-2:2015, Plastics—Determination of thermal conductivity and thermal diffusivity—Part 2: Transient plane heat source (hot disc) method. 2015. [Google Scholar]
  21. Gustafsson, S.E. Transient plane source techniques for thermal conductivity and thermal diffusivity measurements of solid materials. Rev. Sci. Instrum. 1991, 62, 797–804. [Google Scholar] [CrossRef]
  22. Crank, J. The Mathematics of Diffusion, 2nd ed.; Oxford University Press: London, UK, 1975. [Google Scholar]
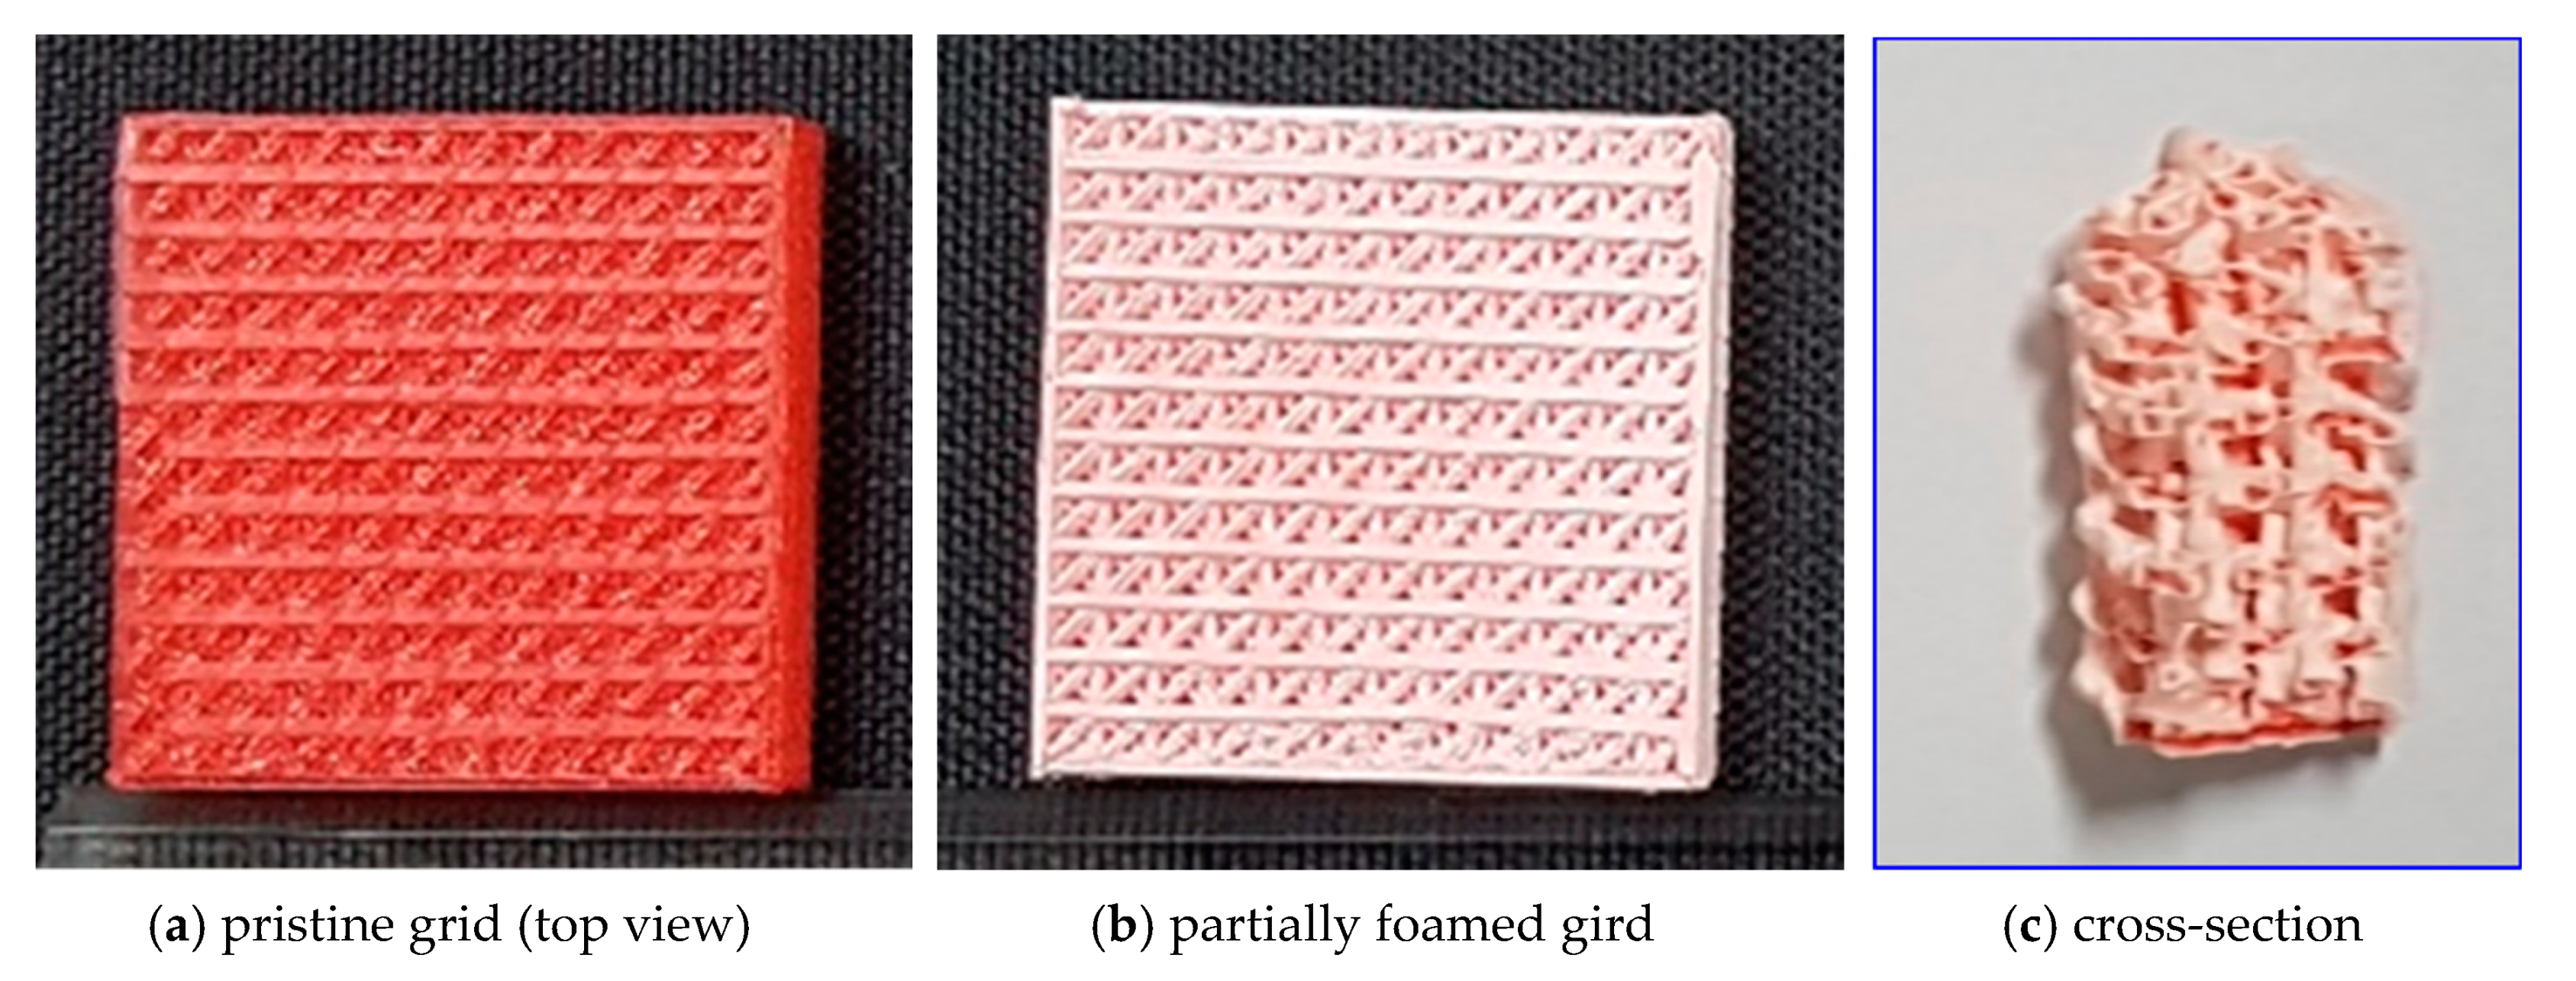
Figure 1. Typical 3D freeform structures shown as (a) printed, (b) post-foamed, and (c) cross-sectioned.
Processes 08 01594 g001
Figure 2. Comparison of SEM micrographs in the foamed copolymers. Results are for filament rod (a) and additively manufactured and post-foamed grid structure (c). (b,d) Expanded view of box in (a) and (d), respectively.
Processes 08 01594 g002
Figure 3. Effect of post-foaming temperature on cell nucleation density and relative density for the foamed copolymer filaments (sorption at 10 MPa and −20 °C for 24 h).
Processes 08 01594 g003
Figure 4. (a) DSC and (b) TGA thermograms of the samples for solid rod and foam grid.
Processes 08 01594 g004
Figure 5. Compressive stress–strain curves for 3D grid structure of the copolymer.
Processes 08 01594 g005
Figure 6. Effects of average thermal conductivity and heat capacity on the post-foaming temperature in 3D grid foam structure of the copolymer.
Processes 08 01594 g006
Publisher’s Note: MDPI stays neutral with regard to jurisdictional claims in published maps and institutional affiliations.