Article

Experimental Study on Ramp Shock Wave Control in Ma3 Supersonic Flow Using Two-Electrode SparkJet Actuator

Department of Applied Mechanics, School of Aerospace Sciences, National University of Defense Technology, Changsha 410073, China
*
Authors to whom correspondence should be addressed.
Processes 2020, 8(12), 1679; https://doi.org/10.3390/pr8121679
Submission received: 24 November 2020 / Revised: 15 December 2020 / Accepted: 17 December 2020 / Published: 19 December 2020
(This article belongs to the Special Issue Advances in Plasma Diagnostics and Applications)

Abstract

:
The control of a shock wave produced by a ramp (ramp shock) in Ma3 supersonic flow using a two-electrode SparkJet (SPJ) actuator in a single-pulse mode is studied experimentally. Except for schlieren images of the interaction process of SPJ with the flow field, a dynamic pressure measurement method is also used in the analysis of shock wave control. In a typical experimental case, under the control of single-pulsed SPJ, the characteristic of ramp shock changes from “short-term local upstream motion” in the initial stage to “long-term whole downstream motion” in the later stage. The angle and position of the ramp shock changes significantly in the whole control process. In addition, the dynamic pressure measurement result shows that the ramp pressure is reduced by a maximum of 79% compared to that in the base flow field, which indicates that the ramp shock is significantly weakened by SPJ. The effects of some parameters on the control effect of SPJ on the ramp shock are investigated and analyzed in detail. The increase in discharge capacitance helps to improve the control effect of SPJ on the ramp shock. However, the control effect of the SPJ actuator with medium exit diameter is better than that with a too small or too large one. In addition, when the SPJ exit is located in the separation zone and outside, the change in the ramp shock shows significant differences, but the control effect in the case of medium ramp distance is better when the SPJ exit is located outside the separation zone.

Graphical Abstract

1. Introduction

Gas discharge plasma technology has been developing rapidly and applied in many fields by researchers including medicine, material science, food science, aerospace science and so on in recent years. Its application in aerospace is very promising, mainly involving deicing [1,2,3], engine ignition and combustion [4,5], flow control [6,7,8,9] and so on. Plasma flow control refers to a method to apply effective disturbance to the flow field through the movement of plasma or the pressure, temperature, etc., changes due to plasma under the action of electromagnetic field force or gas discharge. It has wide application prospects in improving vehicles/engine aerodynamic characteristics, of which shock wave control is an important part.
Shock wave is a unique aerodynamic phenomenon in the era of supersonic flight. Effective control of the shock wave can improve the performance of supersonic flight in many aspects, such as reducing drag and heat, reducing the sonic boom of vehicle, generating thrust vector and regulating the capture flow rate and total pressure loss of ram inlet and so on. In order to control shock waves, researchers have adopted various passive/active flow control methods. The gas discharge plasma control method is a new kind of active flow control technology developed rapidly in recent years. It has many advantages, such as no moving parts or fluid supply device, fast response, wide working frequency band, etc. The SparkJet (SPJ) actuator, also called plasma synthetic jet actuator, is a new kind of plasma flow control method proposed by Grossman in 2003 [10]. It has very simple structures composed of an insulated cavity with a small exit and a pair of electrodes. A high voltage is applied between the two electrodes for the breakdown of cavity gas, and the gas in the small, insulated cavity is rapidly heated and pressurized. As a result, high-temperature, high-speed SPJ and a strong compression wave (also called “precursor shock” or “blast wave”) [11,12] are formed at the exit of SPJ actuator (SPJ exit), which can then be used for flow control. The authors have studied the characterization of SPJ in quiescent air [12]. For a typical SPJ, schlieren image results showed that SPJ took on a typical mushroom shaped jet structure and gradually became a fully developed continuous turbulence. A strong blast shock wave and some weak reflected waves are formed in front of SPJ. Through calculation, with input energy of about 10.5 J, the velocity of “blast shock wave” is maintained at about 350 m/s, that is, the local sound velocity, so the blast shock wave is actually a strong compression wave propagating at the sound velocity. While the velocity of SPJ tends to decrease with multiple peaks over time, of which the peak velocity is about 300 m/s [12]. After SPJ is ejected, SPJ actuator will aspirate the air in the environment to prepare for the next discharge. The whole process takes only a few hundred microseconds. The SPJ actuator has been a hot research topic in plasma flow control field for the past 17 years [13,14,15,16,17,18]. On the one hand, the researchers conducted a detailed parametric study of SPJ actuator [19,20,21,22,23]. On the other hand, a large number of studies focused on the working characteristic [24,25,26], efficiency improvement [27,28] and structure optimization [29,30,31] of SPJ actuator. In addition, SPJ actuator has also been used for aerodynamic control [32,33], mixing enhancement [34] and separation control [35,36,37,38].
At present, the SPJ actuator has been preliminarily applied in supersonic flow field shock wave control. Cybyk et al. [39] proved that PSJ can penetrate the boundary layer of the supersonic flow field (Ma = 3) through numerical simulation, which causes the transition of the transverse main flow boundary layer. This is the first time to verify the control authority of PSJ actuator in supersonic flow. Phase-locked schlieren imaging was used by Narayanaswamy et al. [40] to estimate the strength of PSJ in Mach 3 transverse flow, and the penetration distance measured is 1.5 boundary-layer thicknesses. In his later publications, he used SPJ to control shock wave boundary layer disturbance and achieved good results [41,42]. Wang et al. [43] studied how the transverse SPJ interacted with the shock induced by the 24° ramp in a supersonic flow with Mach number 2. The schlieren images showed that the shock was significantly modified by SPJ with an upstream motion and a reduced angle. Huang et al. [44] found that a shock-on-shock interaction occurred when the SPJ shock intersected with the shock induced by a 20° compression ramp in Mach 2 flow. Research by Zhou et al. [45,46] proved that SPJ can significantly weaken the ramp shock both in supersonic and hypersonic flow.
Overall, in the current study of shock wave control using SPJ, schlieren images are mainly used for qualitative observation of the change in the controlled shock. Although to a certain extent, this method can explain the attenuation of the shock wave, but it is relatively rough and lacking in a more credible and quantitative conclusion. In addition, detailed parameter studies of shock wave control using SPJ are also lacking. Therefore, in this paper, the control of shock wave produced by a ramp (ramp shock) in Ma3 supersonic flow using a single-pulsed SPJ actuator is studied experimentally both using schlieren images and dynamic pressure measurement method. The effects of different parameters on the control effect of SPJ on the shock wave are also studied.

2. Experimental Setup

2.1. Supersonic Wind Tunnel

This experiment was carried out in KD-2 supersonic wind tunnel of National University of Defense Technology. As shown in Figure 1, the wind tunnel mainly composites of transition section, stable section, nozzle, experimental section, expansion section and vacuum tank. The experimental section measures 200 mm (width) × 200 mm (height) × 400 mm (length) and has large optical windows for flow visualization in all four directions. The experimental results show that the experimental section has a good laminar flow. In detail, the maximum fluctuation error of the transient velocity is less than 1%, and the absolute error of the nozzle outlet Mach number distribution is less than 2%. The basic flow parameters in the experimental section in this experiment are shown in Table 1. [47].

2.2. Experimental Model

The experimental model for shock wave control using transverse SPJ is shown in Figure 2a. The center plate was installed in the experimental section by the four brackets and was calibrated with a level meter during installation. The ramp was installed on the center plate to generate ramp shock. The width and height of the ramp are, respectively, 15 and 20 mm. Angle of the ramp shown in Figure 2a is 60°, and the ramp distance (the distance between SPJ exit and the root of the ramp) is 50 mm. A pressure measuring hole is on the ramp surface at a height of 15 mm from the center plate and is connected with the dynamic pressure sensor. The SPJ actuator was installed under the center plate and was mounted by a fixed seat. The structure of SPJ actuator is shown in Figure 2b. The discharge cavity is cylindrical, with radius and height of 5.4 and 10.8 mm, respectively, and the volume is 1000 mm3. The cover plate can be tightly connected with the actuator mounting hole on the center plate. The cover plate and the actuator shell were fixed and sealed by silicone rubber to form a discharge cavity. Two tungsten electrodes were inserted into the discharge cavity for gas breakdown. In order to avoid leakage of electricity, an actuator sleeve was added outside the actuator shell to form the electrode–conductor connection groove, which was filled with insulating sealant. The agreed coordinate system in the experiment is shown in Figure 2, the coordinate system origin is located at the center of SPJ exit. When the actuator was in operation, a capacitor was connected in parallel at both ends to speed up discharge. The voltage used for discharge came from a high-voltage pulse power supply, which can supply voltage up to 10 kV.

2.3. Measurement System

The voltage was measured using a high-voltage probe (Tektronix P6015A, 75 MHz, 0–20 kV). The voltage signals were recorded by an oscilloscope (Tektronix DPO3014, 100 MHz, 2.5 Gs/s).
The pressure change in the supersonic flow field ramp wall under the control of SparkJet is extremely fast, and the time is very short, so the pressure needs to be measured by a dynamic pressure sensor with high response frequency. In this experiment, kulite XTL-190, with range of 170 kPa (absolute pressure) and the inherent frequency of 240 kHz, was adopted. The kulite sensor is very small, so it is easier to be mounted into the ramp. In addition, the kulite sensor has high sensitivity and can measure dynamic pressure and static pressure of the flow field at the same time.
Interaction processes between SPJ and ramp shock were acquired using high-speed schlieren imaging. A standard Z-type schlieren setup was used in this experiment. The frame rate of the camera was set to 50 kHz, so the time interval between two images is 20 µs.

2.4. Experimental Cases Set

Case1 is the reference case, with discharge capacitance of 640 nF, SPJ actuator exit diameter of 5 mm, ramp distance of 50 mm and ramp angle of 60°. To study the effects of different parameters on the control of ramp shock using SPJ actuator, 10 cases are set as shown in Table 2. Case1, case2 and case3 are set for comparing the effect of discharge capacitance. Case4, case5 and case6 are set for comparing the effect of actuator exit diameter. Case1, case5, case7, case8, case9 and case10 are set for comparing the effect of ramp distance. Any other parameters that are not listed in Table 2 are the same in all the 10 cases, for example the volume of the discharge cavity remains 1000 mm3. The SPJ actuator operation was in a single-pulse mode in all the 10 cases in this paper.

3. Experimental Results

3.1. Shock Wave Attenuation and Elimination Characteristics

Figure 3 shows the interaction process between SPJ and the supersonic crossflow near the ramp in case1 during a single-pulse operation using schlieren images. At 0 µs, the discharge in the cavity begins, but SPJ is not produced yet, so it can be regarded as the base flow field. Because of the existence of center plate leading edge and the gap between the wind tunnel and the optical windows, two weak Mach waves are produced in the experimental section. Laminar flow field separates at the ramp root, with a separation zone and a weak separation shock upstream the ramp [47]. The ramp angle is greater than the critical compression angle in Ma3 supersonic flow, so a detached shock wave is formed upstream of the ramp, which is called ramp shock and regarded as the control object of SPJ in this paper. For the convenience of comparison, the position of ramp shock in the base flow field is marked with white dotted lines in Figure 3.
At 20 µs, due to the rapid heating effect in the discharge cavity, SPJ is ejected from the SPJ exit and begins to interact with the supersonic crossflow. At the same time, a weak ellipse-shaped compression wave called “SPJ shock” in this paper is formed upstream the SPJ. From 20 to 80 µs, SPJ and SPJ shock expands further in the flow and normal direction, but faster in the flow direction. From 80 to 120 µs, SPJ shock interacts with ramp shock and part of SPJ shock goes through ramp shock, but there is no obvious change for the ramp shock. The part of SPJ shock downstream the ramp shock is too weak to be seen after 140 µs. Then from 120 to 160 µs, SPJ begins to interact with ramp shock. With control of SPJ and SPJ shock, ramp shock is first characterized by “short-term local upstream motion”. During this period of time, the effect of high-temperature SPJ is dominant. The local flow temperature and sound velocity rise due to the heating of the high-temperature SPJ, resulting in the “blocking effect”, which is equivalent to expanding the shape of the ramp. Therefore, the ramp shock moves upstream under the blocking effect. However, as the high-temperature SPJ quickly moves downstream, it cannot exert further effects on the ramp shock. At 140 µs, the upstream motion of the ramp shock is the most significant, and then at 160 µs, the ramp shock quickly recovers roughly to the position in the base flow field.
Then from 200 to 1220 µs, ramp shock is characterized by “long-term whole downstream motion”. The reasons may be explained as follows. On the one hand, the increase in the height of the SPJ shock causes stronger and wider disturbance to the ramp shock; on the other hand, it may be caused by the oscillation of the position of the ramp shock after the “short-term local upstream motion” in the previous stage. Although the ramp shock moves downstream as a whole finally, there is a process that the downstream-moving part gradually expands from the near-wall part to the far-wall part. For example, at 200 and 240 µs, the downstream-moving part is located below 53 and 64.5 mm, respectively, from the center plate wall. After 340 µs, the ramp shock in the whole observation area moves downstream. At 420 µs, the angle of the tail of the ramp shock reaches the minimum value (about 26.4°), which can be considered that the “long-term whole downstream motion” of the ramp shock reaches the maximum. Then, the ramp shock begins to recover gradually towards the position in the base flow field, but the recovery speed is very slow and gradually decelerates. Taking the angle of the tail of the ramp shock as a reference, as shown in Figure 4, the average recovery speed in the early stage (420–700 µs) is about 0.75° per 100 µs, and in the later stage (700–1220 µs) is about 0.29° per 100 µs. At 1220 µs, the ramp shock basically returns to the base flow state, which is the end of a control cycle of SPJ actuator.
Schlieren imaging is the main measurement method in the fields of shock wave control using SPJ. However, the disadvantage is obvious that only a few qualitative analysis data can be obtained. Therefore, high-frequency dynamic pressure sensor is adopted in this paper to try to measure the pressure on the ramp wall after the ramp shock, so as to prove that the ramp shock is weakened by SPJ and analyze its degree of weakening.
Change curves of discharge voltage and ramp wall pressure with time measured in case1 are shown in Figure 5. In the base flow field, the pressure of the ramp wall (the position of the pressure measuring hole) fluctuates around 30 kPa (the base pressure Pb in Figure 5), but the fluctuation range is relatively small. The voltage at both ends of the discharge capacitor is approximately zero before charging begins. About 350 µs before the start of the discharge (at t = −350 µs), the discharge capacitor begins to charge, and the voltage at both ends of the capacitor increases continuously. At 0 µs, the voltage at both ends of the capacitor reaches the breakdown voltage (about 1.91 kV), and the discharge begins. Therefore, the energy input into the discharge cavity is approximately 1.17 J. Since the time scale of discharge is much smaller than the time scale of pressure change, it is difficult to identify the voltage waveform under the time scale of the x-coordinate in Figure 5. Actually, the voltage waveform oscillates up and down and decays with time. After a period of response time (Δtd ≈75 µs), the ramp wall pressure began to be greatly disturbed. The ramp wall pressure first rises for a short time, as shown in Figure 5, and the pressure at the peak is about 36 kPa. The appearance of the small pressure peak at 75 µs may be caused by the impacting of SPJ shock. Then, the ramp wall pressure begins to drop. After about 370 µs (Δtp ≈ 370 µs), the ramp wall pressure reaches its minimum at about 6.3 kPa. After that, the ramp wall pressure starts to recover. Compared with the pressure drop process, the speed of the pressure recovery process is slightly slower. It takes a total of about 880 µs from initial response time t1 to pressure recovery time t2, that is, Δta ≈ 880 µs. Dynamic pressure measurement results show that, although there will be a brief pressure rise, on the whole, the ramp pressure decreases obviously under control of SPJ and SPJ shock. The minimum pressure is reduced by a maximum of 79% compared to the base pressure, which indicates that the strength of the ramp shock is significantly weakened.

3.2. Effect of Discharge Capacitance

Comparison of flow field evolution process with different discharge capacitance (case1, case2 and case3) is shown in Figure 6. The larger the discharge capacitance is, the more energy is injected into the discharge cavity and the higher the pressure rise in the discharge cavity is. Therefore, as we can see from Figure 6, the larger the discharge capacitance is, the stronger the intensity of SPJ and SPJ shock is. At 40 µs after discharge, the angle of SPJ shock in case1, case2 and case3 are 56.1, 46.3° and 36.9°, respectively. In addition, the larger the discharge capacitance is, the higher temperature and lower density SPJ will be formed, resulting in a higher density gradient and clearer display in the schlieren images. For example, at 80 µs, large scale vortex structure formed by SPJ can be clearly observed in case1, but it is difficult to be observed in case2 and case3. Velocity of SPJ and SPJ shock both in the flow direction and the normal direction increase with discharge capacitance. At 420, 500 and 520 µs, respectively, in case1, case2 and case3, the angles of ramp shock tail reach the minimum value at 26.4, 27.3 and 28.1°. From the measurement of ramp pressure, as shown in Figure 7, it can be concluded that the increase in discharge capacitance can increase the degree of ramp pressure reduction, that is, enhance the control effect of SPJ on ramp shock. The minimum ramp wall pressure values are 6.3, 12.8 and 18.7 kPa in case1, case2 and case3, respectively, which are 79.0, 57.3 and 37.7% lower than the base pressure.

3.3. Effect of Exit Diameter

Comparison of flow field evolution process with different exit diameter (case4—1.5 mm, case5—5 mm and case6—11 mm) is shown in Figure 8. By comparing the flow field at 40 and 80 µs, it can be seen that the larger the exit diameter of SPJ actuator is, the stronger the SPJ shock generated is, and the faster the SPJ shock moves. For example, at 40 µs, the SPJ shock angle in case4, case5 and case6 is 45, 49 and 52.5°, respectively. For case6, in addition to the relatively strong SPJ shock, a weak separation oblique shock is generated upstream the SPJ exit. The angle of the oblique shock is about 22°, which is close to (slightly greater than) the interference shock angle (21.5°) generated by the uneven wall surface in Ma3 flow. While in case5, the separation oblique shock is very weak, and in case4, it cannot be observed.
As shown in Figure 9, the minimum ramp wall pressures in case4, case5 and case6 are 12.6, 6.4 and 9.7 kPa, respectively, which are 59.7, 79.5 and 69% lower than the base pressure (31.3 kPa for the 90° ramp). The results show that when the exit diameter increases from 5 to 11 mm, the effect of shock weakening will decrease. Analysis from schlieren images shows that that the 11 mm diameter actuator produces SPJ with higher mass flow, which has a relatively strong blocking effect on the flow field. As shown in Figure 8c, at 180 and 220 µs, a strong shock is generated in front of the ramp due to the blocking effect, which is just in front of the pressure measurement hole. Therefore, to a certain extent, the effect of the shock weakening is reduced.
For the time scale, the larger the diameter of SPJ exit is, the earlier the control effect and the maximum effect are generated, but also the earlier they end. Therefore, it can be considered that the “phase” of the control effect is advanced along with the increase in exit diameter. It can be seen from change curves in Figure 9 that the larger the exit diameter is, the earlier the moment of the “pressure peak”, the moment of the pressure minimum and the moment of the pressure recovery appear. From schlieren images in Figure 8, we can see that for case5 and case6, the ramp shock is lifted and partly eliminated at 160 µs. However, for case4, it is not until 180 µs when the ramp shock begins to show minor changes, and 220 µs when the ramp shock is lifted and partly eliminated. A similar rule appears in the moment of minimum ramp shock tail angle, of which the moments are, respectively, 560, 440 and 340 µs in case4, case5 and case6.

3.4. Effect of Ramp Distance

Characteristics of the SPJ actuator and the changes in the ramp shock are significantly different when the SPJ exit is located in the separation zone and outside. Therefore, a comparison is made between the two situations in case7 and case5 first. The electromagnetic interference due to the discharge is too strong to measure the change in ramp wall pressure when SPJ actuator is in the separation zone in case7. Therefore, comparison is done through schlieren images in Figure 10. The ramp angle in the two cases is 90°.
When the SPJ exit is located in the separation zone in case7, the initial pressure in the actuator cavity is higher than that outside the separation zone in case5 due to the decrease in flow velocity and the increase in flow pressure. As a result, the breakdown voltage increases from about 1.9 kV in case5 to about 3.4 kV in case7. As shown in Figure 10a, at 20 µs, the discharge arc is ejected out of SPJ exit due to the low velocity and rotational flow in the separation zone. The time scale is also significantly affected by the separation zone. For case7, the ramp shock is significantly changed at 40 µs, and the maximum change in the ramp shock tail angle appears at 200 µs. However, for case5, the SPJ and SPJ shock are still in the development stage before 140 µs and the maximum change in the ramp shock tail angle appears at 440 µs.
In the initial stage, the control effect in the separation zone is similar to that outside the separation zone. As shown in Figure 10a at 40 µs and Figure 10b at 180 µs, the ramp shock root is lifted and partly eliminated under the control of the high-temperature SPJ. However, there are also some differences. The SPJ shock in case7 is directly fused with the ramp shock and the pressure disturbance of SPJ shock on ramp shock is applied from the downstream of ramp shock, which spreads along the flow direction and normal direction (equally important). The effect is similar to that of an opposing jet. Instead, when SPJ exit is outside the separation zone in case5, the pressure disturbance of the SPJ shock on the ramp shock is applied from the upstream of ramp shock, and the disturbance gradually spreads along the flow direction and normal direction, mainly in the flow direction.
Therefore, affected by the initial stage, effects of SPJ and SPJ shock on the ramp shock in the later stage are very different. In case7, as shown in Figure 10a, at 80, 160 and 200 µs, SPJ shock and the ramp shock merge and are lifted. As the disturbance expands in the normal direction, a lifted part of the ramp shock gradually expands, at the same time, the angle of the shock tail gradually increases. At 200 µs, the ramp shock in the observed area is completely lifted, and the angle of the shock tail reaches its maximum value of 32°. After that, the ramp shock gradually recovers, and the angle of the ramp shock tail gradually decreases. At 720 µs, the ramp shock basically returns to the base flow field position. In case5, similar to case1 described in Section 3.1, the ramp shock first goes through a process of “short-term local upstream motion”, as shown in Figure 10b at 180 µs. After that, the ramp shock is mainly represented by “long-term whole downstream motion”, as shown in Figure 10b at 240, 300 and 440 µs. At 880 µs, the ramp shock basically returns to the base flow field position.
When the SPJ exit is outside the separation zone, with the change in the ramp distance, the control effect is similar, but the degree is different. Figure 11 shows the comparison of the flow field evolution process under the control of SPJ of SPJ shock when the SPJ exit is located outside the separation zone at different ramp distances. Ramp angles in these cases are 60°. Ramp distances in case8, case1, case9 and case10 are, respectively, 30, 50, 70, 90 mm.
The SPJ shock generated in case9 and case10 is similar. However, in case1 and case8, due to that it is closer to the separation zone with higher static pressure, the breakdown voltage and the discharge energy increases, SPJ shock is strengthened along with the decrease in ramp distance. Then, change curves of ramp pressure in the four cases are compared in Figure 12. The minimum ramp wall pressures are 14.1, 6.3, 13.1 and 14.6 kPa in case8, case1, case9, case10, respectively, which are reduced by 53.0, 79.0, 56.3 and 51.3% compared to the base pressure, respectively. When the ramp distance increases from 50 to 90 mm, intensity of SPJ and SPJ shock weakens during the long-distance movement, which will weaken the control effect on the ramp shock. However, when the ramp distance decreases from 50 to 30 mm, control effect is also weakened. The reason may be similar to that in case6, namely a new strong shock is produced upstream the ramp, as shown in Figure 11d, at 140 µs, which increases the ramp wall pressure.
From the perspective of the time scale, the smaller the ramp distance is, the faster the control effect appears. The lifting effect of the ramp shocks in case8, case1, case9 and case10 reaches the maximum at 140, 180, 220 and 240 µs, respectively, and the reduction in the angle of the ramp shock tail reaches the minimum at 400, 420, 460 and 500 µs, respectively, as shown in Figure 11. However, change curves of ramp pressure in Figure 12 show that, in terms of the duration of control effect, it is still the longest when the ramp distance is 50 mm. The analysis suggests that this may be because the control effect is weak when the ramp distance is relatively longer, so it attenuates quickly.

4. Conclusions

In this paper, control of ramp shock wave in Ma3 supersonic flow using two-electrode SparkJet (SPJ) actuator is investigated experimentally by using schlieren images and dynamic pressure measurement results. The main conclusions are as follows:
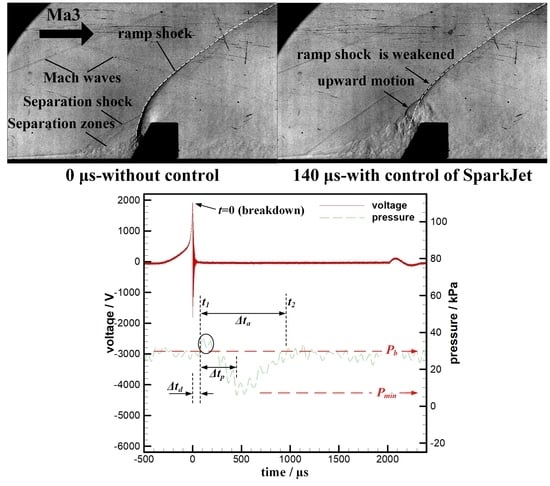
  • Under control of SPJ and SPJ shock, not only the angle and position of the ramp shock are changed, but also the intensity is weakened. The measurement results of the ramp wall pressure show that the ramp pressure is reduced by a maximum of 79% compared to the pressure in the base flow field.
  • Ten experimental cases are set for investigating and analyzing the effects of some parameters including discharge capacitance, exit diameter and ramp distance on the control effect of SPJ on the ramp shock in detail. The increase in discharge capacitance helps to improve the control effect of SPJ on the ramp shock. However, the control effect of SPJ actuator with medium exit diameter is better than that with too small or too large one. In addition, when the SPJ exit is located in the separation zone and outside, the change in the ramp shock shows significant differences, but the control effect on the ramp shock in the case of medium ramp distance is better when the SPJ exit is located outside the separation zone.

Author Contributions

Conceptualization, W.X. and Y.Z.; methodology, Z.L.; validation, L.W. and W.P.; writing—original draft preparation, W.X.; writing—review and editing, Y.Z. and T.G. All authors have read and agreed to the published version of the manuscript.

Funding

The present study was funded by the National Natural Science Foundation of China (Grant No. 12002377, 11972369, 11872374, and 52075538), the Natural Science Foundation of Hunan Province (Grant No. 2020JJ5670) and research program of National University of Defense Technology (Grant No. ZK18-03-11).

Conflicts of Interest

The authors declare no conflict of interests.

References

  1. Meng, X.S.; Hu, H.Y.; Li, C.; Abbasi, A.A.; Cai, J.S.; Hu, H. Mechanism study of coupled aerodynamic and thermal effects using plasma actuation for anti-icing. Phys. Fluids 2019, 31, 037103. [Google Scholar] [CrossRef] [Green Version]
  2. Gao, T.X.; Luo, Z.B.; Zhou, Y.; Liu, Z.Y.; Peng, W.Q.; Cheng, P.; Deng, X. Novel deicing method based on plasma synthetic jet actuator. AIAA J. 2020, 58, 1–8. [Google Scholar] [CrossRef]
  3. Gao, T.X.; Luo, Z.B.; Zhou, Y.; Yang, S.K. A novel de-icing strategy combining electric-heating with plasma synthetic jet actuator. Proc. Inst. Mech. Eng. Part G J. Aerosp. Eng. 2020. [Google Scholar] [CrossRef]
  4. Chen, W.Q.; Jin, D.; Cui, W.; Huang, S.F. Characteristics of gliding arc plasma and its application in swirl flame static instability control. Processes 2020, 8, 684. [Google Scholar] [CrossRef]
  5. Liu, C.Y.; Sun, M.B.; Wang, H.B.; Yang, L.C.; An, B.; Pan, Y. Ignition and flame stabilization characteristics in an ethylene-fueled scramjet combustor. Aerosp. Sci. Technol. 2020, 106, 106186. [Google Scholar] [CrossRef]
  6. Wang, J.J.; Choi, K.S.; Feng, L.H.; Jukes, T.N.; Whalley, R.D. Recent developments in DBD plasma flow control. Prog. Aerosp. Sci. 2013, 62, 52–78. [Google Scholar] [CrossRef]
  7. Tang, M.X.; Wu, Y.; Guo, S.G.; Sun, Z.Z.; Luo, Z.B. Effect of the streamwise pulsed arc discharge array on shock wave/boundary layer interaction control. Phys. Fluids 2020, 32, 076104. [Google Scholar] [CrossRef]
  8. Popkin, S.H.; Cybyk, B.Z.; Land, B.; Foster, C.H.; Alvi, F.S. Recent performance-based advances in SparkJet actuator design for supersonic flow applications. In Proceedings of the 51st AIAA Aerospace Sciences Meeting Including the New Horizons Forum and Aerospace Exposition, Grapevine, TX, USA, 7–10 January 2013. [Google Scholar]
  9. Zong, H.H.; Kotsonis, M. Formation, evolution and scaling of plasma synthetic jets. J. Fluid Mech. 2018, 837, 147–181. [Google Scholar] [CrossRef]
  10. Grossman, K.R.; Cybyk, B.Z.; VanWie, D.M. SparkJet actuators for flow control. In Proceedings of the 41st Aerospace Sciences Meeting and Exhibit, Reno, NV, USA, 6–9 January 2003. [Google Scholar]
  11. Reedy, T.M.; Kale, N.V.; Dutton, J.C.; Elliott, G.S. Experimental characterization of a pulsed plasma jet. AIAA J. 2013, 51, 2027–2031. [Google Scholar] [CrossRef]
  12. Wang, L.; Xia, Z.X.; Luo, Z.B.; Zhou, Y.; Zhang, Y. Experimental study on the characteristics of a two-electrode plasma synthetic jet actuator. Acta Phys. Sin. 2014, 63, 194702. [Google Scholar]
  13. Huang, H.X.; Tan, H.J.; Guo, Y.J.; Sun, S.; He, X.M. Flowfield induced by a plasma synthetic jet actuator with low exit inclination angle under low ambient pressure. Aerosp. Sci. Technol. 2020, 105, 106018. [Google Scholar] [CrossRef]
  14. Li, J.; Zhang, X. A novel model of plasma synthetic jet actuators coupled energy source term model with mechano-acoustical analogy model. J. Phys. D Appl. Phys. 2020, 53, 235204. [Google Scholar] [CrossRef]
  15. Seyhan, M.; Akansu, Y.E. The effect of a novel spark-plug plasma synthetic jet actuator on the performance of a PEM fuel cell. Int. J. Heat Mass Transf. 2019, 140, 147–151. [Google Scholar] [CrossRef]
  16. Chedevergne, F.; Bodoc, V.; Leon, O.; Caruana, D. Experimental and numerical response of a high-Reynolds-number M = 0.6 jet to a plasma synthetic jet actuator. Int. J. Heat Fluid Flow 2015, 56, 1–15. [Google Scholar] [CrossRef]
  17. Dufour, G.; Hardy, P.; Quint, G.; Rogier, F. Physics and models for plasma synthetic jets. Int. J. Aerodyn. 2013, 3, 47–70. [Google Scholar] [CrossRef]
  18. Takehiro, H.; Kakuji, O.; Shinsuke, M. Direct Measurement of Wall-Shear Stress of Plane Shear Layer with Plasma Synthetic Jet Actuator. J. Fluid Sci. Technol. 2009, 4, 75–83. [Google Scholar]
  19. Ricchiuto, A.C.; Borghi, C.A.; Cristofolini, A.G.; Neretti, G. Measurement of the charge distribution deposited on a target surface by an annular plasma synthetic jet actuator: Influence of humidity and electric field. J. Electrost. 2020, 107, 103501. [Google Scholar] [CrossRef]
  20. Zhang, P.F.; Dai, C.F.; Liu, A.B.; Wang, J.J. The effect of actuation frequency on the plasma synthetic jet. Sci. China Tech. Sci. 2011, 54, 2945. [Google Scholar] [CrossRef]
  21. Wu, S.; Liu, X.; Huang, G.; Liu, C.; Bian, W.; Zhang, C. Influence of high-voltage pulse parameters on the propagation of a plasma synthetic jet. Plasma Sci. Technol. 2019, 21, 074007. [Google Scholar] [CrossRef]
  22. Zong, H.H.; Kotsonis, M. Effect of velocity ratio on the interaction between plasma synthetic jets and turbulent cross-flow. J. Fluid Mech. 2019, 865, 928–962. [Google Scholar] [CrossRef]
  23. Zhang, Y.C.; Tan, H.J.; Huang, H.X.; Sun, S.; He, X.M.; Cheng, L.; Zhuang, Y. Transient flow patterns of multiple plasma synthetic jets under different ambient pressures. Flow Turbul. Combust. 2018, 101, 741–757. [Google Scholar] [CrossRef]
  24. Zhang, W.; Geng, X.; Shi, Z.W.; Jin, S.L. Study on inner characteristics of plasma synthetic jet actuator and geometric effects. Aerosp. Sci. Technol. 2020, 105, 106044. [Google Scholar] [CrossRef]
  25. Yu, Y.; Xu, J.L.; Gan, N. Effects of Parameters on Continuously Working Plasma Synthetic Jet. Eng. Appl. Comput. Fluid Mech. 2014, 8, 55–69. [Google Scholar] [CrossRef] [Green Version]
  26. Sary, G.; Dufour, G.; Rogier, F.; Kourtzanidis, K. Modeling and parametric study of a plasma synthetic jet for flow control. AIAA J. 2014, 52, 1591–1603. [Google Scholar] [CrossRef]
  27. Haack, S.J.; Taylor, T.M.; Cybyk, B.Z.; Foster, C.H.; Alvi, F.S. Experimental estimation of SparkJet efficiency. In Proceedings of the 42nd AIAA Plasmadynamics and Lasers Conference in Conjunction with the 18th International Conference on MHD Energy Conversion (ICMHD), Honolulu, HI, USA, 27–30 June 2011. [Google Scholar]
  28. Golbabaei-Asl, M.; Knight, D.; Wilkinson, S. Novel technique to determine SparkJet efficiency. AIAA J. 2015, 53, 501–882. [Google Scholar] [CrossRef]
  29. Wang, L.; Xia, Z.X.; Luo, Z.B.; Chen, J. Three-electrode plasma synthetic jet actuator for high-speed flow control. AIAA J. 2014, 52, 879–882. [Google Scholar] [CrossRef]
  30. Neretti, G.; Seri, P.; Taglioli, M.; Shaw, A.; Iza, F.; Borghi, C.A. Geometry optimization of linear and annular plasma synthetic jet actuators. J. Phys. D Appl. Phys. 2017, 50, 015210. [Google Scholar] [CrossRef] [Green Version]
  31. Caruana, D.; Barricau, P.; Hardy, P. The “plasma synthetic jet” actuator aero-thermodynamic characterization and first flow control applications. In Proceedings of the 47th AIAA Aerospace Sciences Meeting Including the New Horizons Forum and Aerospace Exposition, Orlando, FL, USA, 5–8 January 2009. [Google Scholar]
  32. Liu, R.B.; Niu, Z.G.; Wang, M.M.; Hao, M.; Lin, Q. Aerodynamic control of NACA 0021 airfoil model with spark discharge plasma synthetic jets. Sci. China Tech. Sci. 2015, 58, 1949–1955. [Google Scholar] [CrossRef]
  33. Anderson, K.V.; Knight, D.D. Plasma jet for flight control. AIAA J. 2012, 50, 1855–1872. [Google Scholar] [CrossRef]
  34. Wang, P.; Shen, C.B. Characteristics of mixing enhancement achieved using a pulsed plasma synthetic jet in a supersonic flow. J. Zhejiang Univ. Sci. A 2019, 20, 701–713. [Google Scholar] [CrossRef]
  35. Caruana, D.; Barricau, P.; Gleyzes, C. Separation control with plasma synthetic jet actuators. Int. J. Aerodyn. 2013, 3, 71–83. [Google Scholar] [CrossRef]
  36. Wang, H.Y.; Li, J.; Jin, D.; Tang, M.X.; Wu, Y.; Xiao, L. High-frequency counter-flow plasma synthetic jet actuator and its application in suppression of supersonic flow separation. Acta Astronaut. 2017, 142, 45–56. [Google Scholar] [CrossRef]
  37. Ogawara, K.; Kojima, R.; Matsumoto, S.J.; Shingin, H. Extremum seeking adaptive separation control on a wing with plasma synthetic jet actuator. J. Fluid Sci. Technol. 2012, 7, 89–99. [Google Scholar] [CrossRef]
  38. Zong, H.H.; Van, P.T.; Kotsonis, M. Airfoil flow separation control with plasma synthetic jets at moderate Reynolds number. Exp. Fluids 2018, 59, 169. [Google Scholar] [CrossRef] [Green Version]
  39. Cybyk, B.Z.; Wilkerson, J.; Grossman, K.R. Performance characteristics of the SparkJet flow control actuator. In Proceedings of the 2nd AIAA Flow Control Conference, Portland, OR, USA, 28 June–1 July 2004. [Google Scholar]
  40. Narayanaswamy, V.; Raja, L.L.; Clemens, N.T. Characterization of a high-frequency pulsed-plasma jet actuator for supersonic flow control. AIAA J. 2010, 48, 297–305. [Google Scholar] [CrossRef] [Green Version]
  41. Narayanaswamy, V.; Raja, L.L.; Clemens, N.T. Control of unsteadiness of a shock wave/turbulent boundary layer interaction by using a pulsed-plasma-jet actuator. Phys. Fluids 2012, 24, 543. [Google Scholar] [CrossRef] [Green Version]
  42. Narayanaswamy, V.; Raja, L.L.; Clemens, N.T. Control of a Shock/Boundary-Layer Interaction by using a pulsed-plasma jet actuator. AIAA J. 2012, 50, 246–249. [Google Scholar] [CrossRef]
  43. Wang, H.Y.; Li, J.; Jin, D.; Dai, H.; Gan, T.; Wu, Y. Effect of a transverse plasma jet on a shock wave induced by a ramp. Chin. J. Aeronaut. 2017, 30, 1854–1865. [Google Scholar] [CrossRef]
  44. Huang, H.X.; Tan, H.J.; Sun, S.; Zhang, Y.C.; Cheng, L. Transient interaction between plasma jet and supersonic compression ramp flow. Phys. Fluids 2018, 30, 041703. [Google Scholar] [CrossRef]
  45. Zhou, Y.; Xia, Z.X.; Luo, Z.B.; Wang, L. Effect of three-electrode plasma synthetic jet actuator on shock wave control. Sci. China Technol. Sci. 2017, 60, 150–156. [Google Scholar] [CrossRef]
  46. Zhou, Y.; Xia, Z.X.; Luo, Z.B.; Wang, L.; Deng, X.; Zhang, Q.H.; Yang, S.K. Characterization of three-electrode SparkJet actuator for hypersonic flow control. AIAA J. 2019, 57, 879–885. [Google Scholar] [CrossRef]
  47. Wang, D.; Zhao, Y.; Xia, Z.; Wang, Q.; Huang, X. Multi-resolution analysis of density fluctuation of coherent structures about supersonic flow over vg. Chin. J. Aeronaut. 2012, 2, 173–181. [Google Scholar] [CrossRef] [Green Version]
Figure 1. Schematic diagram of KD-2 supersonic wind tunnel.
Processes 08 01679 g001
Figure 2. Schematic diagram of experimental model; (a) experimental model installation; (b) SparkJet (SPJ) actuator section view.
Processes 08 01679 g002
Figure 3. Interaction process between SPJ and the supersonic crossflow near the ramp in case1.
Processes 08 01679 g003
Figure 4. Change curve of the ramp shock tail angle with time during the recovery process.
Processes 08 01679 g004
Figure 5. Change curves of discharge voltage and ramp wall pressure with time in case1.
Processes 08 01679 g005
Figure 6. Comparison of the flow field evolution process with different discharge capacitance: (a) case1—640 nF, (b) case2—320 nF and (c) case3—80 nF.
Processes 08 01679 g006
Figure 7. Change curves of ramp pressure with different discharge capacitances.
Processes 08 01679 g007
Figure 8. Comparison of the flow field evolution process with different exit diameters: (a) case4—1.5 mm, (b) case5—5 mm, (c) case6—11 mm.
Processes 08 01679 g008
Figure 9. Change curves of ramp pressure with different exit diameter.
Processes 08 01679 g009
Figure 10. Comparison of the flow field evolution process when SPJ exit is in the separation zone and outside: (a) case7—in the separation zone, (b) case5—outside the separation zone.
Processes 08 01679 g010
Figure 11. Comparison of the flow field evolution process when SPJ exit is outside the separation zone at different ramp distances: (a) case10—90 mm, (b) case9—70 mm, (c) case1—50 mm, (d) case8—30 mm.
Processes 08 01679 g011
Figure 12. Change curves of ramp pressure with different ramp distances.
Processes 08 01679 g012
Table 1. Flow parameters in the experimental section.
ParametersValueUnit
Mach number3-
Velocity622.5m/s
Sound velocity207.5m/s
Total temperature300K
Static temperature107.1K
Total pressure101kPa
Static pressure2.8kPa
Density0.0983kg/m3
Viscosity coefficient7.43 × 10−6Ns/m2
Unit Reynolds number7.49 × 1061/m
Running time>20s
Table 2. Experimental cases set.
ParametersDischarge CapacitanceExit DiameterRamp DistanceRamp Angle
Case1640 nF5 mm50 mm60°
Case2320 nF5 mm50 mm60°
Case380 nF5 mm50 mm60°
Case4640 nF1.5 mm75 mm90°
Case5640 nF5 mm75 mm90°
Case6640 nF11 mm75 mm90°
Case7640 nF5 mm15 mm90°
Case8640 nF5 mm30 mm60°
Case9640 nF5 mm70 mm60°
Case10640 nF5 mm90 mm60°
Publisher’s Note: MDPI stays neutral with regard to jurisdictional claims in published maps and institutional affiliations.

