Abstract
In this paper, the cavitation characteristics of centrifugal blood pumps under variable speeds were studied by using ANSYS-CFX and MATLAB software. The study proposed a multi-scale model of the “centrifugal blood pump—left heart blood circulation”, and analyzed the cavitation characteristics of the centrifugal blood pump. The results showed that the cavitation in the impeller first appeared near the hub at the inlet of the impeller. As the inlet pressure decreased, the cavitation gradually strengthened and the bubbles gradually developed in the outlet of the impeller. The cavitation intensity increased with the increase of impeller speed. The curve of the variable speeds of the centrifugal blood pump in the optimal auxiliary state was obtained, which could effectively improve the aortic pressure and flow. In variable speeds, due to the high aortic flow and pressure during the ejection period, the sharp increases in speeds led to cavitation. The results could provide a guidance for the optimal design of the centrifugal blood pump.
1. Introduction
Heart failure (HF) is the most fatal clinical syndrome due to heart dysfunction and insufficient blood supply. The New York Heart Association (NYHA) proposed the NYHA classification of heart failure, which classifies heart failure into four levels. Grade I-II heart failure is mild heart failure, grade II-III heart failure is moderate to mild heart failure, and grade IV heart failure is end-stage heart failure. In recent years, with the increasing prevalence of cardiovascular and cerebrovascular diseases, ventricular assist devices have attracted attention as the main method for treating patients with advanced heart failure. In ventricular assist devices, constant rotating speed control is frequently used to make the average aortic pressure and cardiac output of patients reach normal physiological levels. However, this assisted state is likely to cause aspiration and reflux, and is accompanied by many complications [1]. Thus, a blood pump variable speed control method is used to achieve the best auxiliary state under different heart failure conditions [2,3,4]. During the variable speed assist process, the transient of rotating speed can easily cause cavitation inside the blood pump. The centrifugal pump uses the centrifugal force of the impeller to form a low-pressure area to suck in liquid, and then transfer energy to the discharged liquid [5]. During inhalation, the local pressure is reduced. Generally, the pressure cannot reach the critical value of blood cavitation when the constant speed is assisted. When the rotating speed of the pump increases instantaneously, the local pressure in the blood pump will be lower than the critical value of blood cavitation, resulting in a cavitation phenomenon. When the cavitation bubbles enter the high-pressure area of the impeller, the bubbles will collapse due to the large pressure difference between the inside and outside of the bubble, which will damage the blood cells and the surface of the impeller, and affect the stability and service life of the pump. In some serious conditions, the hemolysis or thrombosis will appear [6]. In 1974, Walker et al. observed cavitation in a pneumatic artificial heart for the first time. The cavitation mainly occurred near the moving diaphragm of the artificial ventricle through high-speed photography [7,8]. Freed et al. proposed that the occurrence of cavitation under external physiological conditions mainly depends on local pressure, and the occurrence of cavitation is highly traumatic to the nearby red blood cells, which results in hemolysis [9]. In recent years, Lin et al. experimentally studied the cavitation phenomenon of the pump caused by the failure of the short inlet casing [10]. Kijima et al. found that the impeller pump is more prone to cavitation than the straight pump [11]. With the development of computer technology and computational fluid dynamics, it is possible to study the cavitation characteristics of ventricular assist devices through numerical simulation methods. However, there are only a few studies on the cavitation of variable speed centrifugal blood pumps.
In this paper, the computational fluid dynamics (CFD) software ANSYS-CFX was used to numerically simulate the centrifugal blood pump and predicted its performance [12]. According to the simulation results, the development mechanism of cavitation in the centrifugal blood pump was discussed. The cavitation characteristics of the centrifugal blood pump under variable speed condition were also studied. This is of great significance for identifying the risk of cavitation and increasing the reliability of the centrifugal blood pump.
2. Methods
Theoretical analysis and numerical simulation were applied in this section. Firstly, CFD simulation was used to analyze the pressure distribution, cavitation critical pressure, and cavitation distribution patterns in the pump. Grade IV heart failure is generally used to indicate end-stage heart failure, so this paper takes grade IV heart failure as the research condition. MATLAB was used to established a “centrifugal blood pump—left heart blood circulation system” model [13]. The speed changing curve was obtained when the optimal assist state was reached in the cardiac cycle, under the condition of level IV heart failure. The cavitation mechanism of the centrifugal blood pump was analyzed during the variable speed assist process by CFD.
2.1. Pump Geometry
The centrifugal blood pump, as shown in Figure 1a, is used as the numerical calculation model. The design parameters are as follows: flow rate is 5 L/min, rotating speed is 3330 r/min, and the pressure difference between the inlet and outlet of the pump is 100 mmHg. The geometrical parameters of the centrifugal blood pump are shown in Table 1. Figure 1b is the geometric model of the centrifugal blood pump. The investigated medium is blood.
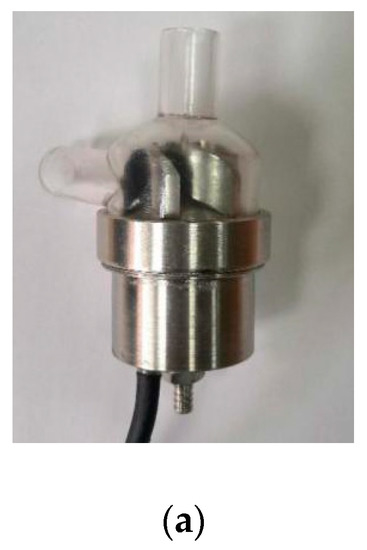
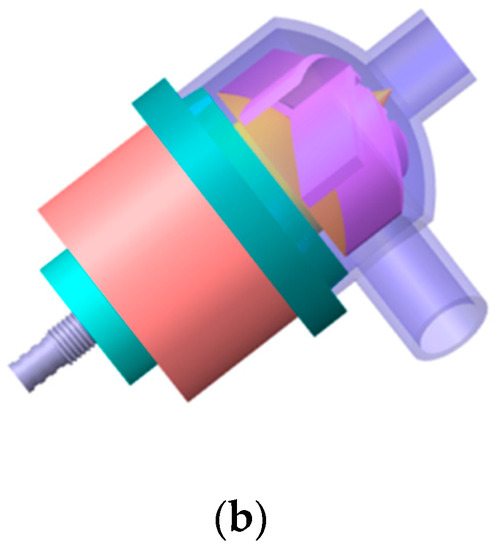
Figure 1.
Pump geometry. (a) Photograph of the centrifugal blood pump; (b) geometric model of the blood pump.

Table 1.
Design parameters of the centrifugal blood pump.
2.2. Mesh
In order to reduce the influence of inlet and outlet boundary conditions on the internal flow of the pump, the inlet and outlet sections of the pump model were extended accordingly, as shown in Figure 2. The impeller and the pump casing were meshed by the tetrahedral unstructured mesh with strong adaptability, because of the serious distortion of the pump blade space and the complicated structure of the flow channel. The extended section of the inlet and outlet was meshed by the structural grid. To check for grid independence, when the pressure difference between the inlet and outlet of pump correlation is less than 0.5%, it can be considered that the grid does not affect the calculation result [14]. Finally, the total number of grids in the calculation area is 982,503, and mesh quality is 0.3, as shown in Figure 3. After calculation, the blade surface mesh y+ <50 meets the requirements of the standard k-ε turbulence model for y+ [15].
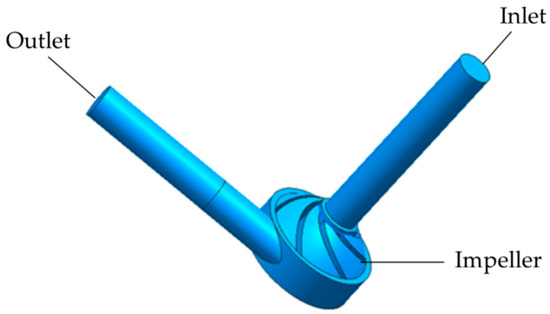
Figure 2.
3D modeling of the calculation area of the centrifugal blood pump.
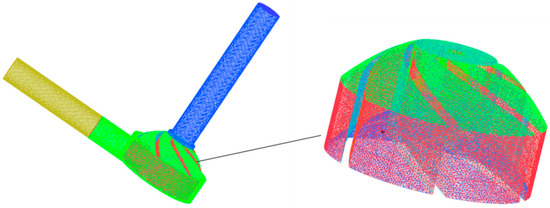
Figure 3.
Mesh of the centrifugal blood pump.
2.3. Numerical Simulation Methods
ANSYS-CFX is employed to solve finite element equations. The convection term uses the high-precision difference scheme, and the other terms use the central difference scheme. In solving the system of equations, a fully implicit coupling technique is used to improve the calculation speed and stability [16]. The fluid flowing through the centrifugal blood pump during numerical simulation is blood. Assuming blood is an incompressible Newtonian liquid, blood behaves as a Newtonian fluid for the condition of reasonable shear stresses, as expected in the LEV-VAD, and shear rates above 100/s [17]. When the normal temperature of the human body is 37 °C, blood density is 1055 kg/, viscosity is 0.0035 Pa*s, blood gas density is 0.5542 kg/, and viscosity is 0.0000134 Pa*s, whose vaporization pressure at the corresponding temperature is −715 mmHg [18,19]. The detailed settings of the boundary conditions are shown in Table 2.
Table 2.
Settings of boundary condition.
Cavitation simulations do not consider the fact that a small amount of air may be left in the circulation because of insufficient perfusion time during surgery. In this study, an assumption was made that when cavitation occurs, only the blood and its vaporized vapor exist in the fluid. The boundary conditions were total pressure inlet, mass flow outlet, and a reference pressure of 0 atm. The volume fraction of the liquid medium was set to 1, and the volume fraction of the gaseous medium was 0. In order to improve the convergence speed of the calculation, the calculation result of the constant cavitation was used as the initial file for the calculation of the cavitation value, and the result file of each previous calculation was used as the initial file for calculation. The convergence schemes were all based on the average residuals of all control volumes in the calculation domain, and the convergence accuracy was.
3. Centrifugal Blood Pump—Left Heart Circulation System Coupling Model
3.1. Centrifugal Blood Pump Model
According to the research of Choi et al. [20], Equation (1) could be taken as the state equation of the centrifugal blood pump:
where Qx represents the flow rate of the blood pump, represents the pressure difference between the inlet and outlet of the blood pump, is the impeller speed and the values are constant.
In the study, the centrifugal blood pump has a differential pressure–flow characteristic curve, as shown in Figure 3. When the flow rate is 1, 2, 3 … 7, 8 L/min, the rotation speed is 2330, 2830, 3330, 3830, 4330, 4830 r/min, respectively.
In Figure 4, the mathematical model expression of the centrifugal blood pump was obtained by the least square method and the flow inertia equation, as shown in Equation (2).
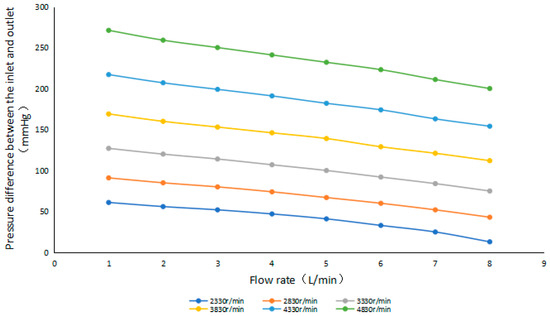
Figure 4.
Pressure difference-flow characteristic curve of the centrifugal blood pump.
3.2. Centrifugal Blood Pump–Left Heart Blood Circulation System
The left heart system is the equivalent to a circuit model. In this model, the voltage, current, resistance, capacitance, and inductance are used to represent the blood pressure, blood flow, resistance, compliance, and inertia in the blood circulation system, respectively [21]. In addition, the left atrium, right heart, and pulmonary circulation are simplified. Only one capacitive Cr is used to represent pre-load and pulmonary circulation. For the mitral and aortic valves, which control blood flow in one direction, a resistor and an ideal diode are connected in series to indicate the heart valve, where Rm and Dm represent the mitral valve and Ra and Da represent the aortic valve. The aortic compliance is represented by a capacitance Ca. The quaternary elastic cavity models Rc, Ls, Cs, and Rs are used to express the afterload [22,23]. The left ventricular elastic function model is used to control the left ventricular motion process to define the heart failure level. Grade IV heart failure ( = 0.63 mmHg/mL, = 0.05 mmHg/mL) has a heart rate of 75 beats/minute. One cardiac cycle is 0.8 s [24]. Figure 5 shows the circuit model of the left ventricular blood circulation system with a blood pump. The parameter values of the model are shown in Table 3, and the state variables are shown in Table 4 [25,26,27].
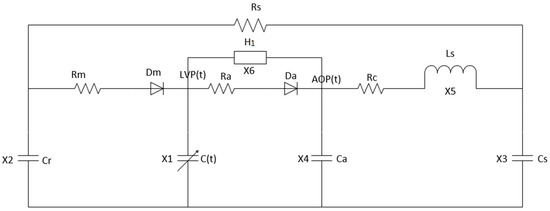
Figure 5.
The model of centrifugal blood pump—left heart blood circulation.
Table 3.
Parameters used in the model.
Table 4.
State variables of the coupled model.
According to Figure 5 and the given state variables, Kirchhoff’s law was used to list the state equations of the equivalent circuit of the model, as shown in Equation (3).
where r (ξ) is a slope function to indicate the state of the mitral and aortic valves of the heart, as shown in Equation (4):
4. Numerical Simulation Results
4.1. Numerical Simulation of a Centrifugal Blood Pump without Cavitation
4.1.1. Performance Characteristics
The performance characteristics of the centrifugal blood pump were analyzed under the rotating speed of 3330 r/min, as shown in Figure 6. The pump efficiency is defined as:
where ρ is the blood density; Q is the flow rate of the pump; H is the head of the pump; M is the torque; and ω is the angular velocity.
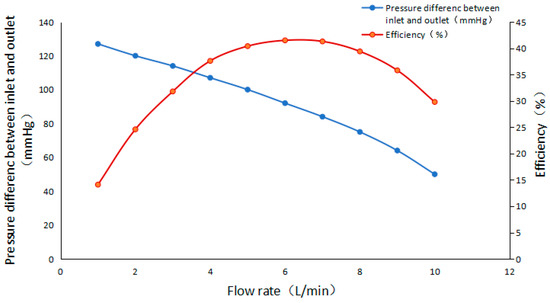
Figure 6.
Performance characteristic of the centrifugal blood pump.
As shown in Figure 6, the efficiency of the blood pump is close to the highest of 40.5% near the design flow point Q = 5 L/min, and the inlet and outlet pressure difference is 100 mmHg. The performance of the numerical calculation is similar to the performance of the design parameters, which indicates that the calculation model has high accuracy.
4.1.2. Pressure Distribution of Blade Surfaces
Figure 7 is the pressure distribution of the impeller blade surfaces under the different flow conditions of 3330 r/min. It can be clearly seen from Figure 7 that under different flow conditions, the pressure on the pressure surface of the blades is higher than the suction surface of the blades, and the low-pressure area appears in the area of the impeller inlet near the rim. As the flow increases, the pressure at the leading edge of the blade inlet gradually increases, and the pressure distribution on the blade’s working surface is more uniform at high flow, which is one of the reasons for the high efficiency of the pump at high flow Q = 6 L/min.
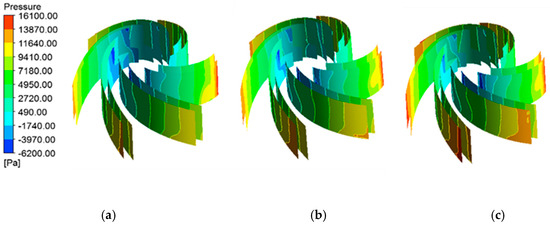
Figure 7.
Pressure distribution of blades under the different flow rates of 3330 r/min: (a) 4 L/min; (b) 5 L/min; (c) 6 L/min.
Figure 8 is the pressure distribution diagram of the impeller blade surface at different speeds of the pump, and the flow rate is 5 L/min. It can be seen from Figure 8 that as the speed increases, the pressure on the blade surface close to the leading edge of the blade decreases sharply. This is because the increase of rotating speed will increase the pump head. According to the Equation (6), the higher the rotating speed, the greater the negative pressure at the pump inlet. Cavitation will occur when the negative pressure at the pump inlet is lower than the critical cavitation pressure.
where , are the pressure at the pump inlet and outlet;, are the flow velocity of the fluid at the pump inlet and outlet; , are the inlet and outlet altitudes of the pump; is the blood density; and g is the acceleration of gravity.
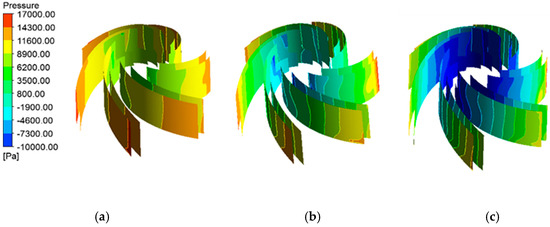
Figure 8.
Pressure distribution of blades under different speeds with the flow rate of 5 L/min: (a) ω = 2330 r/min; (b) ω = 3330 r/min; (c) ω = 4330 r/min.
4.2. Numerical Simulation of Centrifugal Blood Pump with Cavitation
4.2.1. Prediction of Cavitation Performance
The development of cavitation inside the pump can be controlled by continuously changing the inlet pressure of the pump. The effective cavitation margin of the model pump at each inlet pressure can be calculated by sorting and analyzing the numerical calculation results of the model pump at different inlet pressures. As shown in Equation (7):
Required net positive suction head () is defined in Equation (8):
where is the available net positive suction head; the is the required net positive suction head; is the inlet pressure of the pump; is the inlet velocity; is the saturated vapor pressure of the liquid; is the density of blood at 37 °C, which is 1055 kg/; is the impeller speed; is a constant; and is the acceleration due to gravity, which is 9.8.
When is less than , the cavitation occurs in the pump. In the simulation, the speed is 3330 r/min and the flow rate is 5 L/min, which remains unchanged. According to formula (7), and by continuously reducing the inlet pressure to change the , the cavitation characteristic curve of the pump under rated conditions was obtained, as shown in Figure 9. Based on relevant regulations, the effective cavitation allowance , corresponding to the pump inlet and outlet pressure difference drop of 3%, is generally taken as the critical net positive suction head () [28]. Figure 9 shows that when the effective cavitation allowance is large enough, the pump inlet and outlet pressure difference does not affect the effectivity of the cavitation allowance, which is a straight line. Thus, when the inlet pressure is large, the inlet pressure change has no effect on the pump inlet and outlet pressure difference, and when the cavitation allowance is reduced to about 0.9 m, the pump inlet and outlet pressure difference curves begin to show a downward trend. When is lower than 0.4836 m, the pump inlet and outlet pressure difference decreases sharply. This observation indicates that cavitation occurred inside the pump and developed rapidly with the decrease of pump inlet pressure.
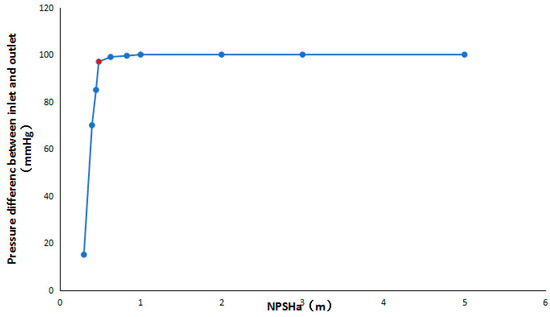
Figure 9.
Cavitation characteristics of the centrifugal blood pump.
4.2.2. Cavitation Distribution
The cavitation inception (total inlet pressure 11 kPa), not severe cavitation (total inlet pressure 10 kPa), and severe cavitation (total inlet pressure 9 kPa) were selected for analysis. In order to observe the cavitation more clearly, a gas volume fraction of 0.1 was selected on the isosurface [29]. When the flow is 5 L/min, the inlet pressure is reduced, as shown in Figure 10. The cavitation bubble inside the impeller flow channels is uneven and the phenomenon of asymmetric cavitation occurs in the impeller flow channels. This phenomenon may be caused by the asymmetry of the pressure distribution in the flow channels of the blades due to the coupling of the impeller and the pump casing [30]. In addition, the cavitation in the impeller flow channel of the pump model appears at the position of the impeller flow channel near the hub at different inlet pressures. As the inlet pressure continues to decrease, the degree of cavitation gradually increases and the bubbles gradually diffuse toward the impeller outlet [31].
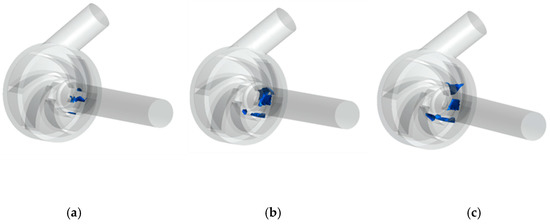
Figure 10.
Cavitation bubbles in pump impellers at different inlet pressures: (a) Pin = 11 kPa; (b) Pin = 10 kPa; (c) Pin = 9 kPa.
Figure 11 shows an isosurface with a flow volume of 5 L/min and an air bubble volume of 0.1 in the impeller flow channel at different speeds. It can be seen that under other conditions, which were unchanged, the degree of the cavitation becomes severe with the increase of the speed of the impeller. From Equations (7) and (8), the is set by an external line, regardless of pump speed. represents the anti-cavitation performance of the pump. When the flow rate is constant and ω is increased, increases, and remains unchanged. The cavitation bubbles inside the flow channels of the impeller are still distributed asymmetrically, and the positions of the cavitation distribution are consistent with the low-pressure distribution area in Figure 8.
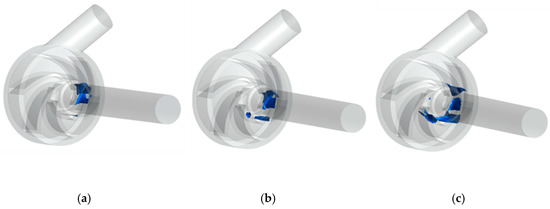
Figure 11.
Cavitation bubbles in pump impellers at different speeds: (a) ω = 2330 r/min; (b) ω = 3330 r/min; (c) ω = 4330 r/min.
5. Cavitation Characteristics Analysis Under Variable Speed
5.1. Numerical Results of Variable Speed Assist
According to the multi-scale model of the “centrifugal blood pump–left heart blood circulation system”, when the patients with grade IV heart failure reach the optimal auxiliary state, the speed curve of the centrifugal blood pump is obtained. As shown in Figure 12, the pump speed is relatively low and stable in the diastolic period. In the systolic period, the pump speed increases rapidly and decreases rapidly after reaching the maximum value, and then fluctuates slightly. During the diastole, the blood pump plays the role of closing the aortic valve, maintaining only the pressure difference between the aorta and the left ventricle, and no blood passes through. At this time, the pump speed is relatively low and stable. During systole, the blood pump plays a role in assisting the heart to deliver blood to the aorta. With the passage of blood, the speed and the blood flow increases rapidly to meet the normal physiological state of the human body that cannot be reached by heart failure.
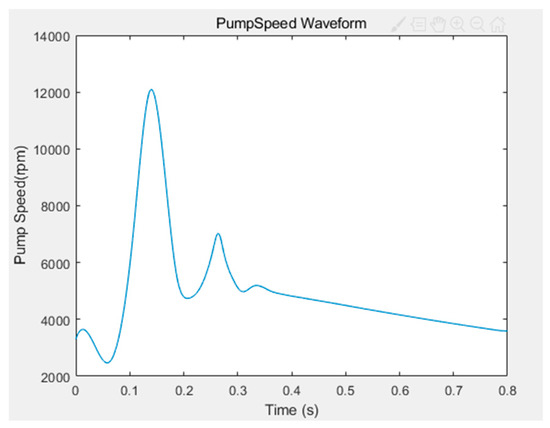
Figure 12.
The speed waveform of varying speed assistance.
Figure 13 shows the numerical results of the grade IV heart failure model assisted by the variable speeds of the centrifugal blood pump. The figure shows the pressure and flow waveforms of the aorta in normal physiology, grade IV heart failure and grade IV heart failure with pump. It can be seen from Figure 13 that both aortic pressure and flow are greatly improved under the assistance of the centrifugal blood pump, and the trend is close to the normal physiological state under the assistance of variable speed. During the entire cardiac cycle, the variable speed assist changes its aortic flow and aortic pressure values, which may vary between 0 and 500 mL/s, and 75 and 115 mmHg, respectively.
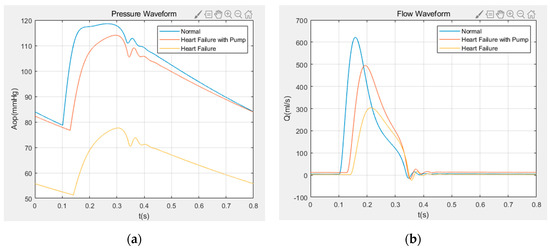
Figure 13.
Hemodynamic waveform of heart failure class IV: (a) aortic pressure waveform; (b) aortic flow waveform.
5.2. Cavitation Characteristics under Variable Speed
According to the hemodynamic numerical results obtained with the aid of variable speed, a characteristic time point was selected in each of the four stages of a cardiac cycle, to carry out numerical simulation of the centrifugal blood pump. The corresponding characteristic time points were 0.05 s in the isovolumic contraction phase, 0.16 s in the ejection period, 0.35 s in the isovolumic relaxation phase, and 0.5 s in the filling period. Among them, the characteristic time point of t = 0.16 s was not only the point taken during the ejection period, but also the point where the pump rotation speed was large during the variable speed assist.
Figure 14 shows the impeller pressure distribution at different characteristic time points in a cardiac cycle, when the centrifugal blood pump was assisted with variable speed under the condition of grade IV heart failure. Figure 14 shows that blade pressure distribution is generally high during the isovolumic contraction phase. At this time, the flow speed of the centrifugal blood pump is small. Although the pressure at the inlet of the impeller is low, the pressure is higher than the saturated vapor pressure of blood. Cavitation will not occur during this period. In the isovolumic relaxation phase and filling period, the flow rates were 6 and 10 mL/s, which were not much different from the rates at the isovolumic contraction phase. However, the rotation speed is slightly larger than the isovolumic contraction phase. The pressure distribution of the whole blade is similar to the isovolumic contraction phase, but slightly lower than that of the whole period. In the ejection phase, the flow rate was 420 mL/s, and the speed was 11,500 r/min. The flow rate and rotation speed were higher than other periods. At this time, the pressure difference on the impeller is large, and the pressure in the area near the rim of the impeller inlet is the lowest [32]. Cavitation will occur when the pressure is lower than the saturated vapor pressure of the blood.
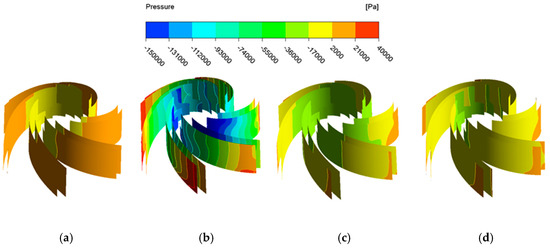
Figure 14.
Pressure distribution of blades with variable speed: (a) t = 0.05 s; (b) t = 0.16 s; (c). t = 0.35 s; (d) t = 0.5 s.
The ejection period was selected according to the isosurface with a vacuole volume fraction of 0.1, as shown in Figure 15a. It can be seen that severe cavitation occurred during this period. The outlet flow channel was blocked almost completely by air bubbles. The degree of hemolysis is related to exposure time and shear stress. Red blood cells are easily broken by high shear stress, which causes hemoglobin to overflow and lose its oxygen-carrying capacity. Equation (9) is a model for predicting the degree of hemolysis [33,34].
where Hb is the hemoglobin concentration, is the increased plasma free hemoglobin concentration, is the shear stress on the red blood cells, and is the exposure time.
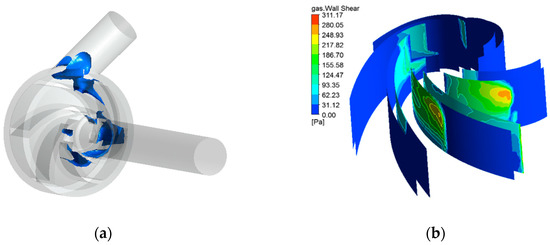
Figure 15.
Results of ejection phase calculation: (a) cavitation bubble distribution; (b) wall shear stress distribution.
Figure 15b shows the wall shear stress generated by the cavitation of the centrifugal blood pump impeller during the ejection period, which is distributed mainly in the contact part between the bubble and the pump body. The maximum shear stress reached above 300 Pa, which did not include the wall shear stress generated by the fluid part of the centrifugal blood pump. Larger shear stresses can damage blood cells and reduce blood compatibility.
6. Conclusions
Cavitation of the blood pump not only causes damage to the over-flow components, but also destroys the blood cells, which is important in the safe operation of the ventricular assist device. In this study, a self-developed centrifugal blood pump was used as the research model. Through CFD and MATLAB simulation, the pressure and cavitation distribution in the centrifugal blood pump were analyzed, and the model of the centrifugal blood pump—left heart blood circulation system was established. The speed control equation was proposed, and the speed changing curve of the variable speed contributed when the optimal assist state was reached under the condition of level IV heart failure. The following conclusions were drawn, based on the results of the analysis of the distribution of pressure, cavitation bubble, and wall shear stress at characteristic time points of the centrifugal blood pump during variable speed assist:
- (1).
- As the inlet pressure decreases, the cavitation in the impeller flow channel of the centrifugal blood pump appears near the hub of the impeller flow channel. Then, as the inlet pressure decreases further, the degree of cavitation increases gradually and the bubbles develop towards the impeller outlet.
- (2).
- With the increase of impeller speed, the cavitation degree in the passage of the centrifugal blood pump increases accordingly, and the bubbles produced by cavitation distribute asymmetrically in the impeller.
- (3).
- The obtained hemodynamic results show that the aortic flow rate and the aortic pressure pulsatility, obtained by variable speed assist in the case of heart failure, are significantly improved.
- (4).
- In a cardiac cycle assisted by the variable speed of the centrifugal blood pump, cavitation is most likely to occur during ejection and most unlikely to occur during isovolumetric contraction. Cavitation not only affects the working performance of the pump but also generates large shear stress, which increases the chances of hemolysis.
In this paper, the cavitation flow phenomenon of a centrifugal blood pump assisted by variable speed is studied by numerical simulation. This study provides theoretical and data reference to improve the stability, service life, and blood compatibility of centrifugal blood pumps for further clinical application.
Author Contributions
Conceptualization, T.J. and F.W. Methodology, T.J. and L.Z. Software, Y.C. and W.B. Writing—original draft, Y.C. and L.Z. Writing—review and editing, T.J., F.W. and Y.C. All authors have read and agreed to the published version of the manuscript.
Funding
This work was supported by the National Natural Science Foundation of China (Grant No. 31600794, 51677082); Nature Science Foundation for Excellent Young Scholars of Jiangsu Province (Grant No. BK20190101); and the Six Talent Peaks Project of Jiangsu Province (Grant No. KTHY-030).
Conflicts of Interest
The authors declare no conflict of interest.
Nomenclature
| Qx | flow rate of the blood pump (L/min) |
| constant | |
| mitral valve resistance | |
| aortic resistance | |
| left atrial compliance | |
| aortic compliance | |
| aortic blood inertia | |
| aortic valve | |
| left atrial pressure (mmHg) | |
| aortic pressure (mmHg) | |
| pump flow (mL/s) | |
| torque (N·m) | |
| inlet pressure (Pa) | |
| inlet flow velocity (m/s) | |
| inlet height of the pump (m) | |
| liquid density (kg/) | |
| available net positive suction head (m) | |
| critical net positive suction head (m) | |
| saturated vapor pressure of the liquid (mmHg) | |
| Hb | hemoglobin concentration (g/L) |
| τ | shear stress on the red blood cells (Pa) |
| pressure difference between the inlet and outlet of the blood pump (Pa) | |
| ω | speed (r/min) |
| Ra | aortic valve resistance |
| systemic vascular resistance | |
| left ventricular compliance | |
| peripheral vascular compliance | |
| mitral valve | |
| left ventricular pressure (mmHg) | |
| arterial pressure (mmHg) | |
| aortic flow (mL/s) | |
| efficiency (%) | |
| angular velocity (rad/s) | |
| outlet pressure (Pa) | |
| outlet flow velocity (m/s) | |
| outlet height of the pump (m) | |
| g | acceleration of gravity () |
| required net positive suction head(m) | |
| constant | |
| centrifugal blood pump | |
| ∆Hb | increased plasma free hemoglobin concentration (g/L) |
| exposure time (s) |
References
- Simaan, M.A.; Ferreira, A.; Chen, S.; Antaki, J.F.; Galati, D.G. A Dynamical State Space Representation and Performance Analysis of a Feedback-Controlled Rotary Left Ventricular Assist Device. IEEE Trans. Control Syst. Technol. 2009, 17, 15–28. [Google Scholar] [CrossRef]
- Bai, L.; Zhou, L.; Jiang, X.; Pang, Q.; Ye, D. Vibration in a multistage centrifugal pump under varied conditions. Shock Vib. 2019, 2057031. [Google Scholar] [CrossRef]
- Wu, Y.; Allaire, P.; Tao, G.; Wood, H.; Olsen, D.; Tribble, C. An Advanced Physiological Controller Design for a Left Ventricular Assist Device to Prevent Left Ventricular Collapse. Artif. Organs 2003, 27, 926–930. [Google Scholar] [CrossRef]
- Konishi, H.; Antaki, J.F.; Amin, D.V.; Boston, J.R.; Kerrigan, J.P.; Mandarino, W.A.; Litwak, P.; Yamazaki, K.; Macha, M.; Butler, K.C.; et al. Controller for an Axial Flow Blood Pump. Artif. Organs 1996, 20, 618–620. [Google Scholar] [CrossRef]
- Brennen, C.E. Hydrodynamics of Pumps; Cambridge University Press: Cambridge, UK, 2011. [Google Scholar]
- Lokhandwalla, M.; McAteer, J.A.; Williams Jr, J.C.; Sturtevant, B. Mechanical haemolysis in shock wave lithotripsy (SWL): II. In vitro cell lysis due to shear. Phys. Med. Biol. 2001, 46, 1245–1264. [Google Scholar] [CrossRef]
- Walker, W. Cavitation in pulsatile blood pumps. Adv. Bioeng. 1974, 1, 148–150. [Google Scholar]
- Walker, W.F. Pulsatile blood pump induced cavitation. In Proceedings of the 27th Annual Conference on Engineering in Medicine and Biology, San Francisco, CA, USA, 23–27 July 1974; Volume 16, p. 53. [Google Scholar]
- Freed, D.; Walker, W.F.; Dube, C.M.; Tokuno, T. Effects of vaporous cavitation near prosthetic surfaces. Trans. Am. Soc. Artif. Intern. Organs 1981, 27, 105–109. [Google Scholar]
- Lin, Z.; Xiaodong, R.; Zou, J.; Fu, X. Experimental Study of Cavitation Phenomenon in a Centrifugal Blood Pump Induced by the Failure of Inlet Cannula. Chin. J. Mech. Eng. 2014, 27, 165–170. [Google Scholar] [CrossRef]
- Kijima, T.; Oshiyama, H.; Horiuchi, K.; Nogawa, A.; Hamasaki, H.; Amano, N.; Nojiri, C.; Fukasawa, H.; Akutsu, T. A Straight Path Centrifugal Blood Pump Concept in the Capiox Centrifugal Pump. Artif. Organs 1993, 17, 593–598. [Google Scholar] [CrossRef]
- Medvitz, R.B.; Kunz, R.F.; Boger, D.A.; Lindau, J.W.; Yocum, A.M.; Pauley, L.L. Performance Analysis of Cavitating Flow in Centrifugal Pumps Using Multiphase CFD. J. Fluids Eng. 2002, 124, 377–383. [Google Scholar] [CrossRef]
- Wang, Y.; Yang, M.; Xu, Z.; Zhuang, X.; Li, Q.; Xu, L. Hemodynamic analysis of a centrifugal blood pump. Chin. J. Med Instrum. 2015, 39, 16–20. [Google Scholar]
- Procedure for Estimation and Reporting of Uncertainty Due to Discretization in CFD Applications. J. Fluids Eng. 2008, 130, 078001. [CrossRef]
- Barrio, R.; Blanco, E.; Parrondo, J.; González, J.; Fernández, J. The effect of impeller cutback on the fluid-dynamic pulsations and load at the blade-passing frequency in a centrifugal pump. Trans. ASME J. Fluids Eng. 2008, 130, 1–11. [Google Scholar] [CrossRef]
- Zhou, L.; Deshpande, K.; Zhang, X.; Agarwal, R. Process Simulation of Chemical Looping Combustion using ASPEN Plus for a Mixture of Biomass and Coal with Various Oxygen Carriers. Energy 2020, 195, 116955. [Google Scholar] [CrossRef]
- Untaroiu, A.; Throckmorton, A.L.; Patel, S.M.; Wood, H.G.; Allaire, P.E.; Olsen, D.B. Numerical and Experimental Analysis of an Axial Flow Left Ventricular Assist Device: The Influence of the Diffuser on Overall Pump Performance. Artif. Organs 2005, 29, 581–591. [Google Scholar] [CrossRef]
- Lee, H.; Taenaka, Y. Characteristics of Mechanical Heart Valve Cavitation in a Pneumatic Ventricular Assist Device. Artif. Organs 2008, 32, 453–460. [Google Scholar] [CrossRef]
- Graf, T.; Reul, H.; Detlefs, C.; Wilmes, R.; Rau, G. Causes and formation of cavitation in mechanical heart valves. J. Heart Valve Dis. 1994, 3, S49–S64. [Google Scholar]
- Choi, S.; Boston, J.R.; Thomas, D.; Antaki, J.F. Modeling and identification of an axial flow blood pump. In Proceedings of the 1997 American Control Conference, Albuquerque, NM, USA, 6 June 1997; pp. 3714–3715. [Google Scholar]
- Gu, K.; Chang, Y.; Gao, B.; Liu, Y.; Zhang, Z.; Wan, F. Lumped Parameter Model for Heart Failure with Novel Regulating Mechanisms of Peripheral Resistance and Vascular Compliance. ASAIO J. 2012, 58, 223–231. [Google Scholar] [CrossRef]
- Deswysen, B.; Charlier, A.A.; Gevers, M. Quantitative evaluation of the systemic arterial bed by parameter estimation of a simple model. Med Biol. Eng. Comput. 1980, 18, 153–166. [Google Scholar] [CrossRef]
- He, Z.; Liu, Y.; Jing, T.; Zhang, G.; Liu, H.; Wang, H. Heart valve model with controllable closing volume. J. Drain. Irrig. Mach. Eng. 2019, 37, 1–6. [Google Scholar]
- Suga, H. Cardiac energetics: From Emax to pressure-volume area. Clin. Exp. Pharmacol. Physiol. 2003, 30, 580–585. [Google Scholar] [CrossRef]
- Yu, Y.C.; Boston, J.R.; Simaan, M.A.; Antaki, J.F. Estimation of systemic vascular bed parameters for artificial heart control. IEEE Trans. Autom. Control 1998, 43, 765–778. [Google Scholar]
- Zhou, B.; Zhang, G.; Jing, T.; Wang, H.; He, Z. Numerical simulation on hemolysis induced by two-stage axial-flow blood pump during pulsating heart failure. J. Drain. Irrig. Mach. Eng. 2018, 36, 28–34. [Google Scholar]
- Zhu, Y.; Tang, S.; Quan, L.; Jiang, W.; Zhou, L. Extraction method for signal effective component based on extreme-point symmetric mode decomposition and Kullback-Leibler divergence. J. Brazil. Soc. Mech. Sci. Eng. 2019, 41, 100. [Google Scholar] [CrossRef]
- Bachert, R.; Stoffel, B.; Dular, M. Unsteady cavitation at the tongue of the volute of a centrifugal pump. Trans. ASME J. Fluids Eng. 2010, 132, 1–6. [Google Scholar] [CrossRef]
- Hong, F.; Yuan, J.; Zhang, J.; Lu, J.; Zhang, Y. Numerical analysis of cavitating flow characteristics in residual heat removal pumps during the SBLOCA. J. Harbin Eng. Univ. 2015, 36, 297–301. [Google Scholar]
- Bai, L.; Zhou, L.; Han, C.; Zhu, Y.; Shi, W. Numerical study of pressure fluctuation and unsteady flow in a centrifugal pump. Processes 2019, 7, 354. [Google Scholar] [CrossRef]
- Jiang, X.; Wang, L.; Zhou, L.; Li, W.; Wang, C. Transient response analysis of cantilever multistage centrifugal pump based on multi-source excitation. J. Low Freq. Noise Vib. Act. Control 2020, 1–17. [Google Scholar] [CrossRef]
- Li, W.; Li, E.; Ji, L.; Zhou, L.; Shi, W.; Zhu, Y. Mechanism and propagation characteristics of rotating stall in a mixed-flow pump. Renew. Energy 2020. [Google Scholar] [CrossRef]
- Giersiepen, M.; Wurzinger, L.J.; Opitz, R.; Reul, H. Estimation of shear stress-related blood damage in heart valve prostheses—In vitro comparison of 25 aortic valves. Int. J. Artif. Organs 1990, 13, 300. [Google Scholar] [CrossRef]
- Wang, F.; Lan, L.; Feng, Z.; Qian, K. Prediction of shear stress-related hemolysis in centrifugal blood pumps by computational fluid dynamics. Prog. Nat. Sci. 2005, 15, 951–955. [Google Scholar]


© 2020 by the authors. Licensee MDPI, Basel, Switzerland. This article is an open access article distributed under the terms and conditions of the Creative Commons Attribution (CC BY) license (http://creativecommons.org/licenses/by/4.0/).