Article

Modification of Conventional Sugar Juice Evaporation Process for Increasing Energy Efficiency and Decreasing Sucrose Inversion Loss

by
Somchart Chantasiriwan
Department of Mechanical Engineering, Thammasat University, Pathum Thani 12121, Thailand
Processes 2020, 8(7), 765; https://doi.org/10.3390/pr8070765
Submission received: 15 June 2020 / Revised: 27 June 2020 / Accepted: 28 June 2020 / Published: 30 June 2020

Abstract

:
The evaporation process, boiler, and turbine are the main components of the cogeneration system of the sugar factory. In the conventional process, the evaporator requires extracted steam from the turbine, and bled vapor from the evaporator is supplied to the juice heater and the pan stage. The evaporation process may be modified by using extracted steam for the heating duty in the pan stage. This paper is aimed at the investigation of the effects of this process modification. Mathematical models of the conventional and modified processes were developed for this purpose. It was found that, under the conditions that the total evaporator area is 13,000 m2, and the inlet juice flow rate is 125 kg/s, the optimum modified evaporation process requires extracted steam at a pressure of 157.0 kPa. Under the condition that the fuel consumption rate is 21 kg/s, the cogeneration system that uses the optimum modified evaporation process yields 2.3% more power output than the cogeneration system that uses a non-optimum conventional cogeneration process. Furthermore, sugar inversion loss of the optimum modified process is found to be 63% lower than that of the non-optimum conventional process.

1. Introduction

The evaporation process, boiler, and steam turbine are the main components of the cogeneration system in the sugar industry. Diluted sugar juice becomes raw sugar and molasses in the evaporation process after a specified amount of water is removed by evaporation. Thermal energy required for water evaporation is provided by steam condensation. The boiler generates high-pressure steam that is supplied to the steam turbine for power generation. Older cogeneration systems use the back-pressure turbine, in which steam is exhausted at a lower pressure, whereas modern cogeneration systems use the extraction–condensing steam turbine, in which some steam is extracted at lower pressure, and the remaining steam is sent to the condenser. Kamate and Gangavati [1] have shown that a cogeneration system using the extraction–condensing steam turbine is more energy efficient than a cogeneration system using the back-pressure steam turbine.
The multiple-effect evaporator is used in the evaporation process. The evaporator is designed to increase the juice concentration from approximately 15% to 70%. The removal of the remaining water content in sugar occurs in the pan stage. The multiple-effect evaporator requires a supply of saturated steam extracted from an extraction–condensing steam turbine at a specified pressure. An adverse consequence of the exposure of sugar juice to high-temperature steam and vapor in the multiple-effect evaporator is sucrose inversion loss, which converts sucrose to glucose and fructose. In order to increase the profitability of raw sugar manufacturing, the amount of required steam and sugar inversion loss should be minimized without compromising the capacity of the process. There have been several suggestions to improve the energy efficiency of the evaporation process. Urbaniec et al. [2] have suggested that heat recovery can be improved by retrofitting the evaporation process. Ensinas et al. [3] have used a thermo-economic procedure to reduce steam consumption by the evaporation process. An analysis by Higa et al. [4] shows that increasing the number of effects can decrease steam consumption. Bapat et al. [5] have shown that steam consumption can be reduced by using heat recovery devices. Sharan and Bandyopadhyay [6] have shown that steam consumption by the entire plant can be minimized by integrating the evaporator with the background process. Mechanical vapor compression [7] and thermal vapor compression [8] have been suggested as methods to increase the energy efficiency of the multiple-effect evaporator. The energy efficiency of the multiple-effect evaporator can also be increased by the optimum distribution of heating surface areas [9,10,11,12]. Recently, Chantasiriwan has shown that the energy efficiency of the cogeneration system, in which the evaporation process is a component, can be increased by replacing the forward-feed evaporator with the backward-feed evaporator [13]. Investigations of sucrose inversion loss in sugar juice evaporation process have yielded conclusions that increased time between cleanings of the evaporator results in more inversion loss [14]; inversion loss may be reduced by replacing Robert evaporators with falling-film evaporators [15]; and using smaller diameter and longer tubes decrease inversion loss due to shorter residence time of juice in the evaporator [16]. In addition, Rein [17] has suggested that decreasing the temperature profile across the effects of the evaporator can also reduce inversion loss.
Energy efficiency of the evaporation process can be improved not only by reducing the steam consumption of a given pressure, which is the subject of most of the previous investigations, but also by decreasing extracted steam pressure. There is a lower limit of extracted steam pressure because the thermal energy input required for an evaporation process is approximately equal to the product of the total heating surface area of the evaporator and the difference between the steam temperature at the evaporator inlet and the vapor temperature at the evaporator outlet. The lower limit can be decreased by increasing the total heating surface area. Furthermore, it is interesting to note that vapor is usually bled from the first effect of the multiple-effect evaporator in order to be used for heating duty in the pan stage. This requirement imposes an additional constraint on the lower limit of the extracted steam pressure. It is possible to remove this constraint by using extracted steam instead of bled vapor for this purpose. A consequence of this constraint removal is further reduction of extracted steam pressure. Reduced extracted steam pressure results in not only higher energy efficiency but also lower sucrose inversion loss due to decreased temperature profile across the effects of the evaporator [17].
In this paper, the performance of the conventional process, in which vapor bled from the multiple-effect evaporator is used for the pan stage, is compared with that of a modified sugar juice evaporation process, which uses extracted steam instead of bled vapor for heating duty in the pan stage. Mathematical models of the conventional and modified processes are presented in Section 2 and Section 3. Both processes operate in cogeneration systems described in Section 4. Section 5 shows that, under the same conditions, differences in energy efficiency and sucrose inversion loss can be attributed to the process modification.

2. Conventional Evaporation Process

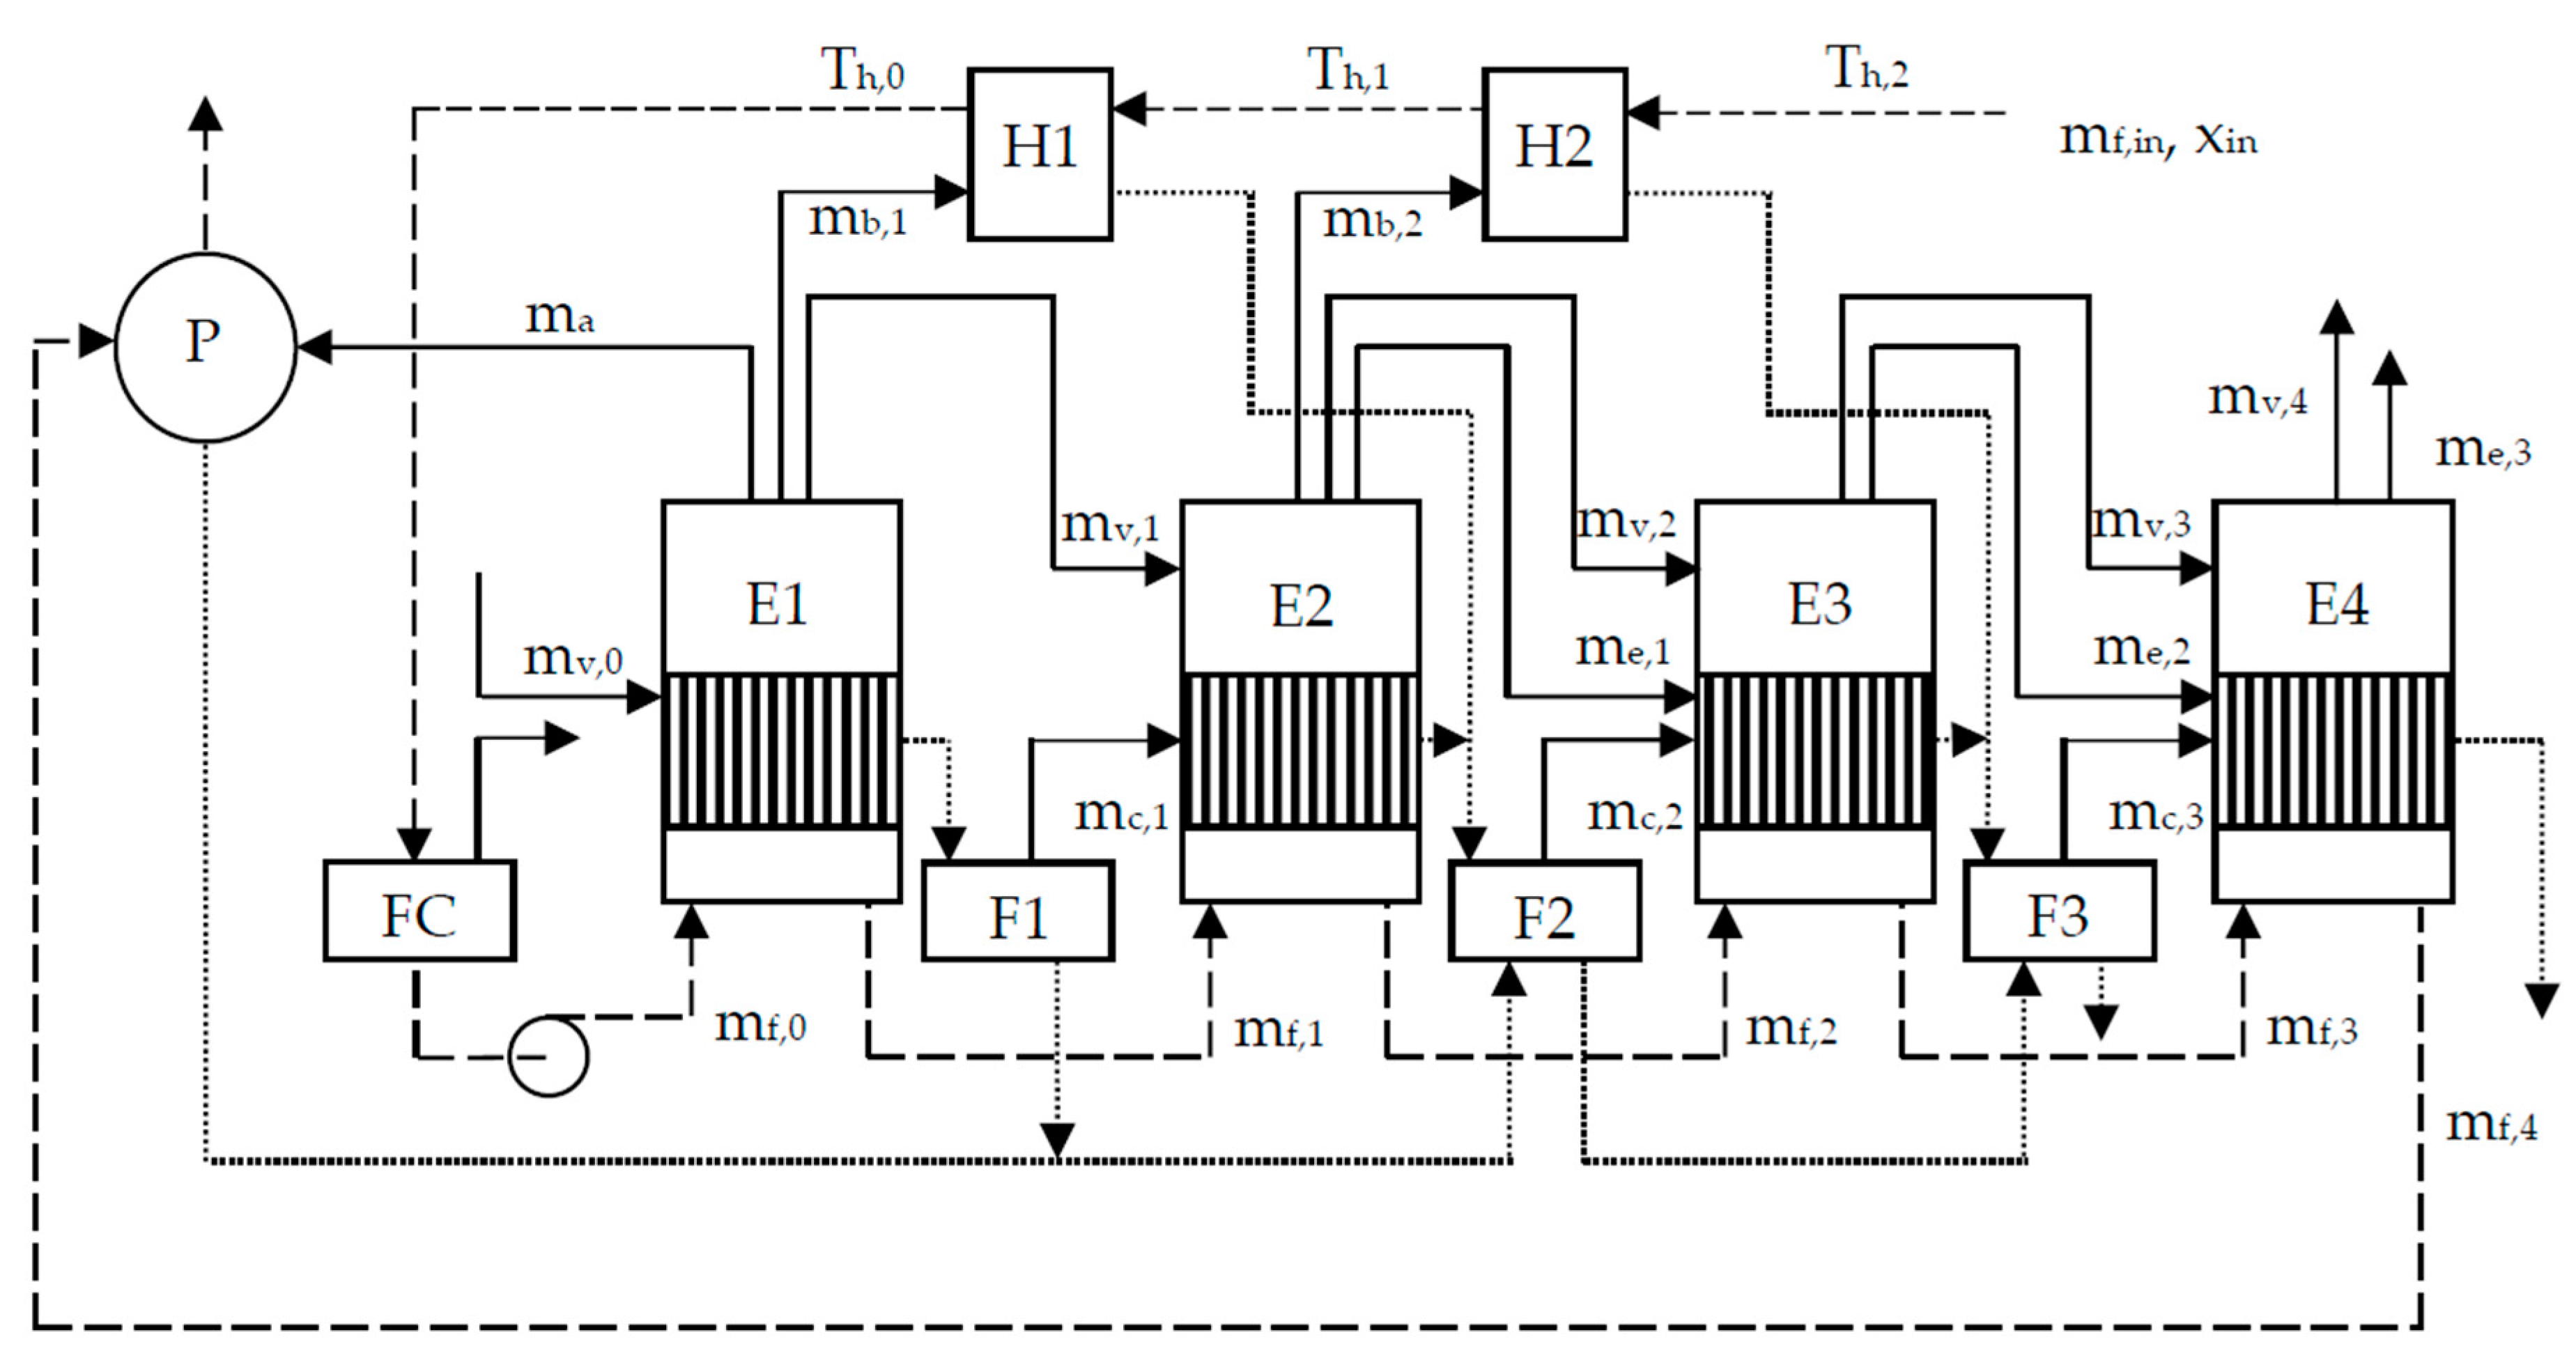
The conventional sugar juice evaporation process is shown in Figure 1. The components of the process are 4 effects of the evaporator (E1, E2, E3, and E4), 2 heat exchangers of the juice heater (H1 and H2), the flash tanks (FC, F1, F2, and F3), and the pan stage (P). Sugar juice at the ambient temperature (Th,2) is heated in H2 and H1 to the saturation temperature (Th,0), which is 103 °C. This temperature corresponds to a pressure slightly larger than the atmospheric pressure (patm). Juice pressure is decreased to patm in FC before entering E1. Sugar juice and saturated steam or vapor flow from E1 to E4. The steam turbine (not shown in Figure 1) supplies extracted steam at pressure p0 to E1. Vapor from E1 is sent to P, H1, and E2. Vapor from E2 is sent to H2 and E3. Vapor from E3 is sent to E4. Vapor from E4 is sent to the condenser (not shown in Figure 1). In effect i, water evaporation at pressure pi+1 is caused by vapor condensation at pressure pi. Concentrated sugar juice from E4 is sent to P.
In order to improve the energy efficiency of the process, condensates from E1, E2, and E3 are sent, respectively, to F1, F2, and F3. F2 also receives condensates from P, F1, and H1, and F3 also receives condensates from F2 and H2. Flash tanks (F1, F2, and F3) produce vapor and condensate at a lower pressure from condensate at a higher pressure.
The model of the conventional evaporation process in Figure 1 is similar to the model presented by Chantasiriwan [13]. The difference between the two models is the treatment of condensate from E1. In the model presented by Chantasiriwan [13], the condensate is sent to the boiler. In the model shown in Figure 1, the condensate is sent to F1. It can be shown that this treatment increases the overall energy efficiency of the process.
Due to the similarity between this model and the model presented by Chantasiriwan [13], only different equations are shown for the sake of concise presentation. The different treatment of condensate in this paper gives rise to the following energy equations:
( 1 ε ) ( m v , 0 m x , 0 ) h v l ( p 0 ) + m f , 0 ( h f , 1 ( i n ) h f , 1 ( o u t ) ) = ( m a + m v , 1 + m b , 1 ) [ h v ( p 1 ) h f , 1 ( o u t ) ] ,
( 1 ε ) ( m v , 1 + m c , 1 ) h v l ( p 1 ) + m f , 1 ( h f , 2 ( i n ) h f , 2 ( o u t ) ) = ( m v , 2 + m b , 2 ) [ h v ( p 2 ) h f , 2 ( o u t ) ] ,
( 1 ε ) ( m v , 2 + m e , 1 + m c , 2 ) h v l ( p 2 ) + m f , 2 ( h f , 3 ( i n ) h f , 3 ( o u t ) ) = m v , 3 [ h v ( p 3 ) h f , 3 ( o u t ) ] ,
( 1 ε ) ( m v , 3 + m e , 2 + m c , 3 ) h v l ( p 3 ) + m f , 3 ( h f , 4 ( i n ) h f , 4 ( o u t ) ) = m v , 4 [ h v ( p 4 ) h f , 4 ( o u t ) ] ,
m c , 1 = m v , 0 f ( p 0 , p 1 ) ,
m c , 2 = ( m v , 0 + m v , 1 + m b , 1 + m a ) f ( p 1 , p 2 ) ,
m c , 3 = ( m v , 0 + m a + m v , 1 + m b , 1 + m v , 2 + m b , 2 + m e , 1 ) f ( p 2 , p 3 ) .
Expressions for the other parameters are the same as those in the model presented by Chantasiriwan [13], and an interested reader is asked to consult that reference. The heat transfer equations in this model are also slightly different from those in the model presented by Chantasiriwan [13]. They are shown as follows.
U 1 ( A 1 A x , 0 ) [ T s a t ( p 0 ) T f , 1 ( o u t ) ] = ( 1 ε ) ( m v , 0 m x , 0 ) h v l ( p 0 ) .
U 2 A 2 [ T s a t ( p 1 ) T f , 2 ( o u t ) ] = ( 1 ε ) ( m v , 1 + m c , 1 ) h v l ( p 1 ) ,
U 3 A 3 [ T s a t ( p 2 ) T f , 3 ( o u t ) ] = ( 1 ε ) ( m v , 2 + m e , 1 + m c , 2 ) h v l ( p 2 ) ,
U 4 A 4 [ T s a t ( p 3 ) T f , 4 ( o u t ) ] = ( 1 ε ) ( m v , 3 + m e , 2 + m c , 3 ) h v l ( p 3 ) .

3. Modified Evaporation Process

The conventional evaporation process uses bled vapor from the first effect of the evaporator for the pan stage. A consequence of this requirement is that the extracted steam pressure (p0) must not be lower than the minimum value that corresponds to a specified juice mass flow rate. It is possible to remove this constraint by using extracted steam instead of bled vapor for the pan stage in the modified evaporation process.
The modified evaporation process is depicted in Figure 2. It can be seen that extracted steam at pressure pa is supplied to the pan stage. The model of this process is the same as that of the conventional process with ma deleted from Equation (1). The mass flow rate of extracted steam required by the pan stage is
m a = 2 m f , 4 ( 1 x 4 / 91 ) h v l ( p 4 ) h v l ( p a ) .
It is interesting to note that, under the same operating conditions, mf,4, x4, and p4 of the modified and conventional evaporation processes are identical. Therefore, the values of ma of both processes are the same if pa = 150 kPa.

4. Performance Parameters

This paper is intended to demonstrate that the modified evaporation process requires extracted steam at a lower pressure than the conventional evaporation process, which leads to the enhanced performance of the modified evaporation process compared with the conventional process. Comparison between both processes is based on two performance parameters, which are turbine power output of the cogeneration system and sucrose inversion loss.

4.1. Turbine Power Output

Steam economy is the performance parameter that may be used to evaluate the energy efficiency of an evaporation process. It is equal to the ratio of the mass flow rate of evaporated water to the mass flow rate of extracted steam. Therefore,
S E = 2 m f , i n ( 1 x 4 / 91 ) m v , 0
for the conventional evaporation process, and
S E = 2 m f , i n ( 1 x 4 / 91 ) m v , 0 + m a
for the modified evaporation process.
Steam economy is an appropriate parameter for comparing different conventional evaporation processes because the extracted steam pressure in the first effect of the multiple-effect evaporator is fixed. The process having larger steam economy is considered to be more energy efficient. However, steam economy should not be used to compare the conventional and modified evaporation processes because extracted steam pressures in both processes may be different. To identify a more suitable performance parameter, it is necessary to consider the cogeneration system.
The cogeneration systems for the conventional and modified evaporation processes are depicted in Figure 3. In each system, the mass flow rate, pressure, and temperature of steam generated by the boiler (B) are, respectively, ms, ps, Ts. Steam is extracted at the pressure of p0 in the conventional evaporation process. The mass flow rate of extracted steam is mv,0. The extracted steam is used for evaporation in the first effect of the evaporator. The remaining steam is condensed at the pressure of pc. The mass flow rate of condensed steam (mc) is, therefore, msmv,0. The modified evaporation process requires not only extracted steam at the pressure of p0 for evaporation in the first effect of the evaporator but also extracted steam at the pressure of pa for evaporation in the pan stage. The corresponding mass flow rates of extracted steam are mv,0 and ma. The remaining steam is condensed at the pressure of pc. The mass flow rate of condensed steam (mc) is, therefore, msmv,0ma.
Inspection of Figure 3 reveals that the inputs of both systems are sugar juice and bagasse, and the outputs are turbine power, sugar, and molasses. Both systems are assumed to have the same juice processing capacity. This means that mf,in, xin, and x4 are the same in both the conventional evaporation process and the modified evaporation process. Moreover, both systems are assumed to consume the same amount of fuel (mfuel) in their boilers. Based on these assumptions, the only difference between both systems is turbine power output, which is expressed as
P = m v , 0 ( h s h 0 ) + m a ( h s h a ) + m c ( h s h c ) ,
h 0 = h s η t ( h s h 0 s ) ,
h a = h s η t ( h s h a s ) ,
h c = h s η t ( h s h c s ) ,
where ηt is isentropic efficiency of the steam turbine, hs is specific enthalpy at pressure ps, and temperature Ts, h0s, has, and hcs are specific enthalpies at, respectively, pressures p0, pa, and pc, and the same entropy as the inlet steam. It should be noted that ma is zero in the cogeneration system for the conventional evaporation process.

4.2. Sucrose Inversion Loss

Sucrose inversion is the chemical reaction that transforms sucrose into glucose and fructose, which do not crystallize and cannot be recovered as sugar. Main factors that influence sucrose inversion in the multiple-effect evaporator are temperature, time, juice acidity, and juice concentration. Sucrose inversion loss may be estimated by using the Vukov model [18]. According to this model, the mass fraction of lost sucrose is expressed as
I = 1 e k t ,
where t is retention time (in minutes) of sugar juice in an evaporator vessel. The reaction rate (k) is determined from
log k = 16.91 log [ ρ ( 100 x ) 100 ] 5670 T f p H .
Equation (20) is applicable when the juice temperature is 25 °C. At a different temperature, the corrected pH value is
p H = p H 25 + ( T f 25 ) ( 0.0339 + 0.015 p H 25 0.0017 p H 25 2 ) .
For simulation purposes, pH25 is assumed to be 6.0. The retention time (t) is proportional to the evaporator surface area (A), and inversely proportional to sugar juice mass flow rate (mf). It may be approximated by assuming that sugar juice flows through N tubes, of which diameter and length are D and L, in an evaporator vessel at the speed of V. The expression of V is
V = 4 m f N ρ π D 2 .
Consequently,
t = N ρ π D 2 L 240 m f .
If tube thickness is negligible, the heating surface of the evaporator vessel (A) is NπDL, and Equation (23) becomes
t = ρ D A 240 m f .
Typical tube diameter varies from 38 to 51 mm. It is assumed that D is 45 mm in this paper.

5. Results and Discussion

The parameters of both evaporation processes are xin = 15%, xout = 70%, p4 = 16 kPa, and Th,2 = 30 °C. In each process, the total surface areas of the multiple-effect evaporator and the juice heater are, respectively, 13,000 and 2500 m2. Multiple-effect evaporators in both systems are designed to process 125 kg/s (or 450 t/h) of juice. The optimum distribution of the total evaporator surface area that maximizes the steam economy at a specified extracted steam pressure (p0) may be determined for each system.
The procedure for determining the optimum distribution of the evaporator surface area in the conventional evaporation process that maximizes the steam economy (SE) is shown in Figure 4. Figure 4a shows that, for the first-effect area (A1) of 6000 m2 and the second-effect area (A2) of 1200 m2, the optimum value of the third-effect area (A3) that yields the required juice mass flow rate of 125 kg/s and the maximum steam economy (SE) is 1233 m2. Figure 4b shows that, for the same value of A1, the optimum value of A2 that results in maximum SE is 1251 m2. Figure 4c shows that, as A1 increases, SE decreases, and first-effect pressure (p1) increases. By requiring that p1 is 150 kPa, the optimum value of A1 is found to be 4518 m2. The corresponding value of SE is 2.508. Therefore, the mass flow rate of extracted steam for the evaporator (mv,0) is 41.63 kg/s.
The procedure for determining the optimum distribution of evaporator surface area in the modified evaporation process that maximizes SE is shown in Figure 5. Figure 5a shows that, for the first-effect area (A1) of 4000 m2 and the second-effect area (A2) of 1100 m2, the optimum value of the third-effect area (A3) that yields the required juice mass flow rate of 125 kg/s and the maximum SE is 1723 m2. Figure 5b shows that, for the same value of A1, the optimum value of A2 that results in the maximum SE is 1342 m2. Figure 5c shows the optimum value of A1 that results in the maximum SE is 2074 m2. The corresponding value of SE is 2.345. Since the mass flow rate of juice leaving E4 (mf,4) is 26.79 kg/s, and the mass flow rate of extracted steam for the pan stage (ma) is 13.16 kg/s, the value of mv,0 is found to be 31.53 kg/s.
The calculation of the turbine power output (P) of a cogeneration system requires information about the fuel, the boiler, and the steam turbine. It is assumed that the fuel consumption rate in the boiler of each system is 21 kg/s, the higher heating value of fuel is 9000 kJ/kg, the boiler efficiency is 70%, the pressure and temperature of superheated steam generated by the boiler are 4.5 MPa and 440 °C, and the turbine efficiency is 85%. Figure 6 shows variations of mv,0 and P with p0 in cogeneration systems for the conventional and modified evaporation processes that have the optimum distributions of evaporator surface areas. It can be seen that, in each system, there exists the optimum value of p0 (p0,opt) that results in the maximum turbine power output (Pmax). In the cogeneration system for the optimum conventional evaporation process, p0,opt is 186.8 kPa, and Pmax is 29,286 kW. In the cogeneration system for the optimum modified evaporation process, p0,opt is 157.0 kPa, and Pmax is 29,442 kW. It is interesting to compare the cogeneration systems for the optimum modified evaporation process and a non-optimum conventional evaporation process, in which p0 is 200 kPa. The non-optimum conventional process has the same juice processing capacity as the optimum conventional process, but it is less energy efficient. The value of SE in this process is 2.411, and the value of mv,0 is 43.31 kg/s. The turbine power output of the cogeneration system that uses this process is 28,789 kW, which is 2.3% lower than the turbine power output of the cogeneration system that uses the optimum modified evaporation process. Table 1 shows simulation results of cogeneration systems for the non-optimum conventional evaporation process, the optimum conventional evaporation process, and the optimum modified evaporation process.
Table 1 shows that steam and vapor pressures in the optimum modified evaporation process are lower than those in the non-optimum and optimum conventional evaporation processes. Sucrose inversion losses in all effects of evaporators in the three processes are compared in Table 2. It can be seen that sugar inversion loss is largest in the first effect of each process. Sucrose inversion loss in the first effect of the optimum modified evaporation process has the lowest value due to the smallest extracted steam pressure and temperature. As a consequence, the total sucrose inversion loss of the optimum modified evaporation process is 63% lower than that of the non-optimum conventional evaporation process.

6. Conclusions

The comparison between the cogeneration system that used the conventional evaporation process and the cogeneration system that used the modified evaporation process was investigated in this paper. Bled vapor and steam extracted from the turbine were used, respectively, by the first and the second systems for heating duty in pan stages. Both conventional and modified evaporation processes had the total evaporator surface area of 13,000 m2 and total juice heater surface area of 2500 m2. They were designed to process 125 kg/s of inlet sugar juice. The distribution of evaporator surface area of the optimum modified evaporation process resulted in the maximum steam economy. The pressures of extracted steam supplied to the optimum modified evaporation process were chosen so that the turbine power output of the cogeneration system that used this process was maximized. According to simulation results obtained from the mathematical models developed for this investigation, extracted steam at a mass flow rate of 31.53 kg/s and a pressure of 157.0 kPa was required for the evaporator of the optimum modified evaporation process, and extracted steam at a mass flow rate of 13.16 kg/s and a pressure of 150.0 kPa was required for the pan stage of this process. The turbine power output was 29,442 kW for the cogeneration system that used the optimum modified evaporation process. This power output was 2.3% larger than the power output of the cogeneration system that used a non-optimum conventional evaporation process. Furthermore, since the pressure profile in the evaporator of the optimum modified process was lower than that of the non-optimum conventional process, sucrose inversion loss in the modified process was 63% lower.

Funding

This research received no external funding.

Conflicts of Interest

The authors declare no conflict of interest.

Nomenclature

Aheat transfer surface of evaporator, m2
Ahheat transfer surface of juice heater, m2
cpspecific heat capacity, kJ/kg·°C
hspecific enthalpy, kJ/kg
Imass fraction of lost sugar due to inversion
mmass flow rate, kg/s
Pturbine power output, kW
ppressure, kPa
SEsteam economy
Ttemperature, °C
tretention time, min
Uheat transfer coefficient, kW/m2·°C
xconcentration of sugar juice, %
Greek Symbols
εheat loss coefficient in evaporator
ητturbine efficiency
ρdensity, kg/m3
Subscripts
avapor to pan stage
bvapor to juice heater
cvapor from flash tank, condenser
eflash evaporation
fsugar juice
hjuice heater
ieffect number
lsaturated liquid
ssteam
vsaturated vapor
vlvapor-to-liquid
xjuice heating inside evaporator vessels
Superscripts
ininlet of an effect
outoutlet of an effect

References

  1. Kamate, S.C.; Gangavati, P.B. Exergy analysis of cogeneration power plants in sugar industries. Appl. Therm. Eng. 2009, 29, 1187–1194. [Google Scholar] [CrossRef]
  2. Urbaniec, K.; Zalewski, P.; Zhu, X.X. A decomposition approach for retrofit design of energy systems in the sugar industry. Appl. Therm. Eng. 2000, 20, 1431–1442. [Google Scholar] [CrossRef]
  3. Ensinas, A.V.; Nebra, S.A.; Lozano, M.A.; Serra, L. Design of evaporation systems and heaters networks in sugar cane factories using a thermoeconomic optimization procedure. Int. J. Thermodyn. 2007, 10, 97–105. [Google Scholar]
  4. Higa, M.; Freitas, A.J.; Bannwart, A.C.; Zemp, R.J. Thermal integration of multiple effect evaporator in sugar plant. Appl. Therm. Eng. 2009, 29, 515–522. [Google Scholar] [CrossRef]
  5. Bapat, S.M.; Majali, V.S.; Ravindranath, G. Exergetic evaluation and comparison of quintuple effect evaporation units in Indian sugar industries. Int. J. Energy Res. 2013, 37, 1415–1427. [Google Scholar] [CrossRef]
  6. Sharan, P.; Bandyopadhyay, S. Integration of multiple effect evaporators with background process. Chem. Eng. Trans. 2015, 45, 1591–1596. [Google Scholar]
  7. Palacios-Bereche, R.; Ensinas, A.V.; Modesto, M.; Nebra, S.A. Mechanical vapour recompression incorporated to the ethanol production from sugarcane and thermal integration to the overall process applying pinch analysis. Chem. Eng. Trans. 2014, 39, 374–402. [Google Scholar]
  8. Chen, T.; Ruan, Q. Modeling and energy reduction of multiple effect evaporator system with thermal vapor compression. Comp. Chem. Eng. 2016, 92, 204–215. [Google Scholar] [CrossRef]
  9. Chantasiriwan, S. Optimum surface area distribution in co-current multiple-effect evaporator. J. Food Eng. 2015, 161, 48–54. [Google Scholar] [CrossRef]
  10. Chantasiriwan, S. Distribution of juice heater surface for optimum performance of evaporation process in raw sugar manufacturing. J. Food Eng. 2017, 195, 21–30. [Google Scholar] [CrossRef]
  11. Chantasiriwan, S. Determination of optimum vapor bleeding arrangements for sugar juice evaporation process. J. Food Proc. Eng. 2018, 41, e12616. [Google Scholar] [CrossRef]
  12. Chantasiriwan, S. Distribution of heating surface areas in sugar juice evaporation process for maximum energy efficiency. J. Food Proc. Eng. 2019, 42, e12998. [Google Scholar] [CrossRef]
  13. Chantasiriwan, Increased energy efficiency of backward-feed multiple-effect evaporator compared with forward-feed multiple-effect evaporator in cogeneration system of sugar factory. Processes 2020, 8, 342. [CrossRef] [Green Version]
  14. Eggleston, G.; Monge, A. How time between cleanings affects performance and sucrose losses in robert’s evaporators. J. Food Process. Preserv. 2007, 31, 52–72. [Google Scholar] [CrossRef]
  15. Rackemann, D.W.; Broadfoot, R. Evaluation of sucrose loss in evaporators for different processing configurations. Int. Sugar J. 2018, 120, 366–372. [Google Scholar]
  16. Thaval, O.P.; Broadfoot, R.; Kent, G.A.; Rackemann, D.W. Determination of optimum tube dimensions for Robert evaporators. Int. Sugar J. 2018, 120, 524–530. [Google Scholar]
  17. Rein, P. Cane Sugar Engineering, 2nd ed.; Verlag Dr. Albert Bartens KG: Berlin, Germany, 2017. [Google Scholar]
  18. Vukov, K. Kinetic aspects of sucrose hydrolysis. Int. Sugar J. 1965, 67, 172–175. [Google Scholar]
Figure 1. Conventional evaporation process.
Processes 08 00765 g001
Figure 2. Modified evaporation process.
Processes 08 00765 g002
Figure 3. Cogeneration systems for (a) the conventional evaporation process and (b) the modified evaporation process.
Processes 08 00765 g003
Figure 4. Procedure for determining the optimum distribution of evaporator area in the conventional evaporation process driven by extracted steam at a pressure (p0) of 200 kPa: (a) finding third-effect area (A3) corresponding to the inlet juice mass flow rate (mf,in) of 125 kg/s and the maximum steam economy (SE) corresponding to first-effect area (A1) = 6000 m2, and second-effect area (A2) = 1200 m2; (b) finding A2 that maximizes SE corresponding to A1 = 6000 m2; and (c) finding A1 corresponding to the first-effect pressure (p1) of 150 kPa.
Processes 08 00765 g004
Figure 5. Procedure for determining the optimum distribution of evaporator area in the modified evaporation process driven by extracted steam at a pressure (p0) of 200 kPa: (a) finding A3 corresponding to the inlet juice mass flow rate (mf,in) of 125 kg/s and the maximum steam economy (SE) corresponding to A1 = 4000 m2, and A2 = 1100 m2; (b) finding A2 that maximizes SE corresponding to A1 = 4000 m2; and (c) finding A1 that maximizes SE.
Processes 08 00765 g005
Figure 6. Variations with extracted steam pressure (p0) of extracted steam consumption (mv,0) and turbine power output (P) of the cogeneration systems that have the optimum distributions of evaporator surface areas for (a) the conventional evaporation process and (b) the modified evaporation process.
Processes 08 00765 g006
Table 1. Simulation results of cogeneration systems for the non-optimum conventional evaporation process, the optimum conventional evaporation process, and the optimum modified evaporation process.
Conventional EPOptimum Modified EP
Non-OptimumOptimum
A1(m2)469566114634
A2 (m2)426615582409
A3 (m2)272913351932
A4 (m2)131034964025
Ah,1 (m2)804691399
Ah,2 (m2)242020311101
p0 (kPa)200.0186.8157.0
p1(kPa)150.0150.0122.6
p2 (kPa)113.485.879.4
p3 (kPa)81.544.244.6
p4 (kPa)16.016.016.0
mf,in (kg/s)125.0125.0125.0
mv,0 (kg/s)43.3142.0932.11
ma (kg/s)13.16 113.16 113.16 2
mfuel (kg/s)21.0021.0021.00
P (kW)28,78929,28629,442
1 Vapor bled from the first effect at 150 kPa. 2 Extracted steam from turbine at 150 kPa.
Table 2. Comparison of sucrose inversion losses in the non-optimum conventional evaporation process, the optimum conventional evaporation process, and the optimum modified evaporation process.
Effect NumberConventional EPOptimum Modified EP
Non-OptimumOptimum
12.95 × 10⁻³%4.16 × 10⁻³%1.58 × 10⁻³%
21.79 × 10⁻³%2.93 × 10⁻⁴%3.29 × 10⁻⁴%
36.38 × 10⁻⁵%5.50 × 10⁻⁵%7.46 × 10⁻⁵%
46.15 × 10⁻⁶%1.59 × 10⁻⁵%1.77 × 10⁻⁵%
Total5.38 × 10−3%4.52 × 10⁻³%2.00 × 10⁻³%

