Article

Experimental Research on the Optimization and Evaluation of the Polymer/Chromium-Ion Deep Profile Control System for the Fractured Low-Permeability Reservoirs

1
Department of Petroleum Engineering, Northeast Petroleum University, Daqing 163318, China
2
No.10 Oil Production Company, Daqing Oilfield Limited Company, Daqing 163000, China
*
Author to whom correspondence should be addressed.
Processes 2020, 8(9), 1021; https://doi.org/10.3390/pr8091021
Submission received: 18 July 2020 / Revised: 15 August 2020 / Accepted: 18 August 2020 / Published: 20 August 2020
(This article belongs to the Section Chemical Processes and Systems)

Abstract

:
The matrix/fracture conductivity of a fractured low-permeability reservoir is variable, and its heterogeneity is serious. When carrying out deep profile control measures, it is difficult to inject under the premise of ensuring the plugging effect. According to the characteristics of the fractured low-permeability reservoir in Chaoyanggou Oilfield, the polymer/chromium ion deep profile control system was optimized via a viscosity evaluation experiment, liquidity experiment and oil displacement experiment. The experimental results show that the high molecular weight main agent/low concentration system and low molecular weight main agent/high concentration system can meet the gel strength requirement. The evaluation results of the injection ability and plugging performance of the fractured low-permeability core show that a high molecular weight profile control system is difficult to inject, while a low molecular weight profile control system has a poor plugging performance and high cost after simulated shear. Therefore, the formulation of the profile control system was determined to be a polymer with a molecular weight of 16 million g·mol−1 as the main agent with a concentration of 1000–1500 mg·L−1. As assisting agents, the concentrations of thiourea, NaCl and NaHCO3 were 900 mg·L−1, 800 mg·L−1 and 700 mg·L−1, respectively. The plugging rate of the system was 87.6%, and the resistance coefficient was 19.2. Finally, a fractured low-permeability core model with parallel long cores was designed, and the optimal profile control system was used for the core oil-displacement experiment. Compared with the water-flooding experiment, the plugging rate can be increased by 6.9–8.0%.

1. Introduction

In fractured low-permeability reservoirs, there are serious contradictions between intra-scale and inter-scale layers. After long-term water flushing, the heterogeneity of the reservoir is aggravated. In actual production, profile control is usually used to improve the difference between layers and enhance oil recovery. To date, scholars have carried out extensive research on profile control systems at home and abroad. Hua, Z. S. et al. studied the deep profile control and oil displacement mechanism of nano-polymer microspheres by means of core hole membrane filtration, sand-filled tube displacement, core displacement, a micro-vision model and a capillary flow experiment. These systems had the tendency of plugging high-permeability layers [1]. Cai, C. et al. studied the effect of crosslinked polymer concentration on reservoir permeability. When the permeability of the same rock was between 600 ×10−3 and 300 × 10−3 m2 (600/300 × 10−3), a polymer with a low crosslinking agent concentration can be used for profile control and the fluid velocity can be effectively reduced by profile control. A polymer with a medium crosslinking agent concentration can be used for profile control in the permeability range of 1200 × 10−3 to 600 × 10−3 m2. When the permeability varied between 1200 × 10−3 and 300 × 10−3 μm2, high concentration crosslinked polymers are usually used [2]. Wei, J. G. et al. evaluated the long-term thermal stability, shear resistance, compatibility with natural detritus, and compatibility with the ASP composite system based on the anionic delayed crosslinked polymer gel deep profile control agent system. An experimental study of the core displacement profile control and an oil displacement effect evaluation was carried out, and the formulation of the anionic delayed crosslinked polymer profile control agent with ideal long-term stability was determined [3]. By measuring the viscosity and plugging characteristics of the profile control system with different mass fractions, Liu, Y. Q. et al. screened the profile control system formula of San’an Oilfield, which was composed of a polymer/chromium ion(P/Cr) crosslinking agent. The injection timing and slug size were optimized based on the optimization of the profile control agent [4]; Zhou, Y. Z. et al. developed an alkali-resistant profile control agent for ASP flooding. Combined with an orthogonal experiment, the formula of the alkali-resistant profile control agent suitable for ASP flooding was prepared by selecting a crosslinking agent and its concentration, polymer concentration, molecular weight and polymer curing time. The salt resistance of the formula was good, and its impact on the interfacial tension of the ASP system was small. The results showed that adding a small amount of pre-polymer slug before injection of the profile control agent can maintain good cementitious properties and achieve good development [5]. Wang, C. S. et al. developed a new high temperature particle gel composite profile control system through theoretical analysis and matching optimization of laboratory experiments along with evaluating its performance. This study provided a new direction for thermal profile research and a theoretical basis for profile control construction [6]. Through analyses of the scaling mechanism and the performance of the profile control agent, Lu, X. G. et al. studied the formulation optimization, performance evaluation and compatibility with a Na2CO3/surfactant/polymer flooding system, which effectively improved the profile control effect of injection production wells [7]. Liu, X. J. studied the plugging fracture, construction technology and related application technology of the profile control agent, and the water injection profile was improved [8]. Li, J. J. et al. used a polymer/chromium ion (P/Cr) gel system to investigate gel leakage and water breaking properties in fractured media [9]. Gussenov reviewed the permeability reduction of several widely used inorganic and organic bulk gels and discussed their applications in sandstone, carbonate reservoir fracture and matrix rocks [10]. Mao, X. optimized the profile control formula system suitable for low porosity and low permeability reservoirs in Naiman Oilfield and carried out field profile control measures for water injection wells to improve the water injection profile, alleviate interlayer contradictions and reduce the comprehensive water cut in the block [11]. Liu, X. B. et al. established a long core model, developed a gel profile control agent long core dynamic glue simulation evaluation method, and carried out a comprehensive evaluation of the deep dynamic adhesive characteristics of the gel dynamic profile forming agent [12]. Liu J. X., in combination with the actual situation of the layer, chose three kinds of water plugging and profile control agents (pre-crosslinking gel particle profile control agent, associating polymer profile control agent and high strength composite plugging agent) to evaluate indoor performance [13]. Shi, Z. M. explored the influence of profile control agent concentration, plugging rate, profile control radius, profile control opportunity and other factors on the profile control effect, providing the best profile control scheme suitable for the oilfield [14].
Xu, C. M. et al. developed a method for profile control of fractured reservoirs, which improved the profile control and oil displacement effect of fractured reservoirs, reduced the water cut of oil wells in the main direction of fractures, and improved the crude oil production of wells with fractures [15]. Lin, L. J. et al. analysed the oil production, streamline and slug distribution of oil wells at different positions before and after deep profile control and evaluated the response characteristics after deep profile control in fractured low-permeability reservoirs [16]. Li, Z. J et al. developed a sand-carrying profile control agent and a profile control method for it for use in a fractured vuggy reservoir and found that the agent is suitable for throttling reservoirs with strong heterogeneity [17]. Wang, X. et al. designed a physical model that can adjust the width of cracks as well as measure the flow of the matrix and the flow of fractures. The fracture physical model was used to evaluate the plugging strength performance of a weak gel, pre-gel particles and their composite profile control system [18]. Wu, Y. K. developed a heat-resistant and salt-resistant swelling profile control agent, JCYJ-1, and developed a delayed crosslinking profile control agent, JCDC-1, with good injection performance [19]. Shi, Y. et al. adopted PI decision-making technology and different development plans according to the development characteristics of various areas. The effect of the technology was obvious, and it solved the problem of water plugging and profile control [20]. Zhang, L. S. et al. carried out a pilot test of deep profile control for ultra-low permeability fractured reservoirs in the Yaoyingtai Oilfield, screened the indoor pre-coagulated expanded particle composite plugging agent and formula combination, and evaluated the applicability of the technology by simulating reservoir conditions with different temperatures and mineralization degrees [21]. Cao, Y. et al. tested and analysed the microstructure characteristics and composition of oily sludge in Shengli Oilfield by SEM and analysed the influence of different dispersants on the dispersion of oily sludge [22]. Peng, Q. G. et al. investigated the injectability, temperature, salt tolerance and long-term stability of depressurization and carried out experiments. The results showed that the injection pressure of the high molecular weight powder gel system increased rapidly; the high-permeability layer had a high flow rate, while the low permeability layer had a low flow rate; and the injection efficiency was very poor [23]. Jia, L. solved the problem of injection water channelling along fractures and water flooding in oil wells, and the main technology was profile control and water plugging by improving the water injection profile of water injection wells to make them evenly distributed; the purpose of stabilizing oil and controlling water was achieved [24]. Li, Y. collected five kinds of particle plugging agents commonly used in the field; studied their density, deformability, oil-water selectivity and plugging properties; and selected the plugging agent system suitable for high temperatures and high salinity in the fractured vuggy reservoir [25]. He, T. et al. studied the migration characteristics and plugging mechanism of gel under fissure matrix conditions and the distribution characteristics of residual oil after subsequent fluid flooding and found that, for multi-fractured reservoirs, multiple wheel profile control can give full play to synergy and improve the profile control effect [26]. Quan, H. H. et al. put forward corresponding solutions and technical policies aiming to resolve the contradictions and problems in water injection development by means of production performance analysis and numerical simulation to provide a scientific basis for the effective development of oilfields [27].
According to the survey results, most of the profile control systems currently used by scholars are suitable for mid-high permeability reservoirs. In spite of the existence of fractures in low-permeability reservoirs, high strength gels still have difficulties in injection. In this paper, many laboratory experiments were carried out related to this problem. First, the formulation of the profile control system was initially determined from the perspective of the gelation effect. Further, through a gel injectivity experiment, a profile control system suitable for fractured low-permeability reservoirs was further determined. Finally, the profile control system suitable for low-permeability reservoirs was determined by developing gel displacement experiments.

2. The Optimization of the Polymer/Chromium Ion Profile Control System

By testing the viscosity of different profile control systems over time, the molecular weight and concentration of the main polymer, the formulation of the crosslinking agent and the concentration of the assisting agent were optimized. The profile control system formula of the low-permeability reservoir was preliminarily determined from the perspective of gelling viscosity.

2.1. The Viscosity Test Experiment

2.1.1. Experimental Devices and Materials

A ZJ-HK special I incubator (Haian Petroleum Research Instrument Co., Ltd., Haian, China), LVDV-II+P Brinell viscometer (Brookfield, Middleboro, MA America), ALC-210 electronic balance (Beiyi Co., Ltd., Beijing, China), high-speed agitator (Haian Petroleum Research Instrument Co., Ltd., Haian, China), volumetric flask, beaker, rubber dropper, weighing paper, etc. were used.
The polymers were polyacrylamides (Daqing Refining and Chemical Company, Daqing, China) with relative molecular weights of 8 million g·mol−1, 10 million g·mol−1, 13 million g·mol−1, 16 million g·mol−1 and 19 million g·mol−1.
The crosslinking agents included a phenolic resin crosslinking agent(Aladdin Biochemical Technology Co., Ltd., Shanghai, China), an aluminium ion crosslinking agent(Aladdin Biochemical Technology Co., Ltd., Shanghai, China), a chromium ion crosslinking agent(Aladdin Biochemical Technology Co., Ltd., Shanghai, China), a phenol (AR 99.5%, Aladdin Biochemical Technology Co., Ltd., Shanghai, China), formaldehyde(Aladdin Biochemical Technology Co., Ltd., Shanghai, China), aluminium chloride(Aladdin Biochemical Technology Co., Ltd., Shanghai, China), citric acid(Aladdin Biochemical Technology Co., Ltd., Shanghai, China), ammonia and water(Aladdin Biochemical Technology Co., Ltd., Shanghai, China).
The assisting agents included sodium bicarbonate with concentrations of 100 mg/L, 300 mg/L, 500 mg/L, 700 mg/L and 900 mg/L (AR 99.8%, Sinopharm Chemical Reagent Co. Ltd., Shanghai, China); sodium hydroxide with a mass fraction of 1.87% (AR 96%, Sinopharm Chemical Reagent Co. Ltd., Shanghai, China); thiourea with concentrations of 700 mg/L, 800 mg/L, 900 mg/L and 1000 mg/L (AR 99%, Sinopharm Chemical Reagent Co. Ltd., Shanghai, China); and sodium chloride with concentrations of 200 mg/L, 400 mg/L, 600 mg/L, 800 mg/L and 1000 mg/L (AR 99.5%, Sinopharm Chemical Reagent Co. Ltd., Shanghai, China).
The water used was distilled water, simulated formation water and sampled formation water.

2.1.2. The Experimental Process

When comparing and evaluating different profile control systems, only the materials and dosages used were different, and the configuration method was basically the same. The process was as follows.
Step 1: According to the design formula of the profile control agent, the quantity of each chemical agent was weighed using an electronic balance.
Step 2: The required solvent water was measured in a volumetric flask, placed in a beaker, and stirred with an agitator, and the weighed polymer was prepared as a solution.
Step 3: After the solution was stirred evenly, it was removed and matured, and the stirring time was approximately 2 h.
Step 4: After ripening, the polymer solution was stirred. The weighed crosslinking agent was added to the polymer solution.
Step 5: The constant temperature water bath was set at 45 °C, and the initial viscosity of the profile control agent was measured by a rotary viscometer.
Step 6: The prepared profile control agent was placed in a 45 °C incubator, and its viscosity was measured regularly.

2.2. Determination of Molecular Weight and Concentration of Polymer

2.2.1. The Molecular Weight of the Polymer

The molecular weight of polymer directly affects the gelling time, gelling strength and gelling stability of the profile control system. Generally, the higher the molecular weight of the polymer, the easier it gels and the better the gelling effect. However, if the molecular weight is too large, the polymer molecule will block low-permeability reservoirs, resulting in ineffective injection. Therefore, in this paper, the molecular weight of the polymer was preliminarily selected from the viewpoint of the gelling effect, and the evaluation experiment of injectability and the oil displacement effect was carried out to further determine the molecular weight of the polymer.
The polymer concentration of 1000 mg·L−1, crosslinking agent concentration of 150 mg·L−1, chromium ion and assisting agent concentration were kept unchanged. Polymers with molecular weights of 8 million g·mol−1, 9 million g·mol−1, 13 million g·mol−1, 16 million g·mol−1 and 19 million g·mol−1 were used. Different profile control agents were prepared, and the gelation conditions were evaluated. The relationship between gelation viscosity and time is shown in Table 1.
The experimental results show the following: The 8 million g·mol−1 polymer profile control system with a 1000 mg·L−1 polymer main agent concentration cannot form a gel. This is because the branch chain length of the polymer with a relative molecular weight of 8 million g·mol−1 is not large enough; it cannot form good cross-links with the crosslinking agent. Although the 10 million g·mol−1 polymer can form a gel after two days, the viscosity after gelling is stable at lower than 500 mpa·s. When 13 million g·mol−1, 16 million g·mol−1 and 19 million g·mol−1 polymers are used as the main agents, the gelling viscosity can be more than 1500 mpa·s, which is suitable for profile control in low-permeability reservoirs.

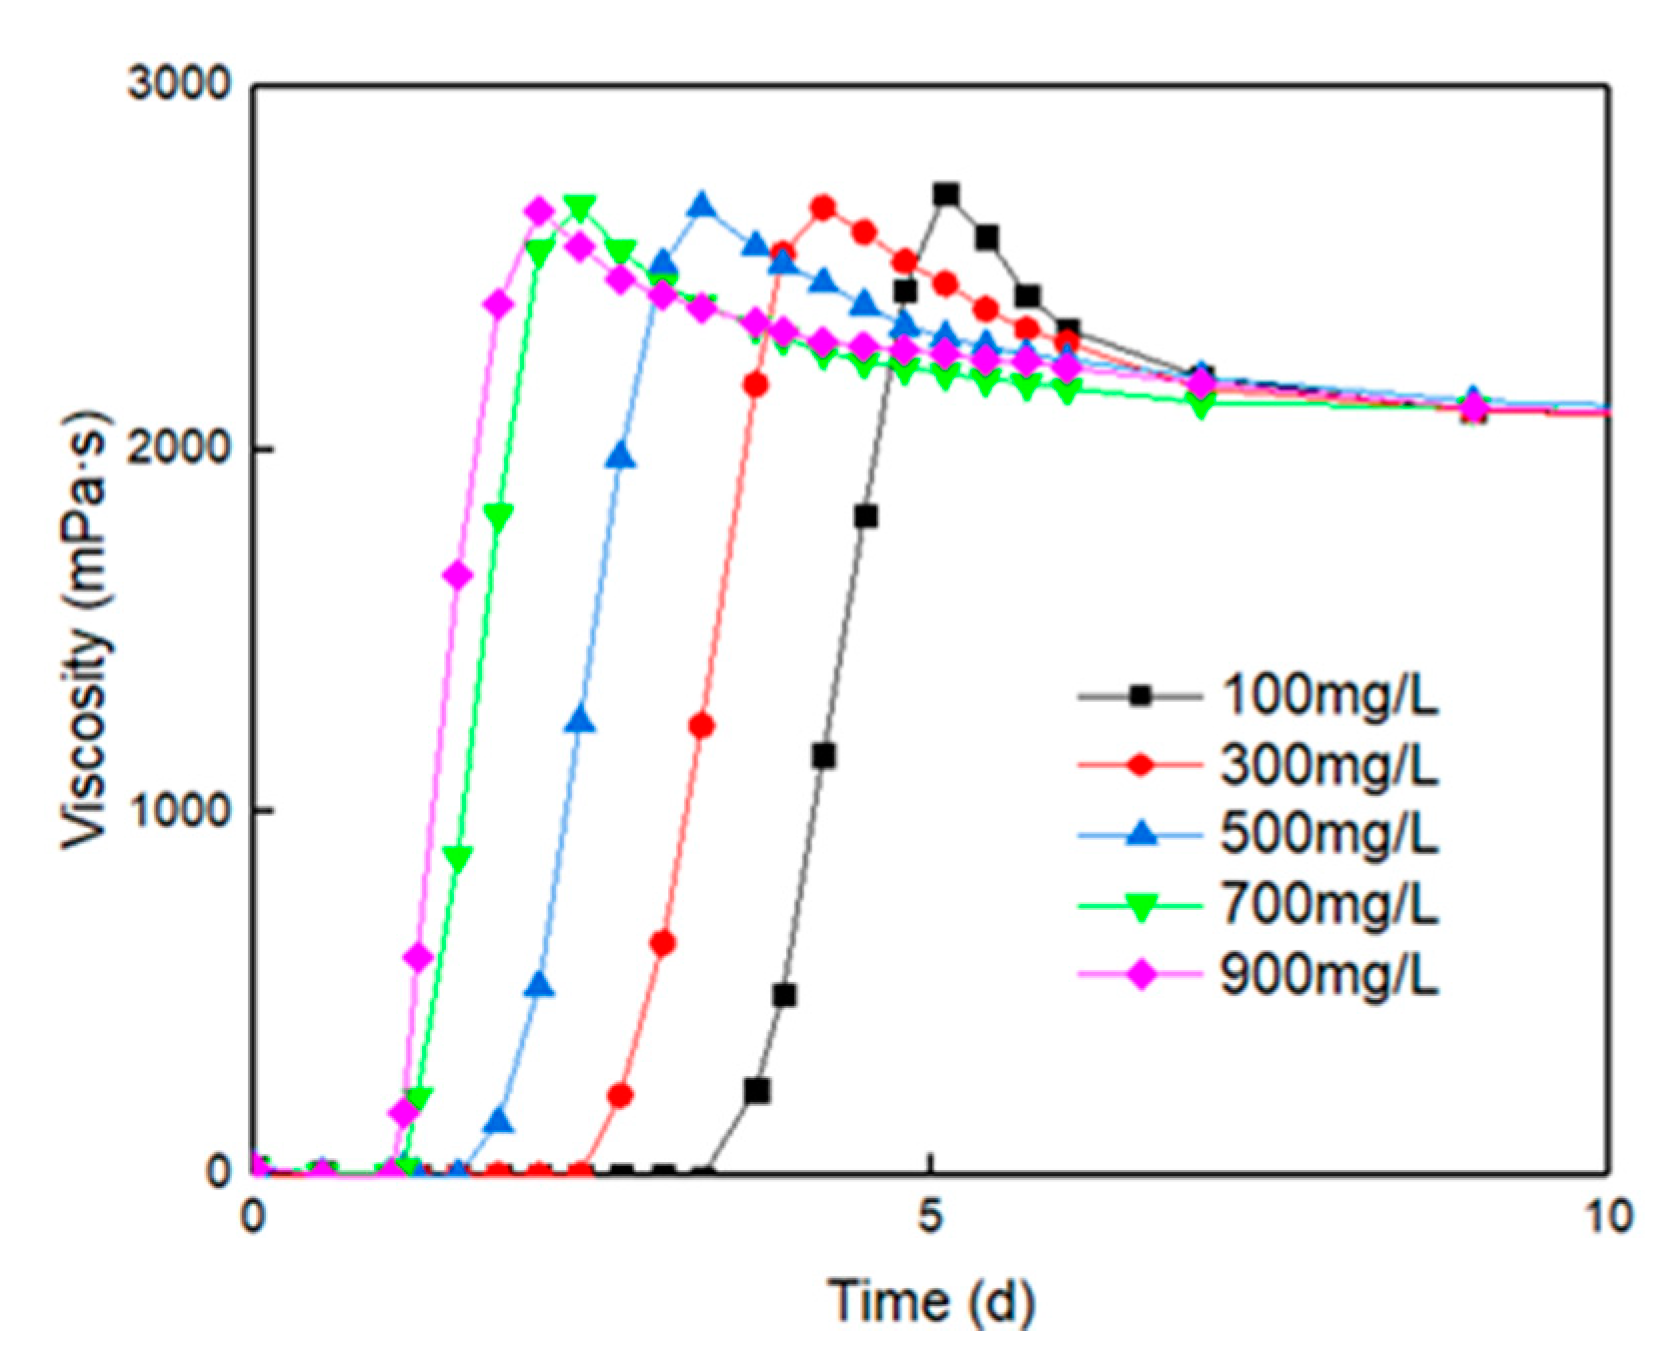
2.2.2. The Polymer Concentration

After the molecular weight of the main agent was determined, the polymer concentration was determined. In the laboratory experiment, the formation temperature was simulated at 45 °C, and the monitoring time was 30 days. The pH value of the system was adjusted from 6.5 to 7.0 by adjusting the concentration and dosage of the weak acid chromium ion crosslinking agent. The viscosity (when the rotational speed was 6 r·min−1) was measured. The gelation time table of polymer profile control agent with different molecular weights and concentrations is shown in Table 2. The gel viscosity curves of the polymer profile control agents with different molecular weights and concentrations are shown as Figure 1.
According to the change of gelling time, it can be found that the higher the molecular weight is, the shorter the gelation time is at the same concentration at 45 °C. With the same molecular weight, the higher the concentration, the shorter the gelation time. This is due to the formation of gelatine in two ways, one is intermolecular gelatine, the colloid particles or polymers in sol or solution are interconnected under certain conditions, forming a space network structure. The structure gap is filled with liquid as a dispersing medium; the other is intramolecular gelatine, which occurs mainly in the intermolecular active sites between molecules, forming a dispersed gel thread. The more sufficient the reaction, the shorter the gelling time.
The results show the following: Under the action of chromium ions, the degree of the gelling reaction gradually increased and the gel strength gradually increased, and the strength reached the maximum on the fifth day. There are two reasons for the viscosity reduction. On one hand, due to the oxidation under the formation conditions, the complex structure is gradually destroyed, resulting in the gel breaking phenomenon and viscosity reduction. On the other hand, due to the influence of thermal stability, the relatively stable complex structure is destroyed and the viscosity is decreased due to the high formation temperature. However, within 30 days, the viscosity retention rate is still above 70%. Although it is affected by oxidation and thermal stability, the gel still has a good plugging effect. Considering the injectability of the profile control system, the appropriate concentrations of 13 million, 16 million and 19 million g·mol−1 polymers are 1500–2000 mg·L−1, 1000–1500 mg·L−1 and 500–1000 mg·L−1, respectively, to ensure that the gelling viscosity is below 4000 m Pa·s. The appropriate concentration of the 13 million g·mol−1 polymer is too high, resulting in a high cost, while the concentrations of the 16 million and 19 million g·mol−1 polymer are suitable for profile control of low-permeability reservoirs.

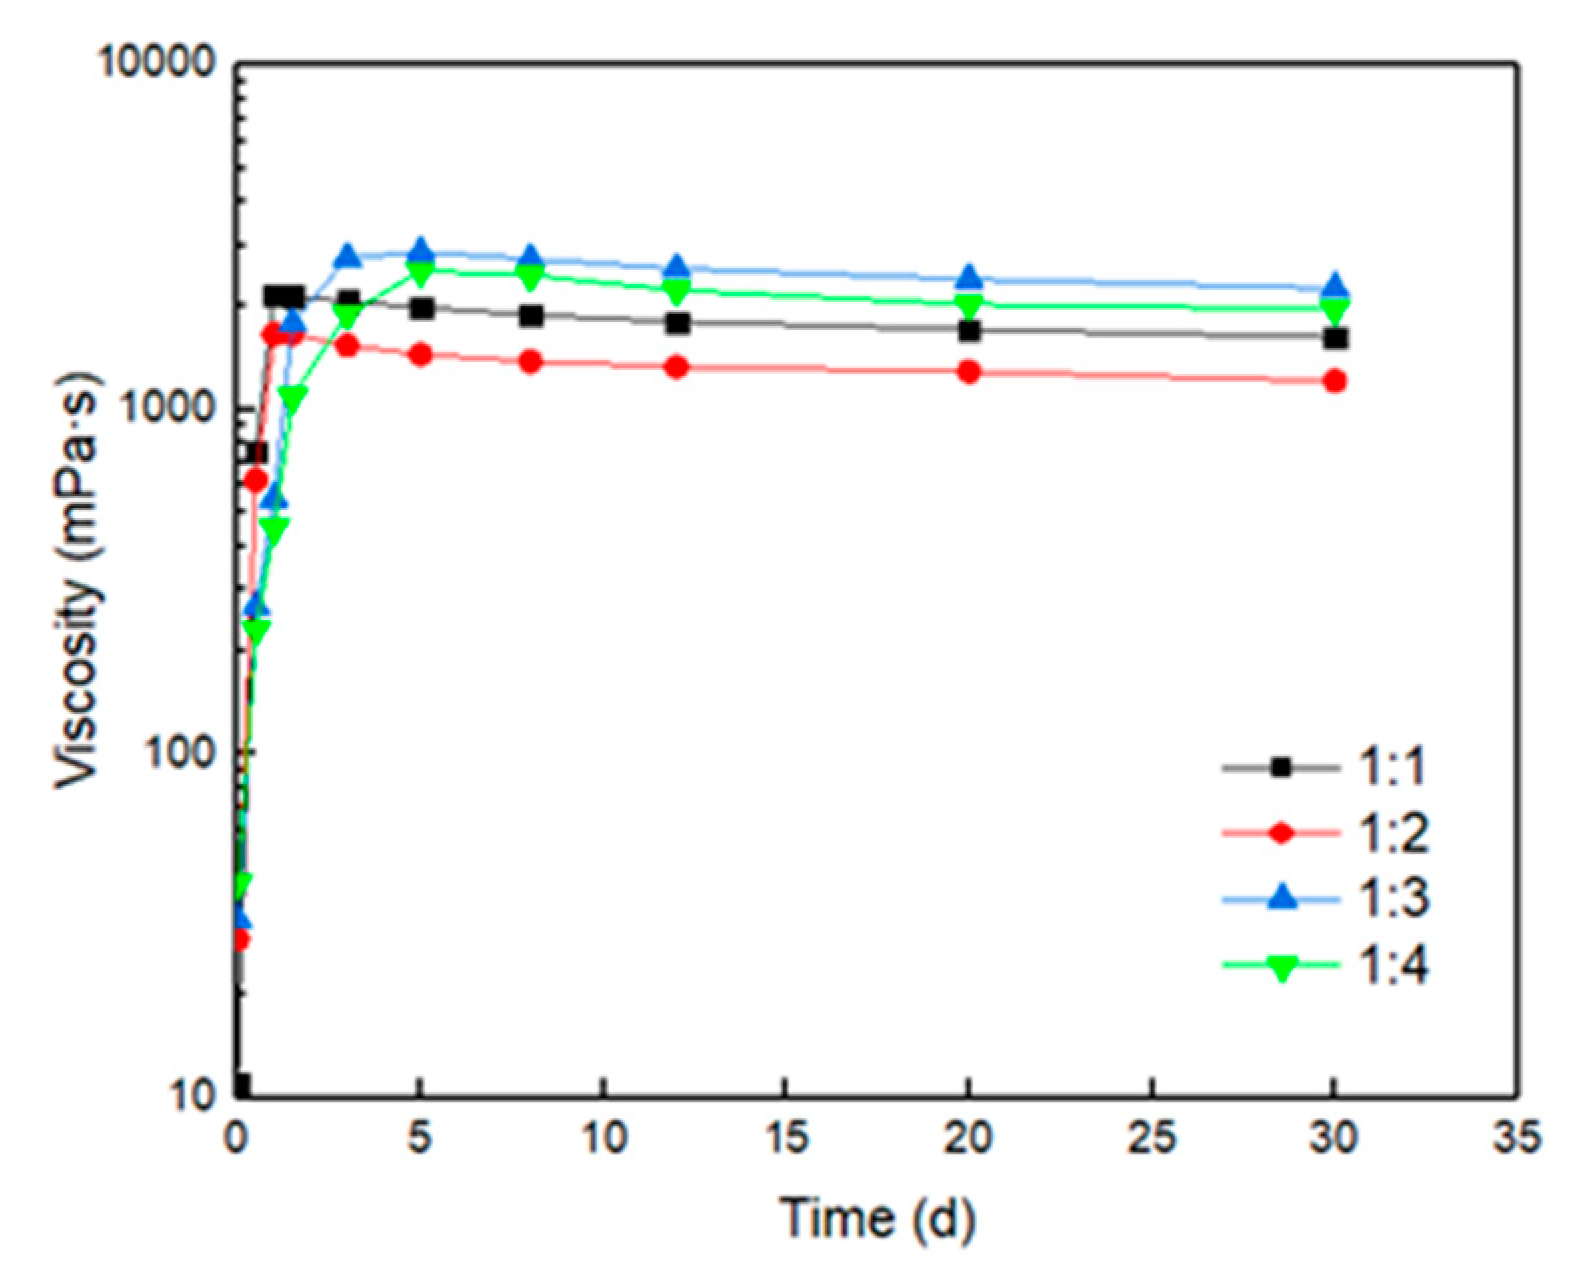
2.3. The Optimization of Formulation System of the Chromium Ion Crosslinking Agent

A commercial crosslinking agent was used, and the molecular weight and concentration of the polymer were preliminarily determined. To make the low-concentration and small-molecular weight polymer profile control system have a good gelling effect after injection into the formation, the formulation of the crosslinking agent was improved and the concentration was determined through a gelling experiment.

2.3.1. The Optimal Formulation of the Crosslinking Agent

The chromium ion crosslinked the polymer solution very rapidly, and it reacted violently at the moment of contact and formed a gel. However, the gel was unstable, and it lost water quickly. The addition of lactic acid and sodium hydroxide was able adjust the strength of the gel formed by the polymer solution.
The preparation process of the chromium ion crosslinking agent was as follows. A certain amount of chromium chloride was dissolved in water. Lactic acid and sodium hydroxide were added to the solution and stirred to dissolve. Chromium chloride was placed in a 45 °C incubator for 3 days (the results show that the content of the cyclic chromium lactate trimer in solution increases with the prolongation of the ageing time. The cyclic trimer is the most stable, so the gelation time of the polyacrylamide/crosslinking system increases with ageing time). The colour of the crosslinking solution changed from green to blue and black. Lactic acid and sodium hydroxide were selected as pH regulators, which controlled the crosslinking time. At 45 °C, the concentration of the crosslinking agent was 150 mg·L−1, the concentration of thiourea was 700 mg·L−1, the concentration of sodium chloride was 800 mg·L−1, and the concentration of sodium bicarbonate was 700 mg·L−1; the molar ratios of chromium chloride to lactic acid were 1:1 (I), 1:2 (II), 1:3 (III) and 1:4 (IV). The gelling effect is shown in Figure 2. In the crosslinking system, the molar ratio of chromium chloride to lactic acid mainly affects the pH of the solution and then affects the overall gelling process.
The results show that when the molar ratio of chromium chloride to lactic acid is more than 1:3, the gelation is fast, but the stability is relatively poor. After 30 days, the gel viscosity is less than 1500 mp·s. When the molar ratio is greater than 1:3, the gel strength is over 2500 mpa·s after 5 days. After 30 days, the gel strength is stable above 2000 mpa·s, which is suitable for deep profile control. According to the experimental results, the formula of the crosslinking agent is shown in Table 3.

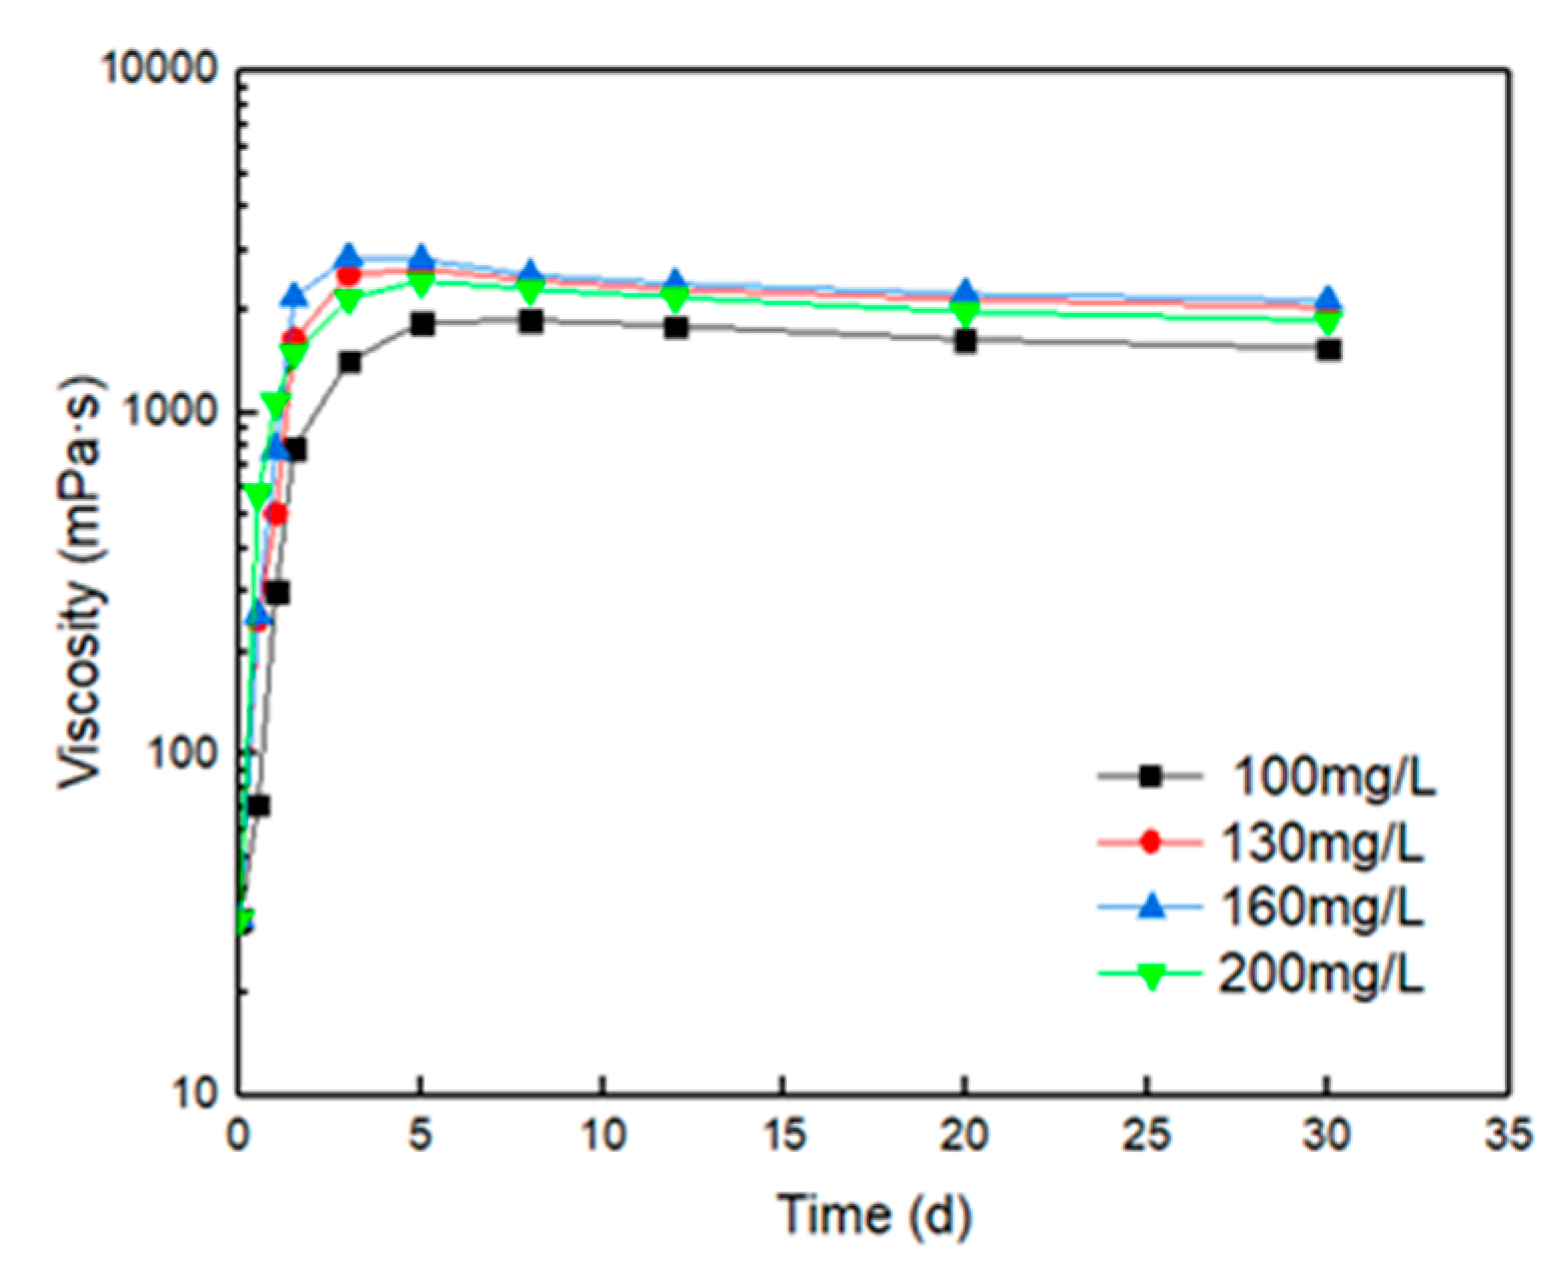
2.3.2. The Optimization of the Crosslinking Agent Concentration

After the formulation of the crosslinking the agent was optimized, the concentration of the crosslinking agent was determined. The polymer molecular weight was 16 million g·mol−1, the concentration was 1000 mg·L−1, and the temperature was 45 °C. The viscosity curves of the profile control agent with different crosslinking agent concentrations (with a rotation speed of 6 r·min−1) were determined, as shown in Figure 3.
The experimental results show the following: When the crosslinking agent concentration increases from 100 mg·L−1 to 160 mg·L−1, the viscosity of profile control system gradually increases, but the increase range becomes smaller. When the crosslinking agent concentration increases to 200 mg·L−1, the gel viscosity decreases. When the concentration range of the crosslinking agent is 130–160 mg·L−1, the viscosity of the profile control system is stable between 2000 and 2200 mpa·s. The optimal concentration of the crosslinking agent is determined to be 150 mg·L−1 considering the effect of gelation and the cost of the crosslinking agent.
The relationship between the gelling viscosity of the profile control system and the concentration of the crosslinking agent was analysed. The concentration of the crosslinking agent increases gradually, the degree of crosslinking reaction increases gradually, and the gel strength and viscosity of gelation increase. When the crosslinking agent concentration is too high, the crosslinking agent and polymer easily produce excessive cross-linking; local dehydration and contraction of the cross-linking system will destroy the continuity of the gel network structure, the gel strength will degrade, and the viscosity of gelling will be reduced.

2.4. The Assisting Agent Optimization

The P/Cr gel has a good gel forming effect, but low-permeability reservoirs have a poor injection ability. To achieve deep profile control, the gel has a low viscosity before gelation, high viscosity after gelation, and controllable gelation time. Therefore, some auxiliary agents should be added.

2.4.1. The Stabilizer

There are many impurities in the formation water, so adding a certain amount of thiourea can play the role of preferential oxidation protection to improve the stability of the polymer. The viscosity curves of the 16 million g·mol−1 polymer with a concentration of 1000 mg·L−1, concentration of the chromium ion crosslinking agent of 150 mg·L−1, cross-linking ratio of 20:1, concentration of sodium chloride of the assisting agent of 800 mg·L−1, concentration of sodium bicarbonate of 700 mg·L−1, and different thiourea concentrations at different temperatures are shown as Figure 4.
The results show that when the concentration of thiourea is low, there is a significant difference between different profile control systems after gelling; when the concentration of thiourea is more than 900 mg·L−1, the gelling stability is better. Therefore, the optimal stabilizer concentration of thiourea is 900 mg·L−1.

2.4.2. The Crosslinking Speed Regulator

NaCl and NaHCO3 were selected as the regulators, and the concentrations of the main agent, crosslinking agent and stabilizer remained unchanged. The assisting agent NaCl was added. The viscosity changes of the profile control system with different NaCl concentrations are shown in Figure 5.
The results show that the higher the NaCl concentration, the faster the gelation, but the gelation strength remains unchanged. When the concentration of NaCl increases to 800 mg·L−1, the gelation time does not significantly change. Therefore, it is determined that the NaCl concentration is 800 mg·L−1 to ensure that the profile control system has a higher gelling effect after injection into the formation.
When the NaCl concentration is 800 mg·L−1 and the other conditions remain unchanged, the viscosity changes of the profile control system with different NaHCO3 concentrations are as shown in Figure 6. Similar to the optimal concentration of NaCl, when the concentration of NaHCO3 increases to 700 mg·L−1, the gelation time does not significantly change. Therefore, the optimal concentration of NaHCO3 is 700 mg·L−1.
The formulation of the P/Cr weak gel profile control system in low-permeability reservoirs was preliminarily determined by the laboratory viscosity test, as shown in Table 4.

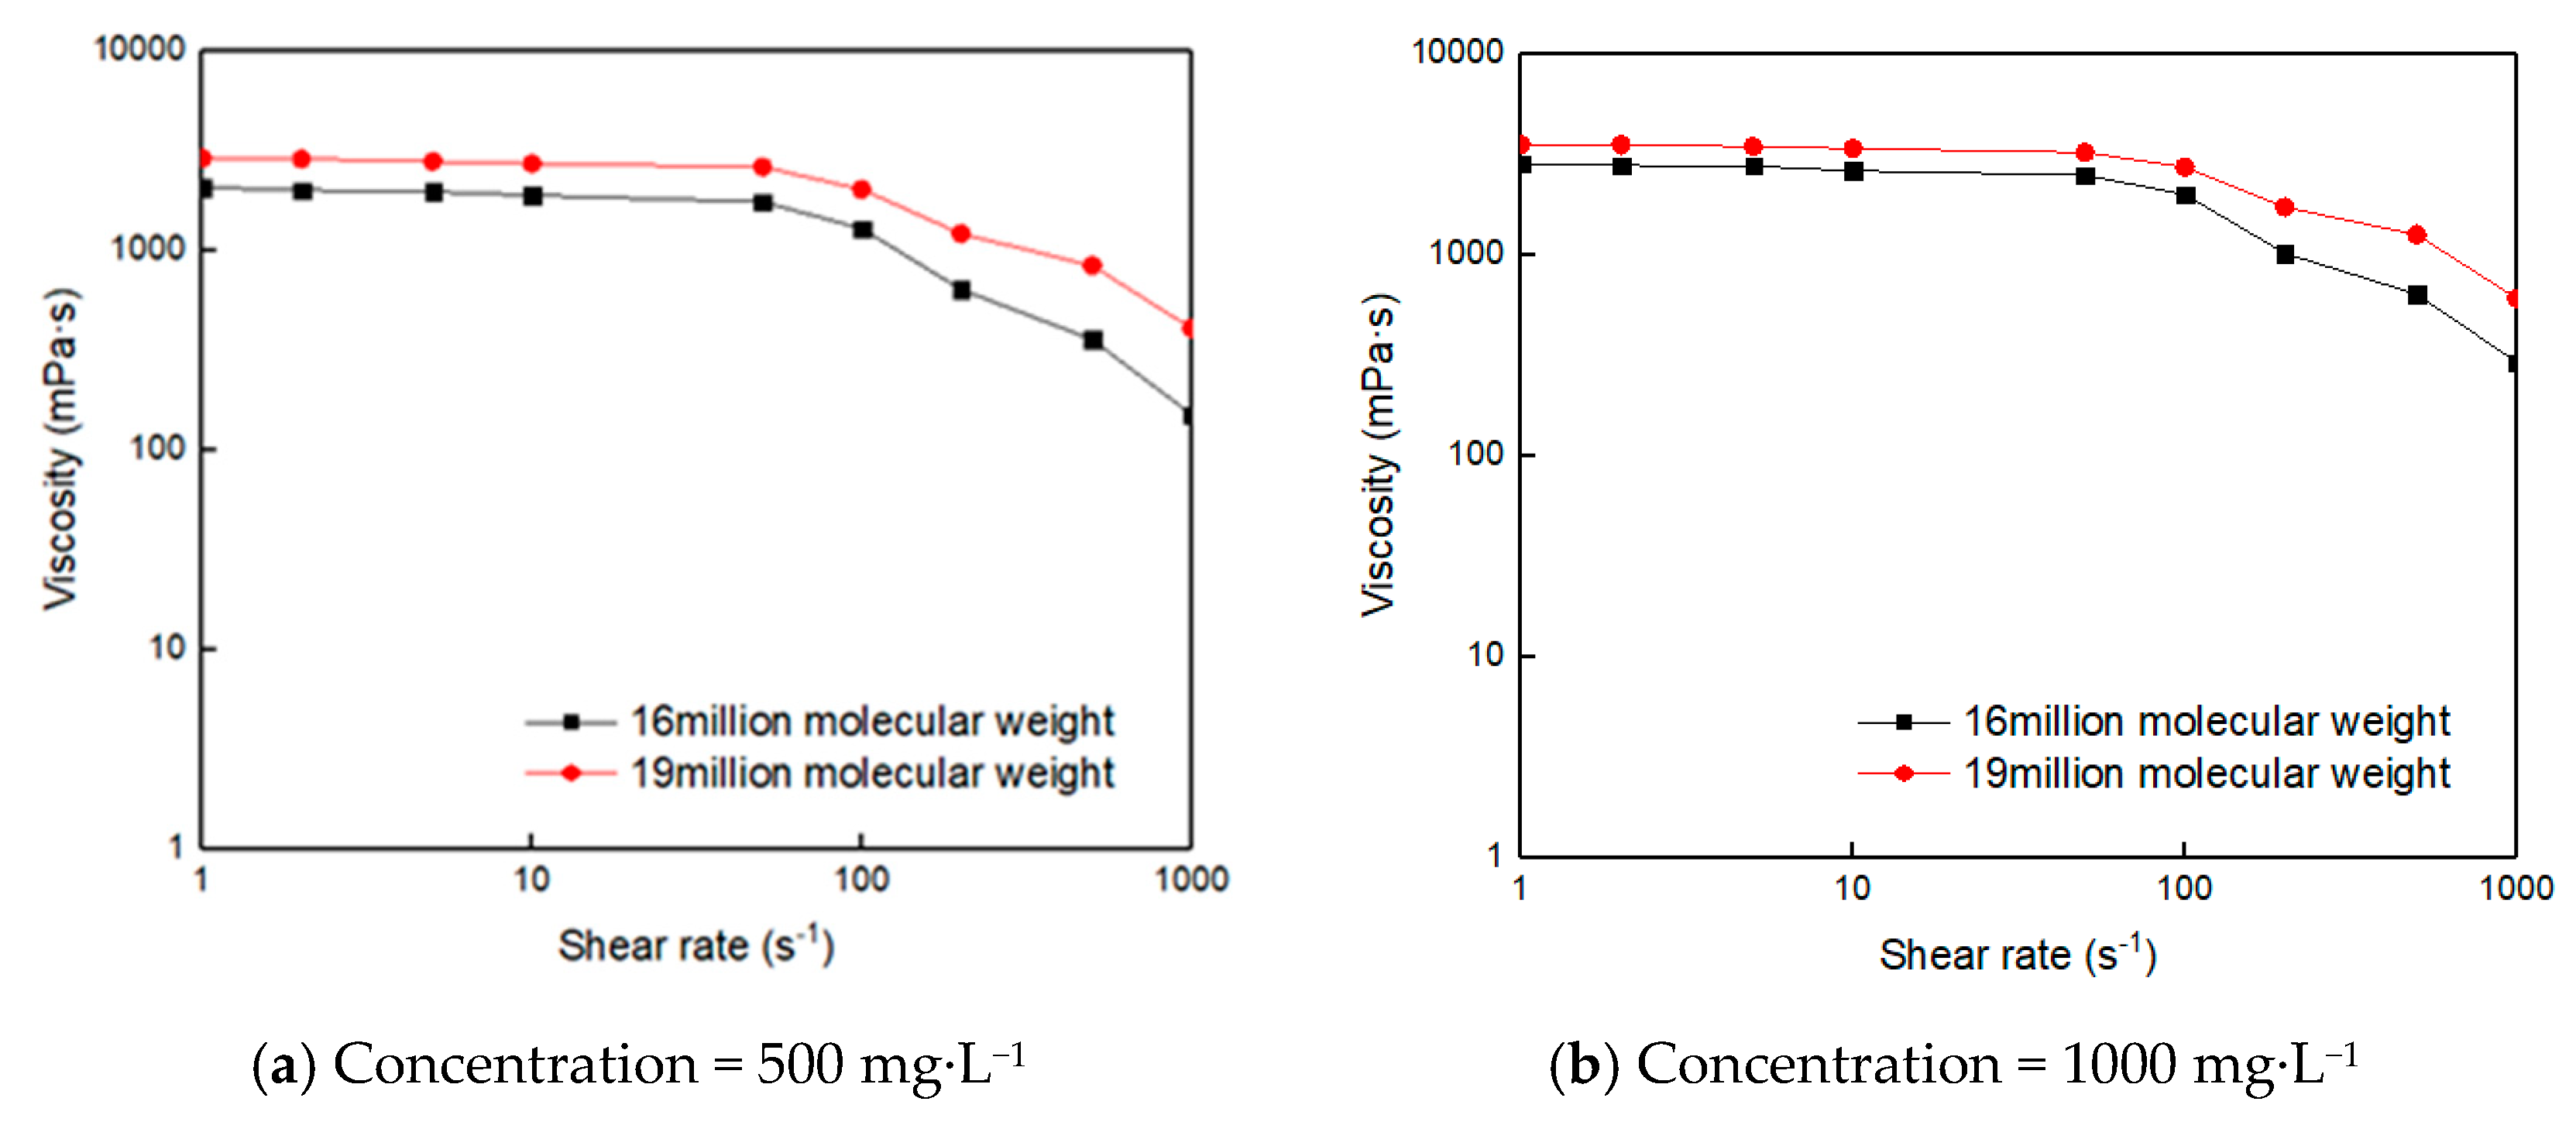
2.5. The Shearing Resistance

In the process of studying the rheological property of profile control system, the viscosity of different profile control systems under different shear rates is measured by setting different shear rates; then the corresponding shear rate is calculated according to the seepage velocity during construction, and the shear viscosity retention of profile control system during construction is evaluated.
To date, the laboratory measured the viscosity of polymer according to SY/t5862-2008 “technical requirements for polymer for oil displacement”. The Brinell viscometer with UL rotor was used to calculate the shear rate coefficient of corresponding rotor according to different rotating speed. In the experiment, the shear rate was gradually increased from 1 s−1 to 1000 s−1, and the viscosity of profile control system with different molecular weight and concentration of main agent was measured, which are as shown in Figure 7.
It can be seen from the experimental results that with the increase of shear rate, the viscosity of the weak gel decreases. When the shear rate is small, the viscosity of the weak gel is less affected. When the shear rate increases, the viscosity of the gel decreases rapidly. The reason is that the molecular structure of the polymer is not seriously affected by the flow rate, and the gelation performance changes little. However, when the shear rate is high, the molecular chain of the polymer is partially broken, the average molecular weight of the polymer decreases, and the performance becomes worse.
In the actual construction process, the change of injection velocity will lead to the change of seepage velocity and the corresponding shear rate. Therefore, in order to study the shear viscosity of profile control agent during construction, the relationship between injection rate and shear rate should be studied first. According to the relationship between shear rate and permeability and porosity of porous media, the formula is as follows:
γ = v 8 c K φ
where v —seepage velocity, m/s; K —permeability, m2; φ —porosity; c —coefficient related to capillary tortuosity, with the variation range of 2.08–2.05.
According to Equation (1), when the injection rate is 20–30 m3/D, the corresponding shear rate is 40–60 s−1; when the shear rate is 50 s−1, the viscosity retention rate of formula with 13 million g·mol−1 is 64%, that of formula with 16 million g·mol−1 is 84%, and that of formula with 19 million g·mol−1 is 90%; however, with the increase of shear rate, the viscosity change range of formula with 19 million g·mol−1 is smaller.

3. Adaptability Evaluation of the Profile Control System for the Fractured Low-Permeability Reservoirs

The adaptability of the profile control system to the low-permeability reservoirs was mainly considered from two aspects. The first aspect is matching the profile control system and the low-permeability reservoirs to ensure the smooth injection of the profile control system; the second aspect is the gelling strength of the configured profile control system after injection into the reservoirs to ensure the profile control effect. The matrix/fracture data of Chaoyanggou Oilfield in the periphery of the Daqing Placanticline is taken as an example in this paper. The core fluidity experiments were carried out, and the injectability and plugging parameters were evaluated.
The mechanism of profile control in fractured reservoirs is to plug fractures and high-permeability reservoirs. Therefore, in this paper, fluidity experiments of the fractured core and non-fractured core were carried out; the resistance coefficient, residual resistance coefficient and plugging rate of the corresponding profile control system were tested; and the injectability and plugging ability of the profile control system were evaluated.

3.1. The Fluidity Experiment

3.1.1. Testing Principle of the Experimental Parameters

(1) Resistance Coefficient
The resistance coefficient reflects the injection performance of the temporary plugging agent in porous media, which is affected by the viscosity, adsorption and retention of the plugging agent. The resistance coefficient is defined as the ratio of the fluidity of injected water flowing through the core to the mobility of the injection plugging agent solution flowing through the same core at the same flow rate. The determination method is as follows. First, the permeability kw before the profile control is measured. After the pressure and flow rate are stabilized, the permeability kp can be obtained. The resistance coefficient FR is:
F R = λ w λ p = K w μ w μ p K p
Combined with the filtration equation,
F R = Δ P 2 Δ P 1
In Equation (3), λ ω is the fluidity of water; λ p is the fluidity of the profile control agent; K w is the permeability of water, 10−3 μ m 2 ; K p is the permeability of the profile control agent, 10−3 μ m 2 ; μ w is the viscosity of water, mpa·s; and μ p is the viscosity of the profile control agent, mpa·s. The resistance coefficient can be calculated only by testing the injection pressure and the stable pressure of the injection profile control system.
(2) The Coefficient of Residual Resistance
The residual resistance coefficient reflects the change of core permeability before and after plugging. If the resistance coefficient is high, the injectability is poor. The resistance coefficient is affected by the viscosity, adsorption and retention of the plugging agent. The resistance coefficient is an important index to measure the plugging ability of the plugging agent for porous media and is defined as the ratio of core permeability before and after plugging. The measurement method is as follows. First, the permeability K Wb before profile control is determined. Then, the profile control system is injected, and the permeability K Wa of the core is measured after gelling. This process is similar to the derivation of the resistance coefficient. The coefficient F RR of residual resistance is:
F RR = K Wb K Wa
In Equation (4), K Wb is the permeability of the core measured with water before injection of the profile control agent, 10−3 μ m 2 ; K Wa is the permeability of core measured with water after injection of the profile control agent, 10−3 μ m 2 .
(3) The Plugging Rate
According to the change of the water flooding pressure before and after gel formation of the mixed polymer and the crosslinking agent, the change of the permeability is calculated, and the plugging efficiency of the gel is obtained. The higher the plugging rate, the better the plugging effect of gel for formation. Conversely, if the plugging rate is low, the plugging effect is poor.
S = K 1 K 2 K 1
In Equation (5), S is the plugging rate, %; K 1 is the permeability measured with water before profile control, 10−3 μ m 2 ; and K 2 is the permeability measured with water after profile control, 10−3 μ m 2 .

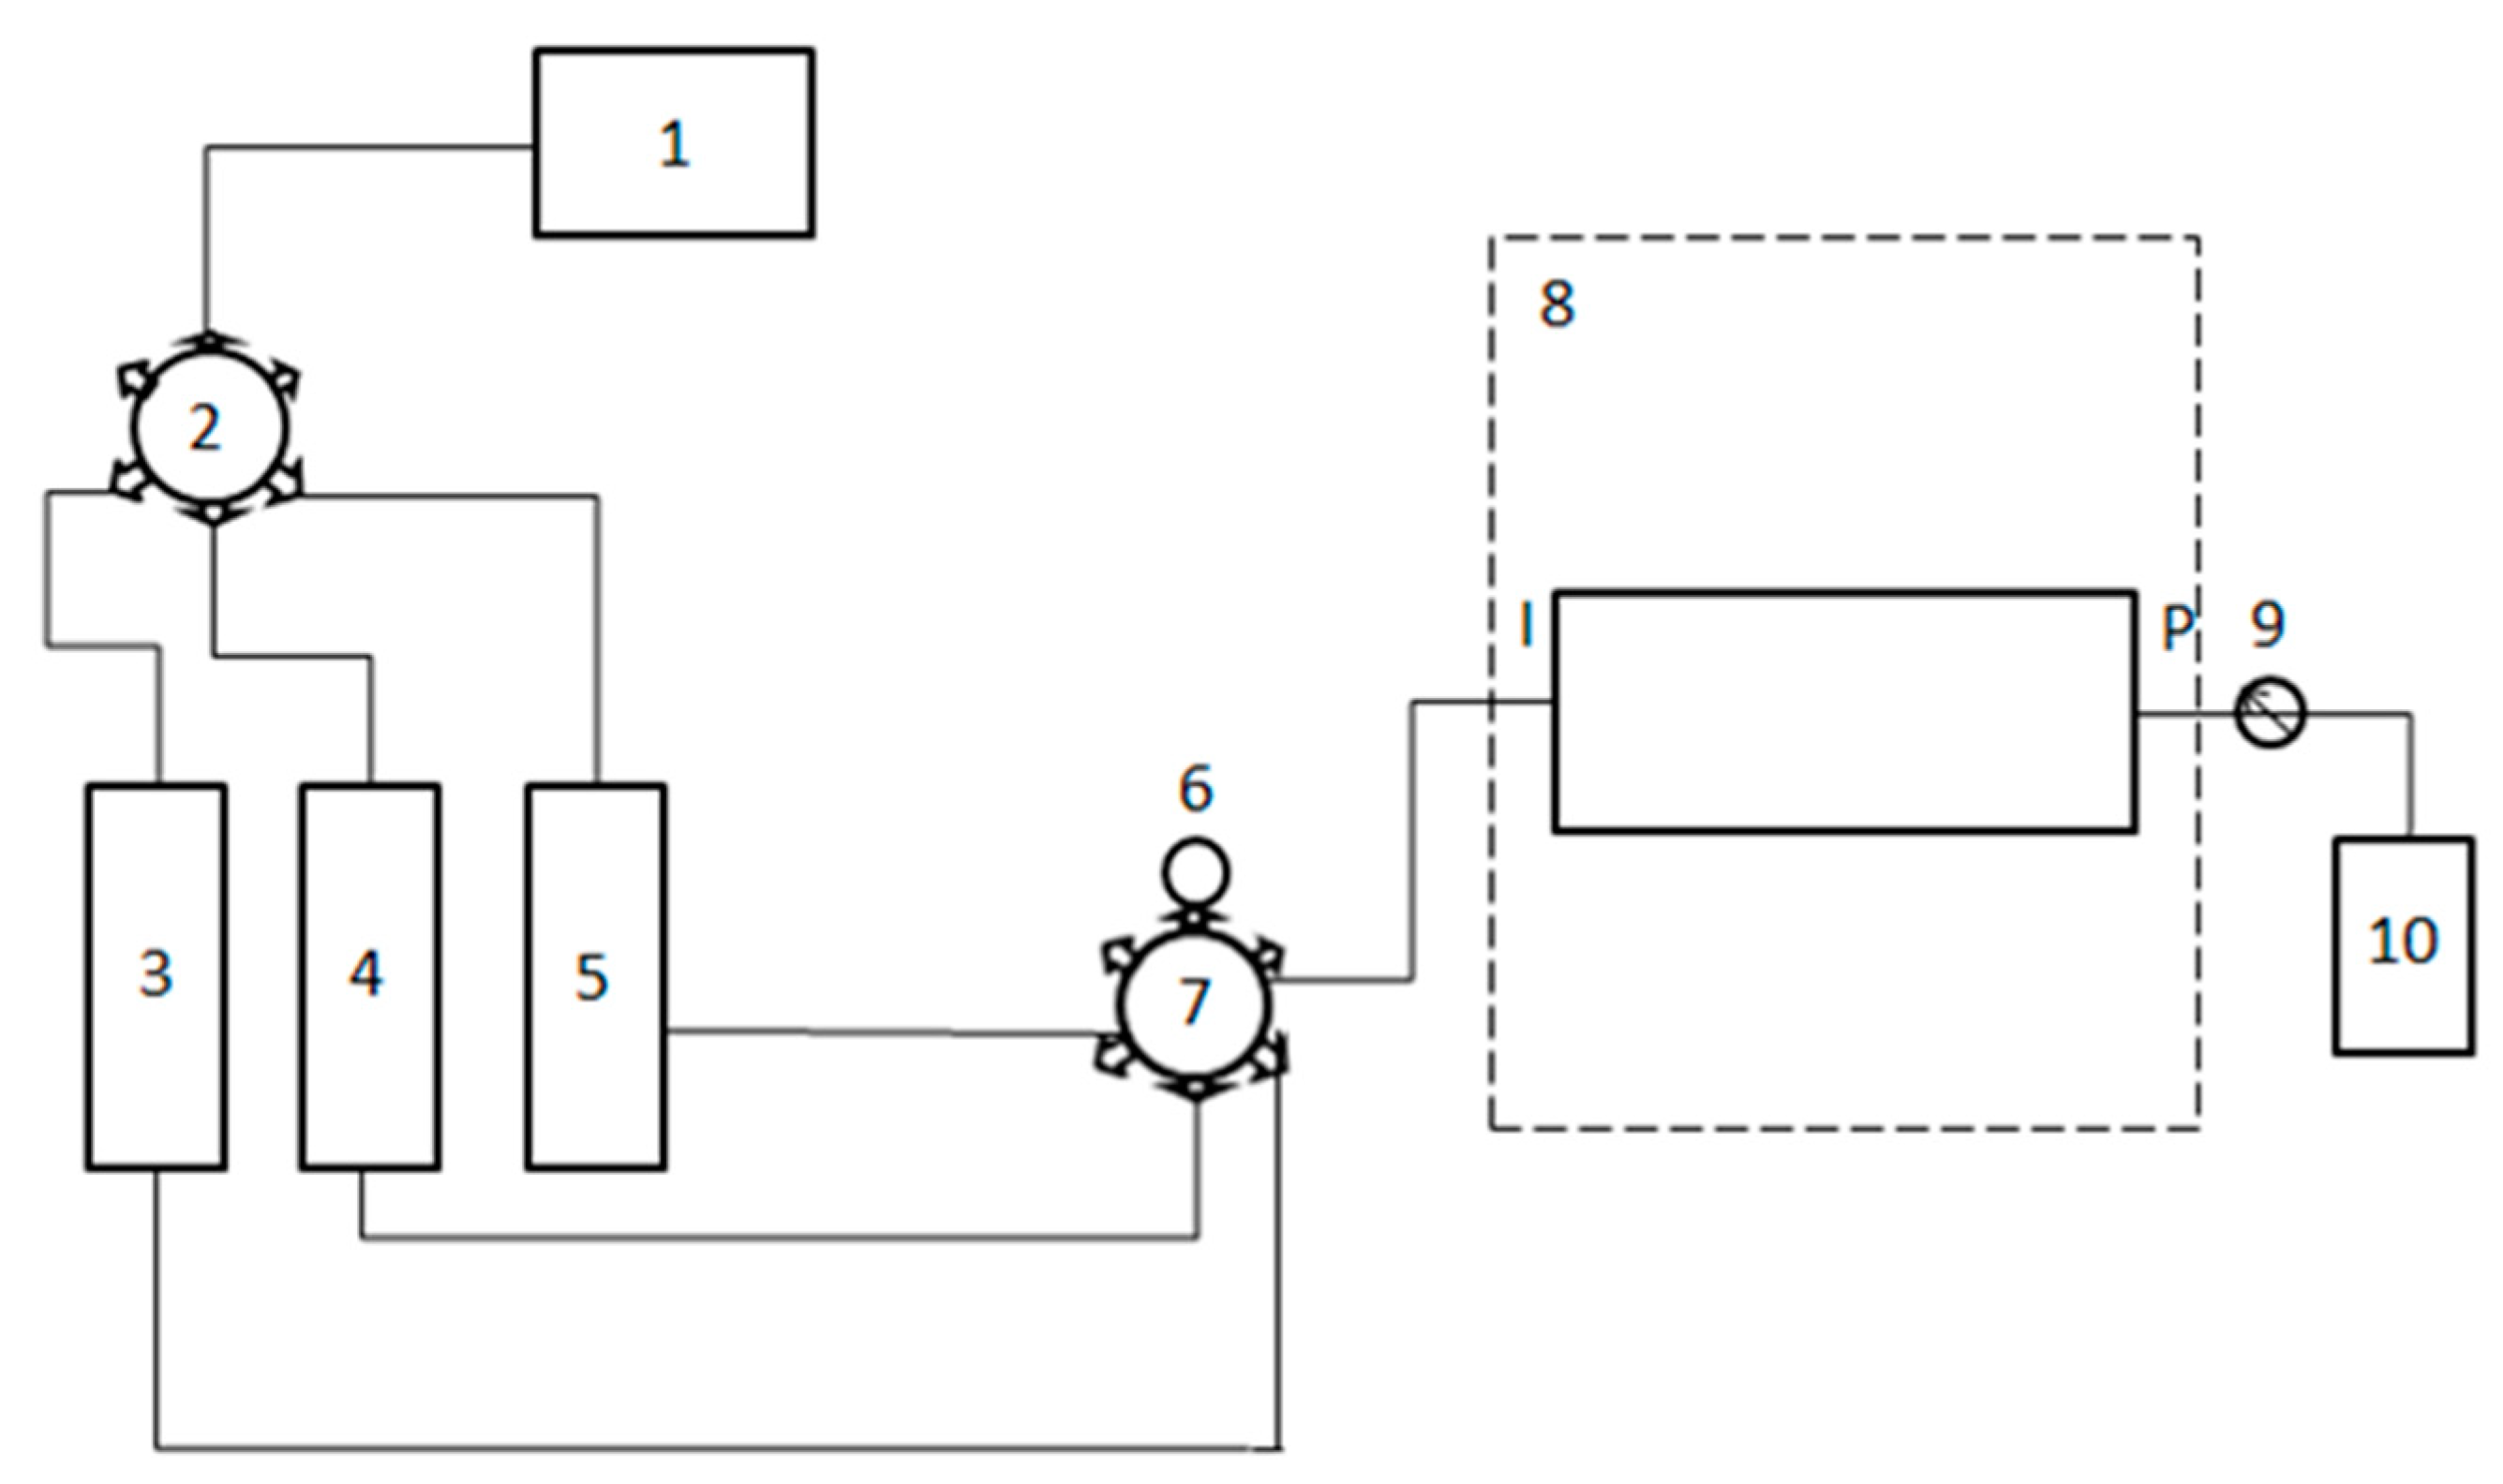
3.1.2. Experimental Devices and Materials

The experimental devices included a ZJ-HK special I incubator(Haian Petroleum Research Instrument Co., Ltd., Haian, China), ALC-210 electronic balance(Beiyi Co., Ltd., Beijing, China), 2XZ-8B rotary vane vacuum pump(Beiyi Co., Ltd., Beijing, China), agitator (Haian Petroleum Research Instrument Co., Ltd., Haian, China), core holder, pressure gauge, sampler, stopwatch, tweezers, test tubes, Vernier calliper and beakers.
The experimental chemicals included the polymers (Daqing Refining and Chemical Company) used in the preparation of the optimized profile control system with relative molecular weights of 16 million g·mol−1 and 19 million g·mol−1, thiourea at a concentration of 700 mg/L (AR 99%, Sinopharm Chemical Reagent Co. Ltd., Shanghai, China), chromium chloride (AR 98%, Sinopharm Chemical Reagent Co. Ltd., Shanghai, China), lactic acid, sodium hydroxide with a mass fraction of 1.87% (AR 96%, Sinopharm Chemical Reagent Co. Ltd., Shanghai, China), sodium chloride at a concentration of 800 mg/L (AR 99.5%, Sinopharm Chemical Reagent Co. Ltd., Shanghai, China), sodium bicarbonate at a concentration of 700 mg/L (AR 99.8%, Sinopharm Chemical Reagent Co. Ltd., Shanghai, China) and formation water from Chaoyanggou Oilfield.
The experimental materials included the storage and permeability space of the fractured reservoir, which was very complex and had serious heterogeneity; therefore, the natural fractures rarely penetrated the whole core. The parallelism of the samples was also very poor and could not meet the needs of the experimental research. In addition, the stress sensitivity of the fractured reservoirs was very strong. When the core containing fractures reach the ground, the stress release will lead to a large gap between the measured width of the fracture on the ground and the actual width in the formation, and the permeability measured on the ground is also very different from the permeability in reservoirs. To accurately simulate the real situation of the fractured reservoirs, columnar natural outcrop cores were selected for artificial fracturing, and the ratio of the fracture to matrix permeability was 6–10. The basic parameters of the core are given in the experimental results.

3.1.3. The Experimental Process

In the process of field profile control measures, when the profile control system passes through the perforating hole and enters the reservoir pore, the initial viscosity will be reduced. To simulate the above phenomenon, mechanical shear was carried out on the profile control agent during the experiment, and the viscosity retention rate was generally approximately 50%. Then, the follow-up flow experiment was carried out. The experimental flow chart (Figure 8) is as follows:
The experimental steps were as follows:
Step 1: The initial viscosity of the newly prepared profile control agent was measured and recorded with a viscosity meter. Following this, the profile control agent was stirred to keep the viscosity at 50% and simulate the actual shear.
Step 2: The core was placed under vacuum to measure the gravity of the dry sample core in air. The core was then saturated with formation water, and the gravity of core after saturation was measured again. The porosity of core was calculated according to the difference of gravity.
Step 3: At a constant flow rate (0.15 mL·min−1), the core was flooded with water. Until the pressure was stable, the pressure value P1 was recorded and the water permeability of the core was calculated.
Step 4: The 1PV profile control agent solution was injected at the same speed. After the pressure stabilized, the pressure value P2 was recorded and the core was placed in a 45 °C incubator.
Step 5: After the gel formed, the water drive continued until the pressure P3 was stable and the permeability of the core was calculated.
Step 6: The resistance coefficient P 2 P 1 and residual resistance coefficient P 3 P 1 were calculated according to the stable pressure during the injection of the profile control agent P2 and the pressure after the stable water drive P3. According to the permeability of the core measured with water before and after injection of the profile control agent, the plugging ability of the profile control system was calculated.

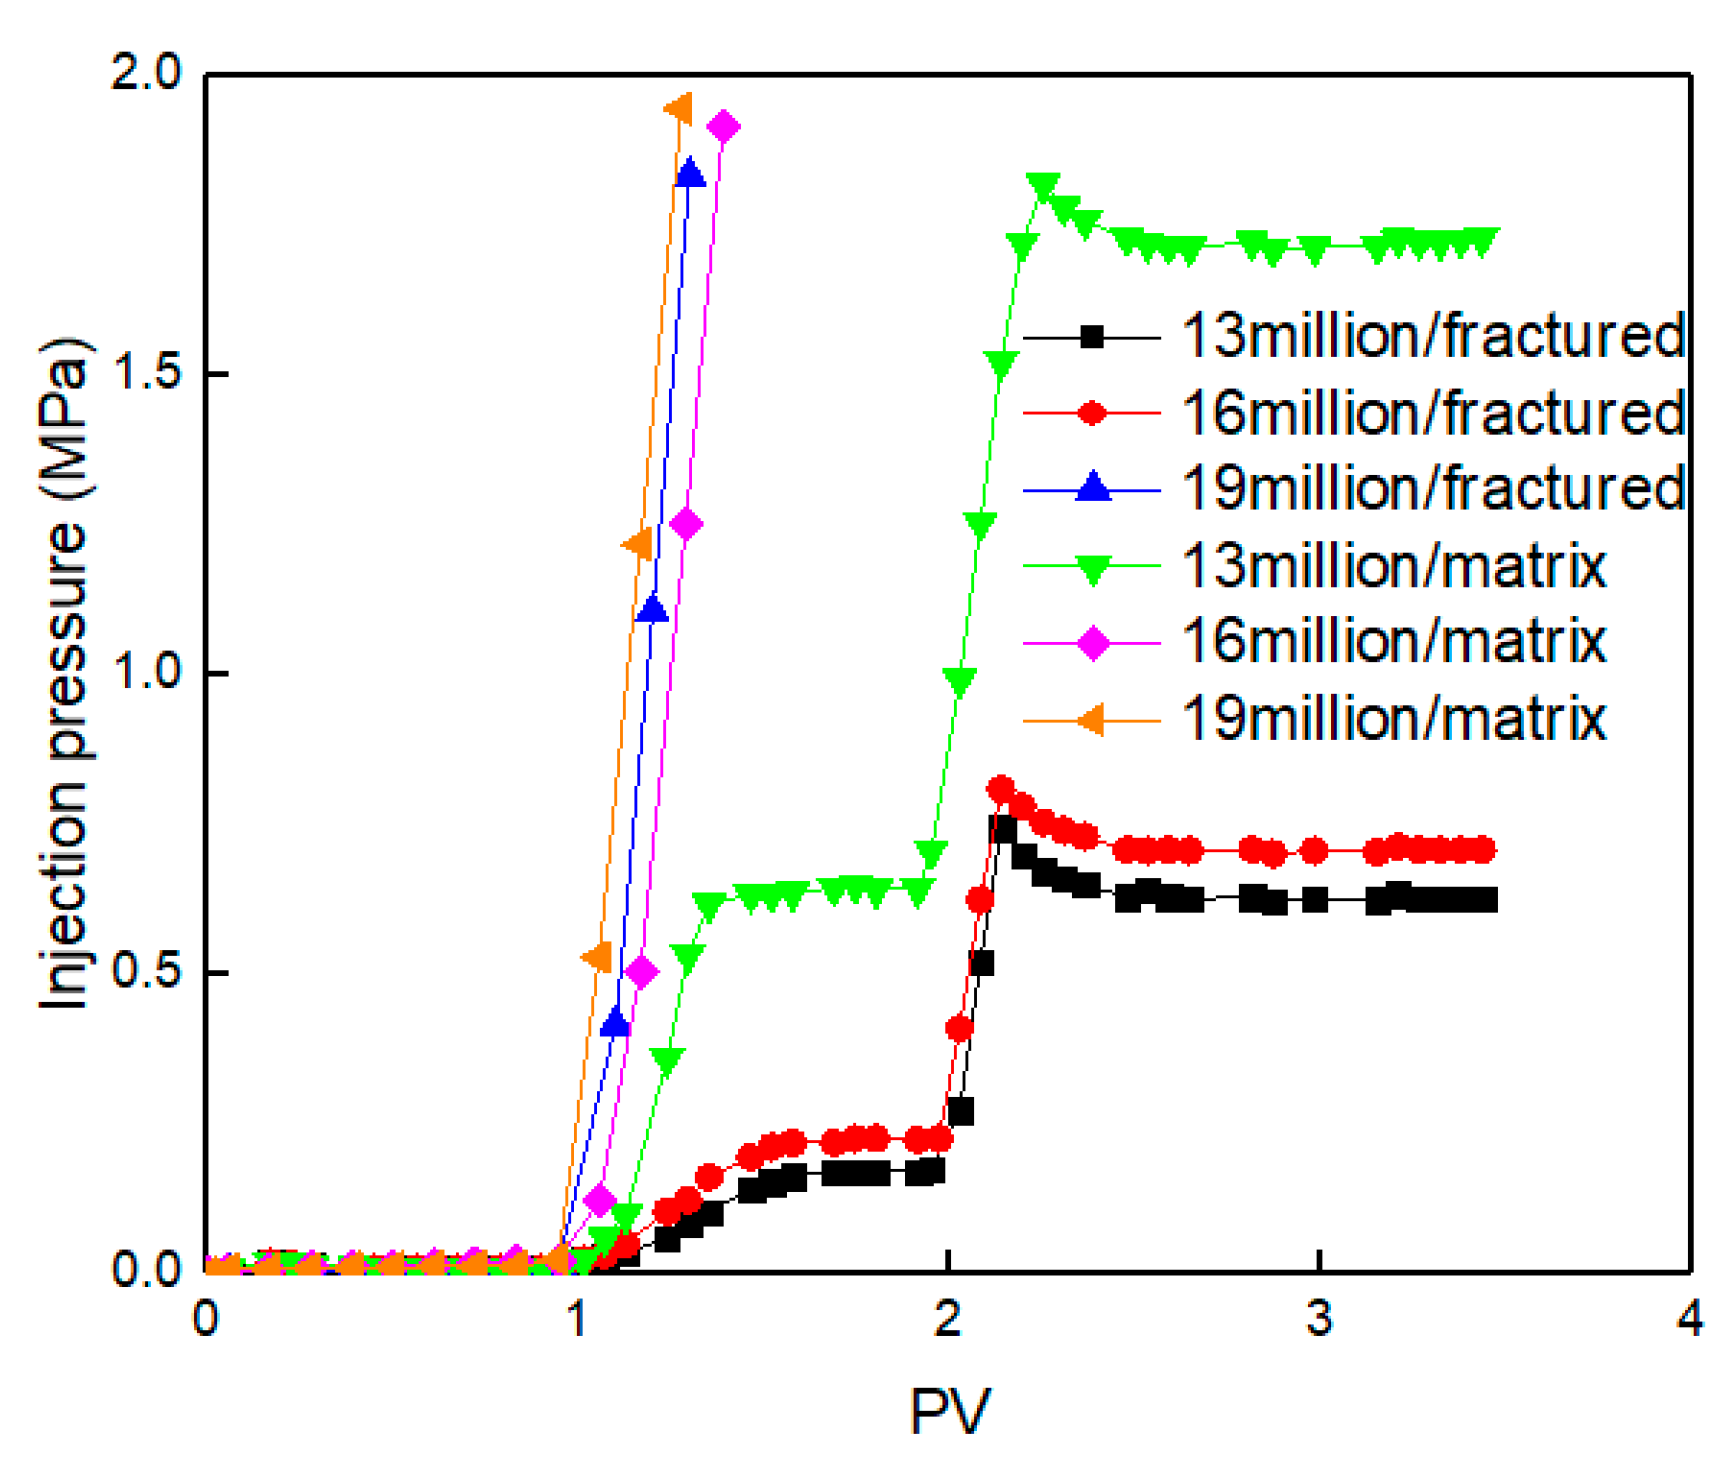
3.1.4. Results and Discussion

The 16 million MW/1000 mg·L−1 profile control system and 19 million MW/500 mg·L−1 profile control system were used to evaluate the injectability and plugging property of the fractured low-permeability cores. The basic parameters of experimental cores are shown in Table 5. The experimental results are shown in Figure 9.
The results show the following: When the molecular weights of the polymers are 16 million g·mol−1 and 19 million g·mol−1, the injection pressure increases sharply with the increase of the PV number of the profile control agent, and there is no stable phase. The polymer molecules cannot enter the pores because of the blockage at the injection end. For fractured cores, 16 million g·mol−1 polymers can be injected effectively, and the fractures play an effective communication role. The difference between the profile control agent injection and polymer injection is that the diameter of the polymer molecular coil becomes smaller after the polymer is treated by the acid ions in the cross-linking agent and the assisting agent, and the injection is relatively easy. For the fractured core, the 19 million g·mol−1 polymer cannot be injected effectively. With the increase of the PV number of the profile control agent injection, the injection pressure rises sharply and there is no stable stage, which shows that the polymer molecules cannot be injected effectively because of the blockage at the injection end.
According to the injection pressure curves, the resistance coefficient, residual resistance coefficient and plugging rate are calculated. The evaluation results of the fluidity experiment are shown in Table 6.
The evaluation results of the liquidity experiment show the following: For cores with the same matrix permeability, the plugging efficiency of the profile control agent decreases with the decrease of the polymer molecular weight. Taking a plugging rate of no less than 85% as the limit and considering the injectability and economic cost, the 16 million g·mol−1 profile control agent was selected for effective matrix permeability for the 15 × 10−3 μm2 fracture core. The resistance coefficient is 19.2, the residual resistance coefficient is 81.4, and the plugging rate can reach 87.6%.

4. The Evaluation of the Oil Displacement Effect

4.1. The Experimental Device and Process

(1). The Experimental Device
The devices used include a ZJ-HK special I incubator, Φ600 × 600 high pressure simulation vessel, 2XZ-8B rotary vane vacuum pump, HBS-S50/70 double cylinder constant speed and constant pressure displacement pump, OTS-550 oil-free air compressor, ZR-3 back pressure valve, HPV back pressure valve, a certain number of YB-150A, B pressure gauges. confining pressure pump, six-way valve, ALC-210 electronic balance, high speed stirrer, viscometer, sampler, pressure gauge and stopwatch.
(2). The Experimental Process
The experiment was carried out in the incubator. The experimental cores with saturated oil and water were placed into the incubator and connected according to the experimental process. After the device was connected, the experiment was carried out according to the sequence of the water drive and deep profile control. The injection end pressure, production end pressure, recovery degree, water content, matrix water saturation and fracture water saturation were recorded during the experiment. The experimental flow is shown in Figure 10.
(3). The Experimental Steps
Step 1: The core was placed under vacuum for 6–8 h and then saturated with the simulated formation water. The core porosity was measured by the weighing method.
Step 2: The water drive was carried out at the rate of 0.15 mL·min−1. When the injection pressure was stable, the pressure was recorded and the water permeability was calculated.
Step 3: At a rate of 0.15 mL·min−1, the simulated oil was used for displacement. When there was no water flowing out at the outlet and the pressure at both ends of the core was stable, the inlet and outlet valves were closed and the initial water saturation of the core was calculated. The core was placed in a 45 °C incubator for 3 days.
Step 4: A conventional water drive was carried out. The water drive was carried out at the rate of 0.15 mL·min−1 and stopped when the water content reached 80%.
Step 5: Deep profile control was carried out. After injecting the 0.15 PV profile control system according to each experimental scheme, the system was placed in 45 °C incubators for 12 h to wait for gelling. After gelling, the subsequent water flooding was carried out and the experiment was stopped when there was no oil outflow at the outlet end of the water drive.

4.2. The Experimental Materials

(1). The Experimental Chemicals
The chemicals used include polyacrylamide with relative molecular weights of 16 million g·mol−1 and 19 million g·mol−1 (Daqing Refining and Chemical Company, Daqing, China), thiourea at a concentration of 700 mg/L (AR 99%), chromium chloride(AR 98%), lactic acid, sodium hydroxide with a mass fraction of 1.87% (AR 96%), sodium chloride at a concentration of 800 mg/L (AR 99.5%), sodium bicarbonate at a concentration of 700 mg/L(AR 99.8%, Sinopharm Chemical Reagent Co. Ltd., Shanghai, China) and the formation water of the Chaoyanggou Oilfield. The experimental oil was made by mixing crude oil and kerosene in a certain proportion, and its viscosity was 6.7 mpa·s at 45 °C.
(2). The Experimental Core
In the experiment, 32 cm × 5 cm × 5 cm natural outcrop cores were selected, and the effective permeability of the matrix was 15 × 10−3 μm2. The fractured core was prepared by adding proppant between cores, and the fracture direction was parallel to the injection direction.
Generally, the matrix in the core was non-conductive. The higher the salt concentration in the core water, the smaller the resistance value. The water saturation value of different points in the flat core had a single value function relationship with the resistance value, so the water saturation value can be indirectly obtained by measuring the resistance value.
The experimental device consisted of four parts: the injection system, the model system, the oil-water separation and measurement system, and the resistance value acquisition and monitoring system. The size of the displacement model was 30 cm × 30 cm × 3 cm. Five pairs of electrodes were arranged on the model. The distance between electrode pairs was 1 cm, and the insertion depth of the electrode pair was the depth of the middle part of the model. Oil and water were passed through the model in different proportions. After the model stabilized, the resistance value of the model and the water saturation value of the model were calculated.
The resistance between electrodes was measured during the experiment. The resistance was converted into resistivity by using the calibration curve of resistivity and resistance, and then, the water saturation was calculated by Archie’s formula (see Equation (6)).
S w = a b R w ϕ m R t n
Into Equation (6), Rw is the complete water resistivity of rock, Ω·m; Sw is the water saturation, %; So is the oil saturation, %; b is a dimensionless coefficient; and n is a dimensionless saturation exponent.
The coefficient b and saturation exponent n are only related to the lithology of the rock and represent the influence of the distribution of oil and water in pores on the resistivity of oil-bearing rocks. There are two methods to determine the coefficients b and n: the core displacement experiment method and the empirical coefficient method. For pure sandstone, b = 1 and n = 2.

4.3. The Experimental Scheme

To study and compare the oil displacement effects of polymer profile control agents with different molecular weights and concentrations, conventional water drive and profile control oil displacement experiments were carried out. Based on conventional water drive recovery, the oil displacement effects of different profile control schemes were evaluated. The basic parameters and schemes of cores used in the experiment are shown in Table 7.

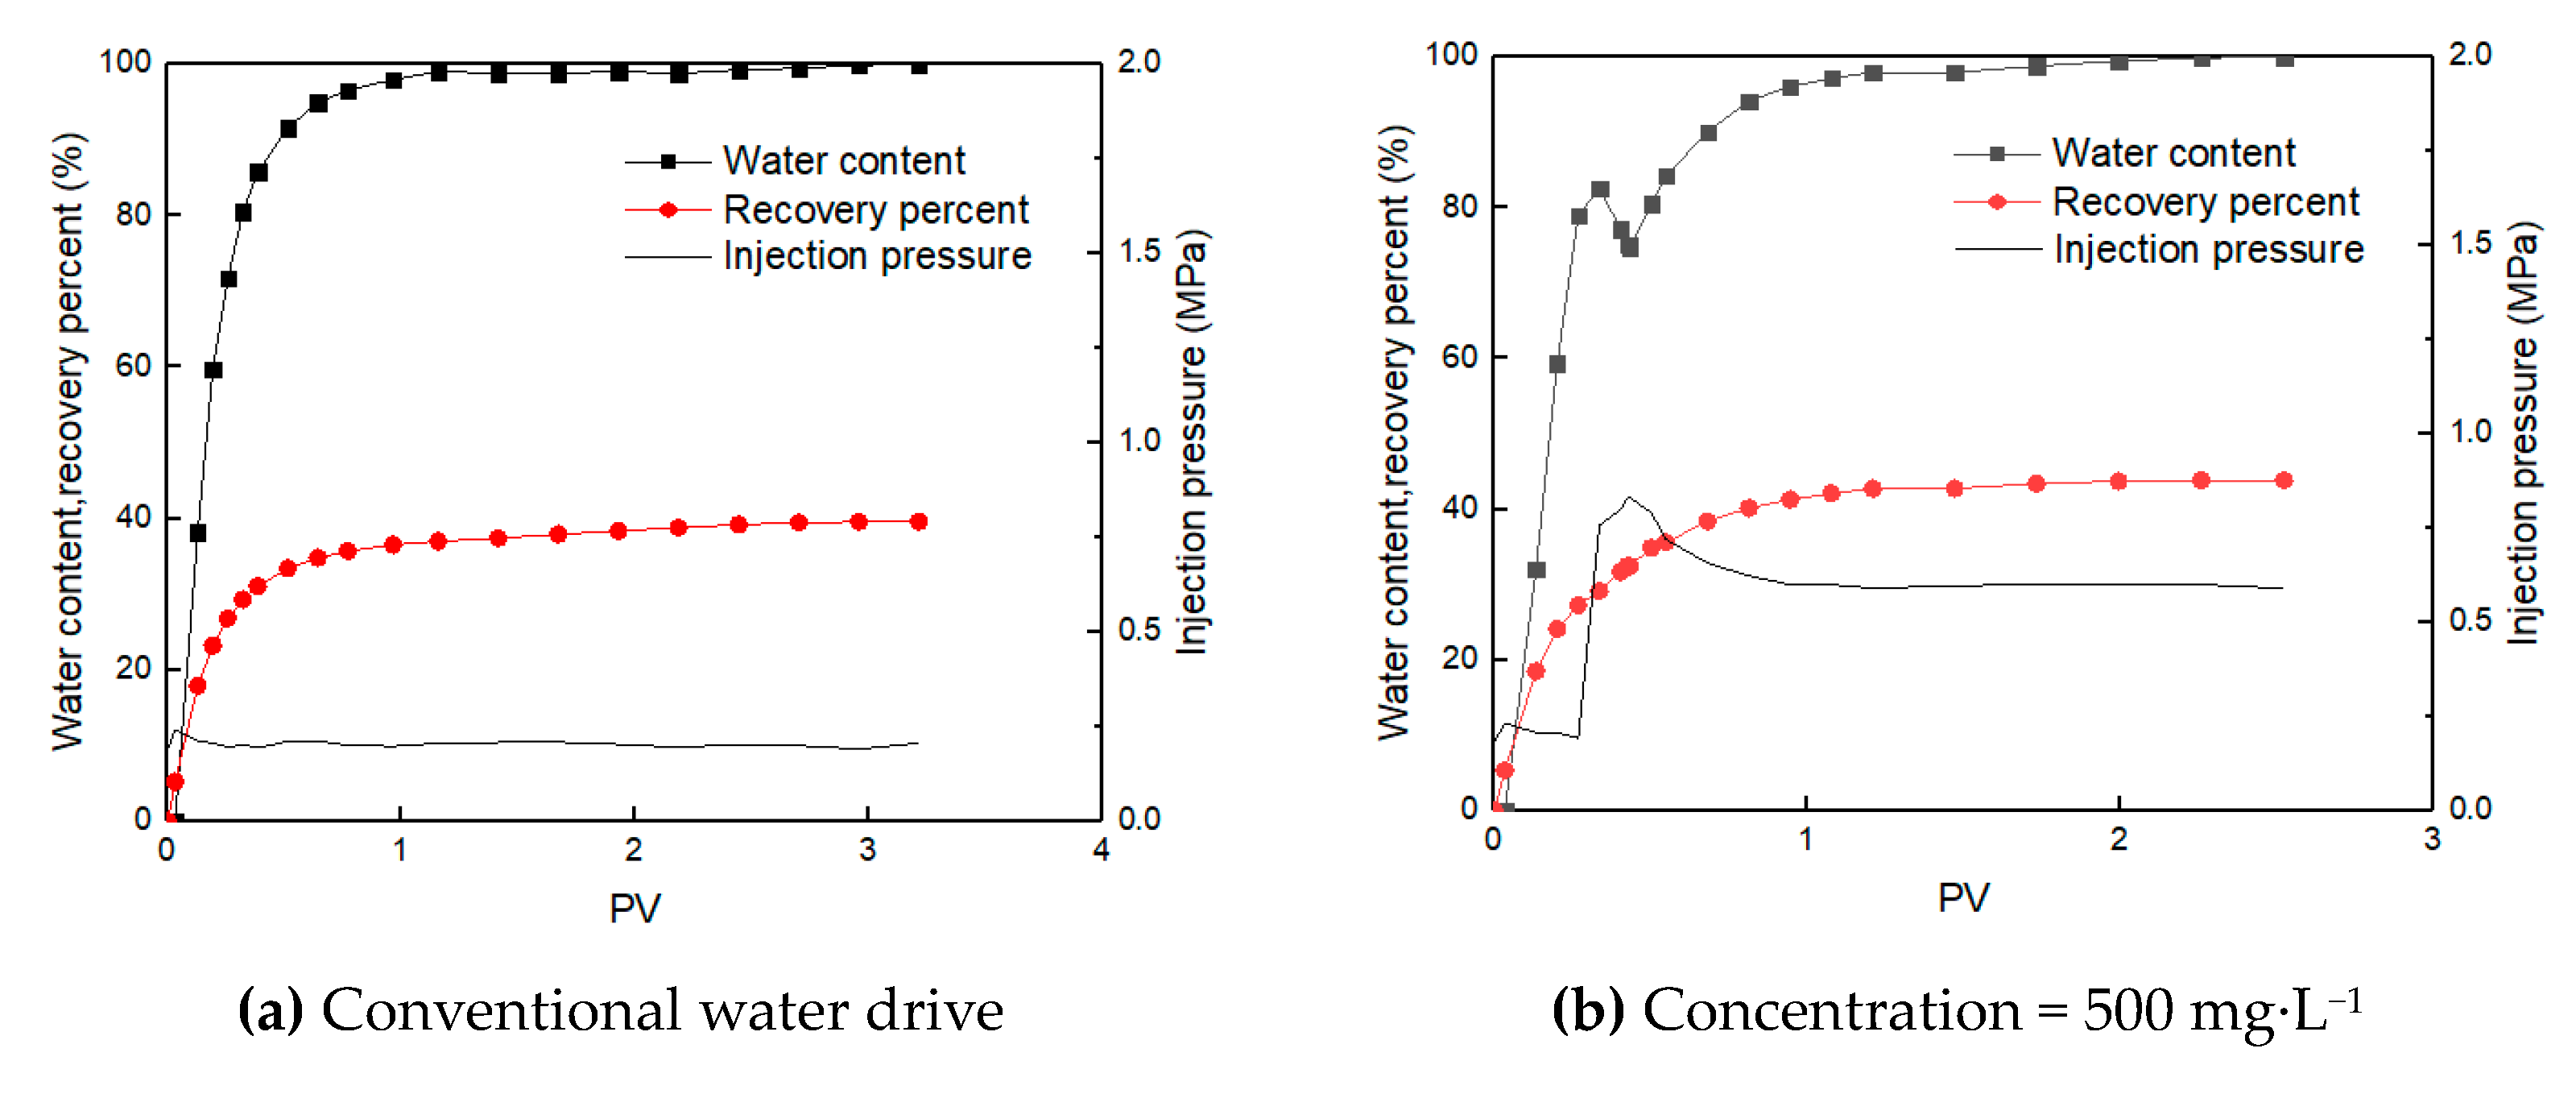
4.4. Results and Discussion

According to the previous research results, for a 15 × 10−3 μm2 matrix effective permeability fractured core, the 16 million g·mol−1 polymer profile control agent was used for the oil displacement experiment, the concentration of the polymer main agent was changed, and the oil displacement effect was evaluated. The oil production, water production, water content, pressure and cumulative oil production were recorded during the experiment. The curves of water content, recovery degree and displacement pressure difference with multiple injections in conventional water drive and profile control flooding are shown in Figure 11.
The results show that, for the fractured core with a matrix effective permeability of 15 × 10−3 μm2, when the concentration of the 16 million g·mol−1 polymer is increased from 500 mg·L−1 to 1000 mg·L−1, the enhanced oil recovery increases by 2.2%. When it is increased from 1000 mg·L−1 to 1500 mg·L−1, the enhanced oil recovery increases by 1.1%. The inflection point appears at 1000 mg·L−1. Therefore, the concentration of the main agent for the profile control should be more than 1000 mg·L−1.

5. Conclusions

(1) For the fractured low-permeability reservoir characteristics, it is necessary to ensure that the profile control system can be injected smoothly and that the gel strength of the well-configured profile control system after injection into the reservoir is appropriate to ensure the profile control effect. The chromium ion profile control system was selected, and the molecular weights of the polymer, the crosslinking agent, the assisting agent and the salt concentration were optimized.
(2) According to the characteristics of the Chaoyanggou low-permeability fractured reservoir, the formula of the deep profile control agent was selected as follows: a 13–19 million polyacrylamide polymer was used as the main agent at a concentration of 500–2000 mg·L−1, Cr3+ + lactic acid + sodium hydroxide was used as the crosslinking agent at a concentration of 130–160 mg·L−1, and the assisting agent was thiourea + sodium chloride + sodium bicarbonate at a concentration of 600–1000 mg·L−1;
(3) According to the results of the fluidity experiment, for the fracture core with a matrix effective permeability of 15 × 10−3 μm2, the 16 million g·mol−1 profile control agent was selected. The resistance coefficient was 19.2, the residual resistance coefficient was 81.4 and the plugging rate reached 87.6%;
(4) According to the injectability and oil displacement experiment results for the long fracture core, for the matrix effective permeability of a 15 × 10−3 μm2 core, the optimized polymer molecular weight and concentration were 16 million g·mol−1/1000–1500 mg·L−1 and the enhanced oil recovery reached 6.9–8.0 percentage points.

Author Contributions

D.Y. contributed to the conception of the study; K.L. performed the experiment and helped perform the analysis with constructive discussions; S.S. contributed significantly to analysis and manuscript preparation; Q.X. performed the data analyses and wrote the manuscript. All authors have read and agreed to the published version of the manuscript.

Funding

This work is funded by Ministry of Science and Technology of the People’s Republic of China, and the name of the project is “Demonstration Project for the Development of Dense Oil in Jiyang Depression, Bohai Bay Basin (2017ZX05072)”, of which, national science and technology are major special projects.

Conflicts of Interest

The authors declare that they have no conflict of interest.

Abbreviations

ASPThat is ternary composite system which is one of the most effective technologies for tertiary oil recovery, which includes alkali, surfactant and polymer.
JCYJ-1It is a kind of volume expansion profile control agent with temperature and salt resistance, which is developed according to the characteristics of qian43 formation in Jianghan Oilfield.
JCDC-1It is a kind of delayed bonding profile control agent with good injection performance.
PIPI decision-making technology is based on the wellhead pressure drop curve of water injection well, and the PI value of water injection well is calculated from the pressure drop curve of water injection well head. It reflects the change of wellhead pressure with time. Where: PI: pressure index of water injection well (MPa)
PVIt refers to the number of PV injected into the injection well, that is, the volume of polymer solution injected into the ground accounts for the total underground pore volume (unit PV).

References

  1. Hua, Z.; Lin, M.; Dong, Z.; Li, M. Study of deep profile control and oil displacement technologies with nanoscale polymer microspheres. J. Colloid Interface Sci. 2014, 424, 67–74. [Google Scholar] [CrossRef] [PubMed]
  2. Chen, C.; Wang, H.H.; Liu, Q.W. Influence of a crosslinked polymer profile-control agent on oil reservoir permeability. Chem. Technol. Fuels Oils 2017, 53, 135–139. [Google Scholar] [CrossRef]
  3. Wei, J.G. Evaluation of the gel profile control agent polyacrylamide in enhanced oil recovery. Adv. Pet. Explor. Dev. 2013, 5, 348–352. [Google Scholar]
  4. Li, Y.Q.; Jia, J.F. Screening the formula of deep profile control for class II reservoirs in sanan oilfield. Spec. Oil Gas Reserv. 2010, 4, 27. [Google Scholar]
  5. Zhou, Y.Z.; Yin, D.Y.; Zhang, C.L. Preparation and plug optimization of profile control agent in asp flooding. Pet. Geol. Recovery Effic. 2014, 21, 73–76. [Google Scholar]
  6. Wang, C.S.; Sun, Y.F.; Dong, G.Q.; Yu, H.Y.; Xu, Y.J. The development of the new high temperature resistance profile control agent which is compound with inorganic particles and ge. Adv. Pet. Explor. Dev. 2014, 7, 67–71. [Google Scholar]
  7. Lu, X.G.; Zhao, L.L.; Zhang, K. Effect and analysis on cr3⁺ gel improving profile control in alkalescent alkaline/surfactant/polymer flooding. J. Appl. Polym. Sci. 2009, 112, 2773–2780. [Google Scholar] [CrossRef]
  8. Liu, X.J. The research and application of profile control for low porosity and poor permeability fracture reservoir in baolang oilfield. J. Chongqing Univ. Sci. 2005. [Google Scholar] [CrossRef]
  9. Li, J.J.; Xiong, C.M.; Bai, Y.R.; Jiang, R.Y.; Wei, F.L.; Zhang, M. Leak-off behavior and water shut-off performance of a polymer/chromium(Cr3+) gel in fractured media. J. Cent. South Univ. 2017, 24, 1418–1429. [Google Scholar] [CrossRef]
  10. Iskander, G.; Nurxat, N.; Sarkyt, K. Bulk gels for permeability reduction in fractured and matrix reservoirs. Energy Rep. 2019, 5, 733–746. [Google Scholar]
  11. Mao, X. Optimization of chemical profile control agent in Naiman Oilfield. Technol. Wind 2020, 9, 157. [Google Scholar]
  12. Liu, X.B.; Shang, H.Z. Evaluation of dynamic gel forming performance of gel profile control agent in deep formation. Daqing Pet. Geol. Dev. 2020, 39, 86–90. [Google Scholar]
  13. Liu, J.X. Selection of water plugging and profile control formula system for Chang 6 reservoir in Hujianshan. Xi’an Shiyou Univ. 2018, 22–40. [Google Scholar]
  14. Shi, Z.M.; Wang, C.Y.; Pan, J.L. Formulation optimization of deep profile control agent. Contemp. Chem. Ind. 2018, 47, 831–835. [Google Scholar]
  15. Xu, C.M.; Li, X.W.; Guo, F.Y.; Yang, H.E.; Li, Y.T.; Wang, X.H. Method for carrying out profile control on fracture-type oil reservoir. Acta Petrolei Senica 2013, 932–937. [Google Scholar]
  16. Lin, L.J. Study on the response characteristics of oil wells after deep profile control in low permeability fractured reservoirs. Open Phys. 2018, 16, 832–838. [Google Scholar] [CrossRef]
  17. Li, Z.J.; Wu, W.M.; Pan, Y.Q.; He, S.W.; Ren, W.B.; Feng, Y.B. Sand-carrying profile control agent composition of fracture-cave type oil deposit and profile control method of profile control agent. J. Southwest Pet. Univ. (Sci. Technol. Ed.) 2012, 34, 83–87. [Google Scholar]
  18. Wang, X.; Guo, C.; Yang, T.; Li, H. Development and experimental evaluation of profile control physical model for low permeability fractured reservoir. Oilfield Chem. 2017, 34, 265–269, 284. [Google Scholar]
  19. Wu, Y.K. Research and application of profile control technology for low permeability reservoirs with high temperature and high salt. Pet. Geol. Eng. 2013, 4, 38. [Google Scholar]
  20. Shi, Y.; Xie, J.Y.; Gao, W. The application of pi decision technology on water plugging and profile control in oilfield. J. Xinjiang Pet. Inst. 2002, 50–52. [Google Scholar] [CrossRef]
  21. Zhang, L.S.; Shao, H.B.; Yao, H.S. Research and application of the deep profile control techology in fractured reservoirs with extra-low permeability. Reserv. Eval. Dev. 2011, 3, 58–61. [Google Scholar]
  22. Cao, Y.; Yue, X.A.; Yang, S.R.; Li, X.S.; Wang, M.; Hao, L.L. Preparation and evaluation of gel oily sludge profile control system. Oil Drill. Prod. Technol. 2012, 34, 77–80. [Google Scholar]
  23. Peng, Q.G.; Huang, B.; Yang, W.Y.; Chen, W.Y.; Meng, K.Q. EPMSC profile control echnology for a horizontal well in Bohai Oilfiel. Oilfield Chem. 2019, 36, 450–455. [Google Scholar]
  24. Jia, L. Water shutoff and profile control technology for fractured reservoirs with low permeability and ultra-low permeability. Petrochem. Ind. Technol. 2019, 26, 7. [Google Scholar]
  25. Li, Y. Study on particle plugging agent for fractured vuggy reservoir. China Univ. Pet. 2018. [Google Scholar] [CrossRef]
  26. He, T.; Wang, J.; Yu, H.; Xu, P.; Liu, X.W. Study on Mechanism of multiple rounds profile control in fractured water flooding reservoir. Reserv. Eval. Dev. 2018, 8, 68–72. [Google Scholar]
  27. Quan, H.H.; Zhu, Y.S.; Zhang, Z. Study on reasonable waterflooding development strategy for fractured low permeability reservoir. Ground Water 2018, 40, 90–92, 124. [Google Scholar]
Figure 1. Effect of molecular weight on the profile control agent gel viscosity.
Processes 08 01021 g001
Figure 2. Viscosity curves of the profile control agent with different molar ratios of chromium chloride and lactic acid.
Processes 08 01021 g002
Figure 3. Viscosity variation curves of the profile control system with different crosslinking agent concentrations.
Processes 08 01021 g003
Figure 4. Effect of the profile control system viscosity on the thiourea concentrations and temperatures.
Processes 08 01021 g004
Figure 5. Viscosity curves of the profile control system with different sodium chloride concentrations.
Processes 08 01021 g005
Figure 6. Viscosity curves of the profile control system with different sodium bicarbonate concentrations.
Processes 08 01021 g006
Figure 7. The viscosity curves of the profile control system with different shear rate.
Processes 08 01021 g007
Figure 8. Flow chart of the injectability experiment (1—water; 2—crosslinking system; 3—pump; 4—pressure gauge; 5—pressure-tapped; 6—measuring cylinder.).
Processes 08 01021 g008
Figure 9. Core injection pressure curves at the 15 × 10−3 μm2 permeability level.
Processes 08 01021 g009
Figure 10. Experimental flow chart of the oil displacement effect evaluation (1—pump; 2—six-way valve; 3—water; 4—oil; 5—profile control system; 6—pressure gauge; 7—six-way valve; 8—incubator; 9—pressure gauge; 10—collector.).
Processes 08 01021 g010
Figure 11. Effect of the 16 million g·mol−1 profile control experiment on concentrations.
Processes 08 01021 g011aProcesses 08 01021 g011b
Table 1. Relationship between gelation viscosity and the time for polymer profile control agents with different molecular weights.
Polymer Molecular Weight (g·mol−1)Time (d)
00.511.5358122030
Viscosity (mpa·s)
8 million20206012020032029023014084
10 million1496180230400641640520430360
13 million19177348636128517091709160314441371
16 million332685511780275928692737256523932250
19 million5842118062870328034993397334632763170
Table 2. Gelling time table of profile control agent.
Molecular Weight (g·mol−1)Concentration (mg·L−1)
500100015002000
Gelling Time (Day)
130032.72.52.4
160032.12.12
19002.51.51.51.4
Table 3. The optimal formulation of the crosslinking agent.
NameChromium ChlorideLactic AcidSodium Hydroxide
Content (%)2.562.611.87
Table 4. The formulation of polymer/chromium ion weak gel profile control system.
Molecular Weight of Polymer (10,000)Polymer Concentration (mg·L−1)Formulation of the
Crosslinking Agent
Crosslinking Agent Concentration
(mg·L−1)
Assisting Agent Concentration
(mg·L−1)
16001000–1500CrCl3lactic acidNaOH150ThioureaNaClNaHCO3
1900500–10002.56%2.61%1.87%900800700
Table 5. Basic parameters of injectability and plugging test cores.
Core No.Porosity (%) k m ( 10 3   μ m 2 ) k f ( 10 3   μ m 2 ) k f k m
Measured with GasMeasured with Water
#3-117.630//
#3-218.532.1//
#3-317.428.8//
#3-418.232.2198.856.2
#3-518.331.2192.966.2
#3-617.931.6196.956.2
Note: “/” means that there is no fracture in the core; k m is the matrix permeability; k f is the matrix + fracture permeability.
Table 6. The injectability test evaluation results.
Core No.Fracture ExistenceMolecular Weight of Polymer
(×10,000)
Concentration
(mg/L)
Water Drive Pressure Difference
(MPa)
Pressure Difference of Profile Control and Displacement
(MPa)
Pressure Difference of Subsequent Water Drive
(MPa)
Resistance CoefficientPlugging Rate
(%)
Coefficient of Residual ResistanceInjectability
#3-1×160010000.030/////Non injectable
#3-2×19005000.030/////Non injectable
#3-3160010000.0120.2110.89519.287.681.4Injectable
#3-419005000.011/////Non injectable
Table 7. Basic core parameters and schemes of the profile control system with different molecular weights and concentrations.
Core No.#4-1#4-2#4-3#4-4
Core size (cm)Length32323232
Width4.94.954.9
Height5.154.95
Volume (cm3)799.7784784784
Porosity (%)17.517.717.317.2
Pore volume (cm3)139.9138.8135.6134.8
k m (10−3 μm2)Measured with gas43.443.244.141.3
Effective conversion29.929.830.428.5
k f (10−3 μm2)Measured with water312.8288.2306.4291.8
Volume of saturated oil (cm3)86.285.583.983.6
Initial water saturation (%)38.438.338.137.9
Molecular weight of polymer/160016001600
Polymer concentration (mg·L−1)/50010001500
Timing of profile control (water content)/80%80%80%
Dosage of the profile control agent/0.150.150.15
Injection rate (mL·min−1)/0.150.150.15
RemarksWater driveProfile controlProfile controlProfile control
Recovery efficiency (%)39.143.84647.1

