Abstract
This paper is about the research that carbon nanotubes (CNTs) grow on aluminum foils without additional catalysts by atmospheric pressure microwave plasma chemical vapor deposition (AMPCVD) with the precursor of argon-hydrogen-ethanol. At different temperatures, a series of experiments that CNTs grow on aluminum foils were done with and without the alumina layer. The EDS results showed that iron impurities in aluminum foils catalyze the growth of CNTs. By measurements of SEM and HRTEM, tens of microns long and multi-walled CNTs are grown. The CNTs’ content in the sample changes more with the increase in temperature. The Raman measuring shows that CNTs have fewer defects with higher temperature. Finally, by measurements of EDS mapping and XRD on aluminum foil, the growth mechanism of CNTs was discussed.
1. Introduction
Carbon nanotubes (CNTs) have become one of the most interesting materials since Iijima synthesized them by the arc-discharge process in 1991 [1] because of their novel hollow-tube structure, nanometer dimensions, high specific surface area, excellent mechanics, electricity, and chemistry performance. To date, the typical techniques for synthesizing CNTs are those based on catalyst-assisted chemical vapor deposition (CVD) [2,3,4,5,6]. In order to improve the growth rate of nanomaterials and reduce the growth temperature, low-pressure plasma-enhanced chemical vapor deposition (PECVD) [7,8,9,10] has been developed. The effective catalysts are iron-family elements, including iron, cobalt, nickel, and their alloys [11,12]. The catalysts used to grow CNTs are commonly nanoparticles, colloidal particles, or solutions of catalyst precursors, and most of the catalyst deposition methods operate under vacuum and require specified equipment for vacuum delivery [13].
Thus, many studies have synthesized CNTs on materials containing iron, cobalt, and nickel as substrates, such as stainless steel [14,15] and mica [16]. However, the morphology and diameter of CNTs grown on stainless steel cannot be effectively controlled because there are no uniform nanoparticles on the substrate to catalyze their growth. About 1.8% of iron oxide (Fe2O3) uniformly disperses in the mica sheet, which can catalyze CNTs’ growth at high temperatures. However, the iron in mica-sheet content is low, and all of it is iron oxide, which requires high temperatures to catalyze CNTs. We found that commercial aluminum foil contains about 4–5% iron, which may be used as a substrate for the growth of CNTs.
Commercial aluminum foil has excellent electrical conductivity, is lightweight and flexible, has corrosion resistivity and a lower price, and is an available material, making it one of the most appropriate flexible substrates [17]. CNTs grown on the aluminum foil surface are ideal, flexible capacitor material, and are of enormous interest for a wide range of applications such as display, sensors, wearable electronics, etc. [17,18,19]. The typical way to grow CNTs on aluminum foil by CVD is to deposit a metal catalyst layer on the aluminum foil surface, such as Co or Fe [20,21,22,23]. The methods to deposit catalysts are physical vapor deposition, electroplating, and spin coating, etc., limiting the large-scale synthesis of CNTs on the aluminum foil and their application. In our previous study [14], atmospheric pressure microwave plasma chemical vapor deposition (AMPCVD) proved to be a useful nanomaterial synthesis technique. Because the atmospheric pressure microwave plasma and the tube furnace work independently, AMPCVD can increase the growth rate without reducing the quality of the CNTs grown on the stainless steel substrate.
This paper reports a simple and economical procedure for the direct growth of CNTs on commercial aluminum foil without any additional catalyst, using ethanol vapor as the carbon source by AMPCVD at 600–900 °C. The CNTs’ growth on aluminum foil with and without the oxide layer at different temperatures was analyzed, and the growth mechanism was discussed. We remind readers that this is the only study of CNTs’ growth on aluminum foil without additional catalysts.
2. Experiment
Figure 1 shows the schematic diagram of the AMPCVD. A coaxial microwave plasma generator was used to produce an atmospheric pressure microwave plasma with 200 W power, completely decomposing the ethanol precursor into CH, C2, and HO groups. These carbon-containing groups reacted with catalysts on the substrate to grow CNTs at a suitable temperature provided by the tube furnace with a ±1 °C temperature accuracy. The addition of atmospheric pressure microwave plasma technology enhanced the decomposition ability of the CVD precursor. At the same time, it retained the advantages of CVD technology, such as accurate growth temperature, a large growth area for nanomaterials, and a wide pressure range. These characteristics made the nanomaterials grown by AMPCVD under the same substrate and temperature have a higher growth rate with a similar defect concentration compared with CVD.
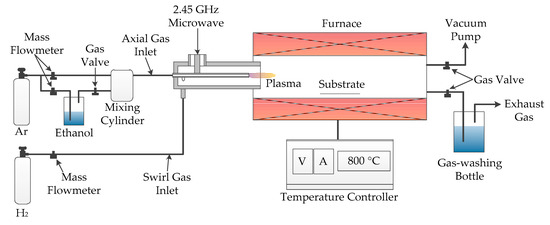
Figure 1.
The diagram of atmospheric pressure microwave plasma chemical vapor deposition (AMPCVD) for carbon nanotubes’ (CNTs) growth on aluminum foil with the ethanol precursor.
In the experiment, to understand the effect of the alumina layer on the growth of CNTs, the commercial aluminum foil and the aluminum foil with an oxide layer removed by acid treating were used as the substrates for CNTs’ growth. The carbon source was produced by 100 sccm (standard cubic centimeter per minute) argon (99.999%, JND Gas Co. Ltd, Chengdu, China) bubbling 10 mL ethanol (99.7%, Chron Chemicals, Chengdu, China) at 30 °C. During the growth of CNTs, the gas flow of the axial gas inlet was 800 sccm (100 sccm ethanol vapor and 700 sccm argon), and the swirling gas was 200 sccm hydrogen (99.999%, JND Gas Co. Ltd., Chengdu, China). The CNTs’ growth temperatures of 500, 600, 700, 800, and 900 °C were investigated because the growth-temperature range of CNTs on stainless steel substrates is 500–900 °C by AMPCVD.
Aluminum foils were cleaned using acetone and ethanol with 10 min sonication, followed by rinsing with deionized water. One of the cleaned substrates was immersed in 1 M aqueous hydrochloric (HCl, Chron Chemicals, Chengdu, China) for 1 min and rinsed with deionized water (Chron Chemicals, Chengdu, China) to remove its oxide layer, while the other one was not treated. Both substrates were dried at 60 °C for 10 min and placed in the quartz tube (diameter: 52 mm, length: 600 mm) of the AMPCVD reactor (Laboratory self-built). Firstly, we used a vacuum pump to empty the air in the quartz tube. Then, we swirled 200 sccm hydrogen into the reactor until the pressure in the quartz tube was raised to the atmosphere, and we turned the valve of the gas-washing bottle on. After 120 min of hydrogen flow, the furnace was heated to the growth temperature, followed by pumping 800 sccm argon to the plasma generator and then exciting plasma. When the furnace temperature was stable, bubbling ethanol was kept at 30 °C with 100 sccm argon. Then 700 sccm argon and 100 sccm ethanol-vapor mixture gas were pumped into the AMPCVD through the plasma for CNT growth. Finally, after 10 min growth process of CNTs, we turned the system off. When the furnace cooled down to room temperature under the hydrogen environment, the CNTs were prepared on the aluminum foils.
The CNTs grown on the substrate can be measured directly by SEM, EDS, XPS, Raman, and XRD. TEM samples were prepared by sonicating the substrates in ethanol to obtain the CNTs’ ethanol dispersion and then dropping them onto a copper grid. Morphology of fabricated CNTs on aluminum foil was studied using Scanning Electron Microscopy (SEM; Hitachi S-5000 20 kV, Tokyo, Japan) and Transmission Electron Microscope (TEM; FEI Tecnai G2 F20 200 kV, Hillsboro, OR, USA). The chemistry of the CNTs and the substrates were examined using energy dispersive spectroscopy (EDS; attached to the Hitachi S-5000, Tokyo, Japan) and X-ray photoelectron spectroscopy (XPS; Thermo Fisher Escalab Xi+, Waltham, MA, USA). A qualitative analysis of the grown CNTs was performed by Raman spectroscopy (LabRAM; HR Evolution Horiba, Kyoto, Japan) at 532 nm wavelength. X-ray diffraction (XRD; Bruker D8 Advance A25X, Karlsruhe, German) and a Field emission scanning electron microscope (FESEM; FEI Inspect F50, Hillsboro, OR, USA) were adopted to analyze the structure of iron impurity dispersed in aluminum foil.
3. Experiment Results and Discussion
3.1. CNTs Grown on the Aluminum Foil with an Oxide Layer
Figure 2 shows the aluminum foil after the CNT formation process at 600, 700, 800, and 900 °C. At the temperature of 600 °C, the aluminum foil shows no apparent change, indicating the aluminum foil does not melt. Small wrinkles appear on the substrate surface at 700 °C, indicating that the aluminum foil begins to melt. The substrate surface wrinkles and the color changes from silver to yellow and gray at 800 and 900 °C, indicating that the aluminum foil melts at both temperatures.
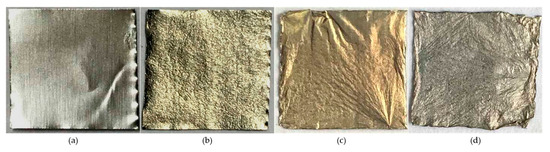
Figure 2.
The photos of the aluminum foil substrates after the CNT formation process at (a): 600, (b): 700, (c): 800, and (d): 900 °C.
CNTs cannot grow on the aluminum foil at 500 °C; they can grow on the edge at 600–900 °C, shown in Figure 3a–d, and grow on the oxide layer surface at 800 and 900 °C, shown in Figure 3e,f. The CNTs that grew on the surface and the edge at the same temperature have an extremely similar structure. The CNTs are disordered orientations, and their length at all temperatures is about tens of micrometers. The density of CNTs grown on the surface at 900 °C is much higher than that at 800 °C, and the CNTs on the edge show no difference at all temperatures.
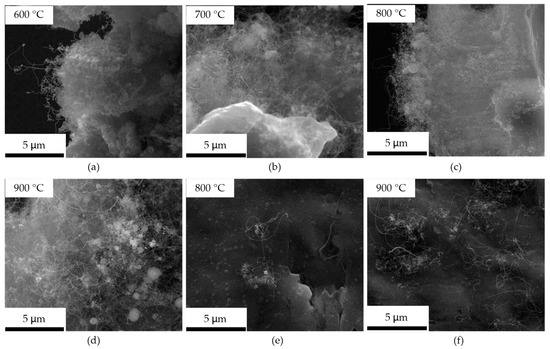
Figure 3.
The SEM micrographs of the CNTs obtained at 600, 700, 800, and 900 °C on the aluminum foil. (a–d) is the CNTs grown on the edge at 600, 700, 800, and 900 °C; (e,f) is the CNTs grown on the surface at 800 and 900 °C.
Figure 4 shows the HRTEM micrographs of CNTs grown at 600–900 °C ethanol dispersions dropped on a copper grid; their thickness and layer distances were measured, as shown in Figure 4e–h. Figure 4a,e shows the micrographs of the CNTs grown at 600 °C, with a lot of carbon layer stacking faults in the wall of the CNTs. The discontinuous carbon layer of the wall at 600 °C is due to the low catalyst nanoparticles’ activity at 600 °C, resulting in a weak carbon-dissolving and precipitating ability. The CNTs’ walls grown at 700, 800, and 900 °C are composed of tightly aligned graphite sheets with a layer distance of 0.34 nm. The content of amorphous carbon attached to CNTs decreases with the increase in temperature, contributing to an increased quality of the CNTs. Figure 4d–h shows the CNT grown at 900 °C; its surface is smooth, and the carbon layer of the CNT is uniform and tight. Figure 4i–l shows the diameter distribution of CNTs grown on the aluminum foil at 600–900 °C. The results show that the diameters of CNTs grown at 600, 700, 800, and 900 °C are 10–20, 14–22, 16–26, and 22–47 nm, respectively, and increase gradually with the increase in temperature. The narrow diameter distribution and uniform density contribute to the uniformly disperse distribution and size of catalyst nanoparticles in commercial aluminum foil.
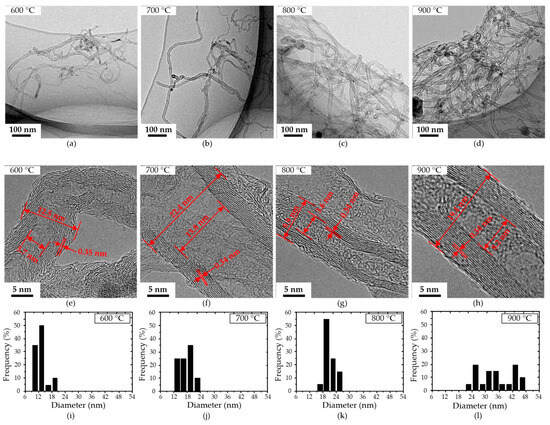
Figure 4.
HRTEM images of CNTs grown on the aluminum foil at 600, 700, 800, and 900 °C. (a–d): low-magnification images; (e–h): high-magnification images; (i–l): the diameter distribution of CNTs in (a–d).
The EDS spectra are shown in Figure 5, confirming the presence of oxygen, silicon, and iron in addition to carbon and aluminum. It is speculated that the high amount of oxygen present in the sample is due to the oxide layer of the aluminum foil. The EDS spectra give evidence that the iron impurity in the aluminum foil catalyzed the growth of CNTs because the elements of silicon and aluminum normally cannot catalyze the CNTs’ growth. In order to ensure that it is iron impurity acting as the catalyst, a high-purity aluminum foil was used as a substrate to grow CNTs at 800 °C, but no CNTs grew. We proved that it is the iron impurity in commercial aluminum foil that catalyzed the growth of CNTs.
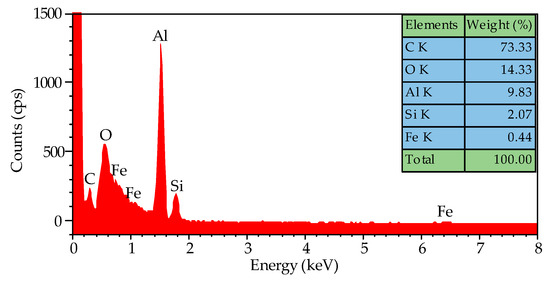
Figure 5.
The EDS spectra of the CNTs grown on the aluminum foil at 800 °C, and their amounts of specific elements.
Figure 6 shows the Raman spectra of the CNTs at 600, 700, 800, and 900 °C grown on the substrates with 532 nm laser at room temperature. In three Raman spectra of 700, 800, and 900 °C, two peaks centered at 1336 and 1577 cm−1 were observed, and they are 1336 and 1594 cm−1 at 600 °C. They correspond to the graphitic phase D and G bands, proving the presence of crystalline carbon. The intensity ratio of D peak and G peak (ID/IG) is sensitive to structural defects in the CNTs; the lower the value, the more graphitic the carbon. With the increase of the synthesis temperature, the D peak narrowed and the ID/IG ratio decreased, indicating the increased graphitic crystallinity of the CNTs. The G peak of pure graphite is at 1582 cm−1, and the blue shift of the G peak of the CNTs grown at 600 °C is caused by the high-defect concentration on the samples. The lowest ID/IG ratio (0.71) was found for the sample obtained at 900 °C. We can conclude that most graphitic carbon is obtained at 900 °C.
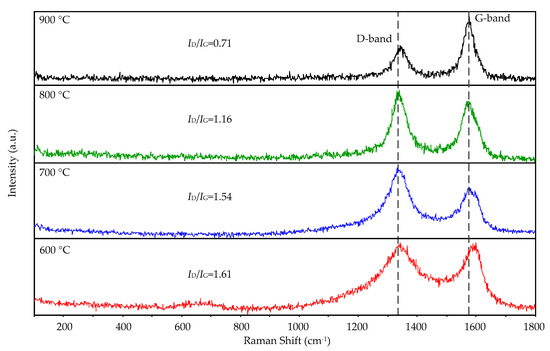
Figure 6.
Raman spectra of the CNTs grown on the aluminum foils by the AMPCVD at 600, 700, 800, and 900 °C.
The surface purity of the growth CNTs at 900 °C was investigated by XPS measurement. The XPS spectra show that the CNTs contain C, O, and N elements, as shown in Figure 7a. Figure 7b shows the magnified view of the C1s peak, indicating that the main components are C–C/C = C (284.6 eV, 80.46%), and the surface defects are hydroxyl (–C–OH/–C–N, 286.0 eV, 19.54%). The hydroxyl groups attached on the CNTs’ surface were mainly from the decomposition of the ethanol precursor.
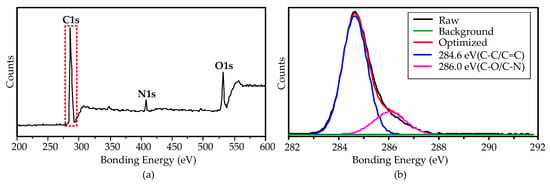
Figure 7.
XPS spectra of the CNTs grown on the aluminum foils by the AMPCVD at 900 °C. (a): the global spectra; (b): the magnification view of C1s.
3.2. CNTs Grown on the Aluminum Foil without an Oxide Layer
The air oxidizes the aluminum foil to form a dense alumina layer on its surface. To investigate the effect of the alumina layer on the growth of CNTs, we used HCl, treating aluminum foil to remove its oxide layer and then grow CNTs at 600–900 °C. The aluminum foils after the CNT formation process at 600, 700, 800, and 900 °C are shown in Figure 8. The substrate shows no obvious change at 600 °C, which indicates the aluminum foil does not melt. Small wrinkles appear on the substrate surface at 700 °C, indicating that the aluminum foil begins to melt. The substrates shrink, wrinkle, and change color at 800 and 900 °C, suggesting that the aluminum foil entirely melts with partial evaporation.
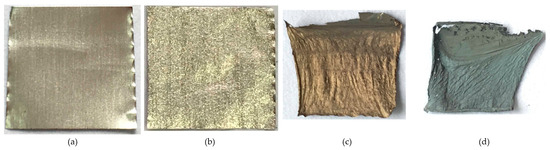
Figure 8.
The photos of the aluminum foil substrates without an oxide layer after the CNT formation process at (a): 600, (b): 700, (c): 800, and (d): 900 °C.
CNTs only grow on the substrate surface at 600 and 700 °C, shown in Figure 9a–d, and the density of the former is much higher than the latter. The obtained CNTs have disordered orientation, and their length and diameter are 3–10 μm and 18–25 nm at 600 °C, and at 1–5 μm and 40–110 nm at 700 °C. Much amorphous carbon is attached to the surface of the CNTs at 600 °C, as shown by red arrows in Figure 9c.
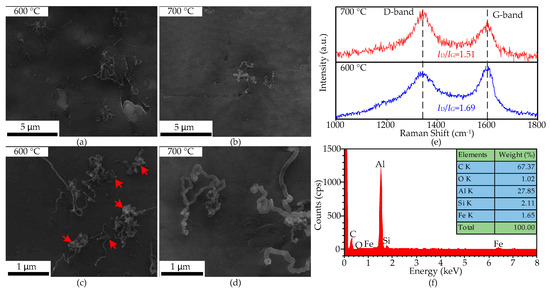
Figure 9.
The SEM micrographs and Raman spectra of the CNTs obtained at 600 and 700 °C on the aluminum foil treated by HCl. (a,b): low-magnification images; (c,d): high-magnification images; (e): Raman spectra of the CNTs; (f): EDS spectra of the CNTs at 600 °C.
The Raman spectra of the CNTs grown on the surface of aluminum foil treated by HCl at 600 and 700 °C are shown in Figure 9e, and their ID/IG ratios are 1.69 and 1.51, respectively. The D peak and G peak of the CNTs grown at both temperatures are all centered at 1343 and 1600 cm−1, the blue shift of the G peak indicating the defection concentration of the CNTs is high, and the broadening of the D peak at 600 °C is caused by amorphous carbon. Compared with the CNTs grown on the edge of the aluminum foil, the defection concentration of the CNTs grown on the surface is slightly higher at the same temperature. Figure 9f shows the EDS spectra of the CNTs grown on the aluminum surface at 600 °C. The oxygen weight content has decreased to 1.02%, proving that the HCl has indeed removed the oxide layer on the aluminum-foil surface.
3.3. CNTs Growth Mechanism on the Aluminum Foil
Figure 10a shows the distribution of aluminum, oxygen, and iron on the original aluminum foil surface, and their contents are 87.4%, 7.1%, and 5.5%, respectively; the distribution of iron particles is even. Figure 10b shows the XRD spectra of the original aluminum foil—iron oxide (Fe2O3) peak (JCPDS card No. 16-0653) at 16.2° (2θ), ferrous oxide (FeO) peak (JCPDS card No. 06-0615) at 41.9° (2θ), and a trace of iron (Fe) peak (JCPDS card No. 06-06960) at 82.3° (2θ) were observed. The results prove that the iron impurity on the aluminum-foil surface mainly exists in Fe2O3. However, no Al2O3 peaks were detected in the XRD spectra for its low content.
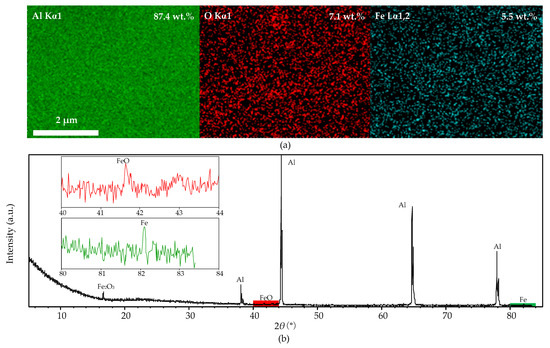
Figure 10.
The EDS mapping and XRD spectra of the original foil after cleaning process, (a): EDS mapping micrograph; (b): XRD spectra.
The Fe2O3 nanoparticles are reduced to Fe nanoparticles under the hydrogen atmosphere at high temperatures. Figure 11a shows the XRD spectra of the substrates reduced under hydrogen at 600, 700, 800, and 900 °C. When the temperature is 600 °C, the XRD spectra show that the iron nanoparticles embedded in the alumina layer are Fe2O3 (16.2°, 28.2°, 46.4°, and 56.0° (2θ)), which cannot catalyze the growth of CNTs effectively. When the temperature is 700 °C, a trace of Fe is detected in the XRD spectra, but the Fe2O3 is still dominant. When the furnace temperature increased to 800 and 900 °C, the XRD shows that the Fe2O3 nanoparticles are completely reduced into Fe, which could catalyze the growth of CNTs. The CNTs’ density at 900 °C is higher than at 800 °C, is due to the higher activity of Fe nanoparticles at a higher temperature. The EDS mapping micrograph (shown in Figure 11b) shows the distribution of the Fe nanoparticles on the aluminum foil at 900 °C. The reason for the low iron content (0.6 wt.%) on the aluminum foil surface is that the iron nanoparticles dispersed in the aluminum foil sink into the molten aluminum at 900 °C. The size and distribution of iron nanoparticles on the aluminum foil surface show no difference with the original one (Figure 10a), indicating that alumina effectively protected the distribution of Fe nanoparticles. The uniform diameter of CNTs contributes to the uniform size of Fe nanoparticles in aluminum.
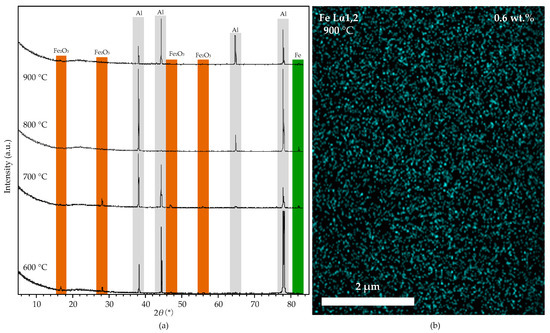
Figure 11.
(a): the XRD spectra of the aluminum foil with alumina film after the reduction process at 600, 700, 800, and 900 °C. (b): the EDS mapping micrograph of the substrate at 900 °C.
Figure 12a shows the XRD spectra of the aluminum foil treated by HCl and reduced at 600, 700, and 800 °C. The spectra show that Fe and traces of Fe2O3 were detected at 600 °C, indicating that the iron impurity dispersed in the aluminum foil mainly exists in Fe nanoparticles. HCl treatment removed the oxide layer from the aluminum foil and exposed the Fe nanoparticles to the carbon-containing groups, resulting in the catalytic growth of CNT on the substrate surface at 600 °C. Figure 12b shows the EDS mapping micrograph of the aluminum foil treated by HCl and reduced at 700 °C. The result shows some Fe particles with a diameter of 1–2 μm on the aluminum foil surface, and the iron content is only 3.1%. Compared with the original one, the iron particles become larger and fewer. The XRD spectra also show that the amount of Fe and Fe2O3 becomes tiny. When the temperature reaches 700 °C (higher than the melting point of 660 °C), the aluminum foil surface partly melts. The iron nanoparticles agglomerate into large particles on the surface and partly sink into the liquid aluminum, resulting in the significant reduction and thickening of CNTs. Figure 12 shows that no Fe or Fe2O3 was detected in the XRD spectra of the substrates reduced at 800 °C. The reason is that the aluminum foil melts entirely at such a high temperature; the liquid aluminum covers the Fe nanoparticles and blocks their contact with the carbon-containing groups, resulting in no CNTs growing on the substrate surface.
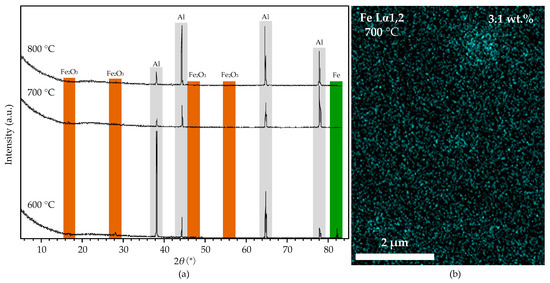
Figure 12.
(a): the XRD spectra of the aluminum foil without alumina film after reduction process at 600, 700, and 800 °C. (b): the EDS mapping micrograph of the substrate after reduction process at 700 °C.
CNTs can grow on the aluminum foil edge at 600–900 °C because the cut section of the aluminum foil exposes the iron nanoparticles. During the heating process, the cut surface would react with the residual oxygen in the tubular furnace to form an oxide layer, and iron nanoparticles were not oxidized due to the presence of hydrogen. Therefore, a layer of alumina film with uniform distribution of iron nanoparticles formed on the edge of the aluminum foil. In the growth process of CNTs, each iron nanoparticle is a seed to grow a carbon nanotube, which results in the CNTs’ density showing no difference at all temperatures. The iron catalyst activity increases with the increase of furnace temperature; hence, the diameter of CNTs grown at 900 °C is thicker than at 800 °C.
Compared to the CNTs grown on the alumina layer, the CNTs grown on the aluminum surface at the same temperature have much amorphous carbon, a less-uniform growth distribution, thicker diameter and shorter length, and are of inferior quality. We can conclude that the alumina layer effectively prevents the catalyst nanoparticles from clustering at high temperatures, making the catalyst nanoparticles distribute evenly on the surface and catalyze the growth of the uniform CNTs.
4. Conclusions
Herein we report on CNTs’ growth on commercial aluminum foils by the AMPCVD using ethanol vapor as the carbon source without additional catalysts at 600, 700, 800, and 900 °C. The iron impurity dispersed in the commercial aluminum foil catalyzed the growth of CNTs. The alumina layer maintained the uniform dispersion and size of iron nanoparticles at high temperatures, making the CNTs grow more uniformly and with less amorphous carbon than on the aluminum surface. The CNTs grown on the alumina layer were multiwalled and had disordered orientation, and their diameter and content increased with the increase in temperature. The defect concentration of the CNTs decreased with the increase in growth temperature. In the AMPCVD synthesis study at 500, 600, 700, 800, and 900 °C, the optimum synthesis temperature was 900 °C; at the optimum temperature of 900 °C, the highest yield of CNTs was obtained, and the best product crystallinity was produced.
Author Contributions
Conceptualization, L.T. and D.L.; methodology, L.T.; software, D.L.; validation, L.T.; formal analysis, D.L.; investigation, D.L.; resources, L.T.; data curation, L.T.; writing—original draft preparation, D.L.; writing—review and editing, L.T.; visualization, D.L.; supervision, L.T.; project administration, L.T.; funding acquisition, L.T. All authors have read and agreed to the published version of the manuscript.
Funding
This work is supported by the National Key Research and Development Program of China (2016YFF0102100) and the Pre-research Project of Civil Aerospace Technology of China (D040109).
Acknowledgments
The high temperature tube furnace and sealing technology are supported by Tianjin ZHONGHUAN Electric Furnace Co. Ltd.
Conflicts of Interest
The authors declare no conflict of interest. The funders had no role in the design of the study; in the collection, analyses, or interpretation of data; in the writing of the manuscript, or in the decision to publish the results.
Correction Statement
This article has been republished with a minor correction to the reference 21. This change does not affect the scientific content of the article.
References
- Iijima, S. Helical microtubules of graphitic carbon. Nature 1991, 354, 56–58. [Google Scholar] [CrossRef]
- Eres, G.; Puretzky, A.A.; Geohegan, D.B. In situ control of the catalyst efficiency in chemical vapor deposition of vertically aligned carbon nanotubes on pre-deposited metal catalyst film. Appl. Phys. Lett. 2004, 84, 1759–1761. [Google Scholar] [CrossRef]
- Zhu, L.W.; Zhou, L.K.; Li, H.X.; Wang, H.F.; Lang, J.P. One-pot growth of free-standing CNTs/TiO2 nanofiber membrane for enhanced photocatalysis. Mater. Lett. 2013, 95, 13–16. [Google Scholar] [CrossRef]
- Cheng, J.; Zou, X.P.; Yang, G.Q. Temperature effects on synthesis of multi-walled carbon nanotubes by ethanol catalyst chemical vapor deposition. Adv. Mater. Res. 2010, 123, 799–802. [Google Scholar] [CrossRef]
- Li, W.Z.; Xie, S.S.; Qian, L.X.; Chang, B.H.; Zou, B.S. Large-scale synthesis of aligned carbon nanotubes. Science 1996, 274, 1701. [Google Scholar] [CrossRef]
- Lee, O.; Jung, J.; Doo, S.; Kim, S.S.; Noh, T.H.; Kim, K.I.; Lim, Y.S. Effects of temperature and catalysts on the synthesis of carbon nanotubes by chemical vapor deposition. Met. Mater. Int. 2010, 16, 663–667. [Google Scholar] [CrossRef]
- Youcef, F.; Kihel, M.; Sahli, S.; Raynayd, P. Synthesis of nanopowders in a PECVD reactor from organosilicon precursor. Phosphorus Sulfur 2019, 6, 1–5. [Google Scholar]
- Kobashi, K.; Nishimura, K.; Kawate, Y. Synthesis of diamonds by use of microwave plasma chemical-vapor deposition: Morphology and growth of diamond films. Phys. Rev. B Condens. Matter 1988, 38, 4067–4084. [Google Scholar] [CrossRef]
- Taylor, A.; Ashcheulov, P.; Hubík, P. Precursor gas composition optimisation for large area boron doped nano-crystalline diamond growth by MW-LA-PECVD. Carbon 2018, 128, 164–171. [Google Scholar] [CrossRef]
- Caughman, J.B.O.; Baylor, L.R.; Guillorn, M.A.; Merkulov, V.I.; Lowndes, D.H. Growth of vertically aligned carbon nanofibers by low-pressure inductively coupled plasma-enhanced chemical vapor deposition. Appl. Phys. Lett. 2003, 83, 1207. [Google Scholar] [CrossRef]
- Fan, S.S.; Chapline, M.G.; Franklin, N.R.; Tombler, T.W.; Cassell, A.M.; Dai, H.J. Self-oriented regular arrays of carbon nanotubes and their field emission properties. Science 1999, 283, 512–514. [Google Scholar] [CrossRef] [PubMed]
- Miao, J.Y.; Hwang, D.H.; Narasimhulu, K.V.; Lin, P.I.; Chen, Y.T.; Lin, S.H.; Hwang, L.P. Synthesis and properties of carbon nanospheres grown by CVD using Kaolin supported transition metal catalysts. Carbon 2004, 42, 813–822. [Google Scholar] [CrossRef]
- Dogru, I.B.; Durukan, M.B.; Turel, O.; Unalan, H.E. Flexible supercapacitor electrodes with vertically aligned carbon nanotubes grown on aluminum foils. Prog. Nat. Sci. Mater. Int. 2016, 26, 232–236. [Google Scholar] [CrossRef]
- Li, D.; Tong, L.; Gao, B. Synthesis of multiwalled carbon nanotubes on stainless steel by atmospheric pressure microwave plasma chemical vapor deposition. Appl. Sci. 2020, 10, 4468. [Google Scholar] [CrossRef]
- Tripathi, P.V.; Durbach, S.; Coville, N.J. Synthesis of multi-walled carbon nanotubes from plastic waste using a stainless-steel CVD reactor as catalyst. Nanomaterials 2017, 7, 284. [Google Scholar] [CrossRef]
- Chen, J.; Gao, F.; Zhang, L.; Huang, S. Catalyst-free growth of oriented single-walled carbon nanotubes on mica by ethanol chemical vapor deposition. Mater. Lett. 2009, 63, 721–723. [Google Scholar] [CrossRef]
- Li, L.; Wu, Z.; Yuan, S.; Zhang, X.B. Advances and challenges for flexible energy storage and conversion devices and systems. Energy Environ. Sci. 2014, 7, 2101–2122. [Google Scholar] [CrossRef]
- Wang, X.; Lu, X.; Liu, B.; Chen, D.; Tong, Y.; Shen, G. Flexible energy-storage devices: Design consideration and recent progress. Adv. Mater. 2014, 26, 4763–4782. [Google Scholar] [CrossRef]
- Balamurugan, J.; Nguyen, T.T.; Aravindan, V.; Kim, N.H.; Lee, S.H.; Lee, J.H. All ternary metal selenide nanostructures for high energy flexible charge storage devices. NANO Energy 2019, 65, 103999. [Google Scholar] [CrossRef]
- Jung, M.; Kim, H.G.; Lee, J.K.; Joo, O.S.; Mho, S.I. EDLC characteristics of CNTs grown on nanoporous alumina templates. Electrochim. Acta 2004, 50, 857–862. [Google Scholar] [CrossRef]
- Ghai, V.; Chatterjee, K.; Agnihotri, P.K. Vertically aligned carbon nanotubes-coated aluminum foil as flexible supercapacitor electrode for high power applications. Carbon Lett. 2021, 31, 473–481. [Google Scholar] [CrossRef]
- Emmenegger, C.; Bonard, J.M.; Mauron, P.; Sudan, P.; Lepora, A.; Grobety, B.; Zuttel, A.; Schlapbach, L. Synthesis of carbon nanotubes over Fe catalyst on aluminuim and suggested growth mechanism. Carbon 2003, 41, 539–547. [Google Scholar] [CrossRef]
- Lin, C.C.; Yang, C.L. Carbon nanotubes grown on nanoporous alumina templates/aluminum foil for electrodes of aluminum electrolytic capacitors. J. Electrochem. Soc. 2010, 157, A237–A241. [Google Scholar] [CrossRef]


Publisher’s Note: MDPI stays neutral with regard to jurisdictional claims in published maps and institutional affiliations. |
© 2020 by the authors. Licensee MDPI, Basel, Switzerland. This article is an open access article distributed under the terms and conditions of the Creative Commons Attribution (CC BY) license (http://creativecommons.org/licenses/by/4.0/).