Article

Experimental and Numerical Analysis of a Low Environmental Impact Pyro-Gasification System for the Energetic Valorization of Waste through a Biomass Steam Power Plant

by
Alfredo Gimelli
1,*,
Massimiliano Muccillo
1,*,
Raniero Sannino
2,
Giacobbe Braccio
3,
Vincenzo Capone
1,
Giacinto Cornacchia
3,
Matteo Manganiello
1,
Carmine Mongiello
3 and
Vinod Kumar Sharma
3
1
DII–Department of industrial engineering, University of Naples Federico II, 80125 Napoli, Italy
2
CNR-STEMS, 80125 Napoli, Italy
3
ENEA-TERIN-BBC, 75026 Matera, Italy
*
Authors to whom correspondence should be addressed.
Processes 2021, 9(1), 35; https://doi.org/10.3390/pr9010035
Submission received: 17 November 2020 / Revised: 20 December 2020 / Accepted: 21 December 2020 / Published: 25 December 2020
(This article belongs to the Special Issue Biomass to Renewable Energy Processes)

Abstract

:
This paper addresses the study of a pyro-gasification plant designed, built, and operated to recover inert metals from different types of solid waste. Experimental tests were carried out using pulper as the solid waste. However, while a reliable composition analysis of the produced syngas was carried out, a precise composition evaluation of the pulper used during the experimental activities was not performed and the related data were characterized by unacceptable uncertainty. Therefore, with the aim of reliably characterizing the plant operation, a thermochemical model of the gasification process was setup to simulate the equilibrium operation of the plant and a vector optimization methodology was used to calibrate the numerical model. Then, a decision-making problem was solved to identify the most suitable optimal solution between those belonging to the Pareto optimal front, thus obtaining reliable composition data for the adopted pulper waste. In particular, four different identification criteria were applied for the selection of small subset of solutions over the 3138 dominant solutions found. Among them, the solution (i.e., set of calibration parameters) that minimizes the experimental-numerical difference between the lower heating value of the produced syngas seemed to provide the most reliable approximation of the real plant operation. Finally, a possible plant configuration is proposed for the energetic valorization of the pulper waste and its overall conversion process efficiency is estimated.

1. Introduction

The balance between energy supply and energy demand is a critical issue to address, as widely discussed in [1]. At the end of this century, the global energy demand is expected to be about six times greater than the current. Today, the available energy supply is much lower than the energy required in many of the developing countries. Moreover, fossil fuels are still the main primary sources of energy worldwide (Figure 1, [2]), covering approximately 82% of the total electricity generation [3,4,5].
Although energy-related CO2 emissions stalled in 2015 [6] because of the improvements in energy efficiency and an increasing use of low-carbon energy and renewable energy sources, a more efficient use of energy and an increasing use of renewable energy sources are still mandatory to limit the rise in the global average temperature below 2 °C above pre-industrial levels (Figure 2, [7,8]). In this scenario, alternative sources of energy such as those provided by emerging waste-to-energy (WtE) processes could play a fundamental role [9]. The problem of disposal of a huge quantity of generated waste along with the need of reliable sources of renewable energy are common in many developing countries. Therefore, the use of waste as a potential renewable energy source could be a useful solution, also meeting the increasing demand for energy [3]. Moreover, promoting technologies for waste valorization could be part of the policies to limit the global average temperature rise, entailing the increase in the share of renewable energy (i.e., biomass and waste in Figure 2) expected by 2050.
Since traditional waste disposal is one of the major causes of environmental pollution, WtE technologies may significantly reduce the potential environmental impact of waste disposal. Therefore, WtE processes are considered among the most suitable options to tackle waste-related problems [3]. A report from the World Bank estimates that waste generation will increase from 2.01 billion tons in 2016 to 3.40 billion tons in 2050 [10]. For this reason, in recent decades, possible solutions to disposal of municipal solid waste (MSW) in landfills are attracting much attention because of the clearly negative environmental impact deriving from inadequate waste management. Environmental issues include landscape impact, dust, and leachate production, and emissions of contaminating gases [11]. Some research works indicate how recycling could be, depending on the energy recovery technologies, a better option than energy recovery [5,12]. However, about 70% of the waste could be generally recycled. Therefore, whenever recovery and reuse of materials cannot be pursued, different treatment technologies can be adopted to effectively generate energy from waste, thus avoiding the use of landfills and leading to economic and environmental benefits [13,14,15].
Biological and thermochemical treatments are more commonly used; thermal treatments can be obtained through pyrolysis, gasification, or incineration [16]. Until recently, incineration was the most widespread WtE technology with more than 1400 incineration plants operating around the world [17]. However, even the last generation of waste incinerators are limited by low electric efficiency of about 22–25% [18] because of the maximum steam temperature at the boiler outlet, which is normally lower than 450 °C to prevent corrosion by gaseous HCl [19,20]. Moreover, the incineration process generates a lot of acid gases, heavy metals, dioxins, and other pollutants [21]. For these reasons, in recent years, a considerable interest has grown toward other WtE technologies, particularly pyrolysis and gasification [21]. Pyrolysis and gasification of waste can eliminate dioxin emissions [20]. In fact, the reducing atmosphere that characterizes gasification and pyrolysis processes strongly limits the emission of pollutants such as dioxins, furans, and NOX, as well as greenhouse gas emission [22,23,24,25,26,27,28,29,30,31,32]. Nevertheless, both pyrolysis and gasification processes present environmental issues that cannot be neglected. Pyrolysis, which can either be used as an independent process or pretreatment for gasification, produces tar, besides char and gas, whose proportion depends on both feedstock properties and operating parameters [23,24]. Therefore, in biomass gasification, beyond syngas production and CO2 sequestration, there are major environmental concerns and problems in downstream equipment caused by tar production [25,26]. Another relevant problem is the formation of HCl, but also H2S and NH3, which occurs, for example, during gasification of MSW containing significant amounts of chlorine (due to the presence of polyvinyl chloride, PVC), sulfur, and heavy metals [27,28]. Both the liquid product of pyrolysis process, which is an acidic combustible liquid, and hydrochloric acid cause fouling, severe corrosion to downstream equipment, like a gas turbine or internal combustion engine, and poisoning of catalysts [29,30,31].
As for the energetic valorization of waste in WtE plants, it is widely recognized how a high energetic efficiency can be achieved by coupling pyrolysis and gasification plant to gas turbine, internal combustion engine, or combined-cycle gas-steam turbine power plants [22]. Therefore, WtE technologies provide a method to simultaneously address the problems related to energy demand, waste management, and greenhouse gas emissions. In addition, they can be included in a circular economy system (CES) [33]. CES refers to an economic strategy that suggests innovative ways to transform the current mainly linear consumption system into a circular one achieving economic sustainability through the necessary material savings [34]. Indeed, CES concept aims to extend the useful life of materials by promoting recycling while reducing use of resources and environmental impact [35]. The subject of the proposed research work is part of the problem described above and focuses on WtE technologies, pyrolysis, and gasification. Specifically, this work concerns the numerical and experimental analysis of a pyro-gasification plant originally designed, built, and operated to recover inert metals. Then, with the aim of ensuring a more flexible plant operation allowing biomass, plastics, metals, MSW, and other different type of waste to be treated, the capability of converting waste from paper processing (i.e., pulper) into synthesis gas (syngas), that can be profitably burned, has been tested. While a rigorous and certified composition analysis of the produced syngas was conducted, a precise composition evaluation of the pulper used during the experimental tests was not carried out. Hence, pulper waste has been characterized by an average proximate and ultimate analysis assumed as reference. Then, with the aim of reliably characterizing the plant operation and estimate the unknown chemical composition of the pulper waste, a thermochemical model of the process has been setup and then calibrated to simulate the equilibrium operation of the plant. Similar examples of this modeling approach can be found within the published literature [36,37,38,39,40,41,42,43,44]. However, the complex model calibration phase required the adoption of a specific vector optimization methodology proposed by the authors. In particular, starting from some of the available data obtained through the experimental tests, a multi-objective optimization problem has been set up and solved to reliably calibrate the numerical model and then simulate the real plant operation, obtaining time and cost savings by avoiding to perform further tests. More specifically, pulper composition, along with other process parameters, has been set as model calibration parameter and decision variables of the optimization problem. The differences between simulated and measured concentrations of the syngas components have been set as objective functions to be minimized. A subsequent decision-making process has been finally carried out to identify the most suitable solution (i.e., the most suitable model calibration) between those belonging to the Pareto optimal front, which provides reliable composition data for the adopted pulper waste. In particular, four different identification criteria have been applied for the selection of a single solution over the 3138 dominant solutions found. Finally, the solution (i.e., set of calibration parameters) which minimizes the experimental-numerical difference of the lower heating value of the produced syngas seemed to provide the most reliable approximation of the real plant operation, also considering the proposed energetic application consisting in the combustion of the outcoming syngas in a biomass steam power plant.

2. The MR System: Experimental Setup and Test

The material recovery plant is an indirect atmospheric pyro-gasifier making use of a methane burner and designed to recover metals and other inert from various types of solid waste. Being a medium-small scale plant, it has the advantage of local use, reducing management and transport costs. The plant can also process up to 1000 kg/h of paper pulper and can regulate the speed of the reactor chamber to adapt to waste variations. The average residence time of the solid waste in the reactor is about 30–40 min. Its transport is guaranteed by an internal spiral ring. The overall scheme of the plant is represented in Figure 3. It consists of the following main components: an open feeding section (1) through which the pulper is constantly fed together with the air used as gasifying agent, a methane combustor used to obtain hot gases (2), a rotary pyro-gasifier (3), a metals/inert discharging outlet (4), syngas/tar combustion chamber (5), and an exhaust gas treatment unit (6).
The present work is based on the results of an experimental test performed by feeding the MR pyro-gasification plant with a certain amount of paper pulper to be treated. Paper pulper is basically composed of polyethylene (PE) [40,41,42], possible cellulose residue, and other materials used in paperboards such as aluminum sheets and other plastics. With a moisture content of about 20% resulting from the wet process of maceration, the pulper, whose proximate and ultimate analysis derived from literature data [43] are shown in Table 1, is suitable for thermal treatment.
Some experimental tests have been carried out and the produced syngas has been object of an accurate composition analysis (Analysis was carried out by the accredited laboratory, CSA spa, http://www.csaricerche.com/en/laboratori_analisi.php; number of certification n. 500557-001), conducted with the methodology UNICHIM 542, certified by a specialized laboratory (Table 2).
The three parameters listed in Table 3 have been considered for the plant model calibration.

3. The Thermochemical Model

Since the physicochemical phenomena governing the conversion process of waste are limited to two plant components, the methane combustor and the pyro-gasifier (2 and 3 in Figure 3, respectively), the modeling has been focused on these two components. The estimation of the heat flow through the reactor walls ( Q ˙ a u x in Figure 4) has been also taken into account. The combustor (COMB. In Figure 4) is modelled as a reactor which calculates the exhaust gases properties through mass, energy, and chemical species balances under the assumption of complete methane combustion. The mass flow rates of air and methane that generate the inert gasifying environment which activates the gasification process through the interaction with waste in the first section of the pyro-gasifier represent two calibration variables of the model. Pulper, as previously discussed, has been characterized by an average proximate and ultimate analysis assumed as reference. However, the exact chemical composition was unknown. Assuming a prevalent polyethylene composition for the pulper and given the impossibility of the model adopted to handle polymeric raw material, the rotary drum of the pyro-gasifier has been schematized in two blocks. The pulper feedstock is first fed to a depolymerization block (DEPOLYM. in Figure 4) where it is decomposed into ethylene. This is a yield-oriented reactor model in which a prevalent composition of ethylene has been imposed as output according to the composition reported in Table 4. It is used to model pyrolysis and decomposition of waste (drying and devolatilization). Since only pulper is considered at the inlet of the depolymerization block, to take account of the air incoming through the open section of the feeding system, ultra-lean values of the equivalence ratio (λ in Table 5) have been considered within the possible operating conditions of the methane combustor to reliably estimate the whole air mass flow rate involved in the gasification process. The second block (GASIF. in Figure 4) has been used to model the typical gasification reactions (oxidation, reduction, and recombination).
Since the residence time of waste in the reactor is very long (30–40 min on average), it was assumed that this time was long enough to reach chemical equilibrium. Consequently, an equilibrium reactor that minimizes Gibbs free energy was used for the GASIF. Block. This model returns the syngas output flow (composition, temperature, pressure, mass flow rate) and the heat flow Q ˙ a u x , whether it has positive or negative values, as result. This schematization allows to model the gasification process by providing a complete chemical composition of the inlet waste. Since both DEPOLYM. And GASIF. Blocks refer to the same rotating drum reactor, the equality of the temperatures has been imposed as a constraint for the two sub-models (Tdepolym = TGASIF). Ultimately, the gasification process has been ideally split into two stages: the first stage in which polyethylene, that is the main pulper component, is converted into its basic ethylene molecules. The second stage in which these molecules and the remaining reagents are further turned into the typical gaseous components of a syngas such as CO, CO2, H2, CH4. The plant model includes the calculation of the thermal energy flows that characterize the two blocks. The first ( Q ˙ in Figure 4) represents the thermal power that, being generated in the second stage of the gasification process (GASIF. Block), supports the depolymerization process of polyethylene into ethylene (DEPOLYM. Block). The second ( Q ˙ a u x in Figure 4), represents the thermal power generated during the gasification process that is exchanged with the external environment, and so dissipated, through the walls of the gasification section. The result is a zero-dimensional stationary thermochemical model consisting of three control volumes where mass, energy, and chemical elements balances are carried out. Specifically, the following mass and energy balance equations are used:
  • Methane combustor (COMB. in Figure 4):
    m ˙ C H 4 + m ˙ a i r = m ˙ e x h  
      m ˙ C H 4 [ c p , C H 4 · T e n v + H i , C H 4 ] + m ˙ a i r · c p , a i r · T e n v = m ˙ e x h · c p , e x h · T e x h
  • Depolymerization process (DEPOLYM. in Figure 4):
    m ˙ p u l p = m ˙ e t h y l e n e  
      m ˙ p u l p [ c p , p u l p · T e n v + H i , p u l p ] + Q ˙ = m ˙ e t h y l e n e · [ c p , e t h y l e n e · T d e p o l y m + H i , e t h y l e n e ]
  • Gasification process (GASIF. in Figure 4):
    m ˙ e x h + m ˙ e t h y l e n e = m ˙ s y n
      m ˙ e x h · c p , e x h · T e x h + m ˙ e t h y l e n e [ c p , e t h y l e n e · T d e p o l y m + H i , e t h y l e n e ] = m ˙ s y n ·      [ c p , s y n · T G A S I F + H i , s y n ] + Q ˙ + Q ˙ A U X   con   T d e p o l y m = T G A S I F

4. Thermochemical Model Calibration: The Proposed Multi-Objective Optimization Approach

As previously said, after the experimental test a precise composition analysis of the produced syngas has been conducted. However, thorough evaluation concerning the composition of the pulper used during the experimental tests was not carried out. Therefore, to reliably calibrate the thermochemical model, a multi-objective optimization methodology based on the use of a genetic algorithm has been adopted. In particular, according to the logic scheme represented in Figure 5, starting from the available data obtained through the experimental tests, a vector optimization problem has been set up and solved to reliably calibrate the numerical model and simulate the actual plant operation. More specifically, the average reactor temperature ( T d e p o l y m ), air ( m ˙ a i r ), and methane ( m ˙ C H 4 ) mass flow rates, fraction of hydrogen ( H 2 d e p o l y m ), carbon ( C d e p o l y m ), and ethylene ( e t h y l e n e d e p o l y m ) produced by the depolymerization process have been set as model calibration parameter (as they are unknown) and decision variables of the optimization problem. The differences between simulated and measured concentrations of the syngas constituents (i.e., syngas composition) have been set as objective functions to be minimized.
The optimization problem has been solved through the genetic algorithm MOGA II (i.e., the Multi-Objective Genetic Algorithm II), whose main features include directional cross-over and elitism, that is used to prevent early convergence to local optimum [8,45,46,47,48]. Starting from an initial population providing a set of initial solutions, the MOGA II identifies the best individuals by mean of classical crossover, directional crossover, mutation, selection, their predefined operator probabilities, and the use of elitism. Table 5 and Table 6 show details concerning decision variables and objective functions adopted for the optimization problem.
The ranges imposed to the decision variables have been set wide enough to include most of the operating conditions. Carbon and hydrogen concentrations depend on the ethylene fraction as shown in the following.
[ C d e p o l y m ] = ( 0.9967 [ e t h y l e n e d e p o l y m ] ) 0.885954
[ H 2 d e p o l y m ] = ( 0.9967 [ e t h y l e n e d e p o l y m ] ) 0.114046

5. Optimization Results and Decision-Making Problem

The model calibration procedure allowed to find the Pareto front, consisting of a set of 3138 different optimal solutions. For example, Figure 6 shows the projection of these solutions on two different planes of the objective functions space. Therefore, a decision-making problem has been addressed to identify a single optimal solution providing the most reliable composition data for the adopted pulper waste and plant operation over the dominant solutions found. In particular, the following four different identification criteria have been applied:
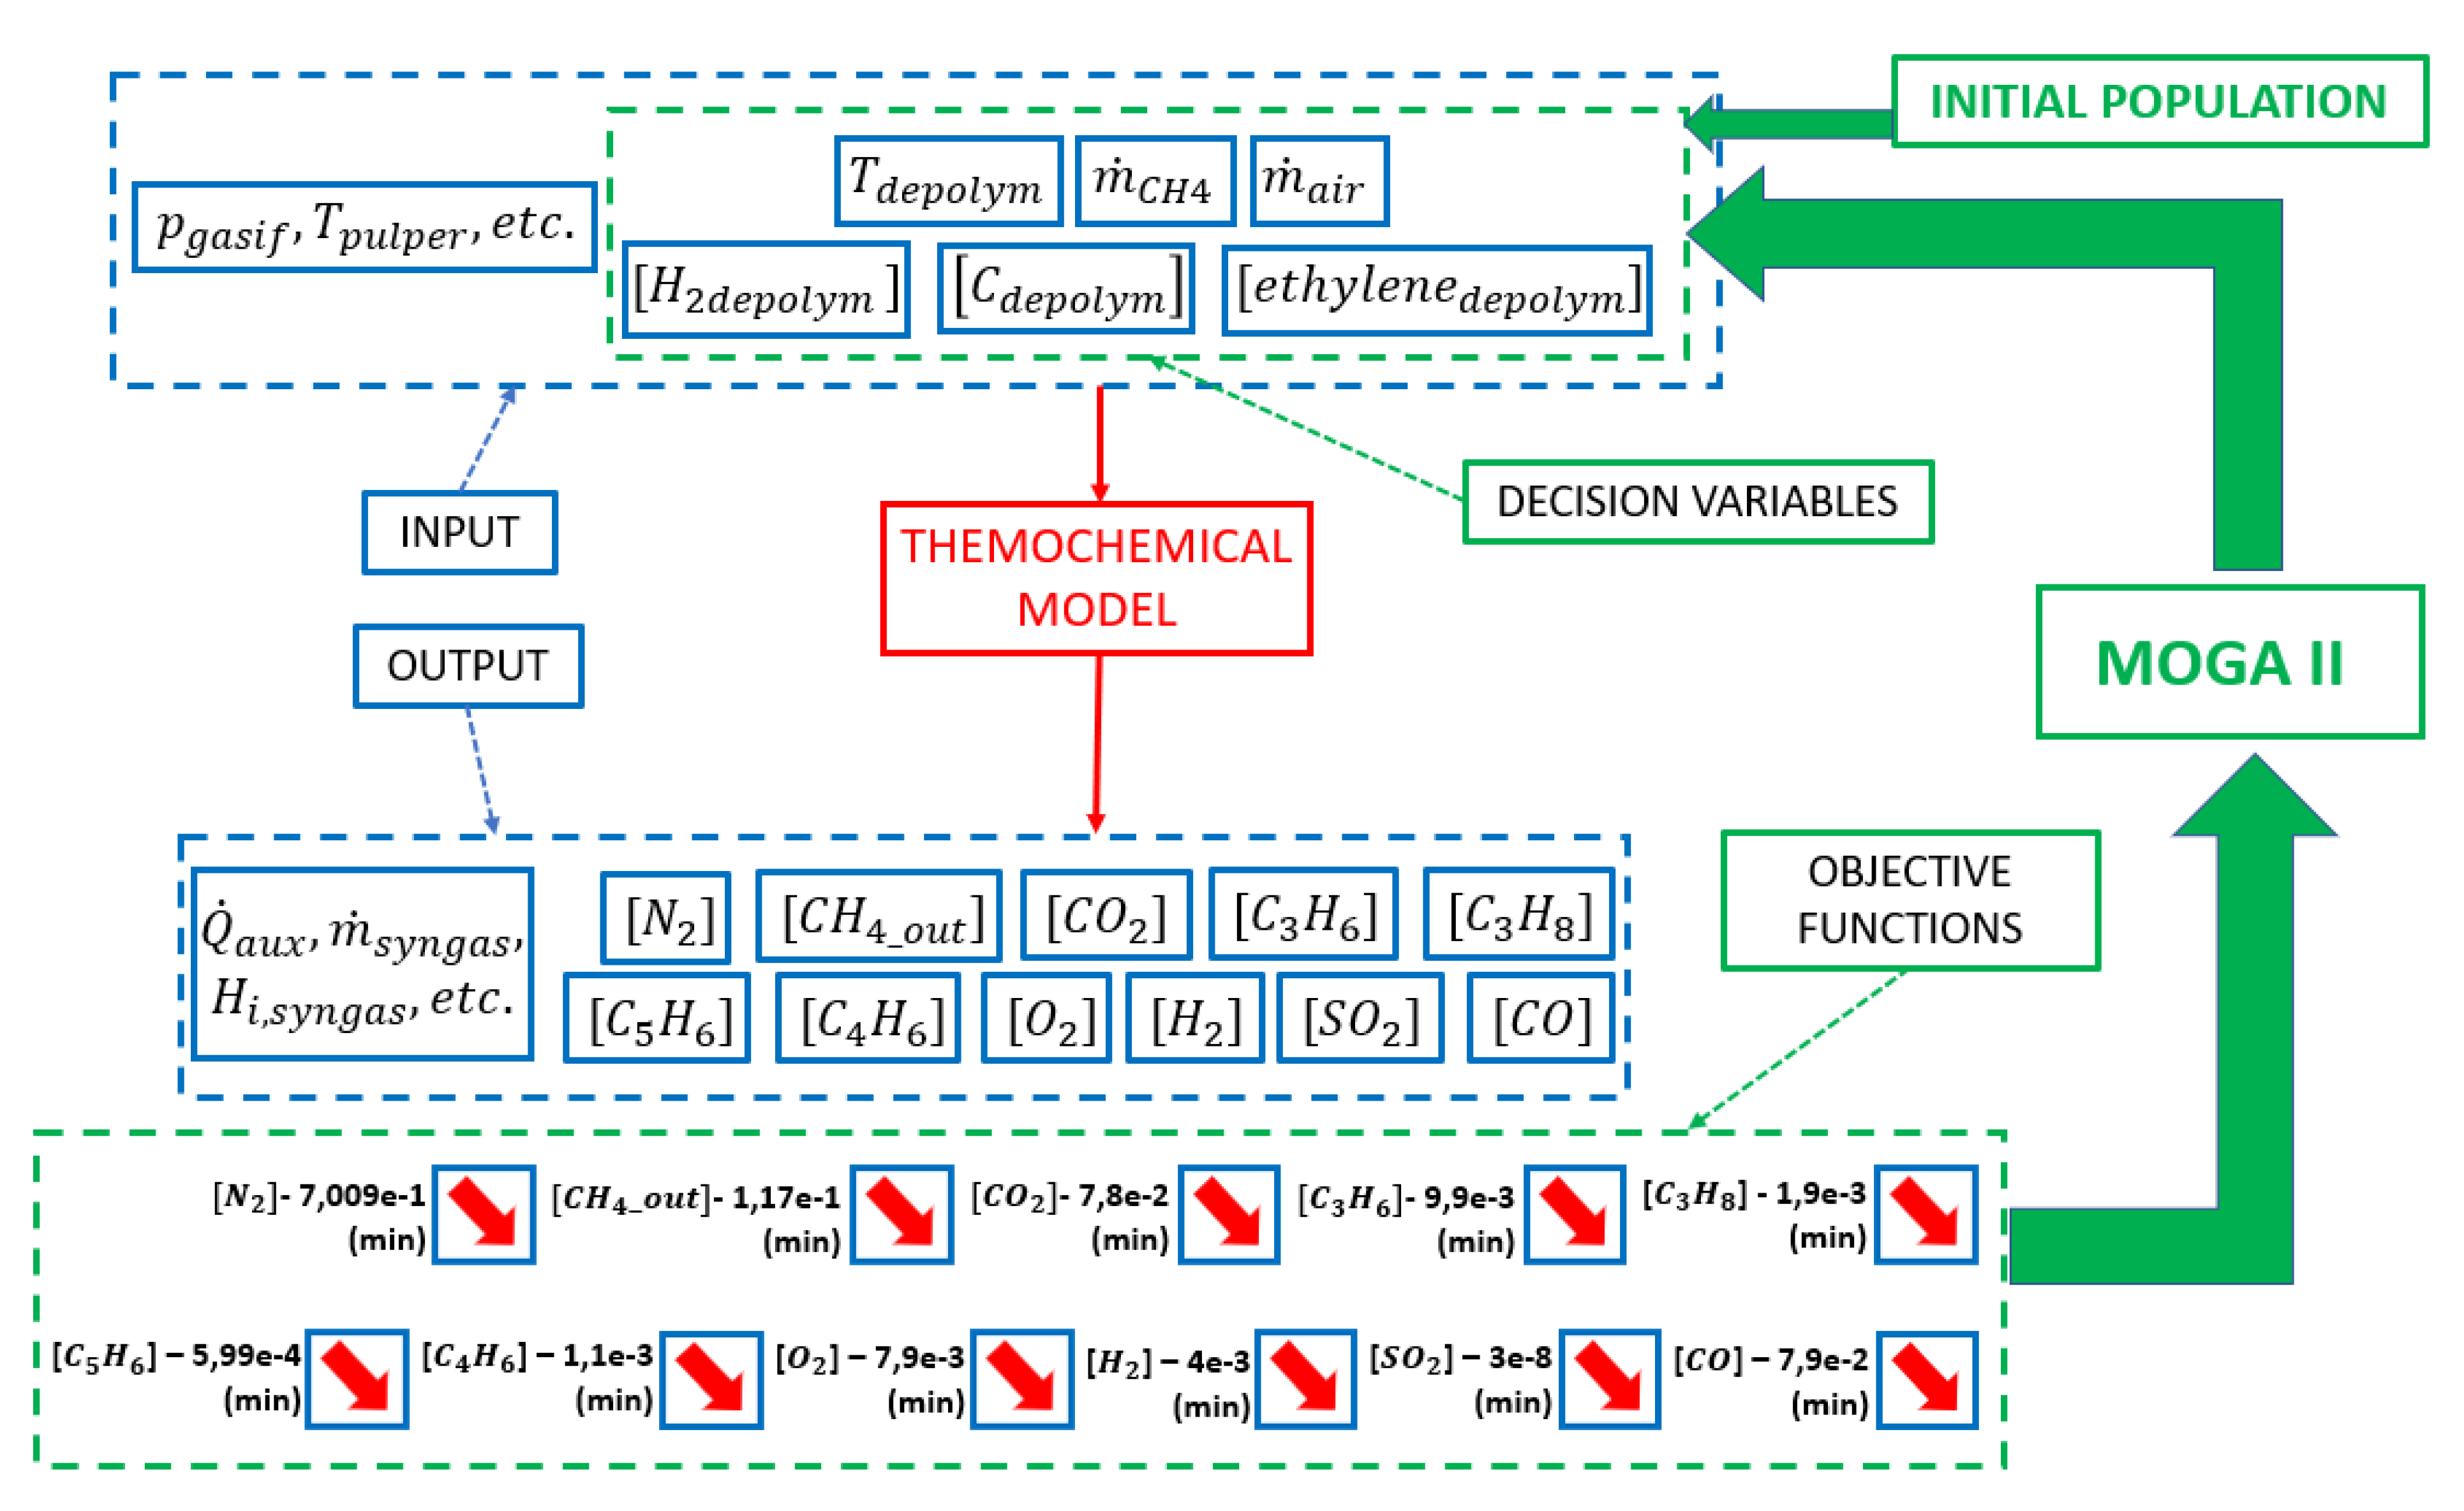
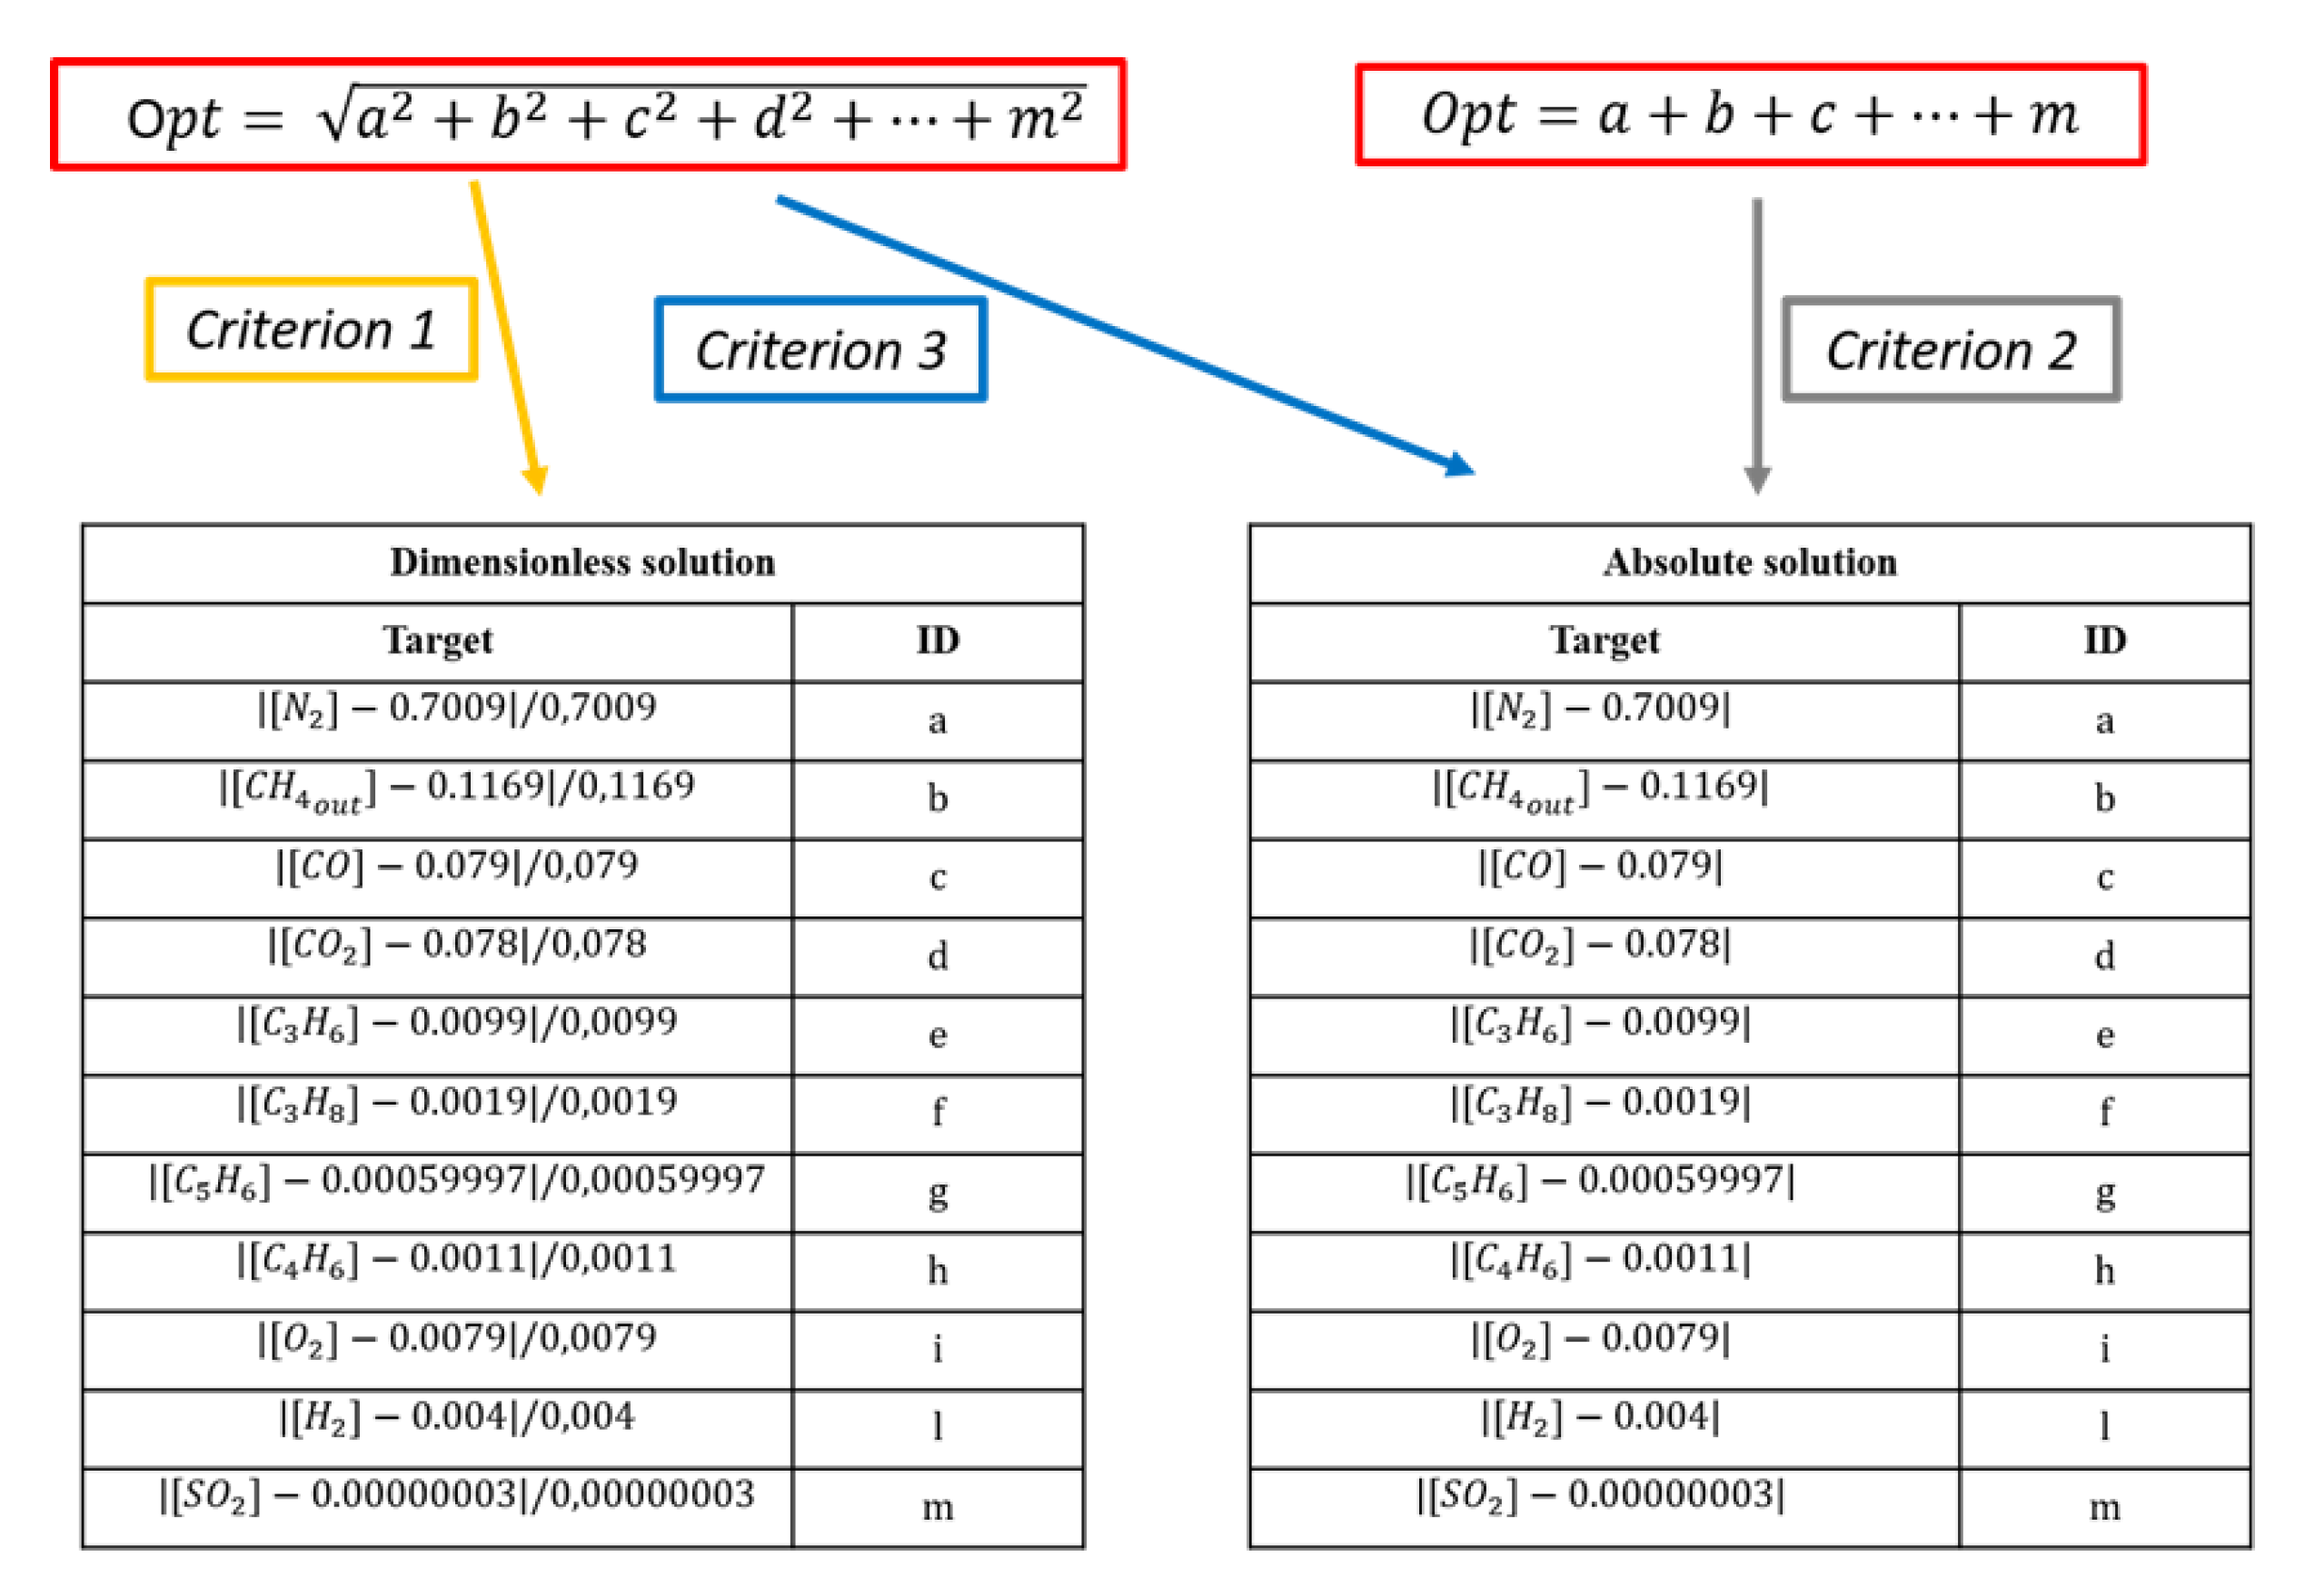
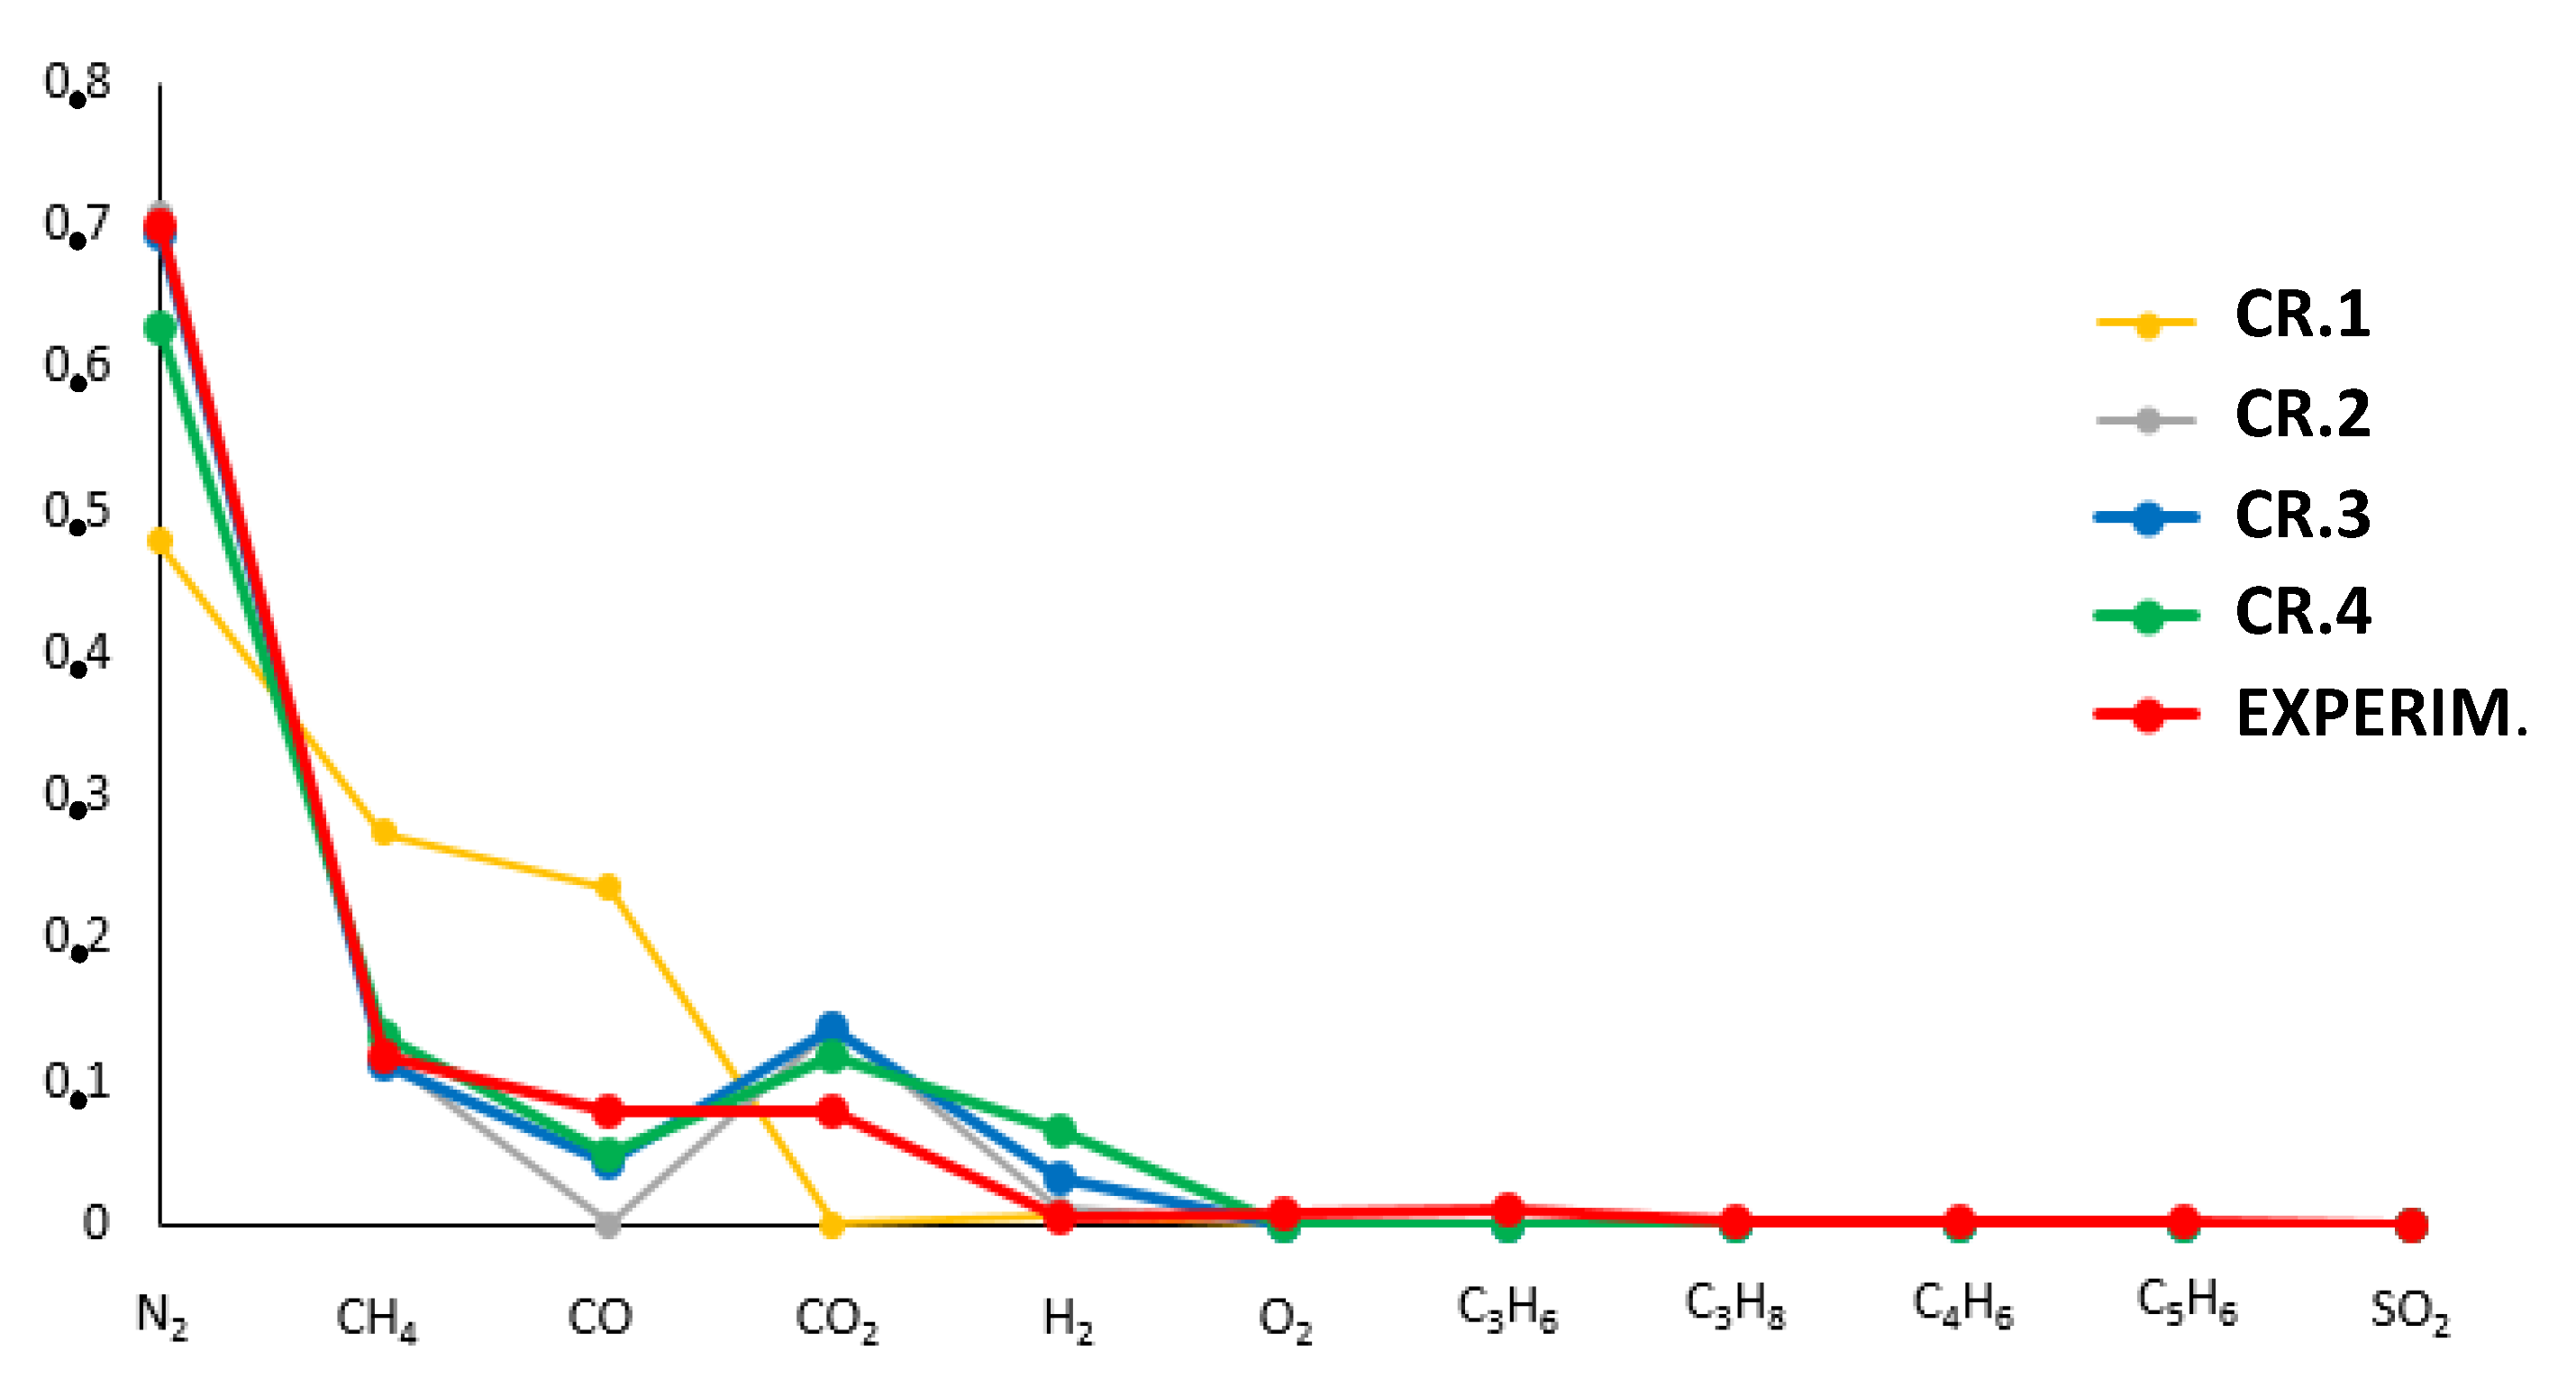
  • CR.1: Minimum Euclidean norm of the relative errors vector (i.e., dimensionless objective functions vector, Figure 7).
  • CR.2: Minimum total sum of the absolute errors vector (i.e., objective functions vector, Figure 7).
  • CR.3: Minimum Euclidean norm of the absolute errors vector (i.e., objective functions vector, Figure 7).
  • CR.4: A combination of the criterion n. 3 with the minimum absolute difference between calculated and experimental LHV of the syngas: min ( | LHV 5.138 | ) .
The application of these criteria led to the identification of four different optimal solutions, each of them characterized by specific values of decision variables (Table 7) and objective functions (namely syngas composition, Table 8). In the first and third case (CR.1 and CR.3), considering the respective axes origin as the single ideal optimal solution, the Pareto solution that is closest to axes origin is privileged (ID 409 and ID 1933, respectively). Criteria CR.2 and CR.4 enabled the identification of the solutions labeled ID 372 and ID 1205, respectively. In particular, the last solution is characterized by a LHV of 5.137MJ/kg, which almost corresponds to the experimental value.
To highlight the predictive capability of the four solutions, the same syngas composition results shown in Table 8 have been properly represented in Figure 8.
In particular, a more significant representation has been obtained by plotting the results in terms of relative error between numerical and experimental concentration of each syngas component. This way, the more the red curve, representing the values provided by the solutions under investigation, approaches the x-axis, the more the numerical result is close to the experimental one. It can be noted that the numerical values shown on the x-axis (i.e., y-axes origins) represent the measured concentrations of the individual chemical species. Figure 8 clearly shows how solutions 372, 1933, and 1205 provide a more accurate syngas composition than solution 409.
Considering the energetic application that will be subsequently discussed, consisting in the combustion of the resulting syngas in a biomass steam power plant, a LHV comparison has been also carried out between the four solutions obtained through the decision-making process. The LHV calculation implies a weighted average calculation of the LHV of the individual chemical species which compose the syngas (Table 9):
L H V t o t = m i m t o t · L H V i
where m i is the mass flow rate of the individual species which may be affected by combustion phenomena and m t o t is the total syngas mass flow rate.
Results in Table 9 clearly show how solution 1205 (CR.4) is characterized by a LHV that is very close to the experimental value. Therefore, this solution shows almost the same energy content of the actual syngas as well as a reasonable estimation of the syngas volumetric composition.
To identify the most reliable solution, the four solutions (i.e., model calibration and related results) found in the previous part have been further compared according to a secondary level (bottoming) decision-making criteria.
To identify a single optimal solution among those belonging to the Pareto optimal front, some authors adopted the minimum distance from the origin of a n-dimensions hyperspace, considered as an ideal optimum, as decision-making-criteria [49,50]. Furthermore, many different criteria have been proposed in the literature [51]. In this paper, considering the specific application consisting in the combustion of the syngas in a biomass steam power plant and the estimation of its global efficiency, the authors proposed the minimization of the error between calculated and measured LHV as supplementary (bottoming) decision-making criteria, thus privileging the energy content of the syngas.
Since the objective of the optimization problem was to minimize the difference between calculated and measured syngas composition, a first comparison has been made is in terms of syngas composition (Figure 8).
While solutions CR.2, CR.3, and CR.4 show a similar syngas composition, which are also closer to the experimental data (red curve), solution CR.1 (yellow curve in Figure 8) is characterized by quite different concentrations. Eventually, considering the energetic application discussed below, which consists in the combustion of the resulting syngas in a biomass steam power plant, the solution CR.4 (green line) has been preferred. In fact, besides a favorable value of the average percentage error related to the volumetric concentrations of the syngas components (about 17%), as previously discussed, solution CR.4 has also almost the same energy content experimentally measured (5.138 MJ/kg).
It is worth noting that the application of the four decision-making criteria enabled the identification of solutions characterized by significantly different values of some plant-operating parameters. Consequently, the four solutions identified are characterized by wide dispersion ranges of the process parameters. Figure 9, for example, highlights the dispersion ranges with reference to the average reactor temperature and the energy efficiency of the conversion process. Figure 9 also shows how solution CR.4 is characterized by temperature and efficiency values that are closer to the average value calculated from the four solutions identified.
Starting from the calibration parameters of the model that characterize solution CR.4, the interaction between the exhaust gas from the methane combustor and the pulper at ambient temperature (293 K) within the mixing region of the rotary drum has been analyzed (Figure 10).
This work has been also focused on the estimation of the expected conditions that occur in the initial section of the pyro-gasification reactor. Results shows a temperature of 1540 K. Therefore, it is assumed that the waste is affected by flash pyrolysis phenomena [52] leading to rapid heating up to the estimated high temperature.

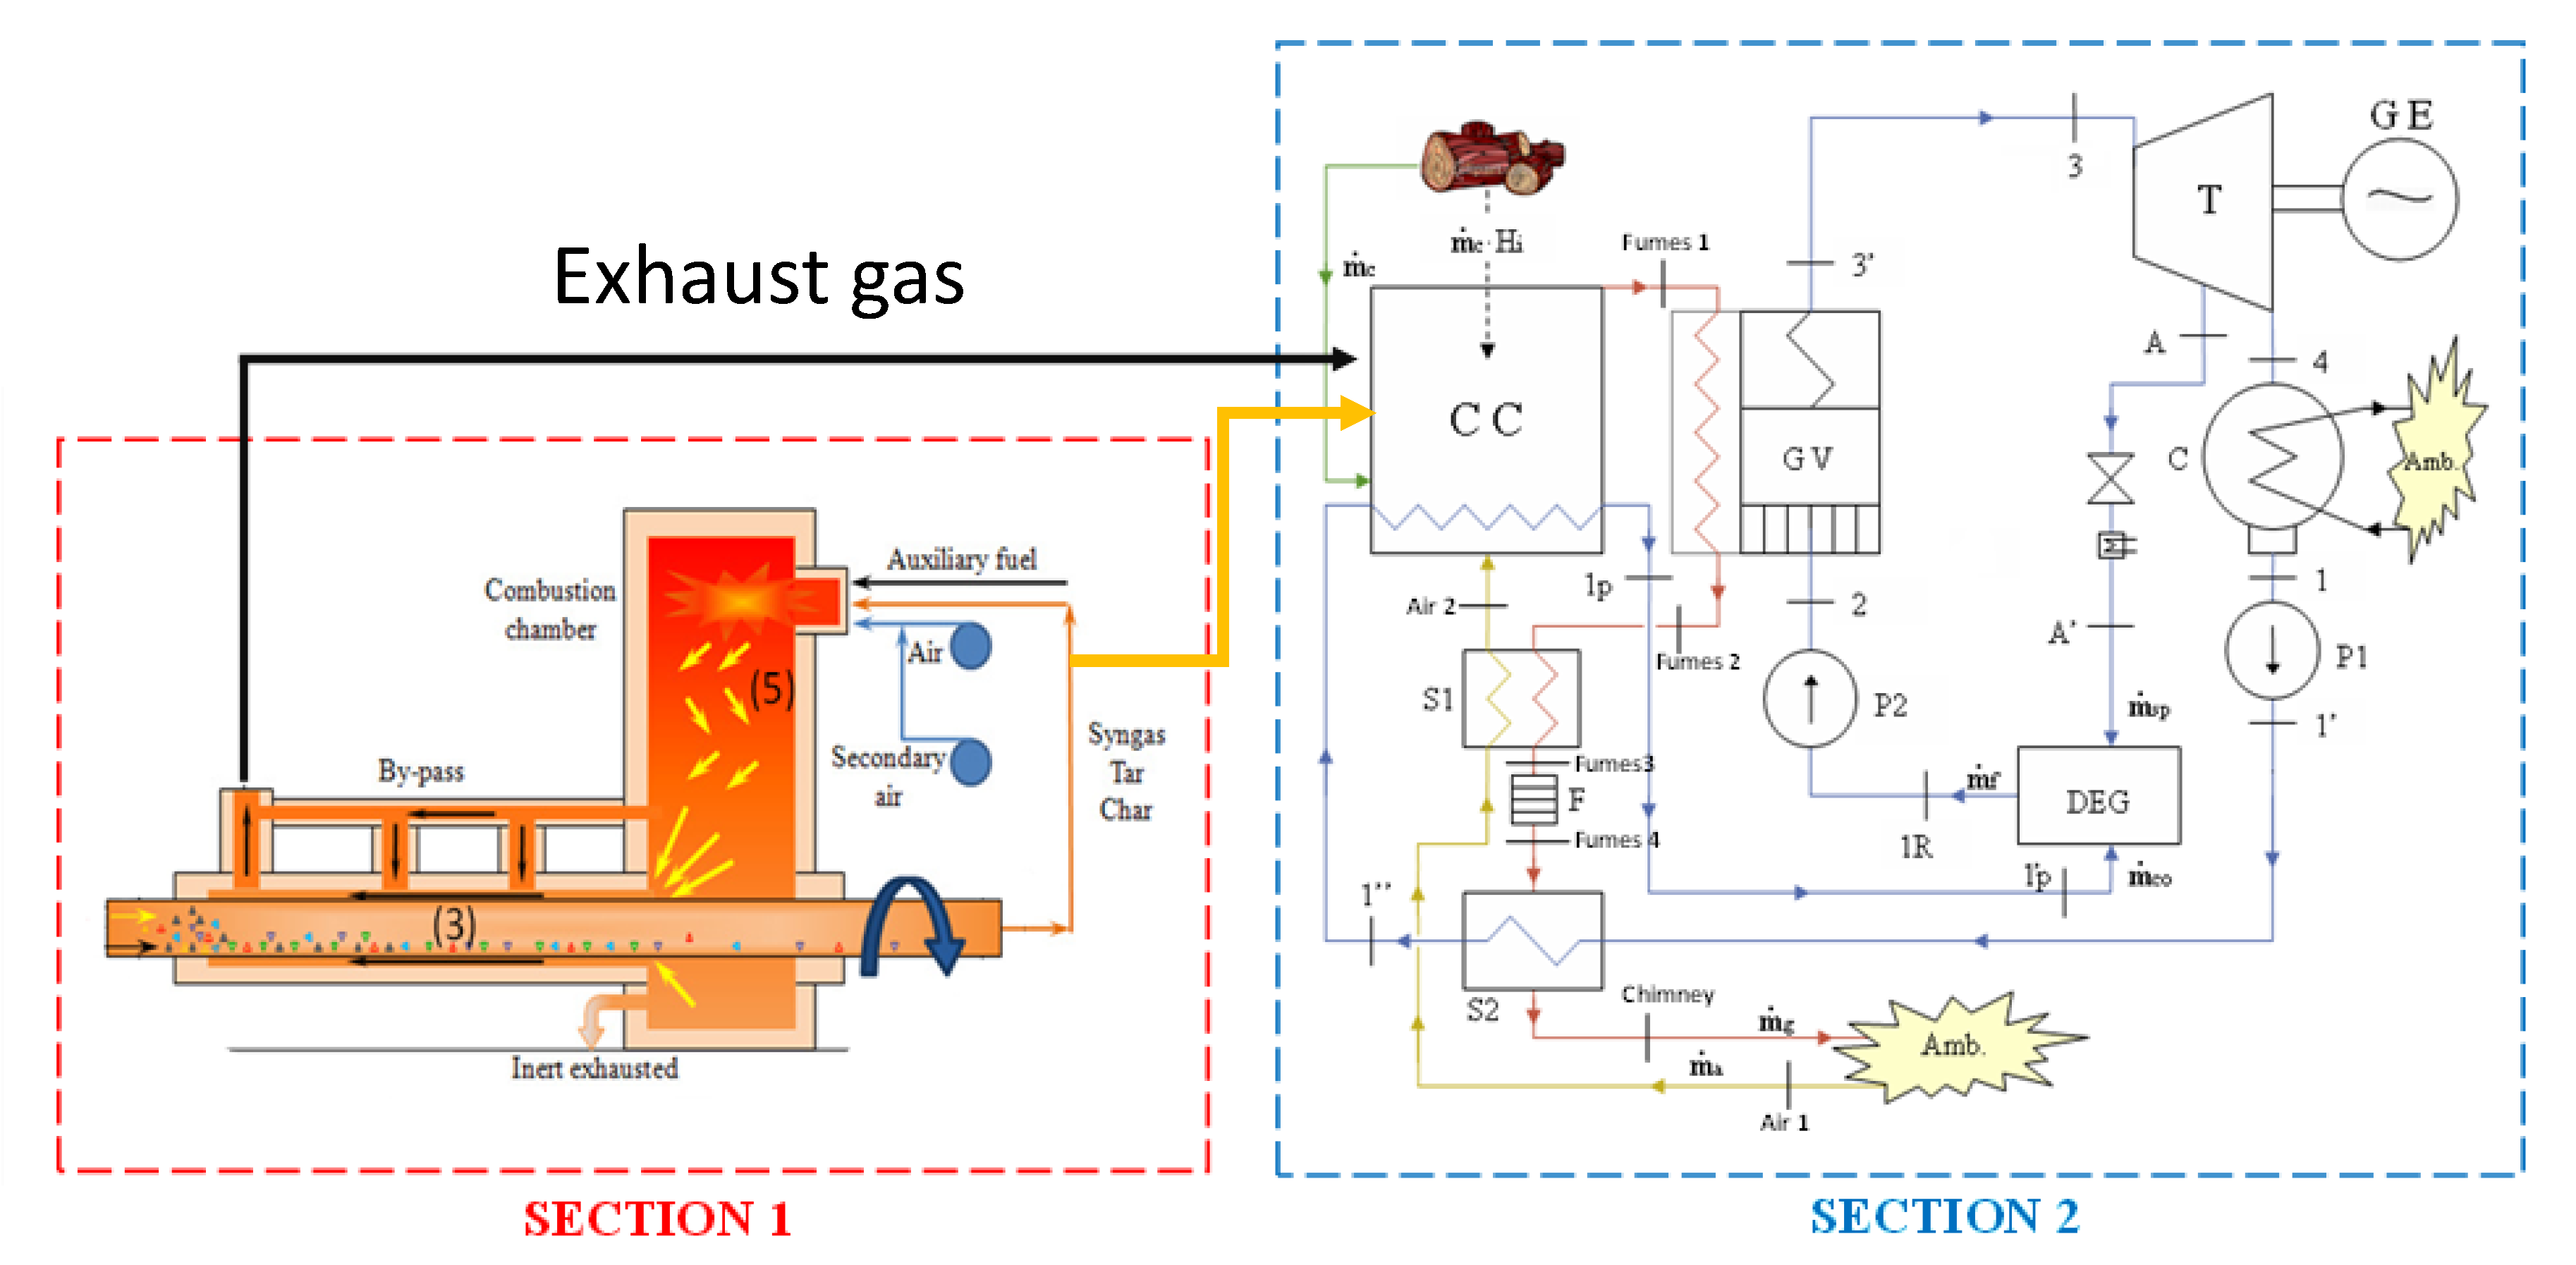
6. Application: Coupling the Pyro-Gasification Plant with a Biomass Steam Power Plant

To evaluate the efficiency potential of the entire conversion process that starts from the gasification of pulper waste through the studied pyro-gasification plant ends with the electric power generation obtained through the combustion of both biomass and resulting syngas in a biomass steam power plant (BSPP), the plant scheme in Figure 11 has been considered. The biomass steam power plant used as a reference in this study, whose main data are summarized in Table 10, has been the object of experimental and numerical investigation in previous studies [53,54]. Specifically, it is assumed that syngas, and also char and tar, obtained through the gasification process are used to produce steam in the BSPP together with biomass; moreover, also the exhaust gas has been directed to the combustion chamber of the steam power plant to exploit the residual enthalpy at relative high temperature, thus also mitigating the inherent steam production “instability” of the BSPP alone [55]. Indeed, biomass has high moisture content variability that causes fluctuations in LHV, combustion chamber gas temperature, steam production, and electric power generation. Therefore, the proposed configuration has the advantage of reducing plant operation fluctuations [55].
To keep the nominal point operation of the steam cycle section (Section 2 in Figure 11), the original value of biomass mass flow rate (Table 10) has to be adjusted. Therefore, the biomass mass flow rate has been reduced to 1481 kg/h (reduction of 40.7%). If the following equation is used to evaluate the global efficiency of the whole plant:
η e l 2 = def P e , n e t m ˙ p u l p e r H i , p u l p e r + m ˙ C H 4 H i , C H 4 + m ˙ b i o m a s s H i , b i o m a s s
a value of 0.155 is obtained, which seems a very low value. However, considering that syngas resulting from the gasification process is produced from waste, whose energy content would otherwise be lost, a more appropriate efficiency estimation can be done through the following equation that does not consider pulper waste as energy input to the thermodynamic cycle:
η e l 2 * = def P e , n e t m ˙ C H 4 H i , C H 4 + m ˙ b i o m a s s H i , b i o m a s s
leading to a value of 0.262 that is 3 per cent higher than the original value shown in Table 10. When it is assumed to supply the pyro-gasification system with biomass the innovative plant configuration could be classified as a fully renewable power plant. In this context, the proposed configuration (Figure 11) could be applied to the existing steam power plants as a solution to increase the global efficiency and, contemporary, to exploit a larger part of the biomass waste.

7. Conclusions

The increasingly pressing issue of sustainable waste treatment combined with the continuous search for new energy resources has led, in recent years, to an increasing attention to waste energy recovery systems. One of the most efficient and least polluting technologies is pyro-gasification. This paper described an experimental activity carried out on a pyro-gasification plant, from which it was not possible to obtain certain values for the input variables. Therefore, to reliably calibrate the thermochemical model of the investigated plant, a vector optimization problem, based on the evolutionary genetic algorithm MOGA II, has been solved. The results from the solution of the proposed optimization problem allowed for the determination of a Pareto optimal front between the eleven objective functions, and the adoption of the selection criterion requiring the minimization of the difference between calculated and experimental value of the LHV of the syngas allowed the identification of a single optimal solution used for the model calibration. Results show that the proposed methodology provides a useful and flexible tool for reliable model calibration. Future works will address more detailed analyses of the process through a kinetic model allowing the instantaneous simulation of the thermochemical conversion processes along the entire length of the reactor.

Author Contributions

Conceptualization, A.G., M.M. (Massimiliano Muccillo), Carmine Mongiello and V.K.S.; Data curation, A.G., R.S., V.C. and M.M. (Matteo Manganiello); Formal analysis, A.G., M.M. (Massimiliano Muccillo), R.S., Giacobbe Braccio, V.C., G.C., M.M. (Matteo Manganiello), Carmine Mongiello and V.K.S.; Investigation, A.G., M.M. (Massimiliano Muccillo), R.S. and G.C.; Methodology, A.G., M.M. (Massimiliano Muccillo), Giacobbe Braccio, Carmine Mongiello and V.K.S.; Resources, R.S., V.C., M.M. (Matteo Manganiello) and V.K.S.; Software, R.S., V.C. and M.M. (Matteo Manganiello); Supervision, A.G., M.M. (Massimiliano Muccillo), Giacobbe Braccio and G.C.; Validation, A.G., M.M. (Massimiliano Muccillo), R.S., V.C., G.C. and V.K.S.; Visualization, M.M. (Massimiliano Muccillo) and M.M. (Matteo Manganiello); Writing–original draft, A.G., M.M. (Massimiliano Muccillo), R.S., V.C., M.M. (Matteo Manganiello), Carmine Mongiello and V.K.S.; Writing–review & editing, A.G. and M.M. (Massimiliano Muccillo). All authors have read and agree to the published version of the manuscript.

Funding

This research received no external funding.

Institutional Review Board Statement

Not applicable.

Informed Consent Statement

Not applicable.

Data Availability Statement

Not applicable.

Acknowledgments

The authors would like to thank Rosario Moreschi for his precious informatic technical support.

Conflicts of Interest

The authors declare no conflict of interest.

Acronyms and Abbreviations

11-DEleven Dimensional
CESCircular Economy System
CHPCombined Heat and Power
MRMaterial Recovery
MSWMunicipal Solid Waste
PESPrimary Energy Saving
WtEWaste to Energy
BSPPBiomass Steam Power Plant
CCCombustion Chamber

Nomenclature

C d e p o l y m volumetric fraction of carbon in the substance produced by the DEPOLYM block
c p , A I R specific heat of air
c p , C H 4 specific heat of methane
c p , E X H specific heat of exhaust flow
c p , p u l p specific heat of pulper
e t h y l e n e d e p o l y m volumetric fraction of ethylene in the substance produced by the DEPOLYM block
H 2 d e p o l y m volumetric fraction of hydrogen in the substance produced by the DEPOLYM block
H i , C H 4 lower heating value of methane
H i , e t h y l e n e lower heating value of ethylene
H i , p u l p lower heating value of pulper
H i , s y n lower heating value of syngas
H i , b i o m a s s lower heating value of biomass
LHVlower heating value flow
m ˙ a i r air mass flow
m ˙ C H 4 methane mass flow
m ˙ e t h y l e n e mass leaving DEPOLYM block
m ˙ e x h exhaust combustor mass flow
m i ˙ individual species involved in combustion mass flow
m ˙ p u l p pulper mass flow
m ˙ s y n syngas mass flow
m ˙ t o t total mass flow out
m ˙ b i o m a s s biomass mass flow
Q ˙ heat exchanged between DEPOLYM and GASIF blocks
Q ˙ a u x total heat exiting the GASIF block
T e n v environment temperature
η e l electric efficiency
P e , n e t t a net electric power

References

  1. Gimelli, A.; Muccillo, M. Optimization criteria for cogeneration systems: Multi-objective approach and application in a hospital facility. Appl. Energy 2013, 104, 910–923. [Google Scholar] [CrossRef]
  2. International Energy Agency. World Energy Outlook 2018. Available online: https://www.iea.org/reports/world-energy-outlook-2018 (accessed on April 2020).
  3. Kumar, A.; Samadder, S.R. A review on technological options of waste to energy for effective management of municipal solid waste. Waste Manag. 2017, 69, 407–422. [Google Scholar] [CrossRef] [PubMed]
  4. Kothari, R.; Tyagi, V.V.; Pathak, A. Waste-to-energy: A way from renewable energy sources to sustainable development. Renew. Sustain. Energy Rev. 2010, 14, 3164–3170. [Google Scholar] [CrossRef]
  5. Ouda, O.K.M.; Raza, S.A.; Nizami, A.S.; Rehan, M.; Al-Waked, R.; Korres, N.E. Waste to energy potential: A case study of Saudi Arabia. Renew. Sustain. Energy Rev. 2016, 61, 328–340. [Google Scholar] [CrossRef]
  6. International Energy Agency. World Energy Outlook 2016. Available online: https://www.iea.org/reports/world-energy-outlook-2016 (accessed on November 2017).
  7. International Energy Agency. Energy Technology Perspectives; International Energy Agency: Paris, France, 2014; ISBN 978-92-64-20800-1. [Google Scholar]
  8. Gimelli, A.; Muccillo, M. The key role of the vector optimization algorithm and robust design approach for the design of polygeneration systems. Energies 2018, 11, 821. [Google Scholar] [CrossRef] [Green Version]
  9. Charters, W.W.S. Developing markets for renewable energy technologies. Renew. Energy 2001, 22, 217–222. [Google Scholar] [CrossRef]
  10. Kaza, S.; Yao, L.; Bhada-Tata, P.; Van Woerden, F. What a Waste 2.0: A Global Snapshot of Solid Waste Management to 2050. Urban Development; World Bank ©: Washington, DC, USA, 2018. [Google Scholar]
  11. Palmiotto, M.; Fattore, E.; Paiano, V.; Celeste, G.; Colombo, A.; Davoli, E. Influence of a municipal solid waste landfill in the surrounding environment: Toxicological risk and odor nuisance effects. Environ. Int. 2014, 68, 16–24. [Google Scholar] [CrossRef]
  12. Tan, S.T.; Hashim, H.; Lim, J.S.; Ho, W.S.; Lee, C.T.; Yan, J. Energy and emissions benefits of renewable energy derived from municipal solid waste: Analysis of a low carbon scenario in Malaysia. Appl. Energy 2014, 136, 797–804. [Google Scholar] [CrossRef]
  13. Baggio, P.; Baratieri, M.; Fiori, L.; Grigiante, M.; Avi, D.; Tosi, P. Experimental and modelling analysis of a batch gasification/pyrolysis reactor. Energy Convers. Manag. 2009, 50, 1426–1435. [Google Scholar] [CrossRef]
  14. Poulsen, T.G.; Hansen, J.A. Assessing the impacts of changes in treatment technology on energy and greenhouse gas balances for organic waste and wastewater treatment using historical data. Waste Manag. Res. 2009, 27, 861–870. [Google Scholar] [CrossRef]
  15. Ionescu, G.; Merler, G.; Rada, E.C.; Ragazzi, M. Integrated valorization system of MSW: Metropolitan area case study. In Proceedings of the 5th International Conference on Energy and Environment, Bucharest, Romania, 3–4 November 2011. [Google Scholar]
  16. Basu, P. Biomass Gasification, Pyrolysis and Torrefaction: Practical Design and Theory, 3rd ed.; Academic Press Elsevier: Cambridge, MA, USA, 2018; ISBN 978-0-12-812992-0. [Google Scholar]
  17. Leckner, B. Process aspects in combustion and gasification Waste-to-Energy (WtE) units. Waste Manag. 2015, 37, 13–25. [Google Scholar] [CrossRef] [PubMed]
  18. Panepinto, D.; Tedesco, V.; Brizio, E.; Genon, G. Environmental performances and energy efficiency for MSW gasification treatment. Waste Biomass Valoriz. 2015, 6, 123–135. [Google Scholar] [CrossRef]
  19. Belgiorno, V.; De Feo, G.; Della Rocca, C.; Napoli, D.R. Energy from gasification of solid wastes. Waste Manag. 2003, 23, 1–15. [Google Scholar] [CrossRef]
  20. Dong, J.; Tang, Y.; Nzihou, A.; Chi, Y.; Weiss-Hortala, E.; Ni, M. Life cycle assessment of pyrolysis, gasification and incineration waste-to-energy technologies: Theoretical analysis and case study of commercial plants. Sci. Total Environ. 2018, 626, 744–753. [Google Scholar] [CrossRef]
  21. Zeng, R.; Wang, S.; Cai, J.; Kuang, C. A review of pyrolysis gasification of MSW. Adv. Eng. Res. 2018, 163. [Google Scholar] [CrossRef] [Green Version]
  22. Arena, U. Process and technological aspects of municipal solid waste gasification. A review. Waste Manag. 2012, 32, 625–639. [Google Scholar] [CrossRef]
  23. Zadeh, Z.E.; Abdulkhani, A.; Aboelazayem, O.; Saha, B. Recent insights into lignocellulosic biomass pyrolysis: A critical review on pretreatment, characterization, and products upgrading. Processes 2020, 8, 799. [Google Scholar] [CrossRef]
  24. Sarkar, J.K.; Wang, Q. Characterization of pyrolysis products and kinetic analysis of waste jute stick biomass. Processes 2020, 8, 837. [Google Scholar] [CrossRef]
  25. Lewandowski, W.M.; Ryms, M.; Kosakowski, W. Thermal biomass conversion: A review. Processes 2020, 8, 516. [Google Scholar] [CrossRef]
  26. Costa, M.; Di Blasio, G.; Prati, M.V.; Costagliola, M.A.; Cirillo, D.; La Villetta, M.; Caputo, C.; Martoriello, G. Multi-objective optimization of a syngas powered reciprocating engine equipping a combined heat and power unit. Appl. Energy 2020, 275. [Google Scholar] [CrossRef]
  27. Ren, J.; Liu, Y.L.; Zhao, X.Y.; Cao, J.P. Biomass thermochemical conversion: A review on tar elimination from biomass catalytic gasification. J. Energy Inst. 2020, 93, 1083–1098. [Google Scholar] [CrossRef]
  28. Hu, B.; Huang, Q.; Buekens, A.; Chi, Y.; Yan, J. Co-gasification of municipal solid waste with high alkali coal char in a three-stage gasifier. Energy Convers. Manag. 2017, 153, 473–481. [Google Scholar] [CrossRef]
  29. Sá, L.C.R.; Loureiro, L.M.E.F.; Nunes, L.J.R.; Mendes, A.M.M. Torrefaction as a pretreatment technology for chlorine elimination from biomass: A case study using eucalyptus globulus labill. Resources 2020, 9, 54. [Google Scholar] [CrossRef]
  30. Hu, M.; Cui, B.; Xiao, B.; Luo, S.; Guo, D. Insight into the Ex Situ catalytic pyrolysis of biomass over char supported metals catalyst: Syngas production and tar decomposition. Nanomaterials 2020, 10, 1397. [Google Scholar] [CrossRef] [PubMed]
  31. Recari, J.; Berrueco, C.; Abelló, S.; Montané, D.; Farriol, X. Gasification of two solid recovered fuels (SRFs) in a lab-scale fluidized bed reactor: Influence of experimental conditions on process performance and release of HCl, H2S, HCN and NH3. Fuel Process. Technol. 2016, 142, 107–114. [Google Scholar] [CrossRef]
  32. Vaish, B.; Sharma, B.; Srivastava, V.; Singh, P.; Ibrahim, M.H.; Singh, R.P. Energy recovery potential and environmental impact of gasification for municipal solid waste. Biofuel 2017, 10, 87–100. [Google Scholar] [CrossRef]
  33. Yuan, P.S.; Du, M.A.; Te Huang, I.; Liu, I.H.; Chang, E.E. Strategies on implementation of waste-to-energy (WTE) supply chain for circular economy system: A review. J. Clean. Prod. 2015, 108, 409–421. [Google Scholar] [CrossRef]
  34. Singh, J.; Ordonez, I. Resource recovery from post-consumer waste: Important lessons for the upcoming circular economy. J. Clean. Prod. 2016, 134, 342–353. [Google Scholar] [CrossRef]
  35. Tisserant, A.; Fry, J.; Merciai, S.; Pauliuk, S.; Schmidt, J.; Tukker, A.; Wood, R. Solid waste and the circular economy: A global analysis of waste treatment and waste footprints. J. Ind. Ecol. 2017, 21, 628–640. [Google Scholar] [CrossRef] [Green Version]
  36. Kaushal, P.; Tyagi, R. Advanced simulation of biomass gasification in a fluidized bed reactor using aspen plus. Renew. Energy 2017, 101, 629–636. [Google Scholar] [CrossRef]
  37. Eikeland, M.S.; Thapa, R.K.; Halvorsen, B. Aspen plus simulation of biomass gasification with known reaction kinetic. In Proceedings of the Linköping Electronic Conference, Wroclaw, Poland, 14–16 October 2015; Volume 119, pp. 149–155. [Google Scholar] [CrossRef] [Green Version]
  38. Gagliano, A.; Nocera, F.; Bruno, M.; Cardillo, G. Development of an equilibrium-based model of gasification of biomass by Aspen Plus. Energy Procedia 2017, 111, 1010–1019. [Google Scholar] [CrossRef]
  39. Nikoo, M.B.; Mahinpeya, N. Simulation of biomass gasification in fluidized bed reactor using aspen plus. Biomass Bioenergy 2008, 32, 1245–1254. [Google Scholar] [CrossRef]
  40. Selchan, A.M. The Separation of Low Density Polyethylene Laminates from Paper. Paper Engineering Senior Thesis, Western Michigan University, Kalamazoo, MI, USA, May 1982. [Google Scholar]
  41. Chen, W.; Shi, S.; Zhang, J.; Chen, M.; Zhou, X. Co-pyrolysis of waste newspaper with high-density polyethylene: Synergistic effect and oil characterization. Energy Convers. Manag. 2016, 112, 41–48. [Google Scholar] [CrossRef]
  42. Salan, T.; Hakkı Alma, M.; Altuntaş, E. The fuel properties of pyrolytic oils obtained from catalytic pyrolysis of non-recyclable pulper rejects using activated natural mineral. Energy Sources Part A Recovery Util. Environ. Effects 2019, 41, 1460–1473. [Google Scholar] [CrossRef]
  43. Kannan, P.; Al Shoaibi, A.; Srinivasakannan, C. Optimization of waste plastics gasification process using aspen-plus. Intech 2012. [Google Scholar] [CrossRef] [Green Version]
  44. Acar, M.C.; Böke, Y.E. Simulation of biomass gasification process using Aspen plus. In Proceedings of the 14th International Combustion Symposium (INCOS2018), Karabük, Turkey, 25–27 April 2018. [Google Scholar]
  45. Poloni, C.; Pediroda, V. GA coupled with computationally expensive simulations: Tools to improve efficiency. In Genetic Algorithms and Evolution Strategies in Engineering and Computer Science; John Wiley and Sons: Chichester, NH, USA, 1997; pp. 267–288. ISBN 0471977101. [Google Scholar]
  46. Nola, F.D.; Giardiello, G.; Gimelli, A.; Molteni, A.; Muccillo, M.; Picariello, R.; Tornese, D. Reduction of the experimental effort in engine calibration by using neural networks and 1D engine simulation. Energy Procedia 2018, 148, 344–351. [Google Scholar] [CrossRef]
  47. Gimelli, A.; Muccillo, M.; Sannino, R. Effects of uncertainties on the stability of the results of an optimal sized modular cogeneration plant. Energy Procedia 2017, 126, 369–376. [Google Scholar] [CrossRef] [Green Version]
  48. Padovan, L.; Pediroda, V.; Poloni, C. Multi objective robust design optimization of airfoils in transonic field (M.O.R.D.O.). In Proceedings of the International Congress on Evolutionary Methods for Design, Optimization and Control with Applications to Industrial Problems EUROGEN 2003, Barcelona, Spain, 15–17 September 2003. [Google Scholar]
  49. Brancati, R.; Muccillo, M.; Tufano, F. Crank mechanism friction modeling for control-oriented applications. In IFToMM ITALY 2020. Mechanisms and Machine Science: Advances in Italian Mechanism Science; Springer: Cham, Switzerland, 2021. [Google Scholar] [CrossRef]
  50. Gimelli, A.; Sannino, R. A multi-variable multi-objective methodology for experimental data and thermodynamic analysis validation: An application to micro gas turbines. Appl. Therm. Eng. 2018, 134, 501–512. [Google Scholar] [CrossRef]
  51. Aruldoss, M.; Lakshmi, T.M.; Venkatesan, V.P. A survey on multi criteria decision making methods and its applications. Am. J. Inf. Syst. 2013, 1, 31–43. [Google Scholar] [CrossRef]
  52. Uddin, M.N.; Techato, K.; Taweekun, J.; Rahman, M.M.; Rasul, M.G.; Mahlia, T.M.I.; Ashrafur, S.M. An overview of recent developments in biomass pyrolysis technologies. Energies 2018, 11, 3115. [Google Scholar] [CrossRef] [Green Version]
  53. Gimelli, A.; Luongo, A. 2.3 MW biomass steam power plant: Experimental and thermodynamic analysis. In Proceedings of the International Conference on Renewable Energies and Power Quality (ICREPQ’12), Santiago De Compostela, Spain, 28–30 March 2012. [Google Scholar] [CrossRef]
  54. Gimelli, A.; Luongo, A.; Amoresano, A. A gasification system for the disposal of industrial waste and energy generation: Experimentation and thermodynamic analysis. In Proceedings of the International Conference on Renewable Energies and Power Quality (ICREPQ’12), Santiago De Compostela, Spain, 28–30 March 2012. [Google Scholar] [CrossRef]
  55. Gimelli, A.; Luongo, A. Thermodynamic and experimental analysis of a biomass steam power plant: Critical issues and their possible solutions with CCGT systems. Energy Procedia 2014, 45, 227–236. [Google Scholar] [CrossRef] [Green Version]
Figure 1. World total primary energy supply in 2017 detailed by fuel. Peat and oil shale are aggregated with coal and the label “Other” includes geothermal, solar, wind, heat, etc., [2].
Processes 09 00035 g001
Figure 2. World total primary energy supply in 2017 detailed by fuel [7,8].
Processes 09 00035 g002
Figure 3. Scheme of the MR pyro-gasification plant.
Processes 09 00035 g003
Figure 4. Thermochemical scheme of the MR pyro-gasification plant.
Processes 09 00035 g004
Figure 5. Logic scheme of the model calibration methodology.
Processes 09 00035 g005
Figure 6. Pareto Front (syngas volume concentration of C O 2 , CO and C H 4 , CO).
Processes 09 00035 g006
Figure 7. Example of application of CR.1, CR.2, and CR.3 adopted within the decision-making process.
Processes 09 00035 g007
Figure 8. Comparison between calculated and measured syngas composition.
Processes 09 00035 g008
Figure 9. Dispersion of efficiency and temperature values of the four identified solutions.
Processes 09 00035 g009
Figure 10. Interaction between exhaust gas from the methane combustor and pulper waste.
Processes 09 00035 g010
Figure 11. Configuration of whole gasifier-biomass steam power plant [54].
Processes 09 00035 g011
Table 1. Proximate and ultimate analysis of the adopted paper pulper.
Proximate AnalysisMass %Ultimate AnalysisMass %
Moisture20Carbon85.76
Volatile fraction95.30Hydrogen13.86
Fixed carbon4.50Nitrogen0.12
Ash (inert)0.20Chlorine0
Sulfur0.06
Oxygen0
Ash (inert)0.20
Table 2. Composition of the produced syngas.
SYNGAS COMPOSITION
Chemical SpeciesExperimental Value
Carbon dioxide C O 2 7.8% v/v
Nitrogen N 2 70.1% v/v
Water H 2 O -
Methane C H 4 11.7% v/v
Propene C 3 H 6 0.99% v/v
Propane C 3 H 8 0.19% v/v
1,3 Cyclopentadiene C 5 H 6 0.06% v/v
1,3 Butadiene C 4 H 6 0.11% v/v
Oxygen O 2 0.8% v/v
Carbon monoxide C O 7.9% v/v
Hydrogen H 2 0.4% v/v
Sulfur dioxide S O 2 8.8   mg / Nm 3
Table 3. Range adopted for the three parameters considered for the plant model calibration.
NameUnit of MeasurementParameter Range
Reactor temperature[K]500–900
C H 4 mass flow rate[kg/s]0.002–0.2
Air mass flow rate[kg/s]0.08–0.3
Table 4. Estimated chemical composition for the pulper.
Mass Fraction, kg/1 kg of Pulper
ETHYL-010.8415
ASH0.0015
N20.0012
S0.0006
C0.1375
H20.0177
Table 5. Decision variables.
Decision VariablesConstrains
NameUnit of MeasurementRange
T d e p o l y m [K]500–900[-]
e t h y l e n e d e p o l y m [-]0.1–1
m ˙ C H 4 [kg/s]0.002–0.21 < λ < 14
m ˙ a i r [kg/s]0.08–3
Table 6. Objective functions.
SpeciesObjective Functions
N 2 | [ N 2 ] 0.7009 |
C H 4 _ o u t | [ C H 4 o u t ] 0.1169 |
C O | [ C O ] 0.079 |
C O 2 | [ C O 2 ] 0.078 |
C 3 H 6 | [ C 3 H 6 ] 0.0099 |
C 3 H 8 | [ C 3 H 8 ] 0.0019 |
C 5 H 6 | [ C 5 H 6 ] 0.00059997 |
C 4 H 6 | [ C 4 H 6 ] 0.0011 |
O 2 | [ O 2 ] 0.0079 |
H 2 | [ H 2 ] 0.004 |
S O 2 | [ S O 2 ] 0.00000003 |
Table 7. Decision-making results: decision variables values.
[ C d e p o l y m ] [ H 2 d e p o l y m ] [ e t h y l e n e d e p o l y m ] m ˙ a i r m ˙ C H 4 T d e p o l y m
Mass Fraction[kg/1 kg of m ˙ e t h y l e n e , Figure 4]Mass Fraction[kg/1 kg of m ˙ e t h y l e n e , Figure 4]Mass Fraction[kg/1 kg of m ˙ e t h y l e n e , Figure 4][kg/s][kg/s][K]
CR.10.1520.01960.8250.7480.043853.15
CR.20.1570.02020.8202.6700.110573.15
CR.30.05470.00700.9532.700.120653.15
CR.40.14770.01900.8301.910.090753.15
Table 8. Decision-making results: Syngas composition in volume fraction, m3/1 m3 of Syngas.
CR.1
volume fraction,
m3/1 m3 of Syngas
[ C 3 H 6 ] [ C 3 H 8 ] [ C 4 H 6 ] [ C 5 H 6 ] [ C H 4 o u t ] [CO]
1.45 × 10⁻⁴ 5.60 × 10−61.23 × 10−120.0014840.27420.2362
[ C O 2 ] [ H 2 ] [ N 2 ] [ O 2 ] [ S O 2 ]
1.15 × 10−40.0068350.47902.02 × 10−8
CR.2
volume fraction,
m3/1 m3 of Syngas
[ C 3 H 6 ] [ C 3 H 8 ] [ C 4 H 6 ] [ C 5 H 6 ] [ C H 4 _ o u t ][CO]
5.32 × 10−122.29 × 10−111.32 × 10−287.60 × 10−230.11795.08 × 10−4
[ C O 2 ] [ H 2 ] [ N 2 ] [ O 2 ] [ S O 2 ]
0.1390.01060.70804.34 × 10−5
CR.3
volume fraction,
m3/1 m3 of Syngas
[ C 3 H 6 ] [ C 3 H 8 ] [ C 4 H 6 ] [ C 5 H 6 ] [ C H 4 _ o u t ][CO]
1.25 × 10−125.86 × 10−114.59 × 10−262.38 × 10−200.111314.42 × 10−3
[ C O 2 ] [ H 2 ] [ N 2 ] [ O 2 ] [ S O 2 ]
0.1370.03170.6946.98 × 10−344.20 × 10⁻⁵
CR.4
volume fraction,
m3/1 m3 of Syngas
[ C 3 H 6 ] [ C 3 H 8 ] [ C 4 H 6 ] [ C 5 H 6 ] [ C H 4 _ o u t ][CO]
1.40 × 10−105.86 × 10−101.65 × 10−222.04 × 10−160.13234.98 × 10−2
[ C O 2 ] [ H 2 ] [ N 2 ] [ O 2 ] [ S O 2 ]
0.1170.06490.62724.12 × 10−304.37 × 10⁻⁵
Table 9. Syngas combustible species and reference LHV values adopted for the LHV calculation.
LHV L H V ( C R . 1 ) = 11.850   M J / k g
L H V ( C R . 2 ) = 3.445   M J / k g
L H V ( C R . 3 ) = 3.543   M J / k g
L H V ( C R . 4 ) = 5.137   M J / k g
L H V ( e x p ) = 5.138   M J / k g
[MJ/kg]
C H 4 50
C O 10.05
C 3 H 6 45.8
C 3 H 8 46.3
H 2 120
C 4 H 6 43.55
C 5 H 6 41.79
Table 10. Biomass steam power plant (BSPP) characteristics at nominal point operation in the standard configuration [35].
Biomass Mass Flow Rate2498 kg/h
Gross electric power2688 kW
Electric power for auxiliary320 kW
Net electric power2368 kW
Electric efficiency23%
Publisher’s Note: MDPI stays neutral with regard to jurisdictional claims in published maps and institutional affiliations.

