Article

Extraction of Chlorobenzenes and PCBs from Water by ZnO Nanoparticles

Nanotechnology Innovation Center of Kansas State, Department of Anatomy and Physiology, Institute of Computational Comparative Medicine, Kansas State University, Manhattan, KS 66506-5802, USA
*
Author to whom correspondence should be addressed.
Processes 2021, 9(10), 1764; https://doi.org/10.3390/pr9101764
Submission received: 5 September 2021 / Revised: 24 September 2021 / Accepted: 27 September 2021 / Published: 1 October 2021
(This article belongs to the Special Issue Novel Adsorbent for Environmental Remediation)

Abstract

:
Metal oxide nanoparticles have great potential for selective adsorption and catalytic degradation of contaminants from aqueous solutions. In this study, we employ mass spectrometry and molecular dynamics simulations to better understand the chemical and physical mechanisms determining the affinity of chlorobenzenes and polychlorinated biphenyls (PCBs) for zinc oxide nanoparticles (ZnO NPs). The experiments and simulations both demonstrate that the adsorption coefficients for chlorobenzenes increase steadily with the number of chlorine atoms, while, for PCBs, the relation is more complex. The simulations link this complexity to chlorine atoms at ortho positions hindering coplanar conformations. For a given number of chlorine atoms, the simulations predict decreasing adsorption affinity with increasing numbers of ortho substitutions. Consequently, the simulations predict that some of the highest adsorption affinities for ZnO NPs are exhibited by dioxin-like PCBs, suggesting the possibility of selective sequestration of these most acutely toxic PCBs. Remarkably, the experiments show that the PCB adsorption coefficients of ZnO NPs with diameters ≤ 80 nm exceed those of a soil sample by 5–7 orders of magnitude, meaning that a single gram of ZnO NPs could sequester low levels of PCB contamination from as much as a ton of soil.

1. Introduction

Aromatic organochlorines are a class of compounds that persist in the environment and in the bodies of humans and other animals long after their use. This class includes polychlorinated benzenes (Cl-benzenes), such as hexachlorobenzene [1,2], polychlorinated biphenyls (PCBs) [3], and dichlorodiphenyltrichloroethane (DDT) [4,5]. Both Cl-benzenes and PCBs have been found in the environment and are extremely persistent, often lasting for years or even decades in soil and lake sediment [6,7]. Because of their low vapor pressure, PCBs accumulate primarily in the hydrosphere, despite their hydrophobicity, as well as in the organic fraction of soil and in organisms [8,9]. The major sources of PCBs and Cl-benzenes in drinking water are runoff from landfills, discharge of waste chemicals, and agricultural use [8]. Recent research has revealed that PCBs cause cancer in animals and are probable human carcinogens [10,11]. Depending on their pattern of chlorine substitution, PCBs exhibit different conformational preferences, biological activities, and degradation pathways in the environment [12]. Chlorine substitutions adjacent to the bond linking the two phenyl groups (ortho)—illustrated in Figure 1—have particularly strong effects on PCBs’ conformational preferences. PCBs with no chloro substitutions at ortho positions can easily adopt conformations in which the two phenyls are coplanar, while increasing numbers of ortho substitutions (a maximum of four) sterically hinder coplanar conformations. Some highly chlorinated PCB congeners that have one or fewer ortho substitutions can possess dioxin-like toxicity and are of particular concern [12,13]. These dioxin-like PCBs bind the aryl hydrocarbon receptor with high affinity and possess metabolism pathways characteristic of 2,3,7,8-tetrachlorodibenzodioxin (TCDD) [14]. On the other hand, some PCB congeners with ortho substitutions also possess potent biological activities and toxicity, but through mechanisms that are distinct from the classic dioxin pathway [15,16,17]. Therefore, there is a clear need for the water industry to remove these pollutants by using cost-effective methods in order to provide fresh water in adequate amounts to meet human health requirements.
Adsorption is one of the most effective physical processes for the removal of organic pollutants from water [18,19]. Activated carbon is widely used to remove organic contaminants from water [20,21]; however, it is poorly selective, and fouling is a major issue. Nanotechnology promises improved performance. In recent years, efforts have been made to apply nanotechnology for the detection of environmental pollutants and the remediation of organic pollutants [22,23,24]. The promise of nanoparticles comes from their high adsorbate capacity per mass and the tunability of their surfaces, which may enable selectivity for specific contaminants, thus reducing fouling by innocuous solutes. Recent studies revealed that metal oxide nanoparticles, such as silver [25,26,27], ZrO 2 [28], or TiO 2 [29], are capable of pesticide degradation via either surface or photocatalysis. Recently, ZnO NPs were found to possess higher photocatalytic efficiency than other common inorganic photocatalytic materials and were found to be more biocompatible than TiO 2 [30]. In the field of photocatalysis, ZnO NPs have emerged as leading candidates for efficient environmental management because of their unique characteristics, including a wide direct band gap (3.3 eV) in the near-UV spectral region, strong oxidative and photocatalytic potential, and a large free-exciton binding energy (60 meV) [31,32] so that excitonic emission processes can persist at or even above room temperature. Moreover, ZnO NPs have proven to be an efficient photocatalyst and adsorbent for various types of organic pollutants under UV and solar irradiation [33].
Given the hydrophobic nature of aromatic organochlorines, they tend to partition from water into the organic fraction of soil [34]. However, the soil-bound molecules are in dynamic equilibrium with those in the aqueous phase and periodically desorb and resorb. Therefore, these contaminants can be extracted from water by materials with sufficiently high adsorption affinities, depleting their concentrations in the soil phase [35]. The desorption kinetics typically show two clear timescales: A majority of the contaminants are depleted in about a day, while the remaining residues desorb on a timescale of months [35,36]. Owing to their smaller size, Cl-benzenes exhibit faster desorption kinetics than PCBs [35].
Computational methods can assist in the design of the next generation of materials for detection, sequestration, and catalytic degradation of environmental pollutants by enabling rapid prediction of adsorption thermodynamics and rationalization of the physicochemical interactions underlying adsorption. Statistics-based methods, known as linear free-energy relationships, quantitative structure–activity relationships, or surface adsorption indices, yield rapid predictions of adsorption properties for large sets of compounds based on experimental results for a small training set of representative compounds [37,38,39,40,41,42]. These statistical methods typically predict adsorption equilibrium constants according to log k = c 0 + i c i d i , where c i is a set of coefficients for a given adsorbent material that was optimized from the training dataset, and d i represents molecular descriptors that describe the physicochemical properties of the adsorbate molecule [43,44]. Hence, the physicochemical effects that drive the adsorption of a given adsorbate on a particular surface can be inferred from the coefficients, c i , of the surface and the descriptors, d i , of the adsorbate. However, it can be difficult to interpret these coefficients in terms of energetic and entropic interactions among the adsorbate, surface, and solvent. Furthermore, conformational effects, such as those distinguishing dioxin-like and non-dioxin-like PCB congeners, are not well represented by popular molecular descriptions.
In contrast to statistics-based methods, physics-based molecular dynamics simulations can unambiguously reveal the molecular interactions that underlie adsorption at the cost of a significantly increased investment of computational resources. For the adsorption of a diverse set of aromatic compounds on graphitic nanomaterials, we demonstrated that existing models of intermolecular interactions (molecular force fields) predict adsorption affinities with high correlation ( r > 0.9 ) to experiments [45]. At the same time, these simulations reveal the atomic-scale interactions that determine the adsorption affinities, including electrostatic and van der Waals energies, hydrogen bonding, enthalpic and entropic contributions of the solvent, and the conformational entropy of the adsorbate [46,47,48]. Where adequate experimental data are unavailable, molecular dynamics simulations can also be used to train statistics-based methods [47]. An important advantage of molecular dynamics simulations over experiments in the study of environmental contaminants is that they allow researchers to avoid the hazards and costly safety measures associated with procuring, handling, and disposing of toxic and carcinogenic compounds, including dioxin-like PCBs. However, at this time, a major limitation of molecular dynamics is the lack of reliable atomically detailed models for the surfaces of many solid materials and the lack of force fields providing a consistent description of interactions among the organic solute, the solid surface, and water.
The present study focuses on the interaction of aromatic organochlorines with ZnO NPs in the aquatic environment by leveraging analytical chemistry techniques and a molecular dynamics simulation to understand the physicochemistry of adsorption of these organochlorines to the ZnO surface. In particular, we consider the influence of the number of chlorine atoms in the organochlorines, their substitution pattern, the solution concentrations of the organochlorines and ZnO NPs, the size of the ZnO NPs, and the pH and ionic strength of the solution. The results are envisioned to increase the understanding of the transport of pollutants in the environment and to enable the implementation of nanotechnology in pollutant filtration and water treatment.

2. Methods

2.1. Nanomaterials and Chemicals

The ZnO NPs (approximate diameter, 80 nm) used in this study were obtained from BASF through the nanoGEM collaboration for a previous study [40]. Smaller ZnO NPs (14 nm) were purchased from PlasmaChem GmbH (Berlin, Germany). Mesoscale ZnO particles (1000 nm) were purchased from Atlantic Equipment Engineers (Upper Saddle River, NJ, USA). Brief physicochemical characterizations of the ZnO particles are summarized in Table S1 of the Supplementary Information (SI). Detailed characterization data of the nanoGEM ZnO NPs may be found in our previous publication [40]. For comparison, a well-characterized sample of soil [49] was kindly provided by the Kansas State University Soil Testing Lab. All organochlorines and solvents used in this research were purchased from Sigma (St. Louis, MO, USA). The structures of the PCBs used in the experiments are shown in Figure 1.

2.2. Adsorption of Aromatic Organochlorines onto ZnO NPs

The adsorption experiments were conducted based on a protocol established by our group with some modifications [40]. In brief, 2 mg of ZnO NPs were added to a 2 mL glass vial filled with 200 μ L of deionized water. The vial was then vortexed to suspend the nanoparticles before adding 1 mL of working solution (WS1, WS5, WS10, WS20, WS50, or WS100) containing the aromatic organochlorines compounds at various concentrations. The vials were sealed immediately with a screw cap with PTFE/silicone septa (purchased from Agilent Technologies). The process of adsorption of the aromatic organochlorines compounds onto nanoparticles was conducted by vigorously shaking the mixtures for 5 h until equilibrium was reached. The particles were then separated from the solution through centrifugation. In addition, it is important to note that the recovery data collected in Table S4 demonstrated that the adsorption of ZnO NPs for aromatic organochlorines actually occurred on the nanoparticles and not to the vial or cap surfaces.

2.3. Adsorption of Aromatic Organochlorines onto Soil Particles

To compare the adsorption ability between the soil particles and ZnO NPs, the soil sample [49] was subjected to a procedure similar to that of the ZnO NPs. The concentration of soil was 1 mg/mL. The concentration of the Cl-benzenes or PCBs was 0.05 mg/L.

2.4. Working Solutions

Individual standard stock solutions of organochlorine were prepared in acetone, similarly to the protocol used by other authors [50], and stored at 20 °C. A solution of 10 mg/L of a mixture of 16 aromatic organochlorines was prepared in acetone through the dilution of individual aromatic organochlorine stock solutions and stored at 4 C. The above organochlorine stock solution was diluted to 1 mg/L with acetonitrile and then diluted with water to yield working solutions with organochlorine concentrations of 1 × 10 3 , 5 × 10 3 , 1 × 10 2 , 2 × 10 2 , 5 × 10 2 , or 1 × 10 1 mg/L, which are referred to as WS1, WS5, WS10, WS20, WS50, or WS100, respectively.

2.5. Extraction of Aromatic Organochlorines

After 5 h of vigorous shaking of the organochlorine–nanoparticle suspensions at room temperature (25 C), the ZnO NPs were removed from the solution through centrifugation at 9300× g for 20 min at 4 C. After centrifugation, the aqueous supernatant of the organochlorines was collected and transferred into vials for subsequent extraction of the aromatic organochlorines. Equal volumes of hexane and aromatic organochlorine aqueous solution were mixed by vigorously shaking for 30 min at room temperature, and they were then centrifuged at 9300× g for 5 min at 4 C. The hexane layer was collected and stored at 4 C.

2.6. Analysis of Aromatic Organochlorines with GC/MS/MS

All gas chromatography/tandem mass spectrometry (GC/MS/MS) analyses were conducted on an Agilent 7000 GC/MS Triple Quadrupole system. Table S2 lists the instrument parameters optimized in this study. In order to maximize the response of the instrument for each aromatic organochlorine, the choices of the precursor ion, product ion, collision energy, and dwell time were optimized. Table S3 lists the optimum MRM parameters for 16 aromatic organochlorines. To prepare the calibration standard curves, equal volumes of hexane and working solutions were mixed by vigorously shaking for 30 min at room temperature and centrifuging at 9300× g for 5 min at 4 C. The hexane layer was collected for GC/MS/MS analysis. Calibration standards with concentrations of 1 × 10 3 , 5 × 10 3 , 1 × 10 2 , 2 × 10 2 , 5 × 10 2 , and 1 × 10 1 mg/L were used for evaluation of linearity. Based on a signal-to-noise ratio approach, at the level of 1 × 10 3 mg/L, it was found that the signal-to-noise ratio of each calibration standard was over 10 (Figure S1). Thus, the 1 × 10 3 mg/L level for all of the 16 aromatic organochlorines was considered acceptable for estimating the limit of quantification (Table S4). A 0.01 mg/L quality control sample was used to evaluate the reproducibility and recovery of the analysis. The quality control spiking solution (500 μ L) was mixed with hexane (500 μ L) by vigorously shaking for 30 min at room temperature and centrifuging at 9300× g for 5 min at 4 C. Subsequently, the hexane layer was collected. The analysis was performed in replicates of six. Excellent reproducibility (shown as quantification RSD %) and recovery were obtained for the 16 aromatic organochlorines (Table S4), suggesting that the method of the analysis was acceptable with high sensitivity, sufficient accuracy, and excellent stability. The Agilent GC-QQQ/MassHunter Workstation software was used for data acquisition. The equilibrium concentrations ( C eq ) of organochlorines remaining in solution after exposure to the particles were determined directly using the Qualitative Analysis software (Agilent). The adsorption coefficient of a given compound onto a particular type of particle was calculated from the equilibrium concentration with
k = V 0 ( C 0 C eq ) m C eq ,
where V 0 was the total volume of fluid in the vial, C 0 was the concentration of each organochlorine compound prior to adsorption, C eq was the concentration remaining in solution after the adsorption reached equilibrium, and m was the mass of nanoparticles present in the suspension. In this article, we usually consider the base-10 logarithm of the adsorption coefficient: log 10 k C , where C = 1 g/mL is the standard concentration. For brevity, we refer to this quantity as log k .

2.7. Molecular Models of Aromatic Organochlorines

For the molecular dynamics simulations, thirty aromatic solutes were parameterized according to CHARMM General Force Field (CGenFF) version 3.0.1 [51]. These solutes included the non-chlorinated parent compounds (benzene and biphenyl), all Cl-benzene isomers (12 compounds), the 10 ortho-substituted PCBs used in the experiments, 6 dioxin-like PCBs, and 10 other PCBs. The PCBs considered in this work are indicated in Table 1. Benzene, biphenyl, and chlorobenzene are model compounds in the official CGenFF 3.0.1 distribution. The remaining 27 compounds were parameterized using the ParamChem web server (CGenFF program version 1.0) [52,53].

2.8. Molecular Model of the Zinc Oxide Surface

While CGenFF natively represents the aromatic solutes, well-validated atomic parameters for ZnO compatible with CGenFF are not available. Furthermore, the surfaces of the ZnO NPs are heterogeneous; their structure at the atomic level is poorly characterized and likely varies with the synthesis technique used. As described in the SI, we performed reactive molecular dynamics simulations using atomic interaction parameters from ReaxFF [55] to study spontaneous structure formation in ZnO particles. We determined that a ZnO wurzite structure and a pristine Zn-terminated {0001} face might provide a simple representative model of the nanoparticle surfaces. This model was not intended to represent the structural complexity that is likely present at the surfaces of real ZnO NPs. The goal of this model was to capture the qualitative effects of the conformational freedom of PCBs. Although the ZnO NPs appear approximately spherical, the transmission electron images are consistent with local flatness at the length scale of the organochlorine solutes (<1.2 nm) [40]. All production simulations used a surface model consisting of a wurzite ZnO slab with dimensions of 39.96 × 35.20 × 8.5 Å 3 with flat Zn-terminated (0001) facets on its upper and lower surfaces (see Figure 2). The model was periodic (effectively infinite) in the x y plane and the free surfaces perpendicular to the z axis. The model was solvated with 1748 water molecules, forming a simulation box with dimensions of 39.96 × 35.20 × 48 Å 3 after equilibration. For simplicity, the positions of the ZnO atoms were fixed during the simulations.
Non-bonded interactions were modeled with Lennard–Jones and Coulomb energies, as given by
V nonbonded = atoms i , j 1 4 π ϵ 0 q i q j r i j + ϵ i j R i j min r i j 12 2 R i j min r i j 6 ,
with ϵ i j = ϵ i ϵ j and R i j min = 1 2 ( R i min + R j min ) . The Lennard–Jones parameters and atomic charges of the ZnO were chosen to reproduce the experimental difference in the logarithm of the equilibrium constant between two compounds, biphenyl and 2,3-dichlorobiphenyl ( Δ L = log 10 ( k PCB 5 / k PCB 0 ) ). These two compounds were chosen with the aim of balancing the ZnO interaction for aromatics with and without chlorine. We performed free-energy calculations for the ZnO adsorption of these two compounds, optimizing the Lennard–Jones and charge parameters until we obtained a set of parameters for which Δ L sim Δ L expt < 0.1 . The details of the parameter optimization are given in the SI. The final parameters are given in Table 2.

2.9. Molecular Dynamics Methods

Simulations were performed in an explicit solvent using the NAMD molecular dynamics package [56]. The temperature was maintained at 300 K by a Langevin thermostat. Periodic boundary conditions were used along all three axes, giving the ZnO slab effectively infinite extent in the x y plane. The pressure was kept at 101.325 kPa using the Langevin piston method [57], with the size of the simulation cell fluctuating along only the z axis. Long-range electrostatic interactions were calculated with the particle mesh Ewald method [58]. Direct Coulomb and Lennard–Jones forces were truncated smoothly from 10 to 12 Å. The equations of motion were integrated with a 4 fs timestep, which gave stable dynamics owing to repartitioning of the mass of non-water hydrogen atoms [59]. The simulations used the TIP3P water model [60], consistently with the parameterization of the CGenFF force field.

2.10. Free-Energy Calculations

The potentials of mean force as a function of the transition coordinate Z were calculated using the adaptive biasing force (ABF) technique [61,62]. The coordinate Z was defined as the distance along the z axis between the first layer of zinc atoms and the center of mass of the aromatic organochlorine. For all solutes, the potentials of mean force were calculated on the domain 2.6 Z 14.0 Å with a bin size of 0.05 Å in simulations of ≥400 ns. An example showing the convergence of independent ABF calculations on this timescale is shown in Figure S2. For the larger non-coplanar PCBs, Z = 2.6 Å implied nonphysical penetration of the solute into the ZnO slab, leading to problems of sampling with the adaptive biasing force method. Hence, to improve sampling, additional ABF simulations (200 ns) were performed for PCBs 47 and 192 in a window of 3.1 Z 14.0 Å, for PCBs 91 and 154 in a window of 3.8 Z 14.0 Å, and for PCBs 204, 207, and 209 in a window of 3.8 Z 14.0 Å. By convention, the free energy for large distances between the solute and surface was taken to be zero; hence, the floating potentials of the mean of force were anchored so that their average values on the interval 13.5 Z 14.0 Å were zero. As derived in previous work [45], the adsorption equilibrium constant was estimated from the potential of mean force with
k = σ d Z exp β Δ G ( Z ) ,
where σ is the effective specific surface area (area/mass) of the ZnO NPs for adsorbing the solutes, β = 1 / ( k B T ) is the inverse thermal energy, and Δ G ( Z ) is the potential of mean force as calculated from the simulations. Given the evidence of porosity of the ZnO NPs and the lack of an unambiguous measure of the specific surface area for solutes of the size of the PCBs, we treated σ as a free parameter, which was chosen to minimize the mean deviation of log k from the experimental values for the 17 solutes used in the experiments. This fit value of σ may subsume some imperfections in the model and force field.

3. Results and Discussion

3.1. Effects of Chloro Substitutions

The replacement of hydrogen atoms with chlorine has multiple effects on the physicochemical properties of aromatic molecules and, therefore, their affinity for the ZnO–water interface. In general, the greater electron density of chlorine relative to hydrogen implies that chloro substitutions increase the capacity for attractive van der Waals interactions. This trend is consistent with the larger octanol–water partition coefficients of Cl-benzenes with increasing chlorine numbers [63,64]. On the other hand, because carbon–chlorine bonds are more polar than carbon–hydrogen bonds, chloro substitution can also increase a molecule’s polarity, depending on the geometry. For example, chlorobenzene has a greater electric dipole moment and dielectric constant than those of benzene [65], while 1,4-dichlorobenzene, owing to its symmetry, exhibits a dipole moment much weaker than that of chlorobenzene or other dichlorobenzene isomers [66]. For PCBs, the situation is further complicated by the fact that chloro substitutions can dramatically affect PCBs’ conformational preferences. In particular, ortho substitutions sterically prohibit coplanar conformations of the two phenyl groups, keeping these two groups from simultaneously making full contact with any locally flat surface. The position of chloro substitutions affects the partition coefficient of PCBs in both water and soil [34]. Below, using both experiments and molecular simulations, we seek to understand how the number and position of the chloro substitutions and their effect on conformation determine the affinities of aromatic organochlorines for ZnO NPs.

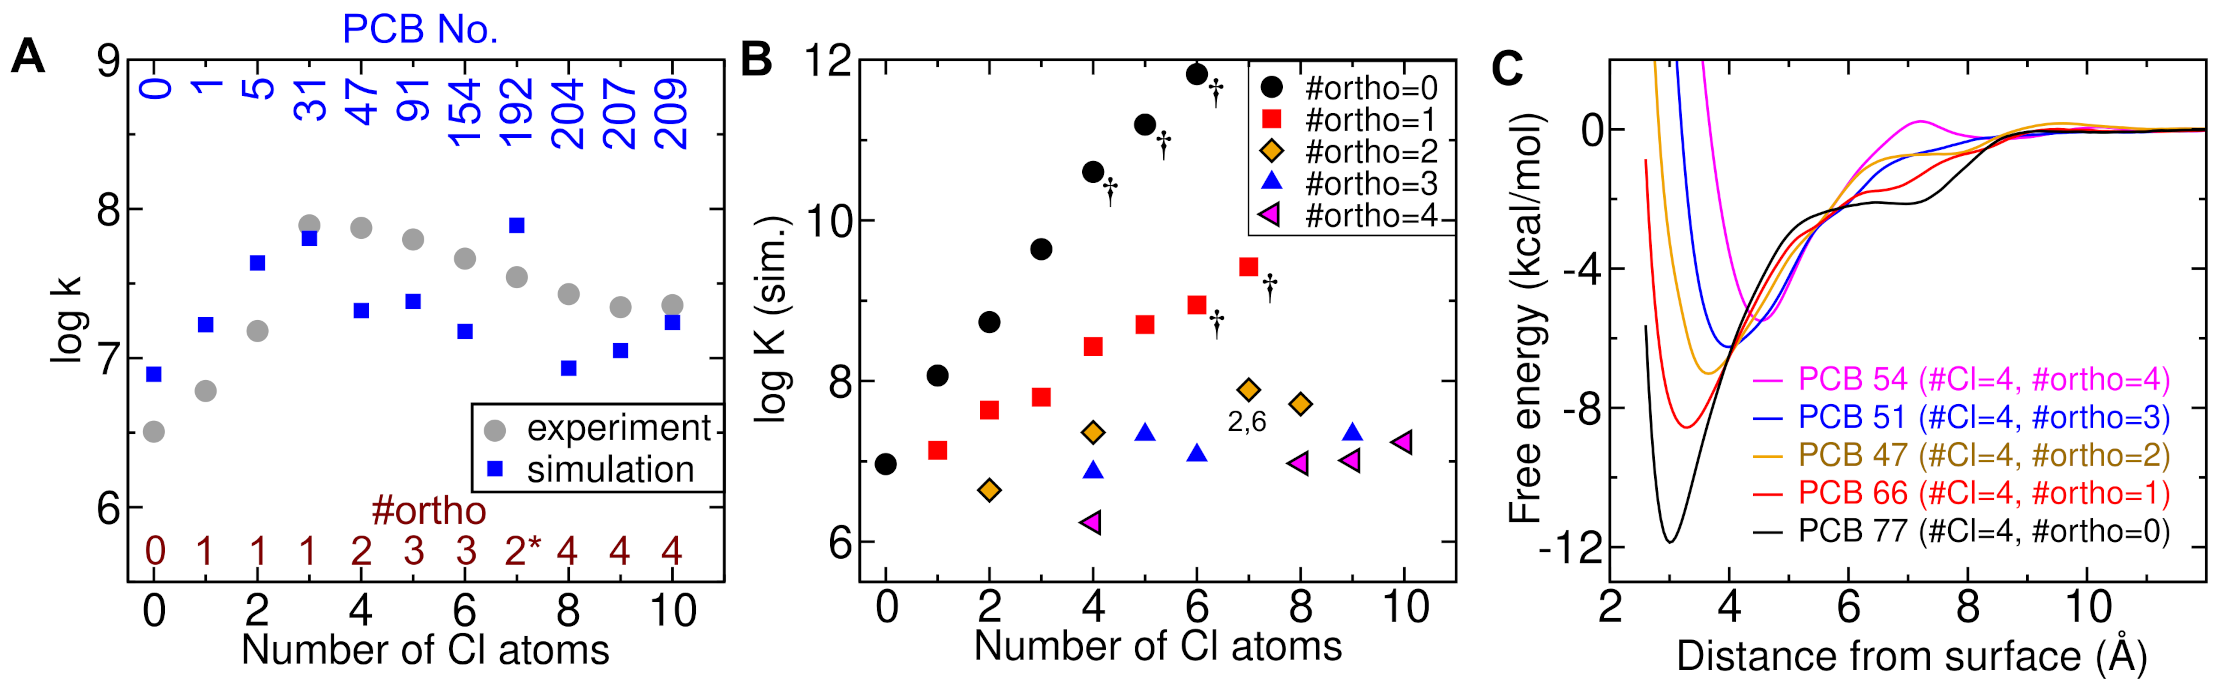
3.2. Effect of Chlorine Number

As a representative example, we first consider the adsorption coefficients determined in the experiments that included 80-nm-diameter ZnO NPs at a concentration of 0.8 mg/L and aromatic organochlorine concentrations of 0.05 mg/L. The log k values of Cl-benzenes increased approximately linearly with the number of chlorine atoms, as shown in Figure 3A. On the other hand, Figure 3B shows that, for the PCBs used in the experiments, the adsorption coefficient depended non-monotonically on the number of chlorine atoms. The properties of the PCBs used in the experiments are listed in Table 1. Biphenyl, which has no chlorine atoms, had the lowest affinity for ZnO NPs among the PCBs, but still exhibited a greater affinity than both chlorobenzene and 1,4-dichlorobenzene owing to its larger size. The log k values of the PCBs increased with each additional chlorine atom, from zero to three chlorine atoms. However, between three and four chlorine atoms, there was, instead, a slight drop in log k . The isomer with four chlorine atoms, PCB 47, had two ortho substitutions, while the previous congeners (PCBs 1, 5, and 31) had a single ortho substitution. Hence, it appears that the reduced conformational freedom of di-ortho-substituted PCB 47 cancelled its increased capacity for van der Waals attraction relative to PCB 31. Perhaps surprisingly, the log k values of the PCBs considered in the experiments steadily declined from four to nine chlorine atoms. The PCB isomer with five chlorine atoms, PCB 91, was the first PCB whose affinity for the ZnO NPs was not significantly larger than that of the Cl-benzene with the same number of chlorine atoms: PCB 91 and pentachlorobenzene exhibited similar log k values. Interestingly, hexachlorobenzene had a greater log k value than any of the PCBs considered in the experiments, including PCB 209, which had 10 chlorine atoms. While the log k values of the Cl-benzenes were highly correlated ( R 2 0.9 ) with their hydrophobicity (as characterized by the logarithm of their octanol–water partition coefficients, log P OW ), there was very poor correlation between the log k and log P OW values of the PCBs ( R 2 < 0.24 ) [67,68].

3.3. Effect of the Substitution Position in Chlorobenzenes

Dichloro-, trichloro-, and tetrachlorobenzenes each comprise three isomers with distinct chloro-substitution positions. The experiments included only a single isomer for each chlorine number; hence, we performed molecular simulations to better understand how the positions of the chloro substitutions affected the adsorption coefficients. A typical simulation system is shown in Figure 2, including water, an aromatic organochlorine molecule, and a model of a ZnO surface. Taking advantage of an efficient free-energy calculation technique [61,62], we determined the free energy as a function of distance between each aromatic organochlorine and ZnO surface, Δ G ( Z ) . The adsorption coefficient was estimated from Δ G ( Z ) with Equation (3). Figure 4A compares the adsorption coefficients for the Cl-benzenes derived from the experiment to those derived from the simulation. The correlation between the experiment and simulation was r = 0.99 , which is remarkable given that the simulation parameters were not calibrated using the experimental results for any Cl-benzenes, but instead were based on results for two PCB compounds. However, Figure 4A shows a slightly higher slope for the simulation-derived results than those derived from the experiment.
Figure 4B displays the Δ G ( Z ) functions calculated in the simulations for all distinct Cl-benzene species. When the separation between the surface and Cl-benzene molecule was large ( Z > 8 Å), the interaction between the two was negligible, and Δ G ( Z ) was flat when the compound reached the interfacial water layer, Z < 5 Å. For all compounds, a minimum of the free energy appeared at Z min = 3.0 Å, where the Cl-benzenes lay flat on the ZnO surface. As expected, the minimum free energies ( Δ G ( Z min ) ) became more favorable with increasing chlorine number, with benzene exhibiting the weakest adsorption and its fully chlorinated derivative, hexachlorobenzene, exhibiting the strongest. The minimum free energies differed little between isomers with the same Cl numbers. Indeed, Δ G ( Z min ) decreased monotonically with the Cl number, irrespective of which isomers were chosen.
The simulation results, therefore, justify the consideration of only a single isomer for each Cl number in the experiments. On the other hand, Figure 4B suggests some interesting trends for the adsorption affinity of different substitution patterns. The isomers with adjacent clusters of chlorine atoms (1,2-, 1,2,3-, or 1,2,3,4-substituted benzenes) exhibited higher adsorption affinity (and more negative Δ G ( Z min ) ) than their counterparts with more evenly distributed chloro substitutions. The more symmetric 1,4- and 1,3,5-substituted benzenes had the weakest adsorption for their Cl numbers.

3.4. Effect of Substitution Position in PCBs

While the Cl-benzenes had little conformational freedom, the two phenyl groups of biphenyl and some PCBs were relatively free to rotate relative to each other. Experiments and quantum-level calculations for biphenyl in the gas phase suggest a preference for a nonplanar conformation (an average angle of 44 between the phenyl groups) [69,70]. On the other hand, multiple ortho substitutions hinder coplanar conformations, leading to larger average angles (74 for PCB 4) [71]. Our simulations revealed similar trends for these compounds in water, with average angles for biphenyl and PCB 4 of 46.0 ± 0.1 and 67.3 ± 0.2 , respectively. The hindering of roughly coplanar arrangements of the phenyl groups by ortho substitutions had a large effect on the conformation of the adsorbed PCBs and their adsorption coefficients.
As shown in Figure 5A, our simulations on the ZnO surface model were in qualitative agreement with the experiment, particularly in capturing the loss of affinity caused by the presence of two ortho substitutions. However, the effect of the ortho substitutions appeared to be stronger in the simulations than in the experiment. We hypothesize that this difference is due to the fact that the computational model of the ZnO surface was perfectly flat, while the natural ZnO NPs likely possessed a rougher surface. There are two ways to have two ortho substitutions: They can be on distinct phenyl groups (2,2 ) or the same phenyl group (2,6). PCB 192 is distinct from the other PCBs with the two ortho substitutions considered here because PCB 192 has these substitutions on the same phenyl group (2,6) rather than on different groups (2,2 ). Owing to the greater flexibility afforded by the 2,6-substitution, the simulations predicted a greater log k value for PCB 192 than for other ortho-substituted PCBs with similar Cl numbers. Surprisingly, the experimental data did not show a higher log k value for PCB 192 compared to these other PCBs. This discrepancy might again be due to the differing topography between the computational model and the real ZnO NPs.
To better understand the effect of the chloro-substitution position, we performed simulations for 15 additional PCBs, including five dioxin-like PCBs. The results are plotted in Figure 5B. For PCBs with no ortho substitutions, the adsorption coefficient increased steadily with the number of chlorine atoms, much like the Cl-benzenes. The log k values for the three dioxin-like PCBs with no ortho substitutions, PCB 169, 126, and 77, significantly exceeded those of all other PCBs considered here. As compared to their isomers with no ortho substitutions, the adsorption coefficients of the PCBs with a single ortho substitution were significantly weaker. A steady increase in log k with the Cl number was also observed for these PCBs. Figure 5B shows that, in general, more ortho substitutions led to weaker adsorption.

3.5. Substitution Position and PCB Conformation

The simulations furthermore revealed the considerable differences in the geometry of the adsorbed PCBs depending on the number of ortho substitutions. For instance, Figure 5C shows that the center of mass of the tetrachlorobiphenyls approached more closely to the surface when there were fewer ortho substitutions. Figure 6A,B illustrates the adsorbed conformations of two pentachlorobiphenyls, PCB 91, with three ortho substitutions, and PCB 126, a dioxin-like PCB of particularly potent toxicity [12,72] with no ortho substitutions. While PCB 91 adopted a twist angle approaching 90 on the model ZnO surface, PCB 126 was able to lie nearly flat on the surface, maximizing its contact area. Figure 6C,D demonstrates that these conformations are representative: PCBs 91 and 126 had mean twists of 71.3 ± 0.3 and 22.1 ± 0.3 when adsorbed to the surface. For PCB 91, coplanar conformations were effectively forbidden: Twist angles < 6.9 were not observed. Upon adsorption, PCB 126 became much more likely to adopt a coplanar conformation—maximizing its contact area with the ZnO surface—than when it was free in solution.

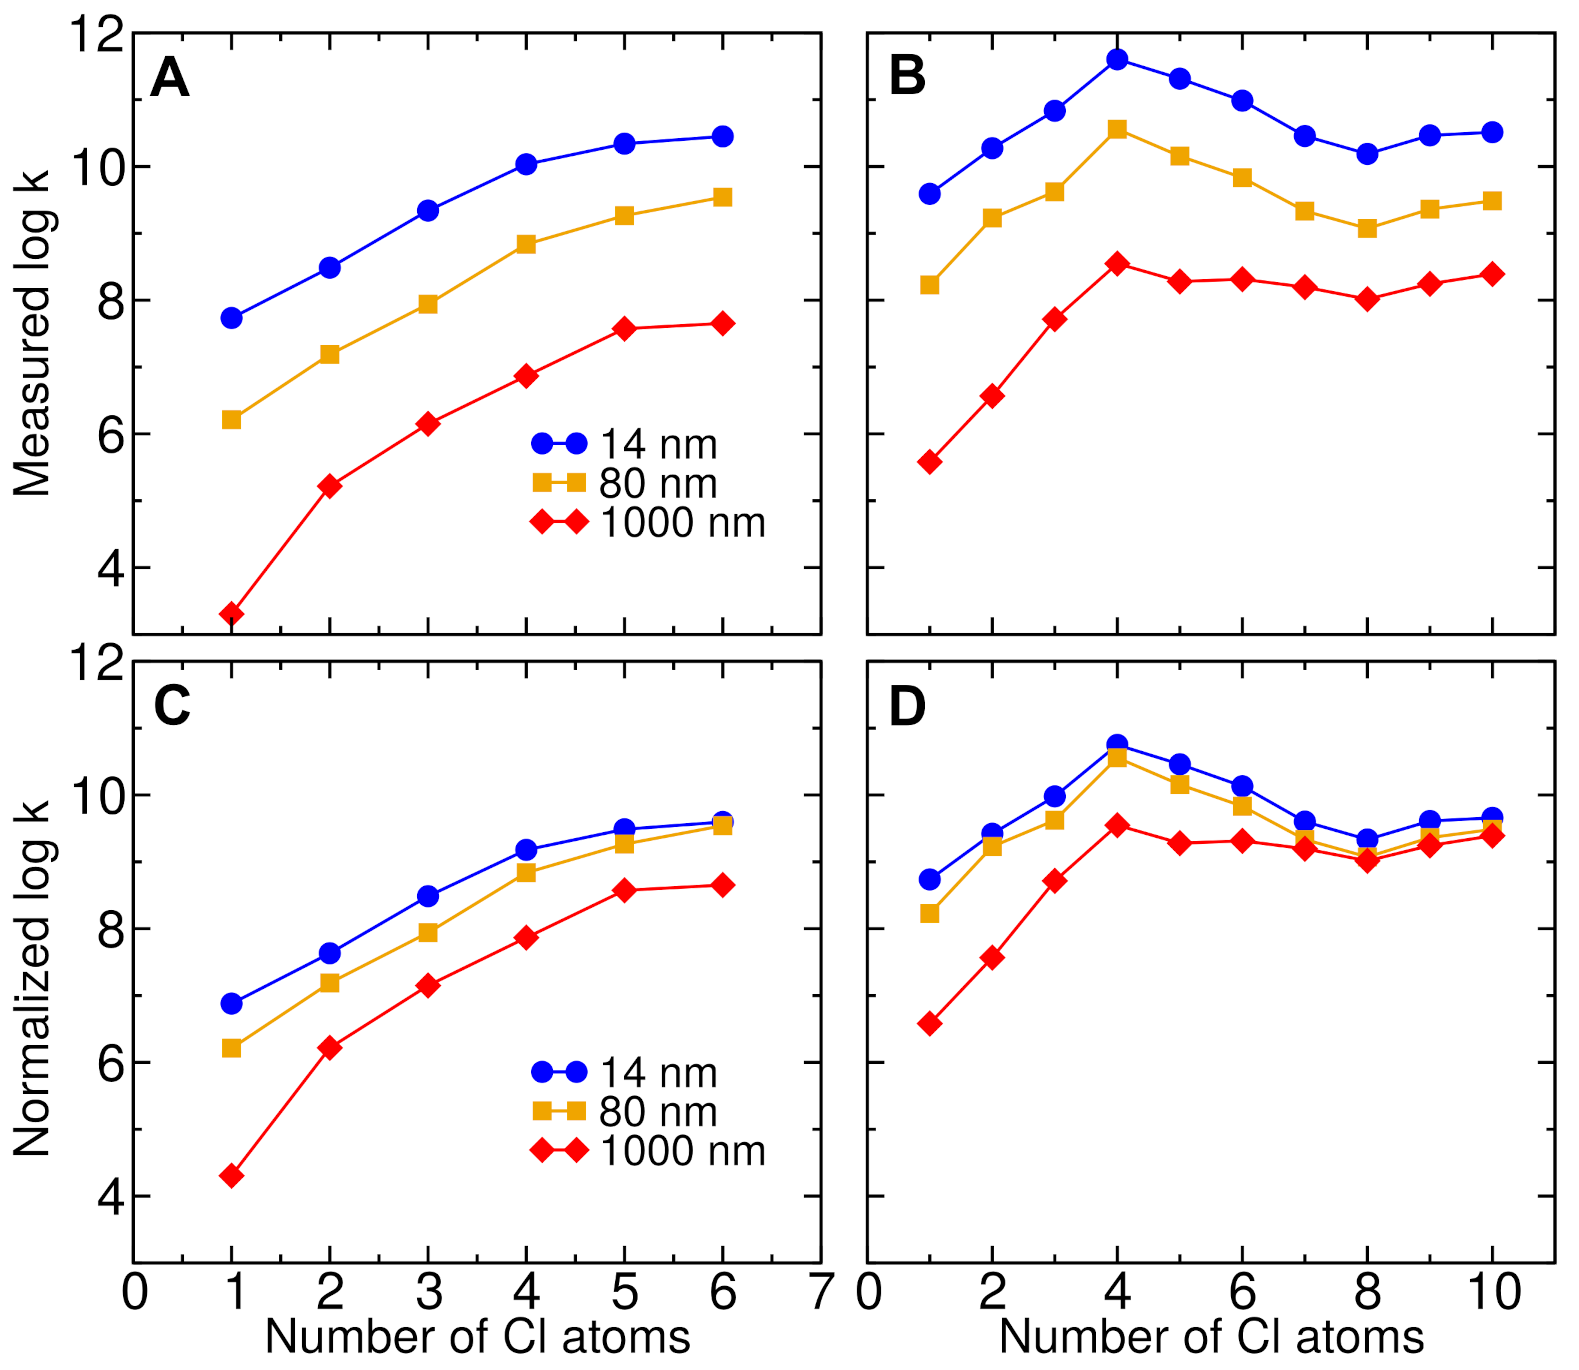
3.6. Effect of Nanoparticle Size

Given their greater surface-area-to-volume ratios, smaller particles have the potential for greater adsorption coefficients and greater surface loading for a given mass of particles. To determine the effect of particle size on the adsorption of organochlorines, ZnO NPs of diameters of approximately 14, 80, and 1000 nm were incubated with the aromatic organochlorines. The data presented in Figure 7A,B reveal that, as expected, the adsorption coefficients increased with decreasing particle size. However, Figure 7C,D demonstrates that the variation of log k with size was of a larger magnitude than would be expected for hypothetical particles of the same shape with fixed surface properties.
For approximately spherical particles, the specific surface area in Equation (3) can be expressed as:
σ = A eff m = 4 π ( d / 2 ) 2 γ ρ 4 π ( d / 2 ) 3 / 3 = 6 γ ρ d
where A eff is the effective surface area of the particles available for adsorbing the solute, m is the mass of the particles, γ is a parameter accounting for nanoscale surface roughness [73] and deviations from the spherical geometry of a particle, ρ is the average mass density of a particle, and d is the diameter of a particle. Therefore, the adsorption coefficient can be expressed as:
k = 6 γ ρ d d Z exp β Δ G ( Z ) .
This decomposition of k into influences from d, ρ , γ , and Δ G ( Z ) is not unique, but is intended to separate effects at different spatial scales.
For the purposes of comparison, we can normalize the log k values for ZnO NPs for different particle diameters with the transformation: log k log k + log d / d ref , where we have set the reference diameter to d ref = 80 nm. If all ZnO NPs have a similar chemical structure and atomic-scale topography at their surfaces, then the integral in Equation (5) would be similar among nanoparticles of different size. If all particles also have a similar overall density ( ρ ), aspect ratio, and nanoscale roughness ( γ ), then the log k values would be equal among the ZnO NPs of different diameters. Consistent with these assumptions, normalizing the adsorption coefficients brings the curves for ZnO NPs of different sizes closer together, as shown in Figure 7C,D. Nonetheless, the curves in these plots are not completely superimposed, implying that there are some differences between the ZnO NPs that cannot be ascribed to their diameter alone. The adsorption coefficients increase with diameter even after normalization, suggesting that the smaller ZnO NPs are less spherical or rougher ( γ ( 14 nm ) > γ ( 80 nm ) > γ ( 1000 nm ) ), less dense ( ρ ( 14 nm ) < ρ ( 80 nm ) < ρ ( 1000 nm ) ), or have a chemical structure that leads to stronger interactions with the aromatic organochlorines ( Δ G ( 14 nm ) < Δ G ( 80 nm ) < Δ G ( 1000 nm ) ). Trends in the normalized log k values appear to differ between Cl-benzenes and highly chlorinated PCBs, suggesting differences in the nanoscale structure of the ZnO NPs, or perhaps their surface chemistry. It is not clear whether these trends are specific to the particular ZnO NP samples used in this article or whether smaller ZnO NPs typically yield greater adsorption affinity than larger ZnO NPs even after accounting for the effect of size.

3.7. Effect of Organochlorine Concentration

The results presented in Figure 8 demonstrate that the adsorption coefficients on ZnO NPs were similar between organochlorine solute concentrations of C 0 = 0.01 and 0.05 mg/L. Hence, the adsorption coefficients were not affected by the concentrations of aromatic organochlorines when the concentration of each individual probe component was less than that of 0.05 mg/L, avoiding the nonlinear adsorption isotherms seen at higher concentrations [38,40]. Thus, it appears that the results given here represent physicochemical interactions between the organochlorine solutes and the surfaces of the ZnO NPs, while solute–solute interactions remained negligible in this regime.

3.8. Effect of Nanoparticle Concentration

Nanoparticles tend to attract each other through chemical bonding or physical interactions, forming larger particles in order to reduce high surface energy. To determine the effect of the concentration of ZnO NPs on adsorption, experiments were performed with different nanoparticle concentrations. The data presented in Figure 9 reveal that the adsorption coefficients of the Cl-benzenes and PCBs decreased significantly when the concentrations of ZnO NP were increased from 0.1 to 1 mg/L. This decrease suggests greater aggregation of the ZnO NPs as their concentration increased, reducing the accessible surface area for binding organochlorines. As shown in Figure S4 of the Supporting Information, the log k values of the Cl-benzenes, as well as the PCBs with fewer than six chlorine atoms, decreased roughly uniformly with increasing ZnO NP concentration. On the other hand, the more highly chlorinated PCBs exhibited a large loss of adsorption affinity between ZnO NP concentrations of 0.3 and 0.5 mg/L. We hypothesize that the Cl-benzenes and less chlorinated PCBs, particularly those that can adopt planar or near-planar conformations, are able to infiltrate gaps between the aggregated ZnO NPs at 0.5 mg/L, while the relatively bulky PCBs (154, 192, 204, 207, and 209) are too large to fit through these gaps. In practice, the aggregation behavior of the metal oxide NPs depends sensitively on the ambient pH, ionic strength, ion species, and the presence of natural organic matter in their aqueous environment [74,75,76,77,78,79]. Overall, with increasing ionic strength, the sedimentation of ZnO NPs is accelerated [80,81].

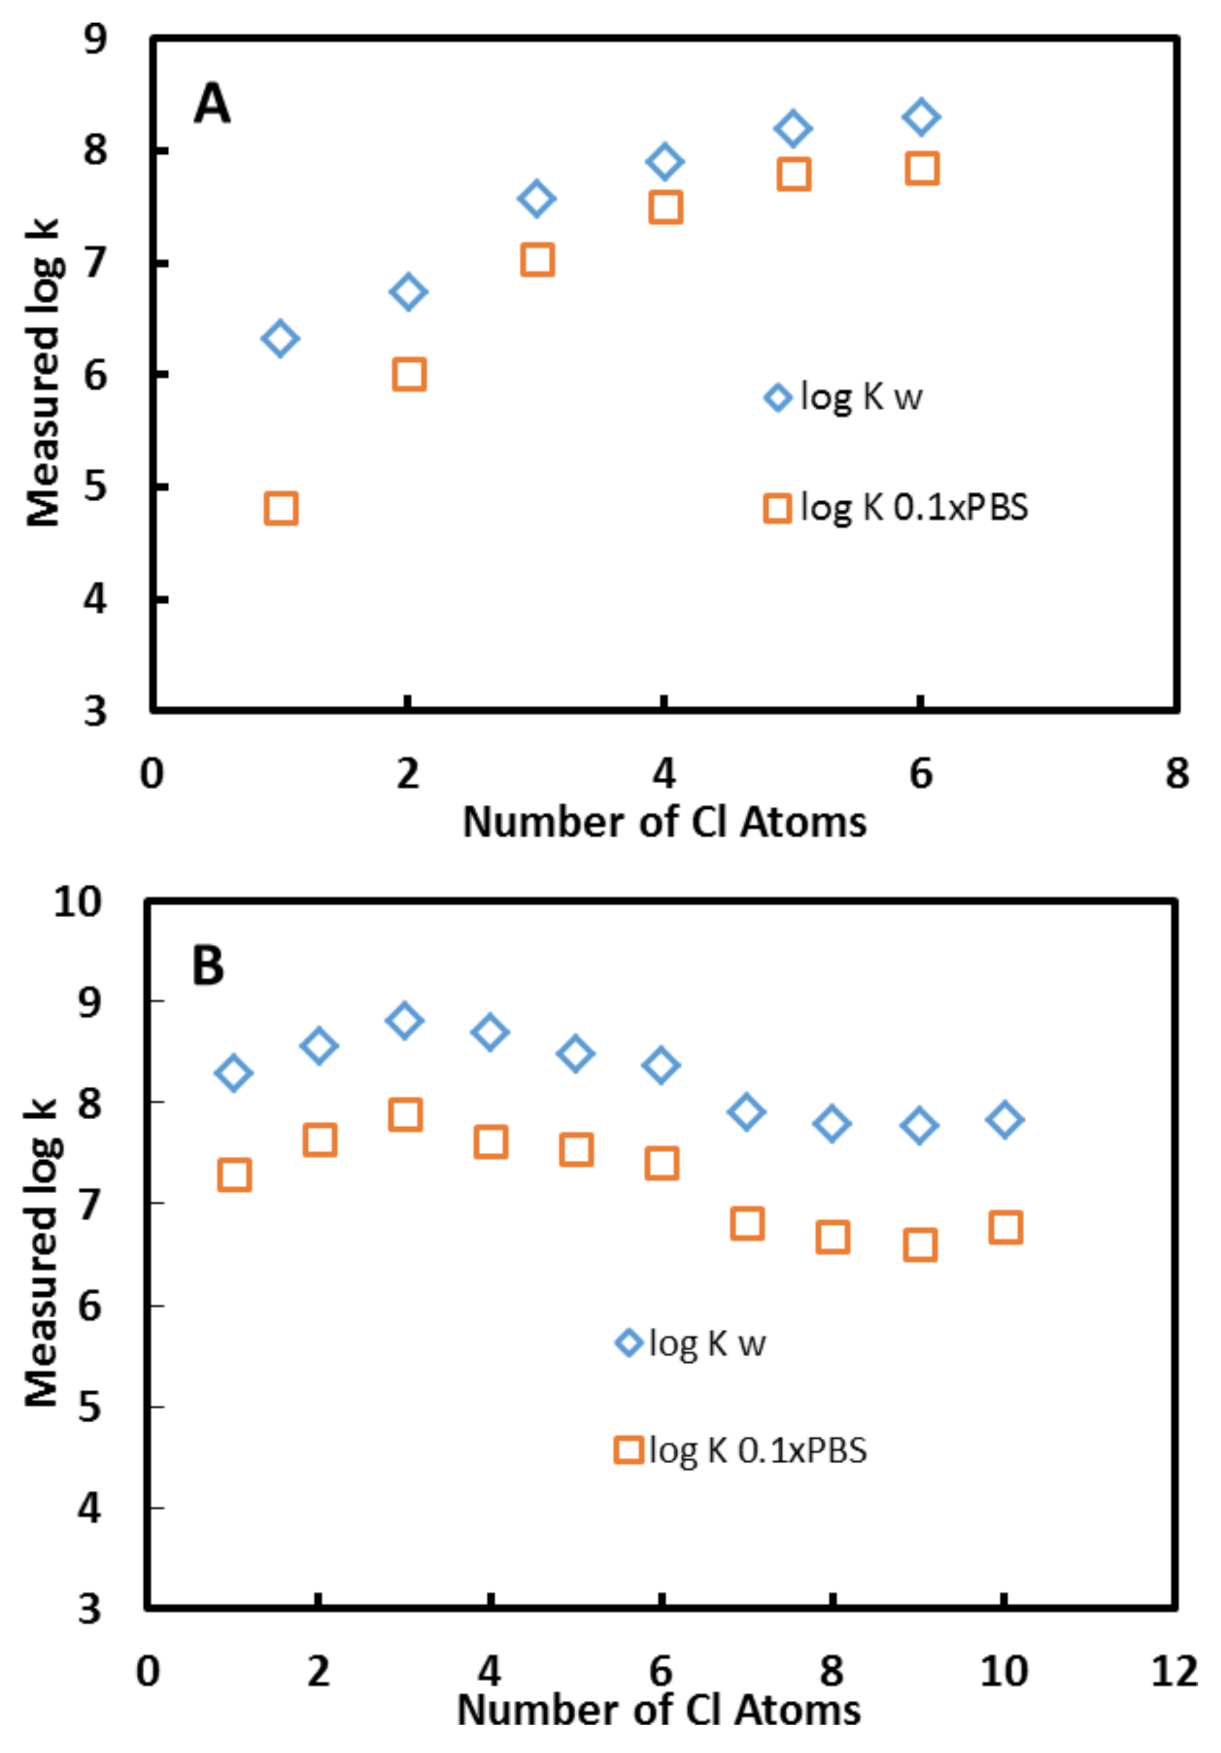
3.9. Effects of pH and Ionic Strength

In addition to influencing the tendency of the NPs to aggregate, the pH can determine the protonation state of surface groups, such as metal hydroxides [82], likely affecting interactions with solutes. The formation of charged surface groups can enhance the affinity of water for the surface and reduce the adsorption affinity of hydrophobic solutes, such as aromatic organochlorines. Moreover, ZnO NPs dissolve slowly at pH 7.4 and more rapidly at both acidic and basic pH (pH < 6 and pH > 9), releasing aqueous Zn 2 + ions [83]. Degradation of the nanoparticles, in turn, can lead to time dependence in the surface chemistry and morphology. To gain a better understanding of how pH and ionic strength might affect the interactions of Cl-benzenes and PCBs with ZnO NPs, experiments were performed in 0.1× phosphate buffered saline (PBS) solution, yielding a pH of 7.4 and an ionic strength of ≈16 mmol/L. As shown in Figure 10, we found a marked decrease in the adsorption coefficients in PBS as compared to water. The effect of PBS on Cl-benzene adsorption appeared to diminish in magnitude as the chlorine number was increased from 1 to 4, with log k changing by −1.5 for chlorobenzene and by −0.4 for 1,2,4,5-tetrachlorobenzene. The change for pentachlorobenzene and hexachlorobenzene was similar to that of the latter. For PCBs, the effect of PBS on adsorption appeared to be nearly independent of the Cl number, with changes in log k ranging from −1.2 to −0.9.

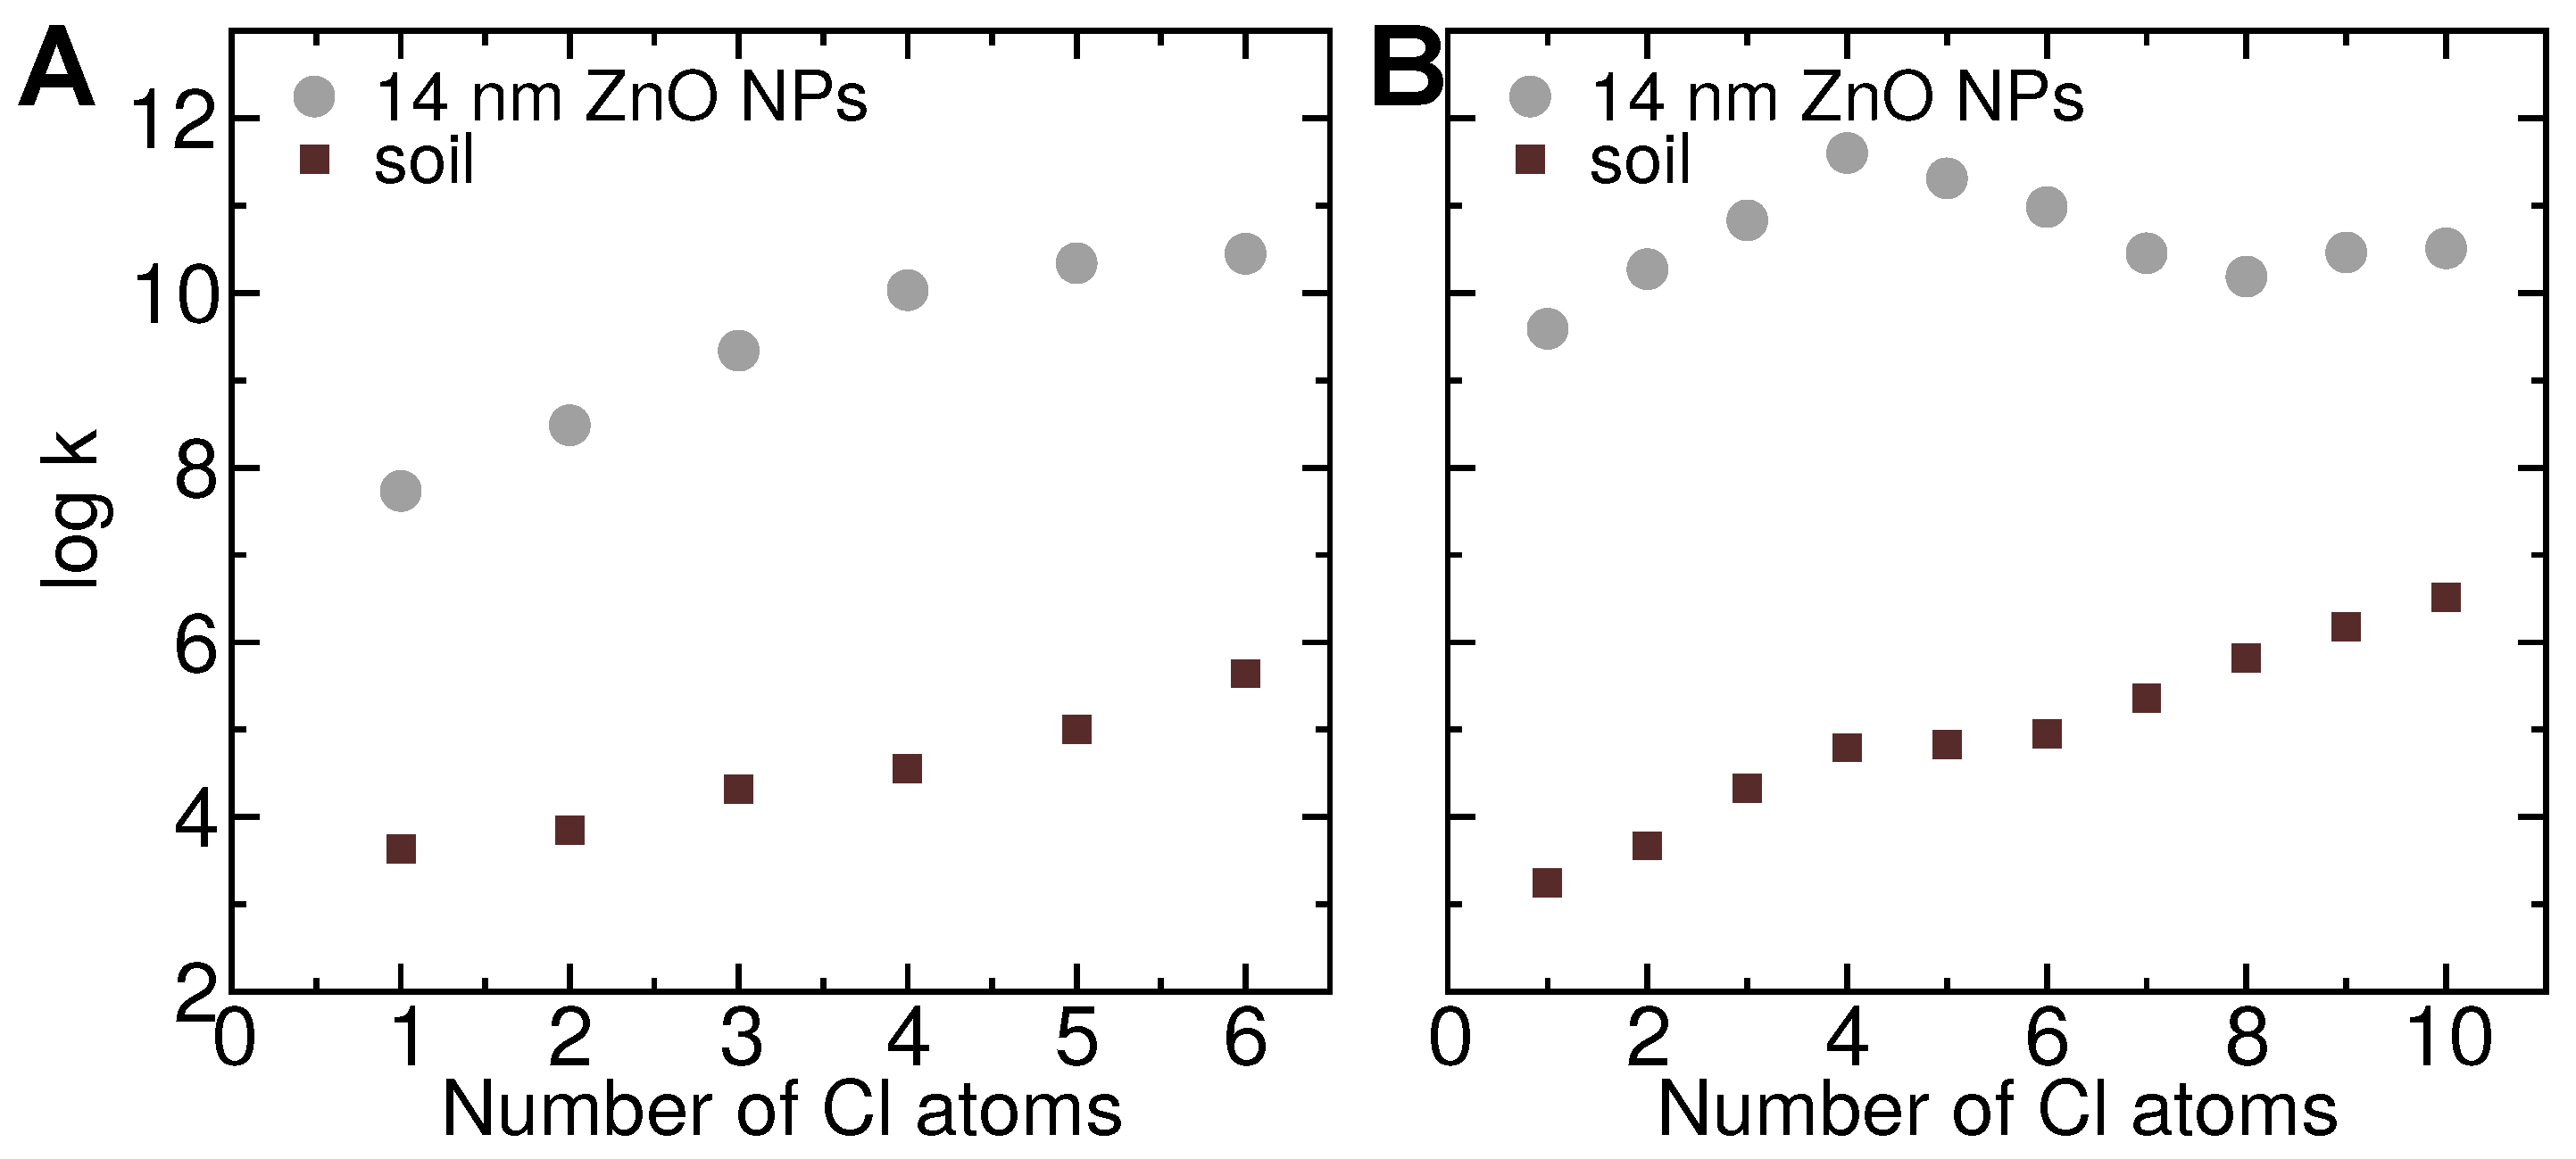
3.10. Partitioning between Soil and Nanoparticles

To estimate the ability of the ZnO NPs to extract aromatic organochlorines from soil, we determined the log k values for these molecules in a sample of Kansas soil using the same protocols as those employed for ZnO NPs. Figure 11 compares the adsorption coefficients for soil with those of 14 nm ZnO NPs. In contrast to our experiments with ZnO NPs, the experiments with soil revealed PCB adsorption coefficients that increased monotonically with the Cl number. These adsorption coefficients ( log k ) were highly correlated with the partition coefficients ( log P OW ) R 2 = 0.96 , suggesting that the PCBs partitioned into a bulk organic phase within the soil. A linear regression gives a fit line:
log k soil 0.608 log P OW + 0.185 .
The log k values of the 14 nm ZnO NPs markedly exceeded those of the soil by 4.4 for chlorobenzene to 7.6 for PCB 47. This difference exceeded six log units for all PCBs used in the experiments with Cl numbers < 8. Hence, in the regime where the concentration of PCBs was lower than that required for significant loading of the ZnO NPs, 1 g of 14 nm ZnO NPs could extract more than half of the PCB content from 1 metric ton of soil. The difference in the adsorption coefficients between ZnO NPs and soil was likely even greater for dioxin-like PCBs. Assuming the validity of the linear relation between the log k and log P OW values for PCB sorption in soil (Equation (6)), we can estimate the log k values of PCBs 126 and 169 to be 4.4 and 4.7. Based on Figure 7B and the free-energy calculations, we might expect log k values on 14 nm ZnO NPs of 12.4 and 13.0 for PCBs 126 and 169. Therefore, it seems possible that a sample of 14 nm ZnO NPs might be capable of sequestering half of the dioxin-like PCBs from a mass of soil that is eight orders of magnitude greater.

4. Conclusions

In this article, we investigated the adsorption of Cl-benzenes and PCBs onto ZnO NPs. Adsorption coefficients were determined using GC/MS/MS experiments, while molecular dynamics simulations were leveraged to interpret the experimental results and to explore the behavior of dioxin-like PCBs, which are more difficult to handle. We found that the log k values of the Cl-benzenes increased roughly linearly with the number of chlorine atoms and with log P OW . In stark contrast, the log k values of the PCBs varied non-monotonically with the number of chlorine atoms and correlated little with their log P OW values. Free-energy calculations performed in the context of the molecular dynamics simulations were in qualitative agreement with these trends. The simulations strongly supported the hypothesis that the non-monotonic behavior was due to steric clashes of ortho-substituted chlorine atoms, which prevented some PCBs from adopting coplanar arrangements. These ortho-substituted PCBs were therefore unable to make full contact with a surface that was roughly flat at the 1 nm length scale, reducing their adsorption affinities to the ZnO NPs as compared to PCBs lacking ortho substitutions. The simulations predicted that a roughly linear dependence of log k on the Cl number is recovered if one considers only PCBs with no ortho substitutions or only PCBs with one ortho substitution (Figure 5B).
Dioxin-like PCBs are the most acutely toxic PCB congeners owing to their interaction with the aryl hydrocarbon receptor [14]. One of the necessary characteristics of dioxin-like PCBs is having at most one ortho substitution, which makes them able to adopt coplanar conformations. Hence, the simulations predicted especially strong adsorption of dioxin-like PCBs to ZnO NPs, with PCBs 169 and 126 exhibiting the greatest log k values of any of the 26 PCBs or aromatic organochlorines considered. These two PCBs are considered the most toxic congeners, as they have toxic equivalence factors relative to TCDD of 0.03 and 0.1 [14,84]. Hence, it seems that materials such as ZnO NPs might be able to selectively sequester the most toxic PCB congeners.
The experiments were also used to probe the effects of the ZnO particle size, the ZnO particle concentration, the aromatic organochlorine concentration, and a phosphate buffer solution. The log k values increased with decreasing particle diameter, as expected; however, these values scaled more rapidly with diameter than would be expected for homogeneous spherical particles, suggesting differences in nanoscale structure or surface chemistry among the particles of different sizes used in the experiments. A plausible explanation is that the smaller ZnO NPs are more porous than the larger NPs. Experiments with different concentrations of the organochlorine compound suggested that the experiments were performed in the dilute regime, where interactions between co-adsorbed compounds were negligible. We found a decrease in log k with increasing ZnO NP concentration, suggesting some aggregation of the NPs at higher concentrations. In comparison to the pure water, the 0.1× PBS solution was associated with lower log k values.
Optimal materials for remediation and contaminant sequestration must have much higher affinity for the target contaminants than the medium from which they are to be extracted. To get some idea of how nanomaterials such as ZnO NPs might perform in these applications, we compared sorption of the organochlorines in soil to that on 14 nm ZnO NPs. The ZnO NPs possessed PCB log k values exceeding those of soil by 5.4 to 7.6 orders of magnitude, suggesting that gram quantities of ZnO NPs might be able to sequester the PCB content of tons of soil in the limit of dilute PCB concentrations. However, the performance of the ZnO NPs in natural waters might be significantly reduced due to fouling by natural organic matter and other soluble species. Optimizing the selectivity of the NPs to reduce fouling will be addressed in future work.

Supplementary Materials

The following are available at https://www.mdpi.com/article/10.3390/pr9101764/s1: Supplementary methods for optimization of the ZnO parameters used in the simulation; Table S1: Physicochemical characterization of the ZnO particles used in this study; Table S2: Optimized GC/MS/MS parameters; Table S3: Qualifier and quantifier MRM transitions and optimum parameters for the aromatic organochlorines; Table S4: Limits of quantification and linear ranges of the aromatic organochlorides; Figure S1: Representative MRM spectrum of the aromatic organochlorides; Figure S2: Convergence of the free energy calculations; Figure S3: Differences between free energy profiles for chlorobenzene isomers and associated uncertainties; Figure S4: Contribution of Cl atoms of the aromatic organochlorides to their interaction with ZnO NPs at different nanoparticle concentrations; Data S1: The adsorption coefficients determined from both the experiments and simulations; Data S2: Simulation input files needed to run the free-energy calculations in NAMD for selected PCBs.

Author Contributions

Conceptualization, J.E.R. and J.C.; methodology, Y.Z., R.C., J.E.R. and J.C.; software, J.C.; validation, Y.Z. and J.C.; investigation, Y.Z., R.C., J.E.R. and J.C.; writing—original draft preparation, Y.Z., R.C., J.E.R. and J.C.; writing—review and editing, Y.Z. and J.C.; visualization, J.C.; supervision, J.E.R. and J.C.; project administration, J.E.R. and J.C.; funding acquisition, J.E.R. and J.C. All authors have read and agreed to the published version of the manuscript.

Funding

This work was partially supported by the Kansas Bioscience Authority funds to the Institute of Computational Comparative Medicine (ICCM) and to the Nanotechnology Innovation Center of Kansas State University (NICKS). The computing for this project was performed on the Beocat Research Cluster at Kansas State University, which is funded in part by NSF grants CHE-1726332, CNS-1006860, EPS-1006860, and EPS-0919443.

Data Availability Statement

The adsorption coefficients determined from both the experiments and simulations are included in the Supplementary Information. The simulation input files needed to run free-energy calculations in NAMD for selected PCBs are also included.

Conflicts of Interest

The authors declare no conflict of interest.

References

  1. Pirsaheb, M.; Limoee, M.; Namdari, F.; Khamutian, R. Organochlorine pesticides residue in breast milk: A systematic review. Med. J. Islam. Repub. Iran 2015, 29, 228. [Google Scholar] [PubMed]
  2. Saravi, S.S.S.; Dehpour, A.R. Potential role of organochlorine pesticides in the pathogenesis of neurodevelopmental, neurodegenerative, and neurobehavioral disorders: A review. Life Sci. 2016, 45, 255–264. [Google Scholar] [CrossRef] [PubMed]
  3. Brown, K.W.; Minegishi, T.; Cummiskey, C.C.; Fragala, M.A.; Hartman, R.; MacIntosh, D.L. PCB remediation in schools: A review. Environ. Sci. Pollut. Res. 2016, 23, 1986–1997. [Google Scholar] [CrossRef] [PubMed]
  4. Jaacks, L.M.; Staimez, L.R. Association of persistent organic pollutants and non-persistent pesticides with diabetes and diabetes-related health outcomes in Asia: A systematic review. Environ. Int. 2015, 76, 57–70. [Google Scholar] [CrossRef] [PubMed]
  5. Park, J.H.; Cha, E.S.; Ko, Y.H.; Wang, M.S.; Hong, J.H.; Lee, W.J. Exposure to Dichlorodiphenyltrichloroethane and the Risk of Breast Cancer: A Systematic Review and Meta-analysis. Osong Public Health Res. Perspect. 2014, 5, 77–84. [Google Scholar] [CrossRef] [Green Version]
  6. Nadal, M.; Marquès, M.; Mari, M.; Domingo, J.L. Climate change and environmental concentrations of POPs: A review. Environ. Res. 2015, 143, 177–185. [Google Scholar] [CrossRef]
  7. Mostafalou, S. Persistent Organic Pollutants and Concern Over the Link with Insulin Resistance Related Metabolic Diseases. Rev. Environ. Contam. Toxicol. 2016, 238, 69–89. [Google Scholar]
  8. Beyer, A.; Biziuk, M. Environmental fate and global distribution of polychlorinated biphenyls. Rev. Environ. Contam. Toxicol. 2009, 201, 137–158. [Google Scholar]
  9. Katagi, T. Bioconcentration, bioaccumulation, and metabolism of pesticides in aquatic organisms. In Reviews of Environmental Contamination and Toxicology; Springer: Berlin, Germany, 2010; pp. 1–132. [Google Scholar]
  10. Tsuji, M.; Kawamoto, T.; Koriyama, C.; Yamamoto, M.; Tsuchiya, T.; Matsumura, F. Association of PCBs and allergies in children. Pestic. Biochem. Physiol. 2015, 120, 21–26. [Google Scholar] [CrossRef]
  11. Zani, C.; Toninelli, G.; Filisetti, B.; Donato, F. Polychlorinated biphenyls and cancer: An epidemiological assessment. J. Environ. Sci. Health Part C 2013, 31, 99–144. [Google Scholar] [CrossRef]
  12. Van den Berg, M.; Birnbaum, L.; Bosveld, A.; Brunström, B.; Cook, P.; Feeley, M.; Giesy, J.P.; Hanberg, A.; Hasegawa, R.; Kennedy, S.W.; et al. Toxic Equivalency Factors (TEFs) for PCBs, PCDDs, PCDFs for Humans and Wildlife. Environ. Health Perspect. 1998, 106, 775. [Google Scholar] [CrossRef]
  13. Silkworth, J.B.; Grabstein, E.M. Polychlorinated Biphenyl Immunotoxicity: Dependence on Isomer Planarity and the Ah Gene Complex. Toxicol. Appl. Pharmacol. 1982, 65, 109–115. [Google Scholar] [CrossRef]
  14. Zhang, W.; Sargis, R.M.; Volden, P.A.; Carmean, C.M.; Sun, X.J.; Brady, M.J. PCB 126 and Other Dioxin-like PCBs Specifically Suppress Hepatic PEPCK Expression via the Aryl Hydrocarbon Receptor. PLoS ONE 2012, 7, e37103. [Google Scholar] [CrossRef] [Green Version]
  15. Fischer, L.J.; Seegal, R.F.; Ganey, P.E.; Pessah, I.N.; Kodavanti, P.R.S. Symposium Overview: Toxicity of Non-coplanar PCBs. Toxicol. Sci. 1998, 41, 49–61. [Google Scholar]
  16. Gafni, J.; Wong, P.W.; Pessah, I.N. Non-coplanar 2,2,3,5,6-pentachlorobiphenyl (PCB 95) Amplifies Ionotropic Glutamate Receptor Signaling in Embryonic Cerebellar Granule Neurons by a Mechanism Involving Ryanodine Receptors. Toxicol. Sci. 2004, 77, 72–82. [Google Scholar] [CrossRef] [Green Version]
  17. Elnar, A.A.; Desor, F.; Marin, F.; Soulimani, R.; Nemos, C. Lactational Exposure to Low Levels of the Six Indicator Non-dioxin-like Polychlorinated Biphenyls Induces DNA Damage and Repression of Neuronal Activity, in Juvenile Male Mice. Toxicology 2015, 328, 57–65. [Google Scholar] [CrossRef]
  18. Mohan, D.; Sarswat, A.; Ok, Y.S.; Pittman, C.U. Organic and inorganic contaminants removal from water with biochar, a renewable, low cost and sustainable adsorbent—A critical review. Bioresour. Technol. 2014, 160, 191–202. [Google Scholar] [CrossRef]
  19. El Bakouri, H.; Usero, J.; Morillo, J.; Rojas, R.; Ouassini, A. Drin pesticides removal from aqueous solutions using acid-treated date stones. Bioresour. Technol. 2009, 100, 2676–2684. [Google Scholar] [CrossRef]
  20. Perrard, A.; Descorme, C. Static and dynamic adsorption studies of PolyChloroBiphenyls (PCBs) over activated carbons. Chemosphere 2016, 145, 528–534. [Google Scholar] [CrossRef]
  21. Chys, M.; Depuydt, V.; Boeckaert, C.; Hulle, S.W.V. Treatment of rainwater runoff in recovery and recycling companies: Lab and pilot-scale testing. J. Environ. Sci. Health Part A 2013, 48, 446–452. [Google Scholar] [CrossRef]
  22. Amin, M.T.; Alazba, A.A.; Manzoor, U. A Review of Removal of Pollutants from Water/Wastewater Using Different Types of Nanomaterials. Adv. Mater. Sci. Eng. 2014, 2014, 825910. [Google Scholar] [CrossRef] [Green Version]
  23. Mohmood, I.; Lopes, C.B.; Lopes, I.; Ahmad, I.; Duarte, A.C.; Pereira, E. Nanoscale materials and their use in water contaminants removal-a review. Environ. Sci. Pollut. Res. 2013, 20, 1239–1260. [Google Scholar] [CrossRef]
  24. Taka, A.L.; Pillay, K.; Mbianda, X.Y. Nanosponge cyclodextrin polyurethanes and their modification with nanomaterials for the removal of pollutants from waste water: A review. Carbohydr. Polym. 2017, 159, 94–107. [Google Scholar] [CrossRef]
  25. Bootharaju, M.S.; Pradeep, T. Understanding the Degradation Pathway of the Pesticide, Chlorpyrifos by Noble Metal Nanoparticles. Langmuir 2012, 28, 2671–2679. [Google Scholar] [CrossRef]
  26. Vasimalai, N.; Abraham, J.S. Biopolymer capped silver nanoparticles as fluorophore for ultrasensitive and selective determination of malathion. Talanta 2013, 115, 24–31. [Google Scholar] [CrossRef]
  27. Manimegalai, G.; Shanthakumar, S.; Sharma, C. Silver Nanoparticles: Synthesis and Application in Mineralization of Pesticides Using Membrane Support. Int. Nano Lett. 2014, 4, 105. [Google Scholar] [CrossRef] [Green Version]
  28. Basahel, S.N.; Ali, T.T.; Mokhtar, M.; Narasimharao, K. Influence of Crystal Structure of Nanosized ZrO2 on Photocatalytic Degradation of Methyl Orange. Nanoscale Res. 2015, 10, 73. [Google Scholar] [CrossRef] [Green Version]
  29. Barakat, N.A.M.; Nassar, M.M.; Farrag, T.E.; Mahmoud, M.S. Effective Photodegradation of Methomyl Pesticide in Concentrated Solutions by Novel Enhancement of the Photocatalytic Activity of TiO2 Using CdSO4 Nanoparticles. Environ. Sci. Pollut. Res. 2013, 21, 1425–1435. [Google Scholar] [CrossRef]
  30. Sirelkhatim, A.; Mahmud, S.; Seeni, A.; Kaus, N.H.M.; Ann, L.C.; Bakhori, S.K.M.; Hasan, H.; Mohamad, D. Review on Zinc Oxide Nanoparticles: Antibacterial Activity and Toxicity Mechanism. Nano-Micro Lett. 2015, 7, 219–242. [Google Scholar] [CrossRef] [Green Version]
  31. Reynolds, D.C.; Look, D.C.; Jogai, B.; Litton, C.W.; Cantwell, G.; Harsch, W.C. Valence-band ordering in ZnO. Phys. Rev. B 1999, 60, 2340–2344. [Google Scholar] [CrossRef] [Green Version]
  32. Janotti, A.; de Walle, C.G.V. Fundamentals of zinc oxide as a semiconductor. Rep. Prog. Phys. 2009, 72, 126501. [Google Scholar] [CrossRef] [Green Version]
  33. Lee, K.M.; Lai, C.W.; Ngai, K.S.; Juan, J.C. Recent developments of zinc oxide based photocatalyst in water treatment technology: A review. Water Res. 2016, 88, 428–448. [Google Scholar] [CrossRef] [PubMed]
  34. Chiou, C.T.; Porter, P.E.; Schmedding, D.W. Partition Equilibriums of Nonionic Organic Compounds between Soil Organic Matter and Water. Environ. Sci. Technol. 1983, 17, 227–231. [Google Scholar] [CrossRef] [PubMed]
  35. Cornelissen, G.; van Noort, P.C.; Govers, H.A. Desorption Kinetics of Chlorobenzenes, Polycyclic Aromatic Hydrocarbons, and Polychlorinated Biphenyls: Sediment Extraction with Tenax® and Effects of Contact Time and Solute Hydrophobicity. Environ. Toxicol. Chem. 1997, 16, 1351–1357. [Google Scholar] [CrossRef]
  36. Uzgiris, E.E.; Edelstein, W.A.; Philipp, H.R.; Iben, I.T. Complex Thermal Desorption of PCBs from Soil. Chemosphere 1995, 30, 377–387. [Google Scholar] [CrossRef]
  37. Nguyen, T.H.; Goss, K.U.; Ball, W.P. Polyparameter Linear Free Energy Relationships for Estimating the Equilibrium Partition of Organic Compounds between Water and the Natural Organic Matter in Soils and Sediments. Environ. Sci. Technol. 2005, 39, 913–924. [Google Scholar] [CrossRef]
  38. Xia, X.R.; Monteiro-Riviere, N.A.; Riviere, J.E. An Index for Characterization of Nanomaterials in Biological Systems. Nature Nanotech. 2010, 5, 671–675. [Google Scholar] [CrossRef]
  39. Xia, X.R.; Monteiro-Riviere, N.A.; Mathur, S.; Song, X.; Xiao, L.; Oldenberg, S.J.; Fadeel, B.; Riviere, J.E. Mapping the Surface Adsorption Forces of Nanomaterials in Biological Systems. ACS Nano 2011, 5, 9074–9081. [Google Scholar] [CrossRef] [Green Version]
  40. Chen, R.; Zhang, Y.; Darabi Sahneh, F.; Scoglio, C.M.; Wohlleben, W.; Haase, A.; Monteiro-Riviere, N.A.; Riviere, J.E. Nanoparticle Surface Characterization and Clustering through Concentration-Dependent Surface Adsorption Modeling. ACS Nano 2014, 8, 9446–9456. [Google Scholar] [CrossRef]
  41. Endo, S.; Goss, K.U. Applications of Polyparameter Linear Free Energy Relationships in Environmental Chemistry. Environ. Sci. Technol. 2014, 48, 12477–12491. [Google Scholar] [CrossRef]
  42. Chen, R.; Zhang, Y.; Monteiro-Riviere, N.A.; Riviere, J.E. Quantification of Nanoparticle Pesticide Adsorption: Computational Approaches Based on Experimental Data. Nanotoxicology 2016, 10, 1118–1128. [Google Scholar] [CrossRef]
  43. Abraham, M.H. Scales of Solute Hydrogen-bonding: Their Construction and Application to Physicochemical and Biochemical Processes. Chem. Soc. Rev. 1993, 22, 73–83. [Google Scholar] [CrossRef]
  44. Famini, G.R.; Wilson, L.Y. Using Theoretical Descriptors in Linear Free Energy Relationships: Characterizing Several Polarity, Acid and Basicity Scales. J. Phys. Org. Chem. 1999, 12, 645–653. [Google Scholar] [CrossRef]
  45. Comer, J.; Chen, R.; Poblete, H.; Vergara-Jaque, A.; Riviere, J.E. Predicting Adsorption Affinities of Small Molecules on Carbon Nanotubes Using Molecular Dynamics Simulation. ACS Nano 2015, 9, 11761–11774. [Google Scholar] [CrossRef] [Green Version]
  46. Poblete, H.; Miranda-Carvajal, I.; Comer, J. Determinants of Alanine Dipeptide Conformational Equilibria on Graphene and Hydroxylated Derivatives. J. Phys. Chem. B 2017, 121, 3895–3907. [Google Scholar] [CrossRef] [Green Version]
  47. Wang, Y.; Comer, J.; Chen, Z.; Chen, J.; Gumbart, J.C. Exploring Adsorption of Neutral Aromatic Pollutants onto Graphene Nanomaterials via Molecular Dynamics Simulations and Theoretical Linear Solvation Energy Relationships. Environ. Sci. Nano 2018, 5, 2117–2128. [Google Scholar] [CrossRef]
  48. Azhagiya Singam, E.R.; Zhang, Y.; Magnin, G.; Miranda-Carvajal, I.; Coates, L.; Thakkar, R.; Poblete, H.; Comer, J. Thermodynamics of Adsorption to Graphenic Surfaces from Aqueous Solution. J. Chem. Theory Comput. 2019, 15, 1302–1316. [Google Scholar] [CrossRef] [Green Version]
  49. Banks, M.; Schwab, A.; Henderson, C. Leaching and Reduction of Chromium in Soil as Affected by Soil Organic Content and Plants. Chemosphere 2006, 62, 255–264. [Google Scholar] [CrossRef]
  50. Yang, Y.; Hawthorne, S.B.; Miller, D.J.; Liu, Y.; Lee, M.L. Adsorption Versus Absorption of Polychlorinated Biphenyls onto Solid-phase Microextraction Coatings. Anal. Chem. 1998, 70, 1866–1869. [Google Scholar] [CrossRef]
  51. Vanommeslaeghe, K.; Hatcher, E.; Acharya, C.; Kundu, S.; Zhong, S.; Shim, J.; Darian, E.; Guvench, O.; Lopes, P.; Vorobyov, I.; et al. CHARMM General Force Field: A Force Field for Drug-like Molecules Compatible with the CHARMM All-atom Additive Biological Force Fields. J. Comput. Chem. 2010, 31, 671–690. [Google Scholar] [CrossRef] [Green Version]
  52. Vanommeslaeghe, K.; MacKerell, A.D., Jr. Automation of the CHARMM General Force Field (CGenFF) I: Bond Perception and Atom Typing. J. Chem. Inf. Model. 2012, 52, 3144–3154. [Google Scholar] [CrossRef]
  53. Vanommeslaeghe, K.; Raman, E.P.; MacKerell, A.D., Jr. Automation of the CHARMM General Force Field (CGenFF) II: Assignment of Bonded Parameters and Partial Atomic Charges. J. Chem. Inf. Model. 2012, 52, 3155–3168. [Google Scholar] [CrossRef] [Green Version]
  54. Ballschmiter, K.; Bacher, R.; Mennel, A.; Fischer, R.; Riehle, U.; Swerev, M. The Determination of Chlorinated Biphenyls, Chlorinated Dibenzodioxins, and Chlorinated Dibenzofurans by GC-MS. J. High Resolut. Chromatogr. 1992, 15, 260–270. [Google Scholar] [CrossRef]
  55. Raymand, D.; van Duin, A.C.; Baudin, M.; Hermansson, K. A Reactive Force Field (ReaxFF) for Zinc Oxide. Surf. Sci. 2008, 602, 1020–1031. [Google Scholar] [CrossRef]
  56. Phillips, J.C.; Braun, R.; Wang, W.; Gumbart, J.; Tajkhorshid, E.; Villa, E.; Chipot, C.; Skeel, R.D.; Kale, L.; Schulten, K. Scalable Molecular Dynamics with NAMD. J. Comput. Chem. 2005, 26, 1781–1802. [Google Scholar] [CrossRef] [Green Version]
  57. Feller, S.E.; Zhang, Y.H.; Pastor, R.W.; Brooks, B.R. Constant Pressure Molecular Dynamics Simulations—The Langevin Piston Method. J. Chem. Phys. 1995, 103, 4613–4621. [Google Scholar] [CrossRef]
  58. Darden, T.A.; York, D.M.; Pedersen, L.G. Particle Mesh Ewald: An NlogN Method for Ewald Sums in Large Systems. J. Chem. Phys. 1993, 98, 10089–10092. [Google Scholar] [CrossRef] [Green Version]
  59. Hopkins, C.W.; Le Grand, S.; Walker, R.C.; Roitberg, A.E. Long-time-step Molecular Dynamics through Hydrogen Mass Repartitioning. J. Chem. Theory Comput. 2015, 11, 1864–1874. [Google Scholar] [CrossRef]
  60. Jorgensen, W.L.; Chandrasekhar, J.; Madura, J.D.; Impey, R.W.; Klein, M.L. Comparison of Simple Potential Functions for Simulating Liquid Water. J. Chem. Phys. 1983, 79, 926–935. [Google Scholar] [CrossRef]
  61. Darve, E.; Pohorille, A. Calculating Free Energies Using Average Force. J. Chem. Phys. 2001, 115, 9169–9183. [Google Scholar] [CrossRef] [Green Version]
  62. Comer, J.; Gumbart, J.C.; Hénin, J.; Lelièvre, T.; Pohorille, A.; Chipot, C. The Adaptive Biasing Force Method: Everything You Always Wanted to Know But Were Afraid to Ask. J. Phys. Chem. B 2015, 119, 1129–1151. [Google Scholar] [CrossRef] [PubMed] [Green Version]
  63. Banerjee, S.; Yalkowsky, S.H.; Valvani, C. Water Solubility and Octanol/water Partition Coefficients of Organics. Limitations of the Solubility-partition Coefficient Correlation. Environ. Sci. Technol. 1980, 14, 1227–1229. [Google Scholar] [CrossRef]
  64. Bahadur, N.P.; Shiu, W.Y.; Boocock, D.G.; Mackay, D. Temperature Dependence of Octanol-Water Partition Coefficient for Selected Chlorobenzenes. J. Chem. Eng. Data 1997, 42, 685–688. [Google Scholar] [CrossRef]
  65. Williams, J.W.; Krchma, I.J. The Dielectric Constants of Binary Mixtures. J. Am. Chem. Soc. 1926, 48, 1888–1896. [Google Scholar] [CrossRef]
  66. Dimitriu, M.; Ivan, L.M.; Dorohoi, D.O. Electro-optical Parameters of Some Chlorobenzene Derivatives Obtained from the Molecular Orbital Calculation. Rom. J. Phys 2008, 53, 79–84. [Google Scholar]
  67. Miller, M.M.; Ghodbane, S.; Wasik, S.P.; Tewari, Y.B.; Martire, D.E. Aqueous Solubilities, Octanol Water Partition Coefficients, and Entropies of Melting of Chlorinated Benzenes and Biphenyls. J. Chem. Eng. Data 1984, 29, 184–190. [Google Scholar] [CrossRef]
  68. Hawker, D.W.; Connell, D.W. Octanol-water Partition Coefficients of Polychlorinated Biphenyl Congeners. Environ. Sci. Technol. 1988, 22, 382–387. [Google Scholar] [CrossRef]
  69. Almenningen, A.; Bastiansen, O.; Fernholt, L.; Cyvin, B.N.; Cyvin, S.J.; Samdal, S. Structure and Barrier of Internal Rotation of Biphenyl Derivatives in the Gaseous State: Part 1. The Molecular Structure and Normal Coordinate Analysis of Normal Biphenyl and Pedeuterated Biphenyl. J. Mol. Struct. 1985, 128, 59–76. [Google Scholar] [CrossRef]
  70. Grein, F. Twist Angles and Rotational Energy Barriers of Biphenyl and Substituted Biphenyls. J. Phys. Chem. A 2002, 106, 3823–3827. [Google Scholar] [CrossRef]
  71. Romming, C.; Seip, H.; Oymo, I. Structure of Gaseous and Crystalline 2,2–dichlorobiphenyl. Acta Chem. Scand. A 1974, 28, 507–514. [Google Scholar] [CrossRef] [Green Version]
  72. US Environmental Protection Agency (EPA). Recommended Toxicity Equivalence Factors (TEFs) for Human Health Risk Assessments of 2,3,7,8-Tetrachlorodibenzo-p-dioxin and Dioxin-like Compounds (EPA/600/R-10/005); Risk Assessment Forum: Washington, DC, USA, 2010; pp. 13–14.
  73. Lai, L.; Irene, E. Area Evaluation of Microscopically Rough Surfaces. J. Vac. Sci. Technol. B 1999, 17, 33–39. [Google Scholar] [CrossRef]
  74. Zhang, Y.; Chen, Y.S.P.; Westerhoff, K.; Hristovski, J.C.C. Stability of commercial metal oxide nanoparticles in water. Water Res. 2008, 42, 2204–2212. [Google Scholar] [CrossRef]
  75. Zhang, Y.; Chen, Y.S.P.; Westerhoff, J.C.C. Impact of natural organic matter and divalent cations on the stability of aqueous nanoparticles. Water Res. 2009, 43, 4249–4257. [Google Scholar] [CrossRef]
  76. French, R.A.; Jacobson, A.R.; Kim, B.; Isley, S.L.; Penn, R.L.; Baveye, P.C. Influence of ionic strength, pH, and cation valence on aggregation kinetics of titanium dioxide nanoparticles. Environ. Sci. Technol. 2009, 43, 1354–1359. [Google Scholar] [CrossRef]
  77. Mudunkotuwa, I.A.; Rupasinghe, T.; Wu, C.M.; Grassian, V.H. Dissolution of ZnO nanoparticles at circumneutral pH: A study of size effects in the presence and absence of citric acid. Langmuir 2012, 28, 396–403. [Google Scholar] [CrossRef]
  78. Zhou, D.; Keller, A.A. Role of morphology in the aggregation kinetics of ZnO nanoparticles. Water Res. 2010, 44, 2948–2956. [Google Scholar] [CrossRef]
  79. Cupi, D.; Hartmann, N.B.; Baun, A. Influence of pH and media composition on suspension stability of silver, zinc oxide, and titanium dioxide nanoparticles and immobilization of Daphnia magna under guideline testing conditions. Ecotoxicol. Environ. Saf. 2016, 127, 144–152. [Google Scholar] [CrossRef]
  80. Omar, F.M.; Aziz, H.A.; Stoll, S. Aggregation and disaggregation of ZnO nanoparticles: Influence of pH and adsorption of Suwannee River humic acid. Sci. Total Environ. 2014, 468, 195–201. [Google Scholar] [CrossRef]
  81. Peng, Y.H.; Tso, C.P.; Tsai, Y.C.; Zhuang, C.M.; Shih, Y.H. The effect of electrolytes on the aggregation kinetics of three different ZnO nanoparticles in water. Sci. Total Environ. 2015, 530, 183–190. [Google Scholar] [CrossRef]
  82. DeLong, R.K.; Mitchell, J.A.; Morris, R.T.; Comer, J.; Hurst, M.N.; Ghosh, K.; Wanekaya, A.; Mudge, M.; Schaeffer, A.; Washington, L.L.; et al. Enzyme and Cancer Cell Selectivity of Nanoparticles: Inhibition of 3-D Metastatic Phenotype and Experimental Melanoma by Zinc Oxide. J. Biomed. Nanotechnol. 2017, 13, 221–231. [Google Scholar] [CrossRef]
  83. Bian, S.W.; Mudunkotuwa, I.A.; Rupasinghe, T.; Grassian, V.H. Aggregation and dissolution of 4 nm ZnO nanoparticles in aqueous environments: Influence of pH, ionic strength, size, and adsorption of humic acid. Langmuir 2011, 27, 6059–6068. [Google Scholar] [CrossRef]
  84. Ahlborg, U.G.; Becking, G.; Birnbaum, L.; Brouwer, A.A.; Derks, H.; Feeley, M.; Golor, G.; Hanberg, A.; Larsen, J.; Liem, A.; et al. Toxic equivalency factors for dioxin-like PCBs: Report on WHO-ECEH and IPCS consultation, December 1993. Chemosphere 1994, 28, 1049–1067. [Google Scholar] [CrossRef]
Figure 1. Two-dimensional structural diagrams of the PCBs included in the experiments. Non-ortho and ortho substitutions are indicated for the monochloro and dichloro congeners.
Processes 09 01764 g001
Figure 2. Exemplary model of a simulation system, including an effectively infinite ZnO slab, an organochlorine molecule, and water. Atom color scheme: H, white; C, dark green; O, red; Cl, bright green; Zn, gray. Although the simulations included explicit water molecules, for clarity, water is shown as a transparent blue surface.
Processes 09 01764 g002
Figure 3. Contribution of the numbers of chlorine atoms of aromatic organochlorines to their adsorption coefficients ( log k ) on ZnO NPs as determined by GC/MS/MS. The concentration of ZnO NPs was 0.8 mg/L and the concentration of the aromatic organochlorines was 0.05 mg/L. (A) Adsorption coefficients of chlorobenzene, 1,4-dichlorobenzene, 1,3,5-trichlorobenzene, 1,2,4,5-tetrachlorobenzene, pentachlorobenzene, and hexachlorobenzne. (B) Adsorption coefficients of biphenyl and 10 ortho-substituted PCBs.
Processes 09 01764 g003
Figure 4. Molecular dynamics simulations of chlorobenzene adsorption on a model ZnO surface. (A) Comparison of adsorption coefficients determined from the experiment and predicted from the simulation. (B) Simulation-derived free energy as a function of distance between each chlorobenzene molecule and model ZnO surface. Compound names shown in boldface were those considered in the experiments and are plotted in panel A. While isomers with the same chlorine number had similar free energy profiles, we calculated small ( < 0.4 kcal/mol) but statistically significant differences. Zoomed-in plots of the free-energy minima, including error bars, can be found in Figure S3 of the Supplementary Information.
Processes 09 01764 g004
Figure 5. Molecular dynamics simulations of PCB adsorption on a model ZnO surface. (A) Comparison of adsorption coefficients determined from the experiment and calculated from the simulations. (*) PCB 192 has its two chloro substitutions on the same phenyl group (2,6). All other PCBs with #ortho = 2 considered here have one chloro substitution on each phenyl group (2,2 ). (B) Simulation-derived adsorption coefficients for a range of PCBs marked with symbols indicating the number of ortho substitutions. (†) Dioxin-like PCBs. This plot includes all of the simulation data in panel A as well as many additional points with different numbers of ortho substitutions. (C) Simulation-derived free energies as a function of distance between a model ZnO surface and select tetrachlorobiphenyls with different numbers of ortho substitutions.
Processes 09 01764 g005
Figure 6. Twist angle distributions of two pentachlorobiphenyls, PCB 91 (tri-ortho-substituted) and PCB 126 (no ortho substitutions, dioxin-like). Simulation snapshot of PCB 91 (A) and PCB 126 (B) adsorbed to the model ZnO surface. For clarity, water molecules are not shown. Distribution of the angle between the two phenyl groups for PCB 91 (C) and PCB 126 (D). The distributions are derived from simulations with each PCB in pure water or adsorbed to the model ZnO surface.
Processes 09 01764 g006
Figure 7. Effect of the ZnO particle size on adsorption coefficients of aromatic organochlorines. Adsorption coefficients for chlorobenzene (A) or PCB (B) adsorption on ZnO particles with average diameters of 14, 80, 1000 nm. Adsorption coefficients for adsorption of chlorobenzenes (C) or PCBs (D) normalized to represent 80 nm particles assuming a spherical geometry.
Processes 09 01764 g007
Figure 8. Effect of the concentrations of aromatic organochlorines on their adsorption onto ZnO NPs. Adsorption coefficients of chlorobenzenes at concentrations of 0.01 and 0.05 mg/L with a concentration of ZnO NPs of 0.1 mg/L (A) or 0.2 mg/L (B). Adsorption coefficients of PCBs at concentrations of 0.01 and 0.05 mg/L with a concentration of ZnO NPs of 0.1 mg/L (C) or 0.2 mg/L (D).
Processes 09 01764 g008
Figure 9. Effect of the concentration of ZnO NPs on adsorption for aromatic organochlorines. Concentrations of ZnO NP from 0.1 to 1 mg/L. (A) Chlorobenzene concentration at 0.01 mg/L, adsorption coefficients for chlorobenzenes from 1 Cl atom ( log k 1 ) to 6 Cl atoms ( log k 6 ). (B) Chlorobenzene concentration at 0.05 mg/L, adsorption coefficients for chlorobenzenes from 1 Cl atom ( log k 1 ) to 6 Cl atoms ( log k 6 ). (C) PCB concentration at 0.01 mg/L, adsorption coefficients for PCBs from from 1 Cl atom ( log k 1 ) to 10 Cl atoms ( log k 10 ). (D) PCB concentration at 0.05 mg/L, adsorption coefficients for PCBs from from 1 Cl atom ( log k 1 ) to 10 Cl atoms ( log k 10 ).
Processes 09 01764 g009
Figure 10. Effect of pH and ionic strength on the interaction of ZnO NPs and aromatic organochlorines. (A) Adsorption coefficients for chlorobenzene adsorption to ZnO NPs in HPLC water or 0.1× PBS. (B) Adsorption coefficients for PCB adsorption to ZnO NPs in HPLC water or 0.1× PBS. Solute concentrations were 0.01 mg/L and ZnO NP concentrations were 0.5 mg/L.
Processes 09 01764 g010
Figure 11. Comparison of adsorption coefficients on 14 nm ZnO NPs and a sample of soil. (A) Adsorption coefficients for chlorobenzene adsorption. (B) Adsorption coefficients for PCB adsorption.
Processes 09 01764 g011
Table 1. PCBs considered in this work. (*) PCBs tested in the experiments. ( ) Dioxin-like PCBs. PCB numbers are assigned according to the standard scheme of Ballschmiter et al. [54] The number of chlorine atoms and the number of ortho-substituted chlorine atoms are given for each compound. Structures are shown in Figure 1.
PCBCompound Prefix#Cl#ortho
0biphenyl *00
12-chloro *11
23-chloro10
42,2 -dichloro12
52,3-dichloro *21
113,3 -dichloro20
312,4 ,5-trichloro *31
353,3 ,4-trichloro30
472,2 ,4,4 -tetrachloro *42
512,2 ,4,6 -tetrachloro43
542,2 ,6,6 -tetrachloro44
662,3 ,4,4 -tetrachloro41
773,3 ,4,4 -tetrachloro  40
912,2 ,3,4 ,6-pentachloro *53
1052,3,3 ,4,4 -pentachloro  51
1263,3 ,4,4 ,5-pentachloro  50
1542,2 ,4,4 ,5,6 -hexachloro *63
1572,3,3 ,4,4 ,5 -hexachloro  61
1693,3 ,4,4 ,5,5 -hexachloro  60
1892,3,3 ,4,4 ,5,5 -heptachloro  71
1922,3,3 ,4,5,5 ,6-heptachloro *72
1942,2 ,3,3 ,4,4 ,5,5 -octachloro82
2042,2 ,3,4,4 ,5,6,6 -octachloro *84
2062,2 ,3,3 ,4,4 ,5,5 ,6-nonachloro93
2072,2 ,3,3 ,4,4 ,5,6,6 -nonachloro *94
209decachloro *104
Table 2. Optimized ZnO model interaction parameters.
Atomq (Elementary) ϵ (kcal/mol) R min (Å)
O−0.150.283.0
Zn−0.150.083.5
Publisher’s Note: MDPI stays neutral with regard to jurisdictional claims in published maps and institutional affiliations.

