Article

Development of Rubber Seed Shell–Activated Carbon Using Impregnated Pyridinium-Based Ionic Liquid for Enhanced CO2 Adsorption

by
Nawwarah Mokti
1,
Azry Borhan
1,2,*,
Siti Nur Azella Zaine
1,3 and
Hayyiratul Fatimah Mohd Zaid
1,3
1
Department of Chemical Engineering, Universiti Teknologi PETRONAS, Seri Iskandar, Perak 32610, Malaysia
2
HICoE, Centre for Biofuel and Biochemical Research, Institute of Self-Sustainable Building, Department of Chemical Engineering, Universiti Teknologi PETRONAS, Seri Iskandar, Perak 32610, Malaysia
3
Centre of Innovative Nanostructures & Nanodevices, Universiti Teknologi PETRONAS, Seri Iskandar, Perak 32610, Malaysia
*
Author to whom correspondence should be addressed.
Processes 2021, 9(7), 1161; https://doi.org/10.3390/pr9071161
Submission received: 31 May 2021 / Revised: 28 June 2021 / Accepted: 1 July 2021 / Published: 4 July 2021
(This article belongs to the Special Issue Novel Adsorbent for Environmental Remediation)

Abstract

:
In this study, rubber seed shell was used for the production of activated carbon by chemical activation using an ionic liquid, [C4Py][Tf2N] as an activating agent. Sample RSS-IL 800 shows the highest specific surface area of 393.99 m2/g, a total pore volume of 0.206 cm3/g, and a micropore volume of 0.172 cm3/g. The performance of AC samples as an adsorbent for CO2 was also studied using a static volumetric technique evaluated at a temperature of 25 °C and 1 bar pressure. The CO2 adsorption capacity for sample RSS-IL 800 was 2.436 mmol/g, comparable with reported data from the previous study. Results also show that the CO2 adsorption capacity decreased at a higher temperature between 50 and 100 °C and increased at elevated pressure due to its exothermic behavior. The Langmuir model fits the adsorption data well, and the isosteric heat of adsorption proved that the physisorption process and exothermic behavior occur.

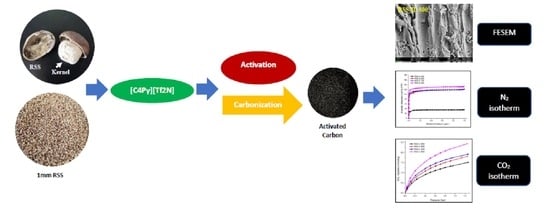
Graphical Abstract

1. Introduction

The increase in carbon dioxide (CO2) levels in the atmosphere has heightened concerns today. The release of CO2 into the atmosphere as a major greenhouse gas can cause global climate change, thereby contributing to the global warming scenario. CO2 concentration in the atmosphere has increased from 280 ppm in 2005 to 400 ppm and is predicted to increase to 500 ppm in 2050. According to the Intergovernmental Panel on Climate Change (IPCC), the global temperature will increase to 1.9 °C by the year 2100, from 0.6 and 1.1 °C, previously. The combustion of fossil fuels and coal has been identified as one of the main contributors to the emission of CO2 to the environment. Thus, carbon capture and storage (CCS) was introduced and implemented in the effort to overcome the problem using post-combustion capture rather than pre-combustion and oxy-fuel methods due to its simple technology. Examples of commonly applied post-combustion techniques include absorption, adsorption, and cryogenic and membrane separation to control the emission of CO2 [1]. Conventionally, the CO2 absorption process utilizing amine-based solvents become the first benchmark and most promising method used in industries due to its high efficiency toward CO2 capture [2]. Among the most common solvents are monoethanolamine (MEA), diethanolamine (DEA), and N-methyl diethanolamine (MDEA). However, this technology has a few disadvantages such as high heat capacity and energy consumption for regeneration, corrosion in equipment used, amine degradation, and foaming, causing environmental pollution [3]. The physical separation process used in cryogenic separation is applied with a high concentration and pressure of CO2 gases. Due to its high capital cost and energy consumption, the process becomes less economically viable and less suitable for use when the CO2 concentration is low. Membrane separation is popular because it performs well when combined with other technologies, but the high cost of operations is the main disadvantage [4].
As the result of current technological limitations, CO2 adsorption using solid adsorbents such as zeolite, porous metal oxides, organic polymer, silica, metal–organic framework (MOF), and activated carbon (AC) is a promising technology as compared to the conventional method. The technology offers high CO2 uptake, high thermal stability, fast kinetics, and ease of regeneration [3,5]. Among the solid adsorbents, AC is considered as an excellent material for CO2 capture because of its unique characteristics such as low cost, broad surface area, highly porous structure, thermal stability, flexibility in alteration of surfaces, and low sensitivity toward moisture [3,6]. Recently, researchers have been attracted to the use of lignocellulosic biomass waste as a precursor in the production of AC due to its unique characteristics such as abundant availability, inexpensiveness, and cost-effectiveness including its environmentally friendly nature as it will minimize the waste produced [3,7]. To date, there are many studies that have used biomass waste as a precursor, e.g., acai stones [7], rubber seed shells (RSS) [8,9], rice straws [10], olive stones [11], coffee grounds [12], nutshells [13], and others [14].
In this study, RSS from the rubber tree plant called Hevea brasiliensis was selected as a precursor in synthesizing AC due to its abundant availability, cheapness, and promising adsorbent capacity [15]. Apart from that, the RSS is made up of about 30–50% of carbon compounds, which makes it a highly porous AC in comparison with the other biomass wastes. Malaysia is the world’s third-largest natural rubber producer, contributing up to 46% of the total world demand after Indonesia and Thailand. According to Malaysian Natural Rubber Statistics, January–June 2020, about 1106.45 (‘000 hectare) of rubber trees planted, equivalent to 239,849 tonnes of rubber produced in Malaysia and about 800–1200 kg per year of RSS discarded as waste products [16]. The huge amount of RSS wastes could lead to contamination and environmental problems in rubber tree plantations. Thus, converting RSS into a value-added product such as AC will help toward zero waste production and reduce the environmental problem. The uses of RSS as a precursor have also been investigated by other researchers, with their main concerns being to minimize the use of the poor disposal method as well as to help rubber tree plantations generate profit by turning RSS into value-added activated carbon products [8,17].
In general, the production of AC from biomass waste involves two stages, which are activation and carbonization. Activation is achievable by two methods, chemical and physical activation. Over these two methods, chemical activation is considered more effective due to its potential to produce a high surface area and a porous structure, thus increasing the adsorption capacity of the activated carbon. The porosity in AC can be generated by impregnating the precursor with activating agents such as potassium hydroxide (KOH), zinc chloride (ZnCl2), sulfuric acid (H3PO4), sodium hydroxide (NaOH), malic acid, etc. before it undergoes the carbonization stage [6,17]. At present, KOH is one of the most utilized chemical agents for AC production due to its potential to produce a well-developed microporous structure with a high surface area and, hence, superior CO2 adsorption. Han et al. [18] reported that sugarcane bagasse AC with KOH as activating agent exhibits a high CO2 uptake of 4.8 mmol/g at 25 °C and 1 bar. Although KOH performed excellently in producing a porous structure and high CO2 uptake, the KOH is hazardous, expensive, and corrosive. Moreover, the use of ZnCl2 as an activating agent has its drawbacks, such as not being environmentally friendly and causing waste disposal problems [19,20]. Thus, a greener, less toxic, non-volatile, recyclable, and environmentally friendly solvent known as the ionic liquid was introduced [21,22].
Ionic liquid (IL) is a room-temperature salt, composed mainly of cations and anions, which are tunable according to the application. Recently, the use of IL in CO2 capture has attracted the researchers’ attention due to its low melting point of below 100 °C, inflammability, good ionic conductivity, negligible vapor pressure, chemical and thermal stability, and functions as a suitable solvent due to its variable polarity [23,24]. Last decades, Blanchard et al. [25] and Anthony et al. [26] were the first to develop the ability of imidazolium-based IL pairing with different anions toward CO2 capture in terms of their solubility. From their findings, the number of fluoro groups in the anion such as Tf2N, PF6, and BF4 plays an important role. It has the most significant impact on CO2 solubility compared to cations such as imidazolium, ammonium, pyrrolidine, and phosphonium [26]. Other than the most studied imidazolium-based IL, pyridinium-based IL also shows promising potential for CO2 capture. Previously, Yunus et al. [27] examined CO2 solubility in pyridinium-based IL. One of the pyridinium-based ILs, 1-butyl pyridinium bis(trifluoro-methylsulfonyl) imide, [C4Py][Tf2N] yielded good performance in CO2 solubility. However, the drawbacks of using IL in CO2 solubility for CO2 capture are the high cost, as a large amount of IL is required, and the high viscosity, which may slow down the mass transfer between the IL and CO2 gases [28].
Additionally, post-modification using basic sites of IL on AC structure has been broadly explored to enhance the CO2 capture. Nevertheless, this method results in pore blockage of AC surfaces [29]. As a result, it is suggested that IL can be used for CO2 capture from a different perspective. To date, the activation using IL as an activating agent in the production of AC has not been widely reported, and this needs to be explored deeper. We used an approach to increase the porosity on the surface of AC and, hence, improve the CO2 adsorption performance. The aim of this research is to produce an efficient and economic porous AC for the CO2 adsorption application. The low concentration of pyridinium-based IL was chosen as the best condition in our recent publication and was also applied in this study [30]. The AC was synthesized at different carbonization temperatures ranging from 500 to 800 °C with a low concentration of [C4Py][Tf2N] IL as an activating agent. The AC samples were then evaluated for their textural properties, surface morphology, and surface chemistry, including CO2 adsorption analysis by using static volumetric analyzer at a temperature of 25 to 100 °C and a pressure of 1 bar. Their isotherm analysis and isosteric heat of adsorption were also evaluated to fully understand the adsorption phenomena. The adsorption analysis of the synthesized AC was compared with the results of other adsorbent materials reported in the previous literature to evaluate the efficiency of the synthesized AC.

2. Materials and Methods

2.1. Materials and Reagents

The RSS (Figure 1) obtained from Institut Pertanian Titi Gantong, Perak, Malaysia, was used as a precursor in preparing the AC. An IL, 1-butylpyridinium bis(trifluoro-methylsulfonyl) imide [C4Py][Tf2N], as an activating agent was prepared following a previously reported method [31]. The chemicals and solvent used in the synthesis of IL are pyridine (109728), 1-bromobutane (801602), and ethyl acetate (109623) were purchased from Merck Germany (Darmstadt, Germany), while lithium bis(trifluoromethanesulfonyl)imide, LiTf2N (544094) was purchased from Sigma Aldrich (Darmstadt, Germany). Ethanol (64-17-5) was purchased from HmbG Chemicals (Hamburg, Germany). All chemicals were utilized without further purification. Purified gases such as nitrogen gas, N2 (99.99%); carbon dioxide, CO2 (99.8%); helium, He (99.99%); and compressed air used in the carbonization and CO2 adsorption studies were obtained from Linde (Malaysia) Sdn. Bhd.

2.2. Preparation and Carbonization of RSS

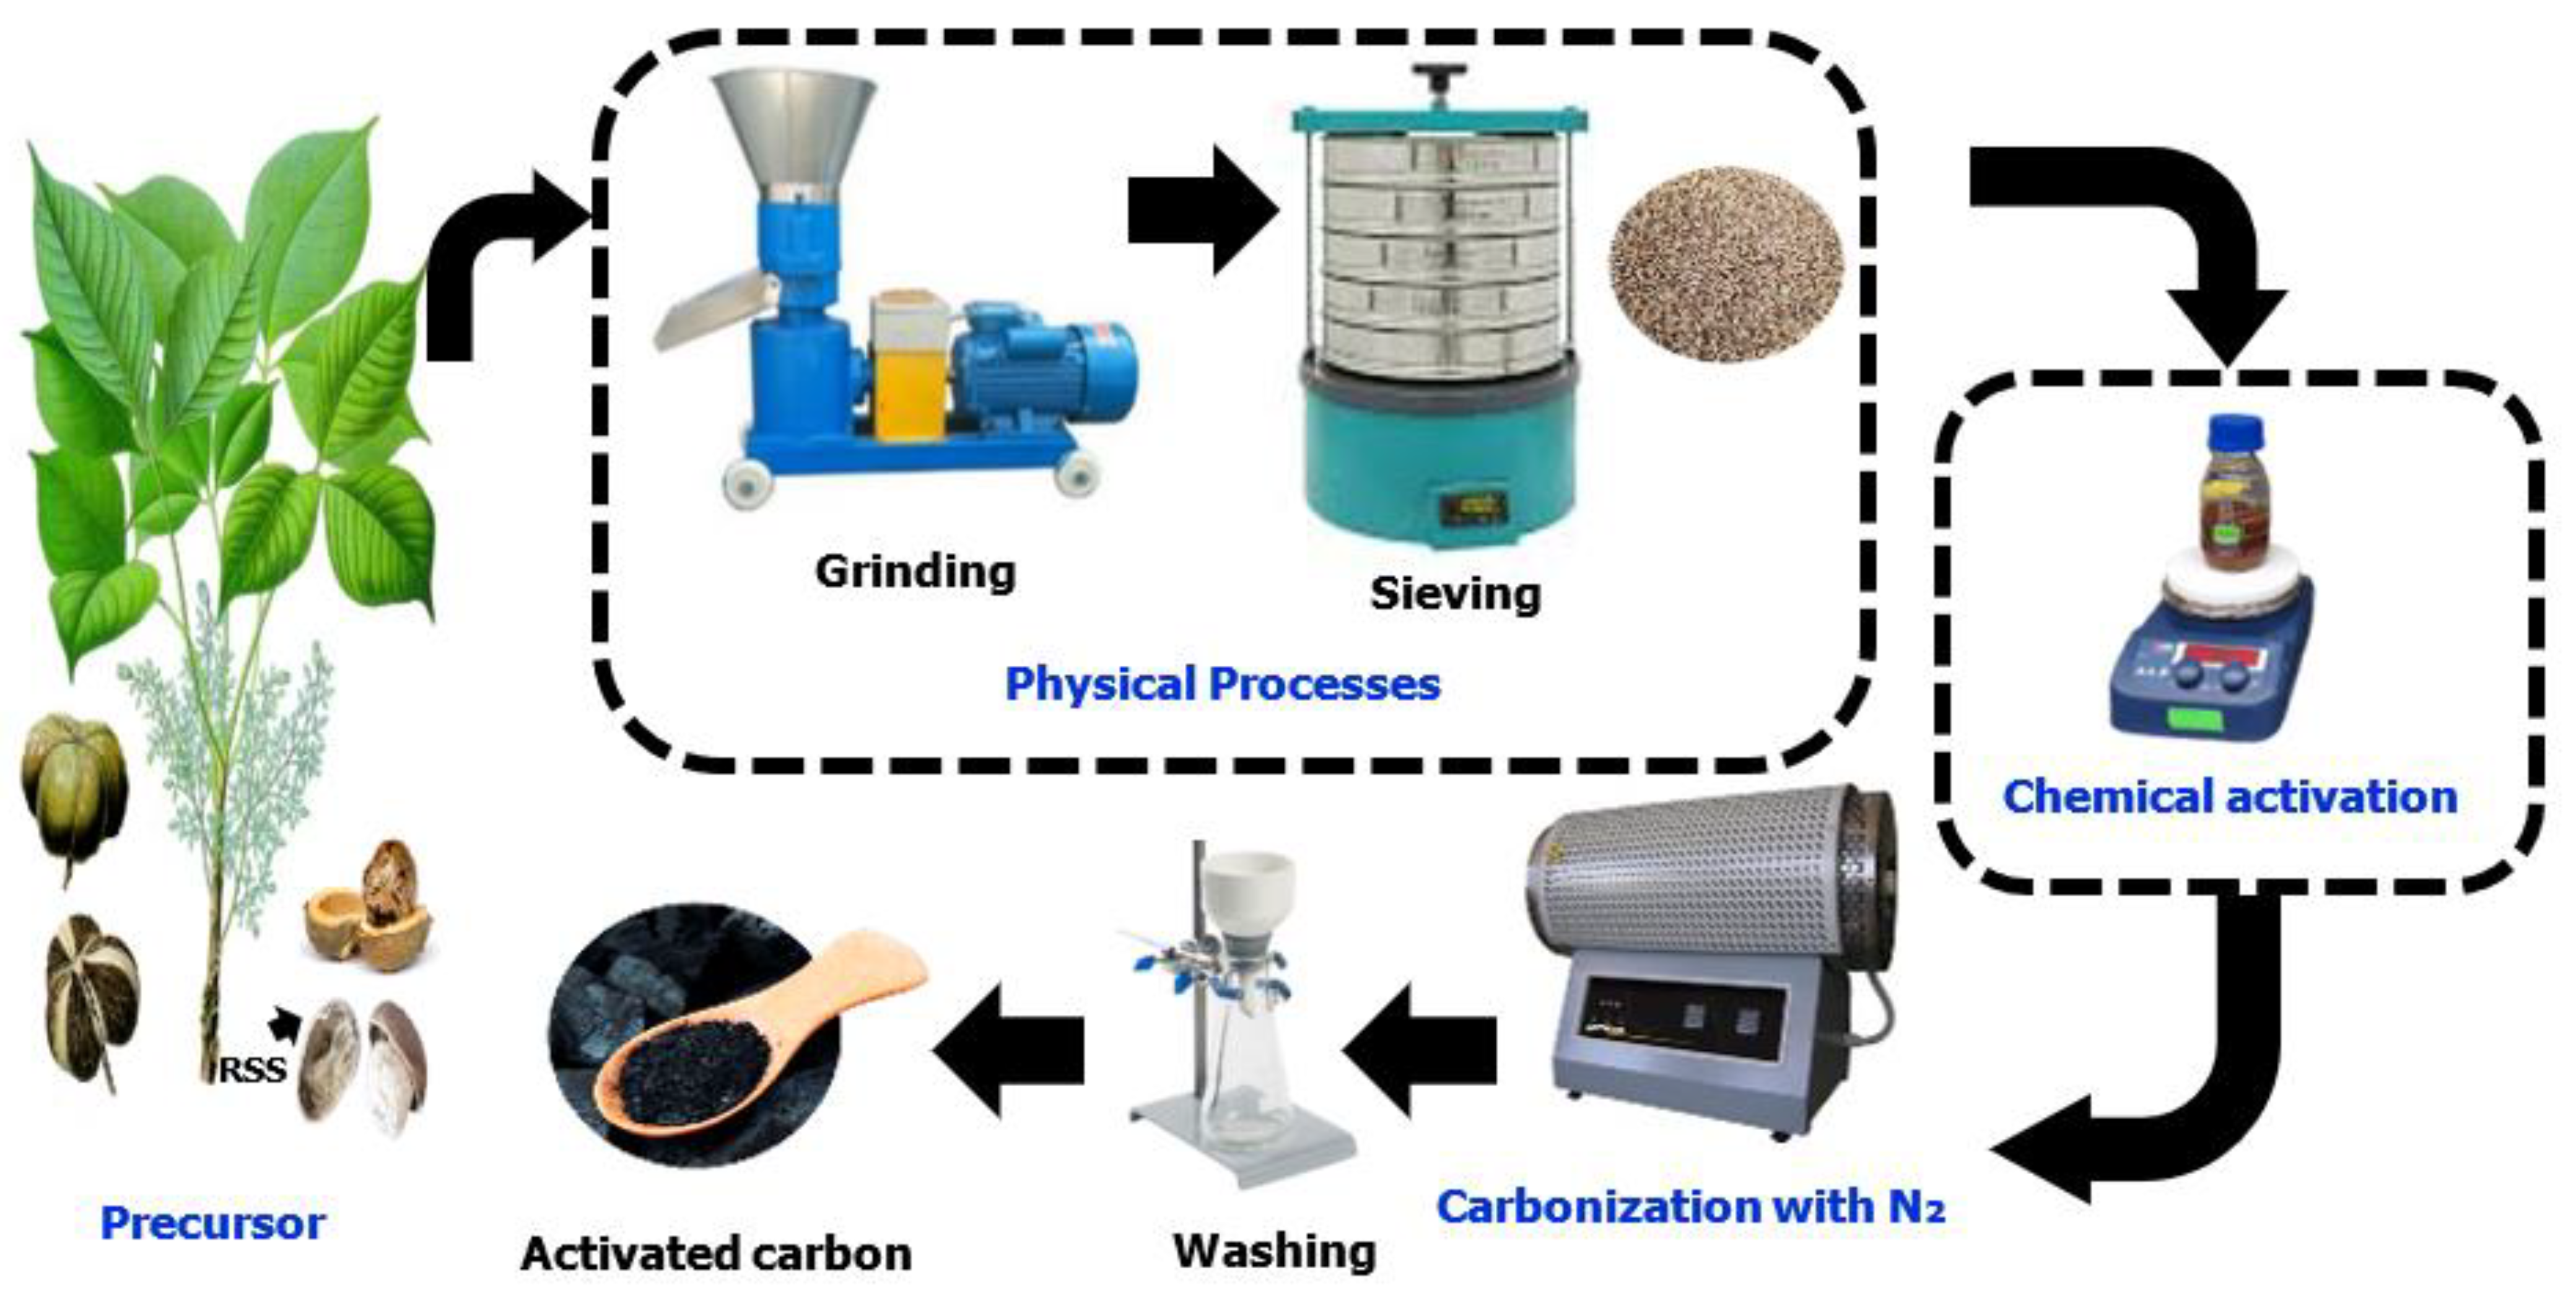
About 2 kg of fresh RSS was first washed thoroughly with distilled water to clean up any dirt and organic constituents before being dried at 110 °C for 24 h. The dried RSS was crushed and sieved into smaller particles of about 1 mm for chemical impregnation preparation. A previously reported chemical impregnation method was adopted with several modifications to produce the AC [9,32]. In detail, about 10 g of RSS was added to 1% (m/v) of [C4Py][Tf2N] solution in 100 mL of ethanol and vigorously stirred for 24 h to ensure uniform mixing, followed by drying at 110 °C for 24 h. Then, a carbonization process was carried out under N2 atmosphere in a horizontal Protherm tube furnace at a temperature of 500 to 800 °C for 120 min and continuously cooled down with N2 gas until it achieved room temperature. The samples obtained were washed with warm distilled water a few times until they reached neutral pH and finally dried in an oven at 110 °C for 24 h before being stored in a sealed container for analysis and characterization. The produced AC samples were denoted as RSS-IL 500, RSS-IL 600, RSS-IL 700, and RSS-IL 800.

2.3. Sample Characterization

Activated Carbon Characterization

The thermogravimetric analysis (TGA) measurement of raw RSS was carried out by using a thermogravimetric analyzer (STA 6000, Perkin Elmer, Waltham, MA, USA) to determine its decomposition profile. Approximately about 5–10 mg of sample was weighed and added into the ceramic pan before starting the analysis. Then, the sample was initially purged with N2 gas and the TGA curve was recorded with a heating rate of 10 °C/min and a temperature range of 30 to 900 °C and hold for 30 min to 1 h once reaching the final temperature at 900 °C before cooling process. The elemental analysis of carbon, nitrogen, sulfur, and hydrogen in AC samples was conducted using an elemental CHNS analyzer (Vario MICRO Cube) while oxygen content was obtained by difference. The analysis was started by placed about 2 mg of samples into an aluminum capsule and dropped into a ceramic pan at high-temperature profile. The samples were then exposed to a strongly oxidizing environment to produce and detect C, H, N and S presented. The surface area and porosity of AC samples were evaluated by Nitrogen physisorption at 77 K by using Micromeritics ASAP 2020 (Micromeritics Instruments, Norcross, GA, USA). Before analysis, each sample was degassed at 200 °C for 16 h to eliminate all the moisture and contaminant from the surface. The specific surface area of AC samples was calculated by using a Brunauer–Emmett–Teller (BET) equation from N2 adsorption isotherm. The total pore volume was evaluated at P/Po of 0.99 and the micropore volume and area were determined by t-plot method. Besides, AC samples surface morphology was analyzed by using Field Emission Scanning Electron Microscopy, FESEM (Zeiss SUPRA 55-VP). Before scanning, the AC samples were placed onto the sample stub using double-sided tape and then coated with a thin gold layer to avoid any charging effects. The surface chemistry of AC samples was characterized by using Fourier Transform Infrared (FTIR) Spectroscopy (Perkin Elmer, Spectrum One). The samples were prepared using the potassium bromate (KBr) by mixing about 0.5 mg of samples and 200 mg of KBr and then pressed with a manual hydraulic press at 3 MPa pressure for 1 min to form a pallet. The FTIR spectra were recorded from 4000 to 400 cm−1 resolution in the transmission mode with 16 scans taken for each run using a 4 cm−1 resolution.

2.4. CO2 Adsorption and Isotherm Study

The CO2 adsorption study of the prepared AC samples was carried out using the static volumetric analyzer, High-Pressure Volumetric Analyzer, HPVA II (Micromeritics Instruments) at an initial pressure of 0 to 1 bar and temperature of 25 to 100 °C. Before adsorption analysis, about 0.3–0.4 g of AC sample was added into a 2 cm3 sample cylinder and covered on top with a 60 µm filter gasket to protect the AC sample from exiting the sample cylinder before attaching it to the sample holder. Each AC sample was degassed in the furnace port at 200 °C for 16 h under vacuum condition and then decreased to an ambient temperature of about 25 °C before transferring the sample holder to an analysis port for adsorption study. The Julabo recirculating water bath was used to maintain the sample temperature below 75 °C while the furnace was used for maintaining the sample temperature at 100 °C. Free-space measurement using helium gas followed by the evacuation process to ensure that the vent was completely clean was applied in this system before the introduction of high-purity CO2 gas into the sample holder. The CO2 adsorption was measured when both pressure and temperature were achieving target equilibrium. The data were provided by Microsoft Excel Macro Version 22.0.9. The amount of CO2 adsorbed into AC samples was expressed in mmol/g. The overall flowchart of the experimental work is shown in Figure 2.
In order to prove the CO2 performance of the prepared AC, adsorption isotherm analysis was performed to understand their mechanism better. Three adsorption isotherms, namely Langmuir, Freundlich, and Temkin models, were used to fit with the experimental data at the temperatures of 25, 50, and 100 °C, respectively. The validity of these models was evaluated by the coefficient of regression, R2, being close to unity. The Langmuir model describes that the interaction between adsorbate and adsorbent occurs in monolayer adsorption onto homogenous sites, which is shown in Equation (1) [33]:
q e = q m a x K L P 1 + K L P
where q e is the equilibrium adsorption capacity (mmol/g), q m a x is the maximum adsorption capacity (mmol/g), P is the equilibrium pressure (bar), and KL is the Langmuir adsorption coefficient (1/bar).
The Freundlich model assumes that it occurs in multilayer adsorption, which takes place at heterogeneous sites. This isotherm gives an expression that specifies the surface heterogeneity and the exponential distribution of active sites and their energies. The equation model is shown in Equation (2) [33]:
q e = K F P 1 / n
where q e is the equilibrium adsorption capacity (mmol/g), P is the equilibrium pressure (bar), KF is the Freundlich adsorption coefficient (mmol/g.bar), and n is a constant value that determines the type of adsorption—n < 1 is for chemical adsorption while n > 1 is for physical adsorption. Both the parameter n and the KF value decrease with increasing temperature.
Equation (3) shows the Temkin model, which reports the adsorbate–adsorbent interaction as the value of heat of adsorption for all the adsorbate decreases [34].
q e = B   ( ln   K T P e )
where q e is the equilibrium adsorption capacity (mmol/g), Pe is the equilibrium pressure (bar), and KT is the Temkin adsorption coefficient (mmol/g.bar).
Lastly, the isosteric heat of adsorption, Δ Q ° st , is calculated by using the Clausius–Clayperon equation as shown in Equation (4).
Ln   P = ( Q st R ) ( 1 T ) + C
where Qst is the isosteric enthalpy of adsorption (kJ/mol), R is the universal gas constant (8.314 J/mol.K), T is the adsorption temperature (K), and P is the equilibrium pressure (bar) [33].

3. Results and Discussion

3.1. Characterization of Materials

3.1.1. Proximate and Ultimate Analysis of Raw RSS

In this study, RSS was used as a precursor in producing AC because of its low cost, abundant availability, and efficiency during the adsorption process [15]. The composition of the raw RSS used in this study was analyzed and compared with the previously reported study by Kang and Jian [8]. It shows that the values are comparable with a slight difference in their proximate analysis. This is mainly due to differences in plant species, location, and management activities including harvesting [33]. Table 1 summarized the ultimate and proximate analysis of the raw RSS. Based on the analysis, raw RSS has a high carbon content of 49.5% and a low ash content of 0.2%. These two properties are desirable to produce AC with a high surface area, good mechanical strength, and high adsorption capacity [35,36]. In addition to that, the low sulfur content of 0.3% in the RSS helps to reduce the emission of sulfur dioxide during the production process, which can cause acid rain [37]. As reported in the previous studies, biomass with carbon contents of more than 40% such as coconut shell (49.2%) [37], EFB (48.5%) [38], wheat straw (44.10%) [39], kenaf fiber (44.02%) [40], and rice husk (41.1%) [37] makes them a promising material as a precursor to convert into AC [37]. Based on the study reported by Hidayu et al. [38], the higher the carbon contents resulting in a higher yield of carbon percentage after the carbonization process. They reported that the carbon contents of EFB increased from 48.5% to 68% after the carbonization process.

3.1.2. TGA Analysis

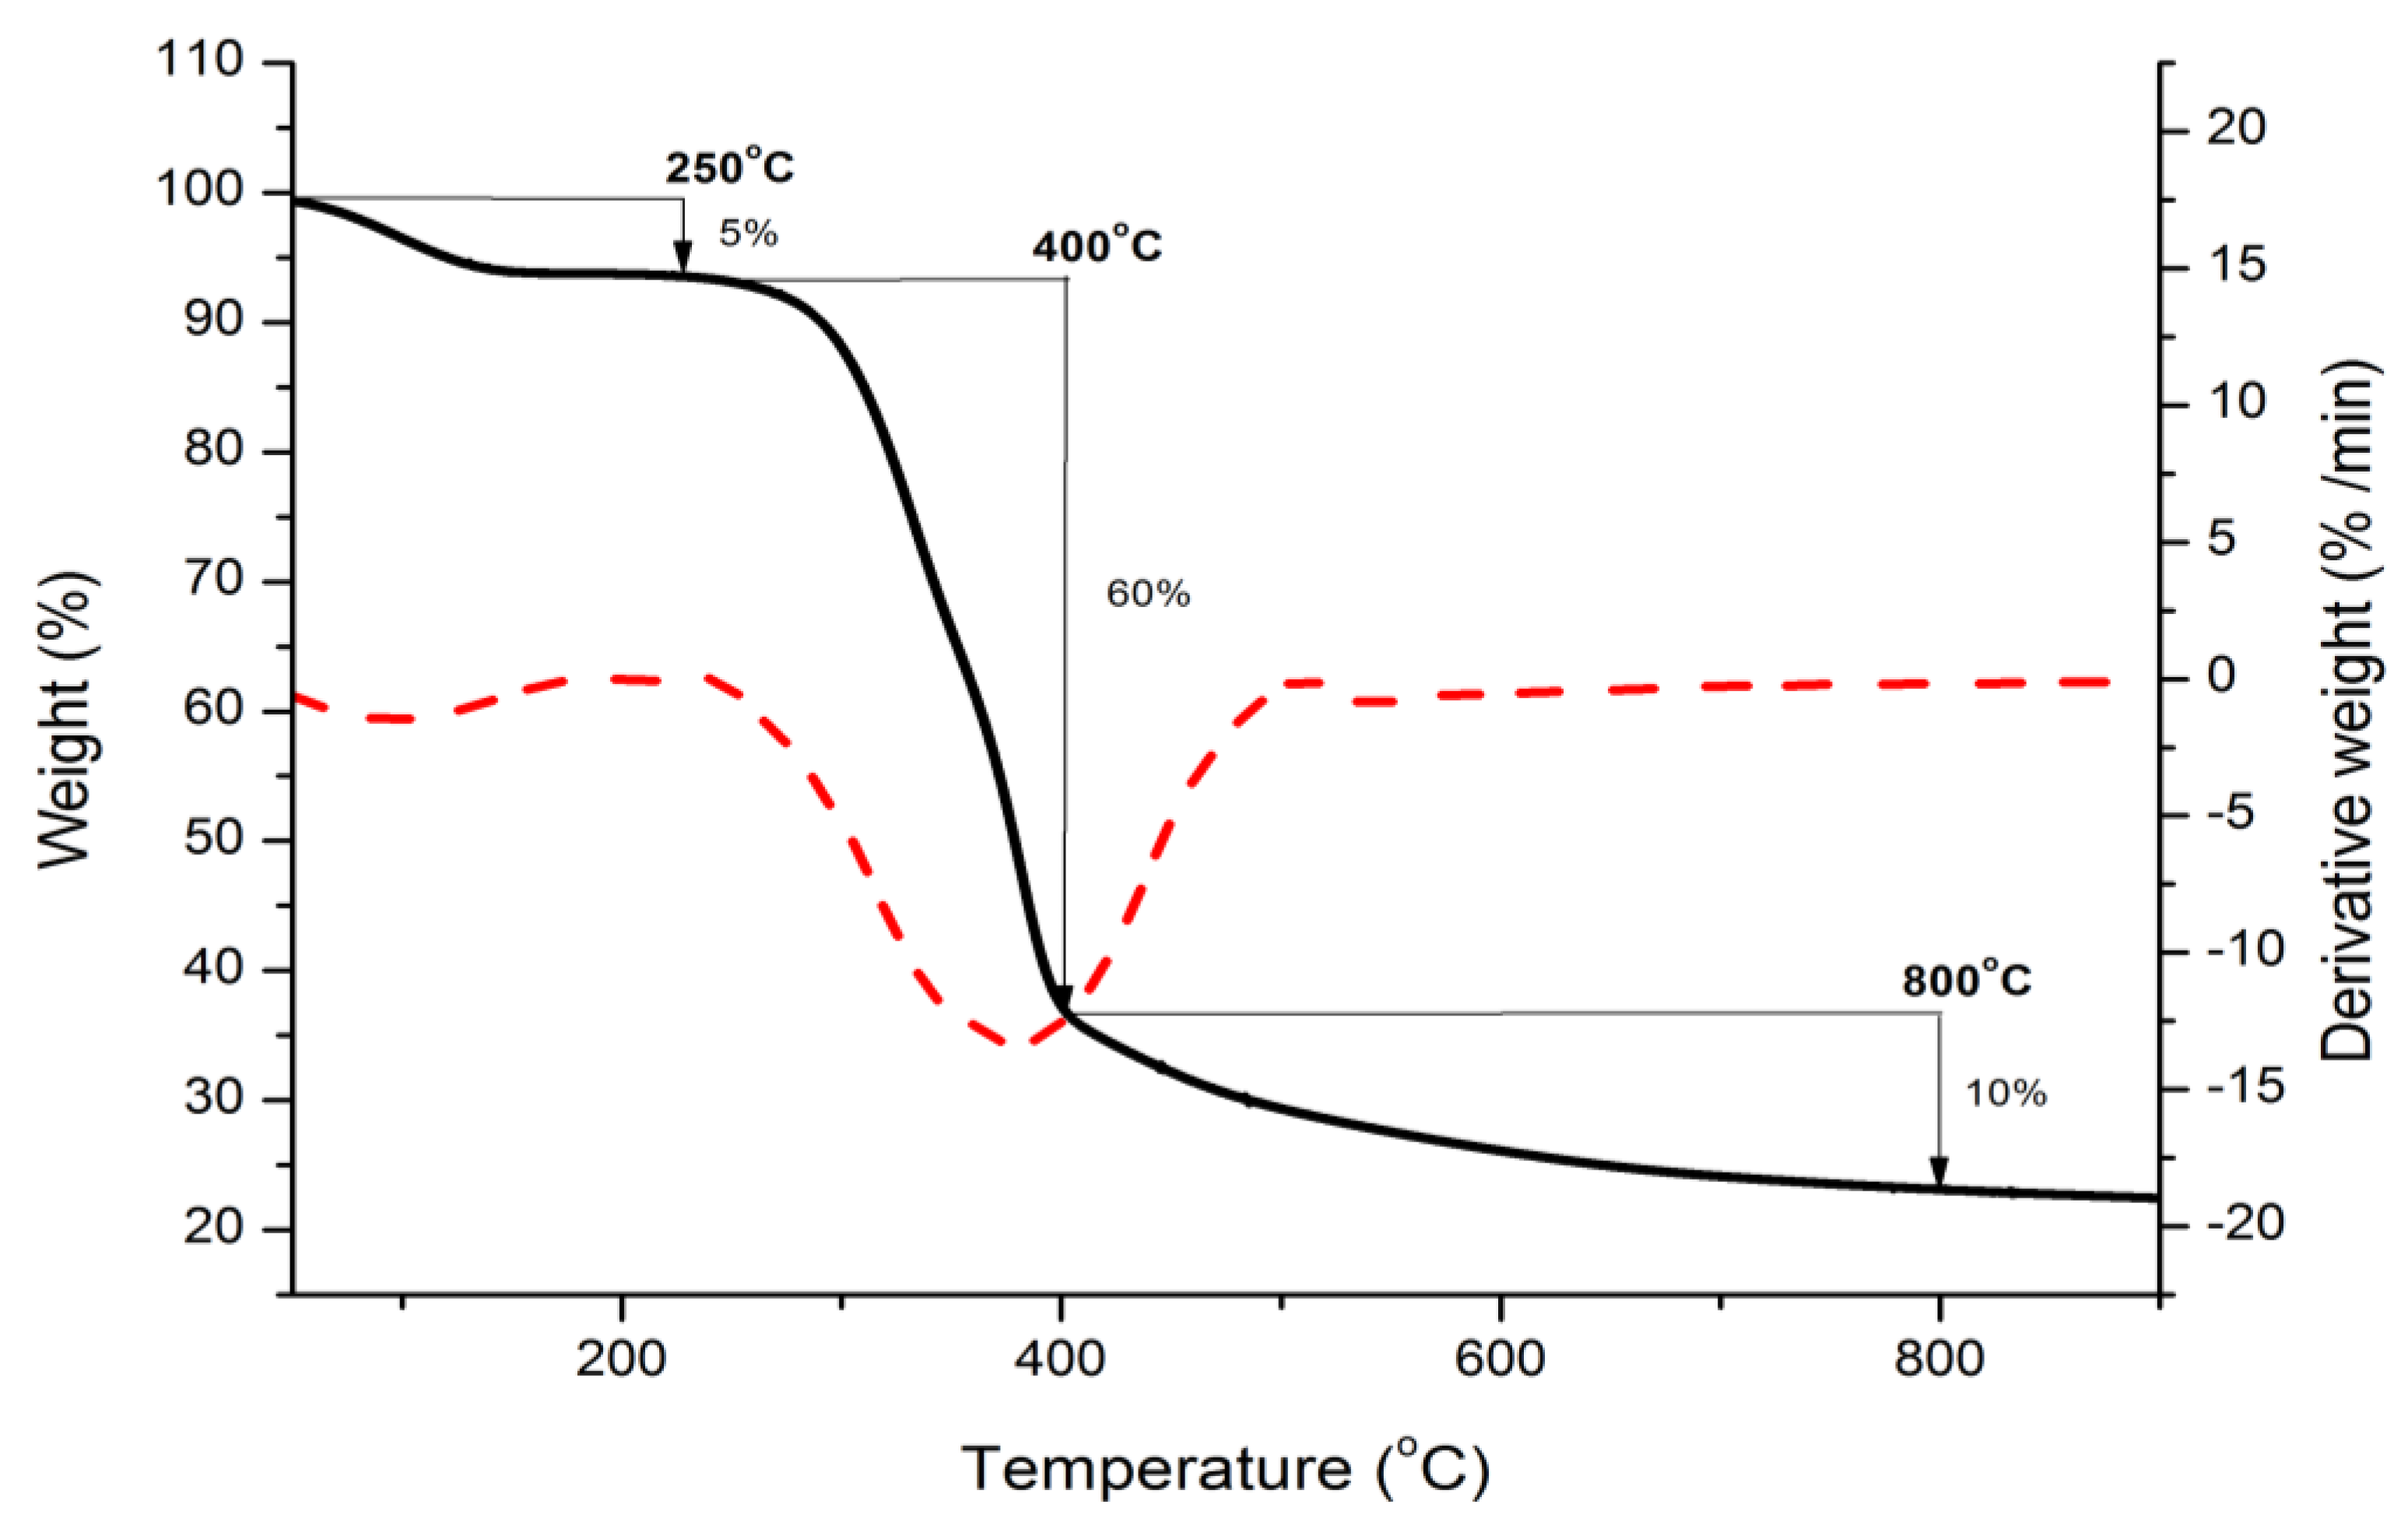
The thermal behavior of raw RSS was analyzed using thermogravimetric analysis (TGA) to determine its decomposition stages. Figure 3 shows the TGA profile (black solid line) of the raw RSS. The TGA profile exhibits three distinct phases. The first phase, which presents in the temperature range of 30 to 150 °C with a weight loss of 5%, represents the release of moisture content and surface-bound air [41]. The highest weight loss of about 60% occurs in the second phase, between the temperatures of 200 to 400 °C. This weight loss is mainly due to the decomposition of hemicellulose and cellulose [41]. The decomposition process forms volatile condensable (organic liquids) and non-condensable products (primarily C2–C5, H2, CO, and CO2). The third phase of weight loss was due to the decomposition of lignin [41]. The third phase exists at a temperature above 400 °C, with a total weight loss of about 10%. During the decomposition of lignin, products such as biochar, non-condensable volatile products (primarily C2–C5, H2, CO, and CO2), organic vapors, and aerosols are produced [42,43]. The three phases of the TGA profile are supported by the derivative thermogravimetric profile (DTG), represented in Figure 3 by a red dotted line. The first small valley in the DTG curve at the temperature below 100 °C was due to the evaporation of the water. A steeper valley in the temperature range of 200 to 400 °C represents the degradation of hemicellulose and cellulose. The trend followed by a shallow curve at about 500 °C represents the degradation of lignin. The plateau at a temperature above 800 °C indicates the formation of a constant mass of the carbonaceous residue. Based on the analysis, temperatures between 500 and 800 °C are suitable for carbonization of the raw RSS.

3.1.3. Surface Area and Pore Size Analysis

Figure 4a shows the N2 adsorption–desorption isotherms of the AC samples at different carbonization temperatures of 500 to 800 °C with 1% of [C4Py][Tf2N] IL as an activating agent. Regardless of the difference in the carbonization temperature, all samples exhibit a Type 1 adsorption isotherm according to the International Union of Pure and Applied Chemistry (IUPCC) classification [44]. The analysis proves that the prepared AC samples activated with [C4Py][Tf2N] IL have high N2 uptake at low relative pressure (P/Po < 1) due to the presence of micropores. However, an increase in the carbonization temperature results in an increase in the amount of N2 adsorbed. The same trend was also reported previously by Kumar and Jena [45]. Figure 4b shows the pore size distributions (PSDs) of the AC samples. The analysis of the PSD of particular samples is necessary to determine their compatibility for specific applications. The PSD analysis shows that all AC samples mainly comprise micropores and a small portion of mesopores. The tested AC samples have peaks in nearly the same micropore size range between 1.7 and 1.8 nm. Nevertheless, the micropore volume increases on increasing the carbonization temperature.
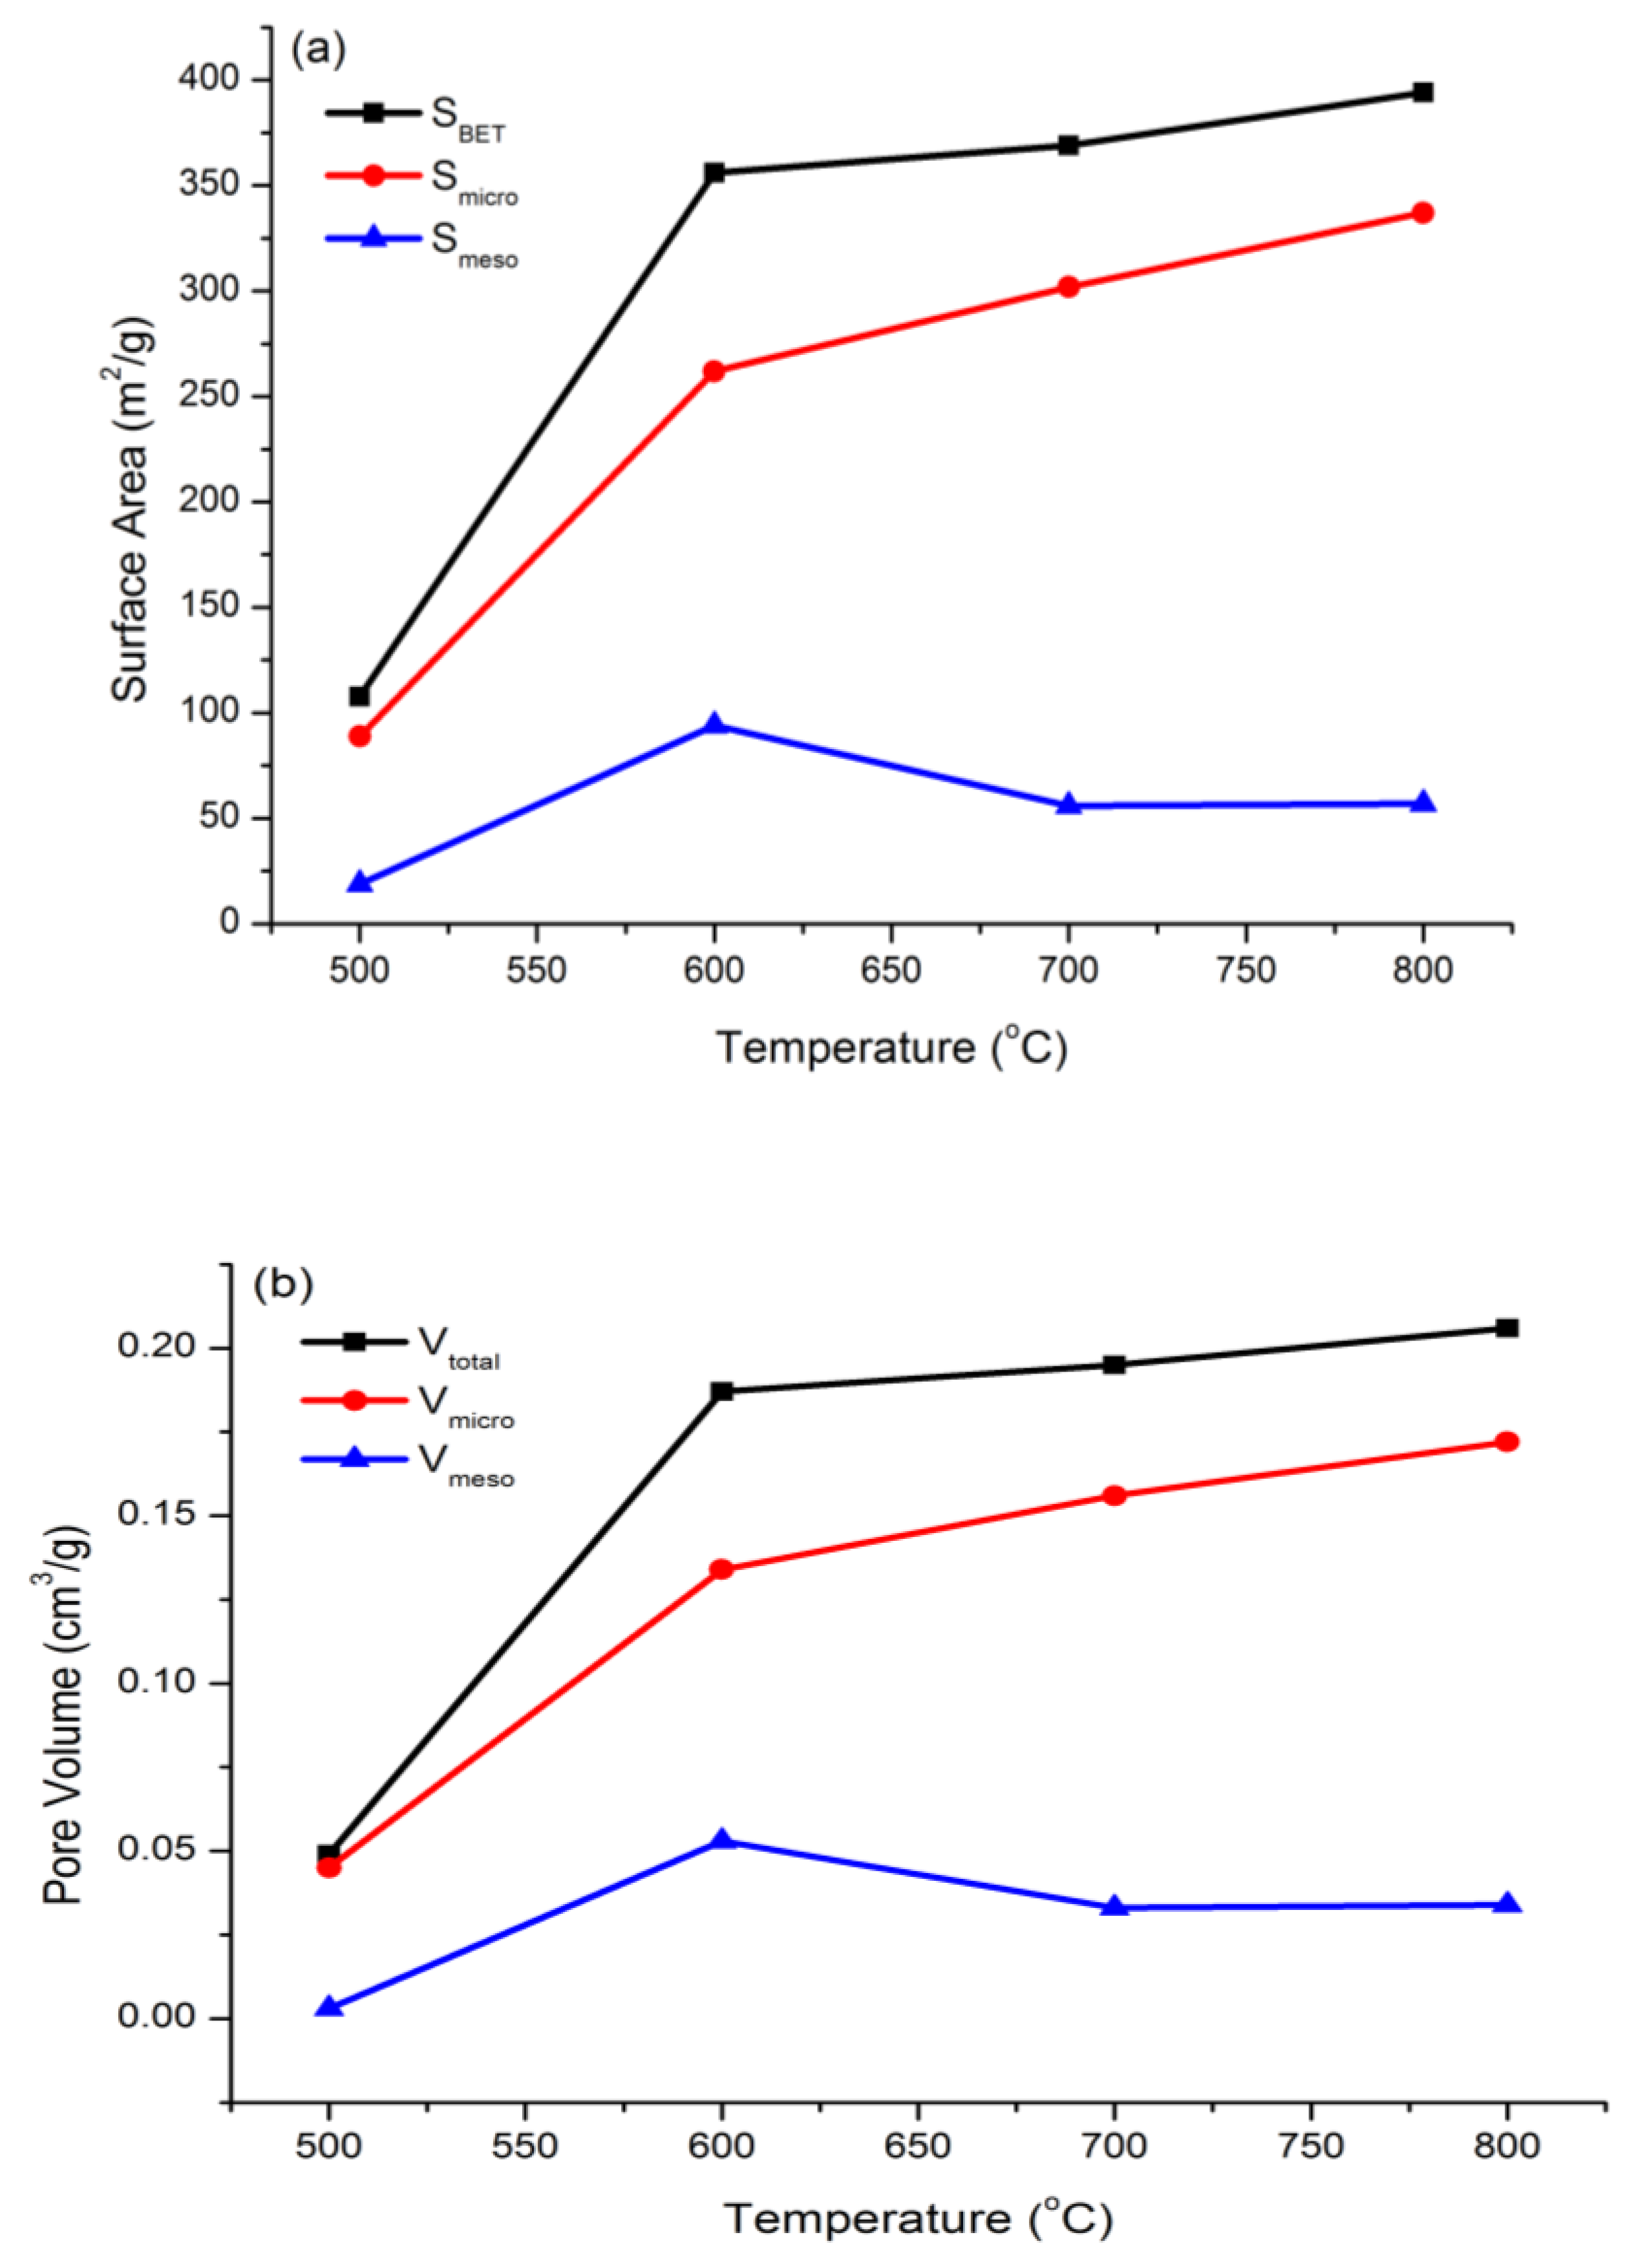
Table 2 summarizes the data obtained from the analyses, namely the total BET surface area (SBET), total pore volume (Vtotal), micropore volume (Vmicro), and micropore percentage. The tabulated data prove that the raw RSS without chemical impregnation is not porous in structure. After chemical impregnation, the total SBET and Vtotal of the AC samples increased significantly from 107.547 to 393.993 m2/g and 0.049 to 0.206 cm3/g, when the temperature increased from 500 to 800 °C, respectively. The micropore volume also exhibits similar trends, where it increased from 0.045 (500 °C) to 0.172 cm3/g (800 °C). Moreover, the micropore volume of each AC sample was larger than its mesopore volume by up to 86%. AC samples with high carbonization temperature exhibit high micropore volume [46].
The corresponding surface area and pore volume of the prepared AC samples plotted against carbonization temperature are presented in Figure 5. The total BET surface area and total pore volume increase with the increase in the carbonization temperature. The findings are in good agreement with the previously reported results [45,47]. Kumar and Jena [45] discovered that the total BET surface area (SBET) and total pore volume of AC produced from Fox nut are increased from 2223 to 2636 m2/g and 1.29 to 1.53 cm3/g, respectively when the temperature increases from 600 to 700 °C. According to Lee et al. [48], increases in the carbonization temperature to 800 °C in the presence of IL will further extend the porous structure. This study proves that utilizing the [C4Py][Tf2N] IL as an activating agent plays a significant role in the formation of a porous structure. The bulky anion of Tf2N in the IL structure helps to enhance the pore formation of AC. Based on the analysis, the sample RSS-IL 800 exhibited excellent textural parameters such as high surface area, large pore volume, and the smallest pore diameter, which can help to increase the CO2 adsorption.

3.1.4. Surface Morphology

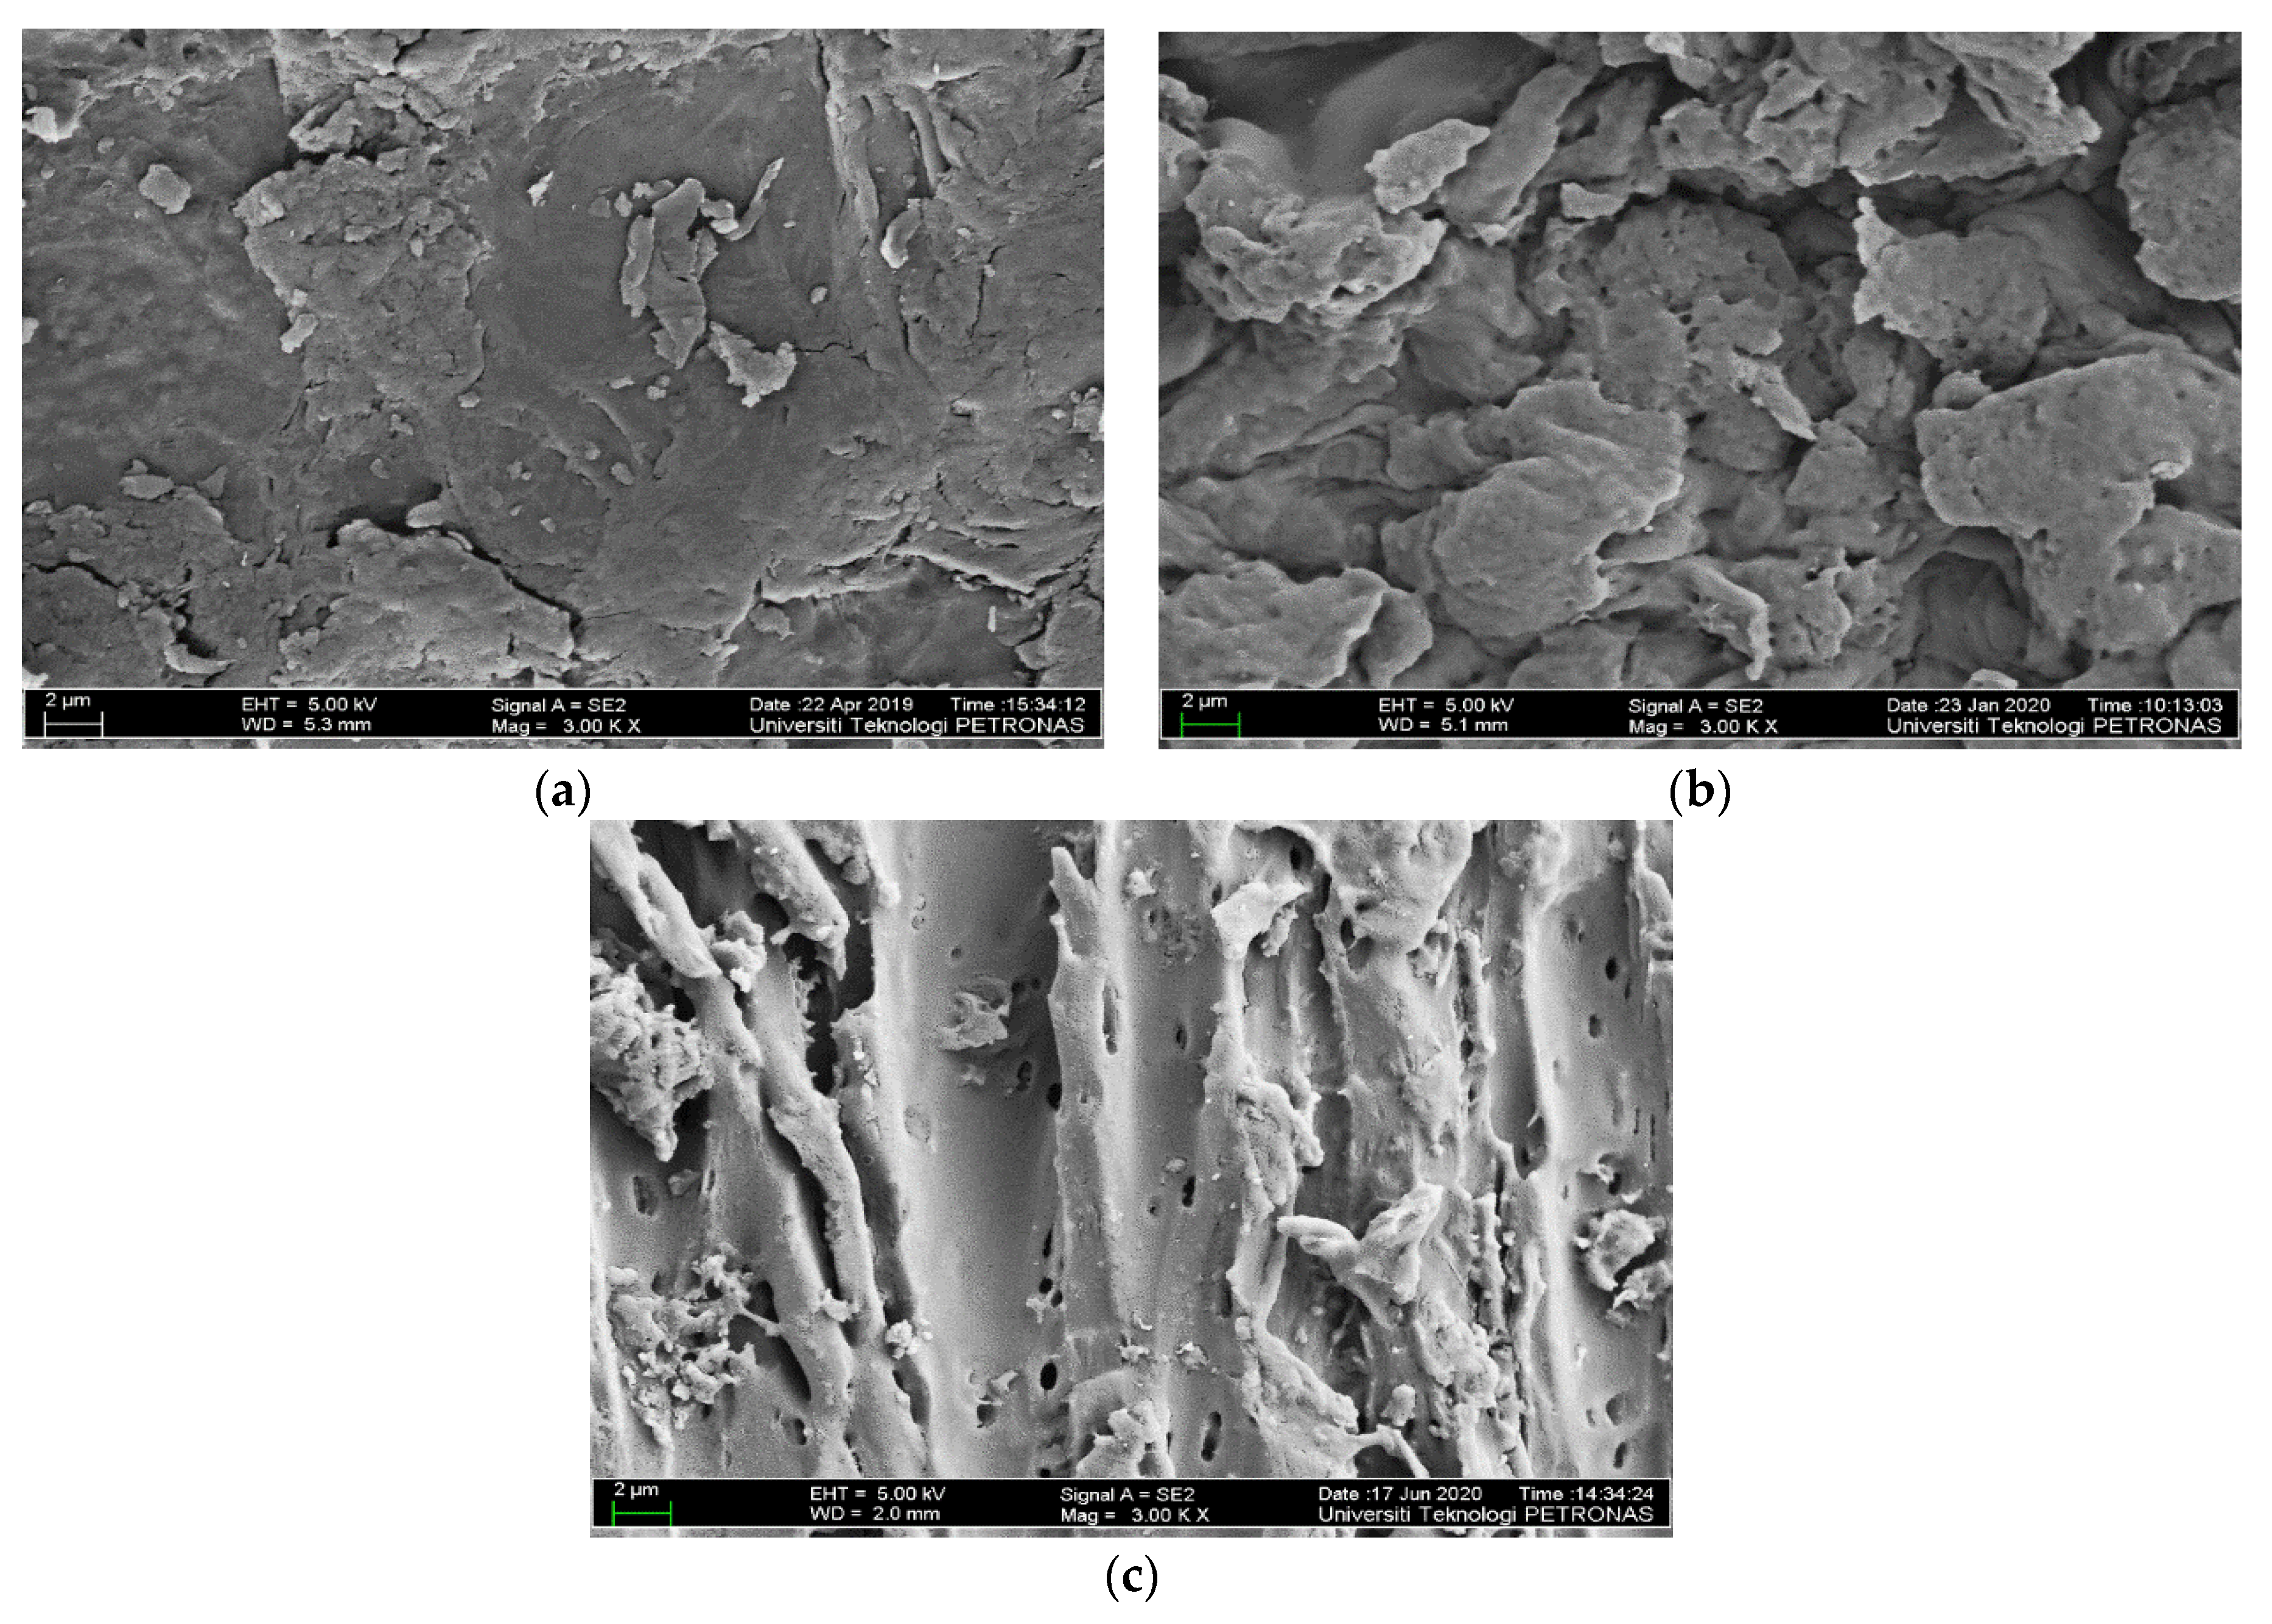
FESEM was used to evaluate the surface morphology and microstructure of the raw RSS and AC samples. Figure 6 shows images at a magnification of 3000× of the raw RSS and the AC sample carbonized at 500 and 800 °C. The raw RSS sample exhibits surface morphology with minimal pores; thick, rough, uneven texture; and irregular shapes (Figure 6a). After carbonization at 500 °C, the porous structure started to appear. The sample RSS-IL 500 (Figure 6b) displays a morphology of irregular shapes with the presence of some cavities, and the pore is about to form. Increasing the carbonization temperature to 800 °C results in the formation of more pores, well-developed and defined microstructures of sample RSS-IL 800 (Figure 6c). The pores might form due to the evaporation of the volatile material produced during chemical activation at high carbonization temperatures. The moisture, volatile matter, and other derivatives in sample RSS-IL 800 were removed to further improve its pore formation and surface area during carbonization. This is justified as sample RSS-IL 800 has higher BET surface area than the other AC samples. Similar trends in morphology and pore formation were reported by Tan et al. [47]. The porous structure of the best AC sample, RSS-IL 800, is favorable because it permits CO2 gases to be captured and adsorbed into the pores.

3.1.5. Chemical Properties of Activated Carbon

Table 3 displays the elemental analysis for AC samples at different carbonization temperatures. Based on the tabulated data, the carbon content increases from 49.55% of the raw RSS to 85.47% of the AC sample carbonized at 800 °C. Nevertheless, the amount of hydrogen and oxygen content decreases as the carbonization temperature increases. These findings were due to the release of moisture and volatile compounds to the surroundings during the carbonization process [34], leaving ordered pore structures. The higher carbon content of AC makes it favorable for CO2 adsorption as it can increase the van der Walls force in between them [49]. Furthermore, the amount of nitrogen content also increases from 0.85% to 1.14% as the carbonization temperature increases from 500 and 800 °C. High carbonization temperature is believed to be able to enhance the nitrogen content on the AC surface. The basic sites of the nitrogen group are one of the reasons for the high affinity to CO2 adsorption.
FTIR was used to identify the functional groups in the raw RSS and the AC samples at different activation temperatures of 500 to 800 °C. Figure 7 shows the FTIR spectra of the analyzed samples. Based on the FTIR spectra, the raw RSS sample exhibits more peaks compared to the carbonized AC samples. The analysis proves that the functional groups initially present in the raw RSS decomposed at higher carbonization temperature due to thermal degradation. The strong band at 3425 cm−1 corresponds to O–H stretching of carboxyl and phenol group and N–H stretching of amine groups. Meanwhile, the weak band observed at 2924 cm−1 corresponds to the asymmetric and symmetric –CH2 stretching group [50,51]. The band located at 2366 cm−1 is assigned to the C–H stretching, while the band ranging from 1736 to 1635 cm−1 belongs to C=O stretching of carbonyl group, which consists of ketone and aldehyde groups, and C=C stretching in alkene group [51,52]. The bands of –CH2 and C–H stretching ranging between 2924 and 2366 cm−1 were only present in the raw RSS sample and dramatically diminished at high temperature. Furthermore, the strong and broader band at 1062 cm−1 is attributed to C–O and C–N stretching, while the weak band between 900 and 600 cm−1 represents the N–H and C–H out-of-plane vibration [29,53]. The appearance of oxygen functional groups of OH and C=O shows that the organic structure in the samples is oxidized during the activation process, thereby providing the adsorbent with a higher surface area, which enhances the CO2 adsorption.

3.2. CO2 Adsorption and Isotherm Study

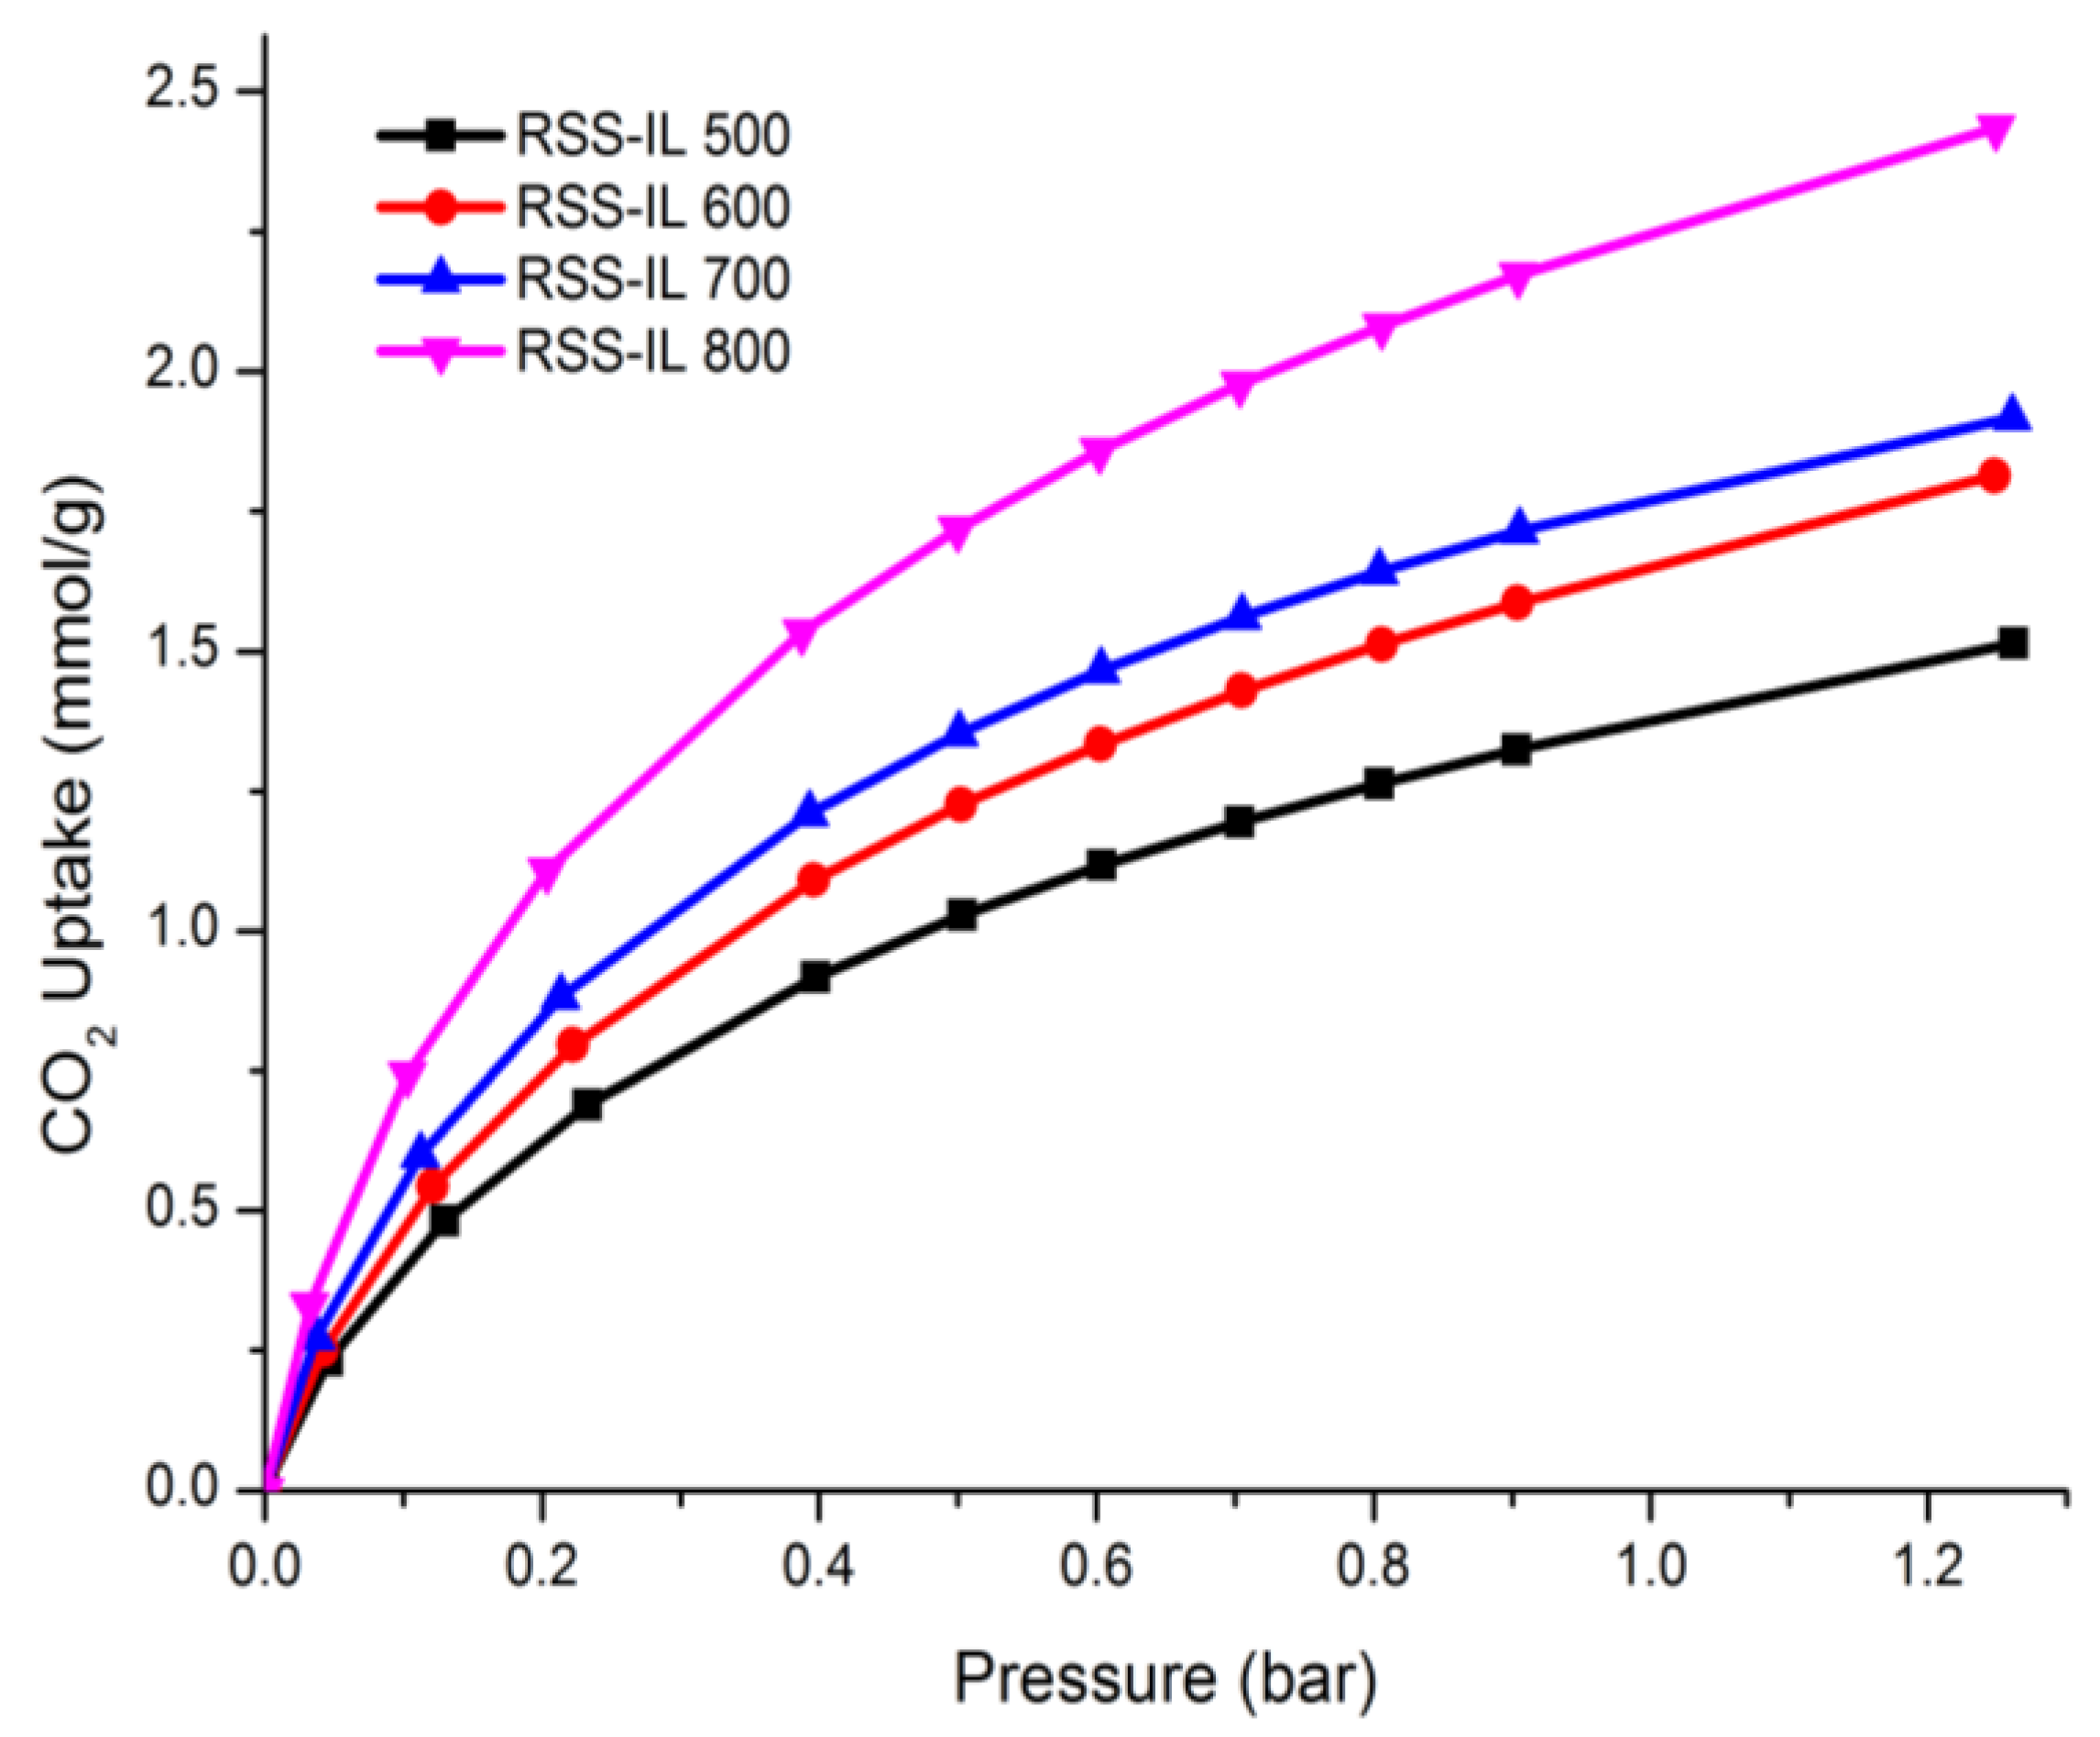
All the AC samples were tested for CO2 adsorption capacity at temperature 25 °C with an approximate pressure of 1 bar. Figure 8 shows CO2 adsorption isotherm curves on the AC samples with different carbonization temperatures. Based on the adsorption isotherm, the CO2 adsorption capacity increases with the increasing carbonization temperature. The CO2 adsorption capacity of AC is in the following order: RSS-IL 800 > RSS-IL 700 > RSS-IL 600 > RSS-IL 500. Sample RSS-IL 500 is capable of adsorbing up to 1.52 mmol/g of CO2 compared to RSS-IL 800 with 2.44 mmol/g. The low adsorption capacity is mainly because of the lower total surface area (SBET = 107.55 m2/g) and smaller micropore volume (Vmicro = 0.045 cm3/g) of RSS-IL 500 compared with that of RSS-IL 800 (SBET = 393.99 m2/g; Vmicro = 0.172 cm3/g). The findings are attributed to the chemical activation with [C4Py][Tf2N] IL followed by high carbonization temperature, which helped to enlarge the pore volume by increasing the micropore volume and total surface area. The chemical activation with [C4Py][Tf2N] IL helps to dissolve all the impurities involved, forming pores, particularly the micropores.
The CO2 adsorption also exhibits a Type I isotherm, which corresponds to the presence of micropores. Rashidi et al. [2] reported that the high micropore volume and total surface area play essential roles in CO2 adsorption. It will exhibit strong adsorption potentials due to the increase in the interaction between AC and CO2 gas, thus increasing the CO2 uptake of the gas molecules. Guo et al. [51] claim that porous material with a high surface area and large micropore volume is a promising adsorbent for CO2 adsorption. Their functional groups also explain the superior CO2 adsorption capacity of RSS-IL 800 on its surface. The chemical activation with [C4Py][Tf2N] IL increases the number of nitrogen atoms on the AC surfaces. FTIR results also suggest that nitrogen exists as N–H (3425 cm−1) and C–N (1062 cm−1). The presence of N–H and C–N functional groups might enhance the CO2 adsorption capacity. Additionally, CHNS analysis in Table 3 shows that sample RSS-IL 800 has a higher amount of nitrogen content than other AC samples, thus increasing the CO2 adsorption after the chemical activation and carbonization. Moreover, the CO2 adsorption capacity of all AC samples increases at elevated pressure as the physisorption influenced by the van der Walls forces causes the gases to travel and adsorb on the AC surfaces [54].
Furthermore, sample RSS-IL 800 was further investigated regarding its CO2 adsorption capacity at two different temperatures of 50 and 100 °C, mimicking the fuel gas condition, usually between 50 and 120 °C in post-combustion processes [55]. Figure 9 illustrates the CO2 adsorption isotherm curves at temperatures of 50 and 100 °C. The CO2 adsorption capacity was 1.591 and 0.734 mmol/g at 50 and 100 °C, respectively. The results show that the CO2 adsorption capacity decreases at a higher temperature, as reported in previous literature [3,49]. The finding is due to the exothermic process of CO2 adsorption in nature and the physisorption reaction between AC and CO2 gas molecules. Furthermore, an increase in the temperature provides high internal energy, increases the velocity and the diffusion rate, thus leading to instability and chances for the CO2 molecules to be retained and captured on the adsorption sites of the AC surface. Consequently, the CO2 gases are released from the pores of the AC surfaces [2,56]. According to Younas et al. [57], room temperature of 25 °C is the best operating condition for the CO2 adsorption process as it favors the excellent interaction between the CO2 gases and the adsorbent.
Additionally, FTIR analysis was conducted on the sample RSS-IL 800 before and after CO2 adsorption, as shown in Figure 10. Sample RSS-IL 800 exhibited a similar chemical spectrum before and after adsorption. However, the peak intensity of the sample after the adsorption process was increased. A new peak was also observed. The analysis indicates that the RSS-IL 800 sample is thermally stable during the adsorption process. The peaks appearing at 3424, 1736, 1635, 1062, 800 and 600 cm−1 are the bonds that might help in the interaction between the AC and CO2 gas molecules during the absorption process. The new small peak found at 2300 cm−1 corresponds to the physisorption of CO2 molecules [58].
According to the experimental result, the highest CO2 adsorption capacity obtained in sample RSS-IL 800 was calculated using the linear regression technique for each of the three isotherm models, i.e., Langmuir, Freundlich, and Temkin. Table 4 shows the summary of estimated parameters and their R2 to analyze the best-fit isotherm model. The Langmuir model of RSS-IL 800 has the highest R2 value between 0.9904 to 0.9945, which is closest to 1, suggesting monolayer adsorption and, therefore, providing the best fit to the experimental data among all three models. The values of the Langmuir adsorption coefficient, KL, and qmax also decrease when temperature increases, proving that the physisorption reaction occurs with exothermic behavior.
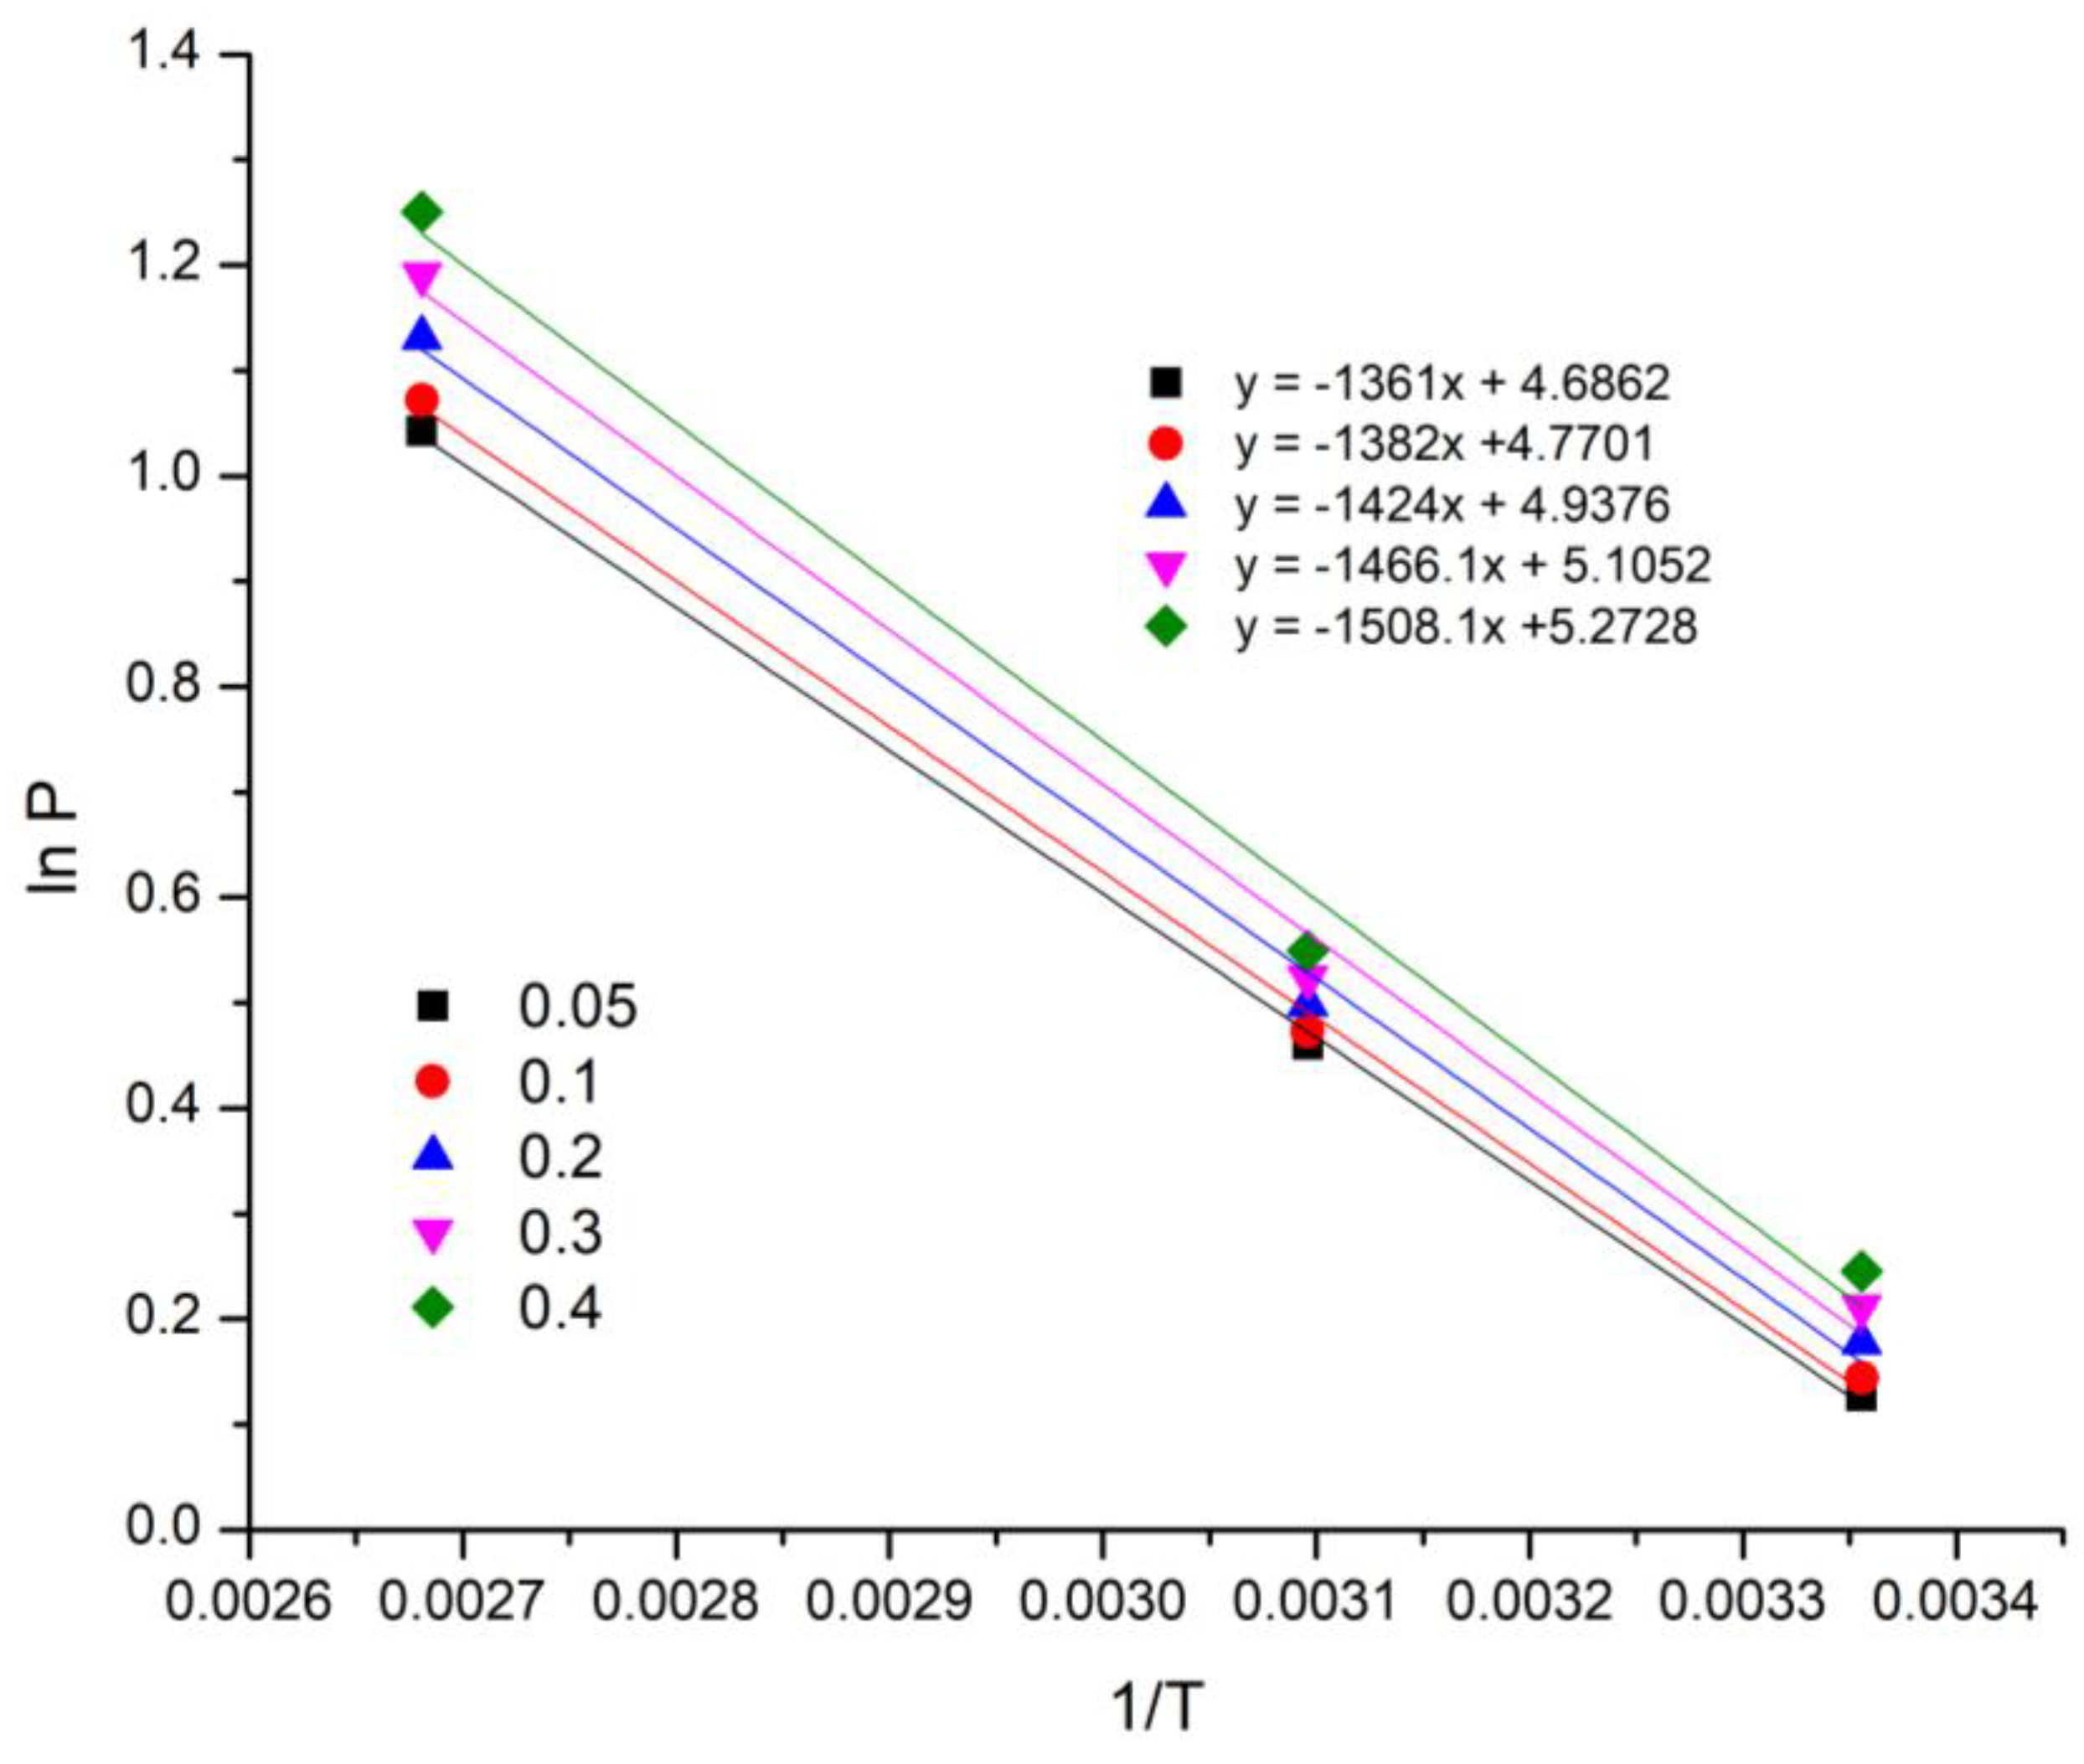
In order to have a better understanding of the CO2 adsorption of the sample RSS-IL 800, the isosteric heat of adsorption was calculated using Equation (4). The graph of ln P vs. 1/T was plotted to obtain the linear fits with the n loading between 0.05 and 0.4 mmol/g as in Figure 11. The isosteric heat of adsorption will be calculated from the slope ( Q st R ) in the equation in Figure 11. As shown in Figure 12, the isosteric values for CO2 of the sample RSS-IL 800 decreased with higher CO2 loading at different temperatures ranging from 11.3 to 12.5 kJ/mol, indicating physisorption (less than 80 kJ/mol). It is because a heat of adsorption with more than 80 kJ/mol would result in chemisorption. Therefore, it verifies that the values of isosteric heat of adsorption obtained in this study is a physisorption process and exhibits exothermic behavior.

3.3. Comparison Studies with Other Adsorbent Materials

The performance of CO2 adsorption capacity obtained from this study was compared with the previously published data of biomass-waste-based and other solid adsorbents such as zeolite and metal–organic framework (MOF) including commercial AC and is summarized in Table 5. The adsorption capacity depends on the raw material and the preparation processes, which affect the produced adsorbent’s properties. From the table, the RSS-IL 800 sample has relatively higher CO2 adsorption capacity compared with the commercial ACs, Norit® SX2 and Norit ROX, at 1.88 and 2.02 mmol/g, respectively. The commercial AC is considered benchmark material; however, they are relatively expensive [59]. Moreover, the CO2 adsorption capacity of non-biomass materials such as zeolite 13X and MOF-5 is lower than that of sample RSS-IL 800 at 2.42 and 2.43 mmol/g, respectively. Therefore, it is necessary to find low-cost and abundantly available materials as an alternative precursor for AC. Additionally, the RSS-IL 800 sample prepared in this study had a higher adsorption capacity compared to the banana peel AC, RSS AC (KOH), grass biomass AC, coconut shell AC, palm kernel shell AC, and RSS AC (malic acid) with an adsorption capacity of 1.10, 1.24, 1.45, 1.70, 2.13 and 2.26 mmol/g, respectively. Comparing with other common activating agents such as KOH, ZnCl2, and H3PO4, the [C4Py][Tf2N] IL shows a higher CO2 adsorption capacity for RSS-IL 800. Furthermore, despite using organic materials as an activating agent, the CO2 adsorption capacity investigated by Borhan et al. with RSS using malic acid was lower than found in this study [17]. Although the CO2 adsorption capacity was escalated for rice husk AC at 3.10 mmol/g, sample RSS-IL 800 from this study showed comparable adsorption capacity with higher adsorption rate among the published literature and, hence, is promising for CO2 capture applications.

4. Conclusions

This study successfully synthesized an activated carbon from biomass waste, rubber seed shell using chemical activation with [C4Py][Tf2N] IL as an activating agent followed by carbonization. The use of [C4Py][Tf2N] IL with high carbonization temperature helped to form pores and enhance the CO2 adsorption uptake. Sample RSS-IL 800 had the highest total surface area (SBET = 393.99 m2/g) and total pore volume (Vtotal = 0.206 cm3/g) compared to other prepared activated carbons. The presence of high surface area, large micropore volume, many functional groups, and high nitrogen content improved the adsorption capacity of the RSS-IL 800 sample. The highest CO2 adsorption capacity for the RSS-IL 800 sample was 2.44 mmol/g. However, increasing the adsorption temperature resulted in a decrease in the CO2 adsorption capacity. This was due to the exothermic and physisorption reaction by the AC sample. The Langmuir model shows the highest R2 with values of 0.9904 to 0.9945 compared to the other study models, Freundlich and Temkin. Moreover, the values of isosteric heat of adsorption within the range of 11.3 to 12.5 kJ/mol imply physisorption and exothermic behavior. Nevertheless, it should be noted that the current research on CO2 adsorption with an IL-based activating agent is still in early stages, and many consequences and difficulties have yet to be thoroughly investigated to meet industrial demands. As a result, further research is needed to foster industrial innovation in a large scale. Recommendations for future works include (1) improvement of the synthesis of AC using different combinations of diverse ILs and other precursors, (2) regeneration analysis and performance of adsorption under mixed gases with flue gas conditions to ensure the potential of AC in this study for large industries.

Author Contributions

N.M.: conceptualization, methodology, data curation, formal analysis, writing—original draft preparation; A.B.: funding acquisition; S.N.A.Z. and A.B.: supervision; S.N.A.Z., A.B. and H.F.M.Z.: writing—reviewing and editing. All authors have read and agreed to the published version of the manuscript.

Funding

The authors extend their acknowledgment to Yayasan Universiti Teknologi PETRONAS (YUTP-FRG 015LCO-068) for financing this research.

Institutional Review Board Statement

Not applicable.

Informed Consent Statement

Not applicable.

Data Availability Statement

Not applicable.

Acknowledgments

The authors also gratefully acknowledge Universiti Teknologi PETRONAS for the technical and facilities support. Support from the Ministry of Education, Malaysia, through the HICoE award to the Center for Biofuel and Biochemical Research (CBBR) is also acknowledged.

Conflicts of Interest

The authors declare no conflict of interest.

References

  1. Yaumi, L.A.; Bakar, M.Z.A.; Hameed, B.H. Recent advances in functionalized composite solid materials for carbon dioxide capture. Energy 2017, 124, 461–480. [Google Scholar] [CrossRef]
  2. Rashidi, A.N.; Yusup, S. An overview of activated carbons utilization for the post-combustion carbon dioxide capture. J. CO2 Util. 2016, 13, 1–16. [Google Scholar] [CrossRef]
  3. Li, M.; Xiao, R. Preparation of a dual Pore Structure Activated Carbon from Rice Husk Char as an Adsorbent for CO2 Capture. Fuel Process. Technol. 2019, 186, 35–39. [Google Scholar] [CrossRef]
  4. Hussin, F.; Aroua, M.K. Recent trends in the development of adsorption technologies for carbon dioxide capture: A brief literature and patent reviews (2014–2018). J. Clean. Prod. 2020, 253, 119707. [Google Scholar] [CrossRef]
  5. Mistar, M.E.; Alfatah, T.; Supardan, M.D. Synthesis and characterization of activated carbon from Bambusa vulgaris striata using two-step KOH activation. J. Mater. Res. Technol. 2020, 9, 6278–6286. [Google Scholar] [CrossRef]
  6. Danish, M.; Ahmad, T. A review on utilization of wood biomass as a sustainable precursor for activated carbon production and application. Renew. Sustain. Energy Rev. 2018, 87, 1–21. [Google Scholar] [CrossRef]
  7. de Souza, L.K.; Gonçalves, A.A.; Queiroz, L.S.; Chaar, J.S.; da Rocha Filho, G.N.; da Costa, C.E. Utilization of acai stone biomass for the sustainable production of nanoporous carbon for CO2 capture. Sustain. Mater. Technol. 2020, 25, e00168. [Google Scholar]
  8. Sun, K.; Jiang, J.C. Preparation and characterization of activated carbon from rubber-seed shell by physical activation with steam. Biomass Bioenergy 2010, 34, 539–544. [Google Scholar] [CrossRef]
  9. Borhan, A.; Kamil, A.F. Preparation and Characterization of Activated Carbon from Rubber-seed Shell by Chemical Activation. J. Appl. Sci. 2012, 12, 1124–1129. [Google Scholar] [CrossRef]
  10. Nandiyanto, A.B.D.; Putra, Z.A.; Andika, R.; Bilad, M.R.; Kurniawan, T.; Zulhijah, R.; Hamidah, I. Porous activated carbon particles from rice straw waste and their adsorption properties. J. Eng. Sci. Technol. 2017, 12, 1–11. [Google Scholar]
  11. Bohli, T.; Ouederni, A.; Fiol, N.; Villaescusa, I. Evaluation of an activated carbon from olive stones used as an adsorbent for heavy metal removal from aqueous phases. C. R. Chim. 2015, 18, 88–99. [Google Scholar] [CrossRef]
  12. Kemp, K.C.; Baek, S.B.; Lee, W.G.; Meyyappan, M.; Kim, K.S. Activated carbon derived from waste coffee grounds for stable methane storage. Nanotechnology 2015, 26, 385602. [Google Scholar] [CrossRef] [PubMed]
  13. Furmanski, L.; Costa, P.; Dominguini, L. Production of Activated Carbon from Nutshell as An Alternative Material for Adsorption of Methylene Blue; Universidade do Extremo Sul Catarinense: Santa Catarina, Brazil, 2015. [Google Scholar]
  14. González-García, P. Activated carbon from lignocellulosics precursors: A review of the synthesis methods, characterization techniques and applications. Renew. Sustain. Energy Rev. 2018, 82, 1393–1414. [Google Scholar] [CrossRef]
  15. Yan, K.Z.; Zaini, M.A.A.; Arsad, A.; Nasri, N.S. Rubber Seed Shell Based Activated Carbon by Physical Activation for Phenol Removal. Chem. Eng. Trans. 2019, 72, 151–156. [Google Scholar]
  16. Eka, D.H.; Aris, Y.T.; Nadiah, W.W. Potential use of Malaysian rubber (Hevea brasiliensis) seed as food, feed and biofuel. Int. food Res. J. 2010, 17, 527–534. [Google Scholar]
  17. Borhan, A.; Yusup, S.; Mun, Y.S. Surface modification of rubber seed shell activated carbon with malic acid for high CO2 adsorption. IOP Conf. Ser. Earth Environ. Sci. 2020, 460, 012044. [Google Scholar] [CrossRef]
  18. Han, J.; Zhang, L.; Zhao, B.; Qin, L.; Wang, Y.; Xing, F. The N-doped activated carbon derived from sugarcane bagasse for CO2 adsorption. Ind. Crop. Prod. 2019, 128, 290–297. [Google Scholar] [CrossRef]
  19. Bergna, D.; Varila, T.; Romar, H.; Lassi, U. Comparison of the Properties of Activated Carbons Produced in One-Stage and Two-Stage Processes. C—J. Carbon Res. 2018, 4, 41. [Google Scholar] [CrossRef] [Green Version]
  20. Adinata, D.; Daud, W.M.A.W.; Aroua, M.K. Preparation and characterization of activated carbon from palm shell by chemical activation with K2CO3. Bioresour. Technol. 2007, 98, 145–149. [Google Scholar] [CrossRef]
  21. Krishnan, A.; Gopinath, K.P.; Vo, D.V.N.; Malolan, R.; Nagarajan, V.M.; Arun, J. Ionic liquids, deep eutectic solvents and liquid polymers as green solvents in carbon capture technologies: A review. Environ. Chem. Lett. 2020, 1–24. [Google Scholar] [CrossRef]
  22. Aghaie, M.; Rezaei, N.; Zendehboudi, S. A systematic review on CO2 capture with ionic liquids: Current status and future prospects. Renew. Sustain. Energy Rev. 2018, 96, 502–525. [Google Scholar] [CrossRef]
  23. Habila, M.A.; AlOthman, Z.A.; Ghfar, A.A.; Al-Zaben, M.I.; Alothman, A.A.; Abdeltawab, A.A.; El-Marghany, A.; Sheikh, M. Phosphonium-based Ionic Liquid Modified Activated Carbon from Mixed Recyclable Waste for Mercury(II) Uptake. Molecules 2019, 24, 570. [Google Scholar] [CrossRef] [Green Version]
  24. Wang, Q.; Wu, Y.; Zhu, S. Use of Ionic Liquids for Impovement of Cellulosic Ethanol Production. BioResources 2010, 6, 1–11. [Google Scholar] [CrossRef]
  25. Blanchard, L.A.; Hancu, D.; Beckman, E.J.; Brennecke, J.F. Green processing using ionic liquids and CO2. Nature 1999, 399, 28–29. [Google Scholar] [CrossRef]
  26. Anthony, J.L.; Anderson, J.L.; Maginn, E.J.; Brennecke, J.F. Anion Effects on Gas Solubility in Ionic Liquids. J. Phys. Chem. B 2005, 109, 6366–6374. [Google Scholar] [CrossRef] [Green Version]
  27. Yunus, N.M.; Mutalib, M.A.; Man, Z.; Bustam, M.A.; Murugesan, T. Solubility of CO2 in pyridinium based ionic liquids. Chem. Eng. J. 2012, 189, 94–100. [Google Scholar] [CrossRef]
  28. He, X.; Zhu, J.; Wang, H.; Zhou, M.; Zhang, S. Surface Functionalization of Activated Carbon with Phosphonium Ionic Liquid for CO2 Adsorption. Coatings 2019, 9, 590. [Google Scholar] [CrossRef] [Green Version]
  29. Fan, X.; Zhang, L.; Zhang, G.; Shu, Z.; Shi, J. Chitosan derived nitrogen-doped microporous carbons for high performance CO2 capture. Carbon 2013, 61, 423–430. [Google Scholar] [CrossRef]
  30. Mokti, N.; Borhan, A.; Zaine, S.N.A.; Zaid, H.F.M. Synthesis and Characterisation of Pyridinium-Based Ionic Liquid as Activating Agent in Rubber Seed Shell Activated Carbon Production for CO2 Capture. J. Adv. Res. Fluid Mech. Therm. Sci. 2021, 82, 85–95. [Google Scholar] [CrossRef]
  31. Yunus, N.M.; Mutalib, M.A.; Man, Z.; Bustam, M.A.; Murugesan, T. Thermophysical properties of 1-alkylpyridinum bis(trifluoromethylsulfonyl)imide ionic liquids. J. Chem. Thermodyn. 2010, 42, 491–495. [Google Scholar] [CrossRef]
  32. Men, Y.; Siebenbürger, M.; Qiu, X.; Antonietti, M.; Yuan, J. Low fractions of ionic liquid or poly(ionic liquid) can activate polysaccharide biomass into shaped, flexible and fire-retardant porous carbons. J. Mater. Chem. A 2013, 1, 11887–11893. [Google Scholar] [CrossRef] [Green Version]
  33. Rashidi, A.N.; Yusup, S. Potential of palm kernel shell as activated carbon precursors through single stage activation technique for carbon dioxide adsorption. J. Clean. Prod. 2017, 168, 474–486. [Google Scholar] [CrossRef]
  34. Borhan, A.; Yusup, S.; Lim, J.W.; Show, P.L. Characterization and Modelling Studies of Activated Carbon Produced from Rubber-Seed Shell Using KOH for CO2 Adsorption. Processes 2019, 7, 855. [Google Scholar] [CrossRef] [Green Version]
  35. Oliveira, G.F.D.; Andrade, R.C.D.; Trindade, M.A.G.; Andrade, H.M.C.; Carvalho, C.T.D. Thermogravimetric and spectroscopic study (TG–DTA/FT–IR) of activated carbon from the renewable biomass source Babassu. Química Nova 2016, 40, 284–292. [Google Scholar] [CrossRef]
  36. Kaghazchi, T.; Soleimani, M. Effect of Raw Materials on Properties of Activated Carbons. Chem. Eng. Technol. 2006, 29, 1247–1251. [Google Scholar]
  37. Rashidi, N.A.; Yusup, S.; Ahmad, M.M.; Mohamed, N.M.; Hameed, B.H. Activated Carbon from the Renewable Agricultural Residues Using Single Step Physical Activation: A Preliminary Analysis. APCBEE Procedia 2012, 3, 84–92. [Google Scholar] [CrossRef] [Green Version]
  38. Hidayu, A.R.; Mohamad, N.F.; Matali, S.; Sharifah, A.S.A.K. Characterization of Activated Carbon Prepared from Oil Palm Empty Fruit Bunch Using BET and FT-IR Techniques. Procedia Eng. 2013, 68, 379–384. [Google Scholar] [CrossRef] [Green Version]
  39. Schröder, E.; Thomauske, K.; Oechsler, B.; Herberger, S.; Baur, S.; Hornung, A. Activated Carbon from Waste Biomass. Prog. Biomass Bioenergy Prod. 2011, 333–356. [Google Scholar]
  40. Shamsuddin, S.M.; Yusoff, N.R.N.; Sulaiman, M.A. Synthesis and Characterization of Activated Carbon Produced from Kenaf Core Fiber Using H3PO4 Activation. Procedia Chem. 2016, 19, 558–565. [Google Scholar] [CrossRef] [Green Version]
  41. Wyasu, G.; Gimba, C.E.; Agbaji, E.B.; Ndukwe, G.I. Thermo-gravimetry(TGA) and DSC of thermal analysis techniques in production of active carbon from lignocellulosic materials. Adv. Appl. Sci. Res. 2016, 7, 109–115. [Google Scholar]
  42. Lehmann, J.; Joseph, S. Biochar for Environmental Management: Science and Technology; Taylor & Francis: London, UK, 2012. [Google Scholar]
  43. Reshad, S.A.; Tiwari, P.; Goud, V.V. Thermo-chemical conversion of waste rubber seed shell to produce fuel and value-added chemicals. J. Energy Inst. 2018, 91, 940–950. [Google Scholar] [CrossRef]
  44. Sing, K.S.W. Reporting physisorption data for gas/solid systems with special reference to the determination of surface area and porosity (Recommendations 1984). Pure Appl. Chem. 1985, 57, 603–619. [Google Scholar] [CrossRef]
  45. Kumar, A.; Jena, H.M. Preparation and characterization of high surface area activated carbon from Fox nut (Euryale ferox) shell by chemical activation with H3PO4. Results Phys. 2016, 6, 651–658. [Google Scholar] [CrossRef] [Green Version]
  46. Daud, W.W.M.A.; Ali, W.S.W.; Sulaiman, M.Z. The effects of carbonization temperature on pore development in palm-shell-based activated carbon. Carbon 2000, 38, 1925–1932. [Google Scholar] [CrossRef]
  47. Tan, Z.; Zou, J.; Zhang, L.; Huang, Q. Morphology, pore size distribution, and nutrient characteristics in biochars under different pyrolysis temperatures and atmospheres. J. Mater. Cycles Waste Manag. 2018, 20, 1036–1049. [Google Scholar] [CrossRef]
  48. Lee, J.S.; Wang, X.; Luo, H.; Dai, S. Fluidic Carbon Precursors for Formation of Functional Carbon under Ambient Pressure Based on Ionic Liquids. Adv. Mater. 2010, 22, 1004–1007. [Google Scholar] [CrossRef]
  49. Rashidi, A.N.; Yusup, S.; Borhan, A. Isotherm and Thermodynamic Analysis of Carbon Dioxide on Activated Carbon. Procedia Eng. 2016, 148, 630–637. [Google Scholar] [CrossRef] [Green Version]
  50. Alabadi, A.; Razzaque, S.; Yang, Y.; Chen, S.; Tan, B. Highly porous activated carbon materials from carbonized biomass with high CO2 capturing capacity. Chem. Eng. J. 2015, 281, 606–612. [Google Scholar] [CrossRef]
  51. Guo, Y.; Tan, C.; Sun, J.; Li, W.; Zhang, J.; Zhao, C. Porous activated carbons derived from waste sugarcane bagasse for CO2 adsorption. Chem. Eng. J. 2020, 381, 122736. [Google Scholar] [CrossRef]
  52. Rahman, H.A.; Chin, S.X. Physical and Chemical Properties of the Rice Straw Activated Carbon Produced from Carbonization and KOH Activation Processes. Sains Malaysia. 2019, 48, 385–391. [Google Scholar]
  53. Tang, Y.-B.; Liu, Q.; Chen, F.-Y. Preparation and characterization of activated carbon from waste ramulus mori. Chem. Eng. J. 2012, 203, 19–24. [Google Scholar] [CrossRef]
  54. Rashidi, A.N.; Suzana, Y.; Borhan, A. Novel Low-Cost Activated Carbon from Coconut Shell and Its Adsorptive Characteristics for Carbon Dioxide. Key Eng. Mater. 2013, 594, 240–244. [Google Scholar] [CrossRef]
  55. Yu, C.-H.; Huang, C.-H.; Tan, C.-S. A Review of CO2 Capture by Absorption and Adsorption. Aerosol Air Qual. Res. 2012, 12, 745–769. [Google Scholar] [CrossRef] [Green Version]
  56. Krishnaiah, D.B.A.; Anisuzzaman, S.M.; Joseph, C.; Khee, T.B. Carbon Dioxide Removal by Adsorption. J. Appl. Sci. 2014, 14, 3142–3148. [Google Scholar] [CrossRef]
  57. Younas, M.; Sohail, M.; Leong, L.K.; Bashir, M.J.; Sumathi, S. Feasibility of CO2 adsorption by solid adsorbents: A review on low-temperature systems. Int. J. Environ. Sci. Technol. 2016, 13, 1839–1860. [Google Scholar] [CrossRef] [Green Version]
  58. Song, G.; Zhu, X.; Chen, R.; Liao, Q.; Ding, Y.D.; Chen, L. An investigation of CO2 adsorption kinetics on porous magnesium oxide. Chem. Eng. J. 2016, 283, 175–183. [Google Scholar] [CrossRef]
  59. Khalili, S.; Khoshandam, B.; Jahanshahi, M. Optimization of production conditions for synthesis of chemically activated carbon produced from pine cone using response surface methodology for CO2 adsorption. RSC Adv. 2015, 5, 94115–94129. [Google Scholar] [CrossRef]
  60. Borhan, A.; Thangamuthu, S.; Taha, M.F.; Ramdan, A.N. Development of activated carbon derived from banana peel for CO2 removal. AIP Conf. 2015, 1674, 020002. [Google Scholar]
  61. Hao, W.; Björkman, E.; Lilliestråle, M.; Hedin, N. Activated carbons prepared from hydrothermally carbonized waste biomass used as adsorbents for CO2. Appl. Energy 2013, 112, 526–532. [Google Scholar] [CrossRef]
  62. Yang, H.; Gong, M.; Chen, Y. Preparation of activated carbons and their adsorption properties for greenhouse gases: CH4 and CO2. J. Nat. Gas Chem. 2011, 20, 460–464. [Google Scholar] [CrossRef]
  63. Caglayan, S.B.; Aksoylu, A.E. CO2 adsorption on chemically modified activated carbon. J. Hazard. Mater. 2013, 252, 19–28. [Google Scholar] [CrossRef]
  64. Nugent, P.; Belmabkhout, Y.; Burd, S.D.; Cairns, A.J.; Luebke, R.; Forrest, K.; Pham, T.; Ma, S.; Space, B.; Wojtas, L. Porous Materials with Optimal Adsorption Thermodynamics and Kinetics for CO2 Separation. Nature 2013, 495, 80–84. [Google Scholar] [CrossRef]
  65. Ma, X.; Li, L.; Chen, R.; Wang, C.; Li, H.; Wang, S. Heteroatom-doped nanoporous carbon derived from MOF-5 for CO2 capture. Appl. Surf. Sci. 2018, 435, 494–502. [Google Scholar] [CrossRef]
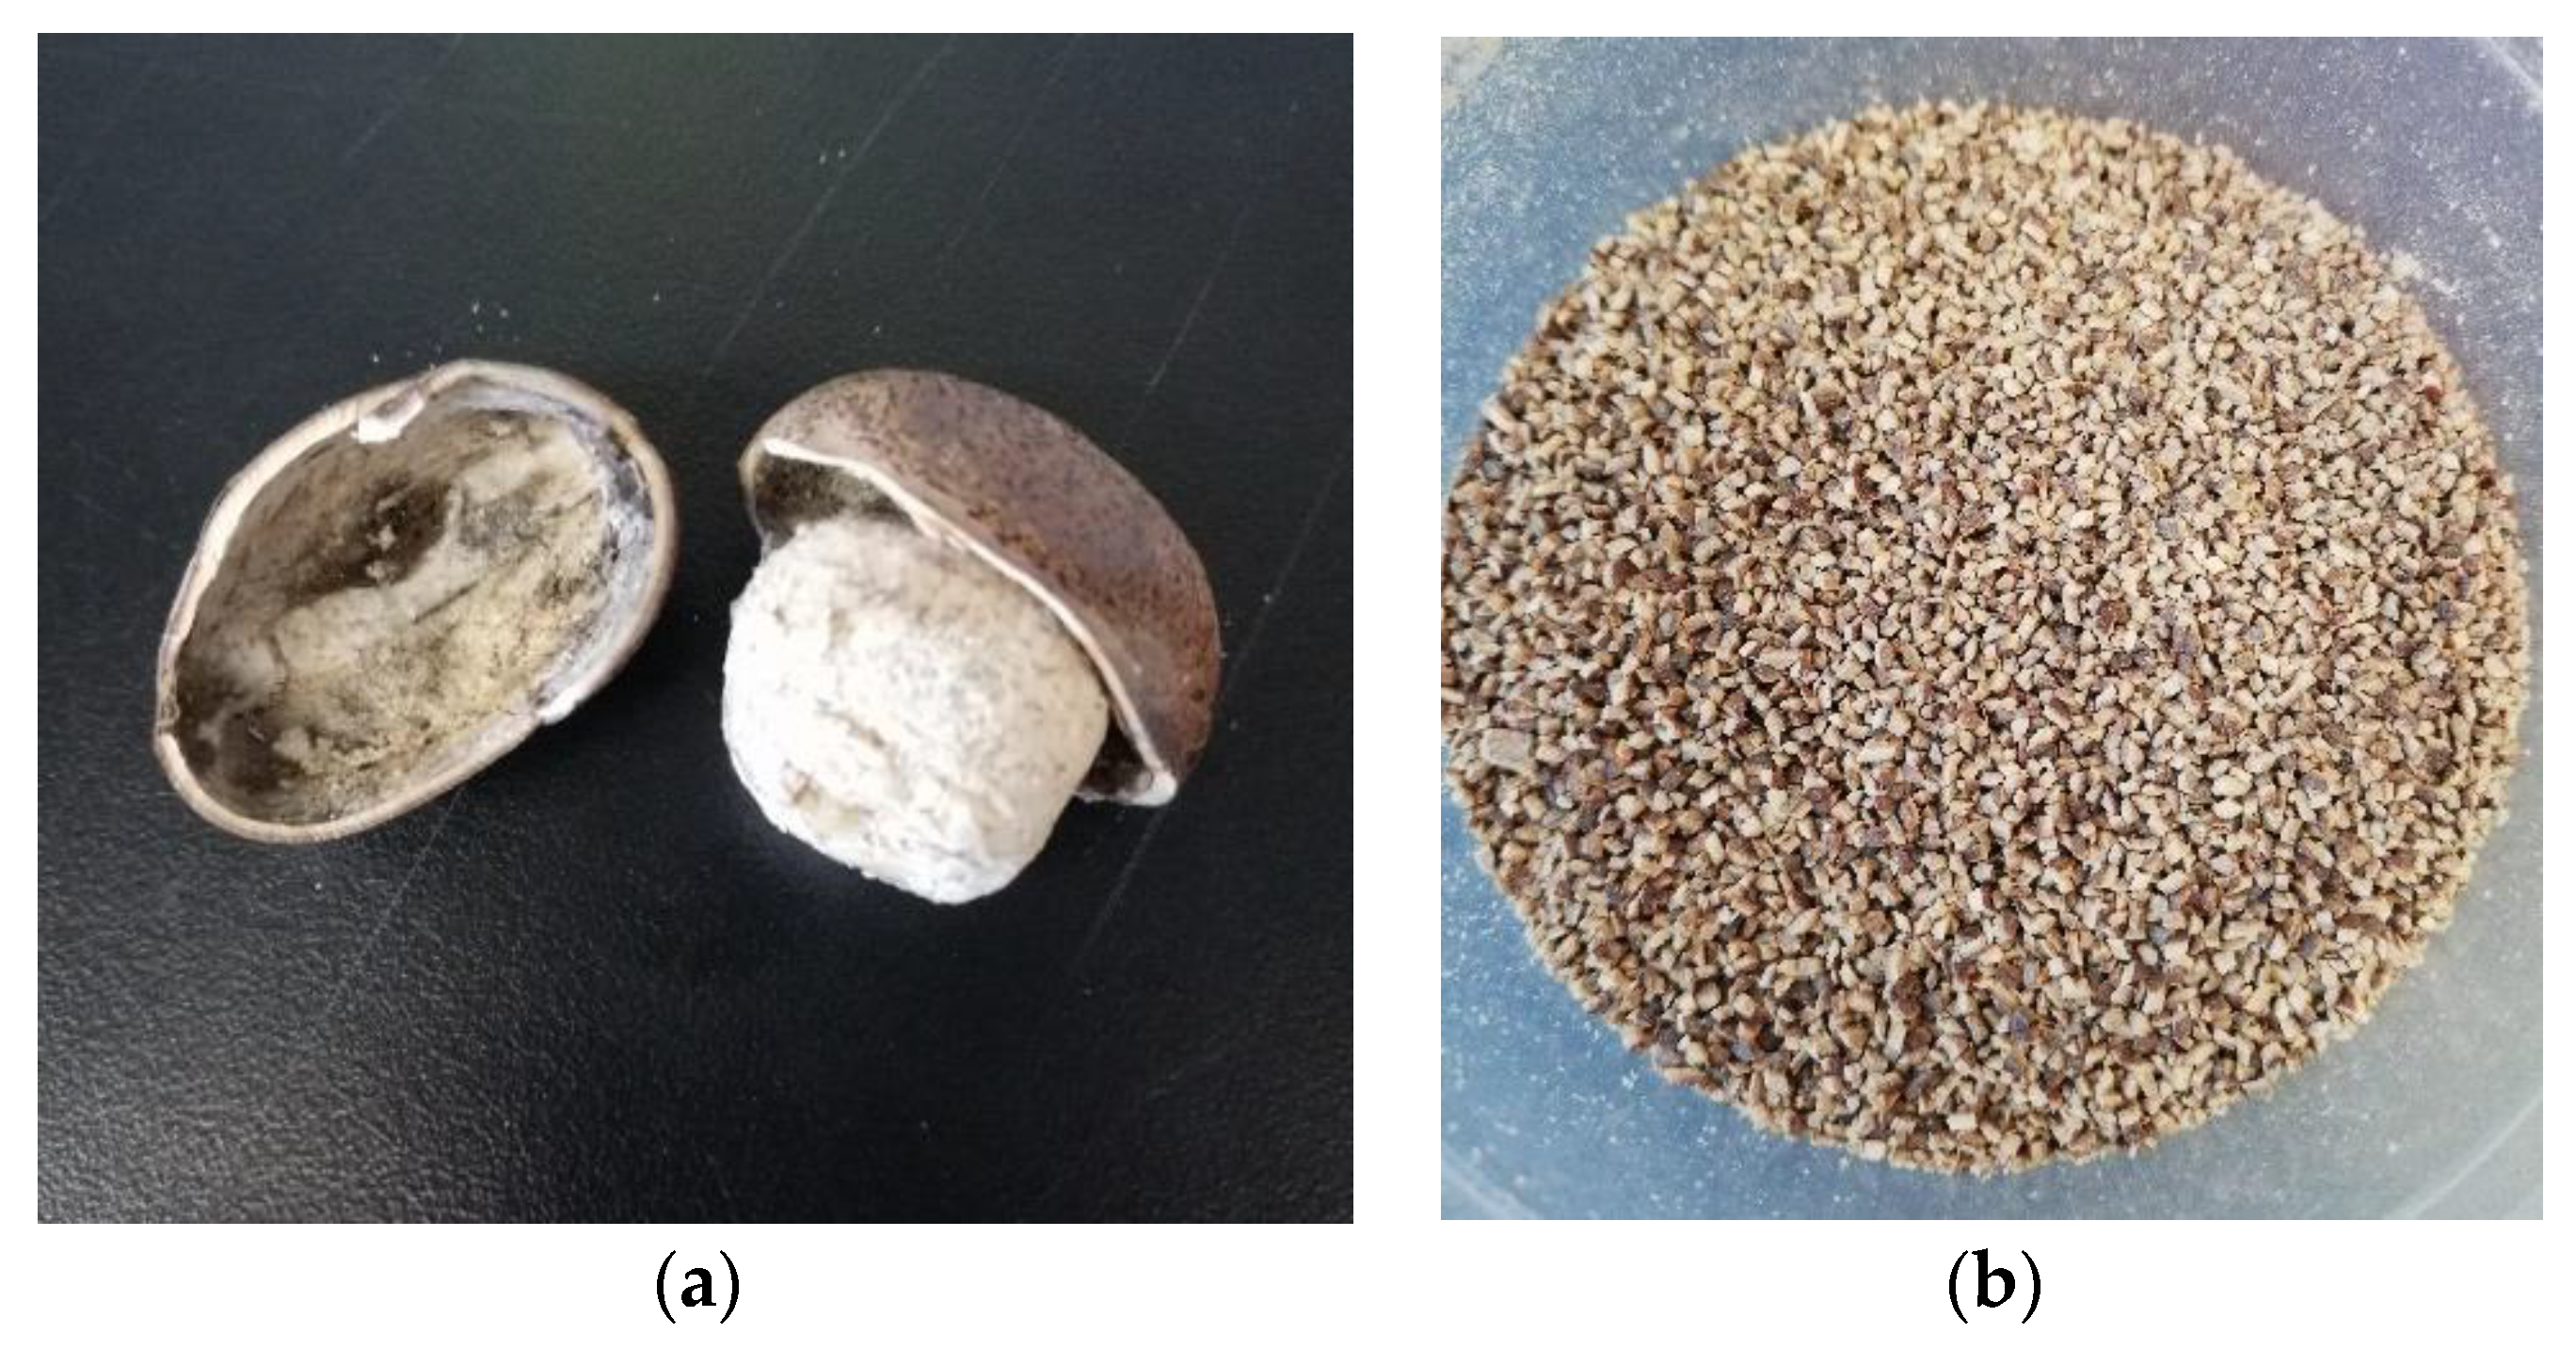
Figure 1. Image of raw (a) rubber seed shell (RSS) and (b) crushed RSS.
Processes 09 01161 g001
Figure 2. The flowchart of the experimental work.
Processes 09 01161 g002
Figure 3. TGA/DTG curve of raw RSS.
Processes 09 01161 g003
Figure 4. (a) Nitrogen adsorption–desorption isotherms and (b) pore size distributions (PSDs) of AC samples with different carbonization temperatures.
Processes 09 01161 g004aProcesses 09 01161 g004b
Figure 5. Effect of carbonization temperature on (a) surface areas and (b) pore volumes of AC samples at different carbonization temperatures.
Processes 09 01161 g005
Figure 6. FESEM images at magnification of 3000×: (a) raw RSS, (b) RSS-IL 500, and (c) RSS-IL 800.
Processes 09 01161 g006
Figure 7. FTIR analysis of raw RSS and AC samples at different carbonization temperatures.
Processes 09 01161 g007
Figure 8. CO2 adsorption isotherm of the prepared AC at different carbonization temperatures.
Processes 09 01161 g008
Figure 9. CO2 adsorption isotherm of sample RSS-IL 800 at the temperatures of 25, 50, and 100 °C.
Processes 09 01161 g009
Figure 10. FTIR analysis of RSS-IL 800 before and after CO2 adsorption.
Processes 09 01161 g010
Figure 11. Isosteric ln P against 1/T where T is 298, 323, and 373 K for five different loadings, where n is in mmol/g.
Processes 09 01161 g011
Figure 12. Isosteric heat of CO2 adsorption on the RSS-IL 800.
Processes 09 01161 g012
Table 1. Proximate and ultimate analysis of raw rubber seed shell (RSS).
AnalysisRaw RSS (%)
Proximate
Moisture13.9
Volatile Matter72.3
Fixed Carbon13.6
Ash0.2
Ultimate
Carbon49.5
Hydrogen6.4
Nitrogen0.4
Sulfur0.3
Oxygen a43.4
a By difference.
Table 2. BET surface area, total pore volume, and micropore volume of the prepared AC samples.
SamplesSBET
(m2/g)
Smicro
(m2/g)
Smeso
(m2/g)
Vtotal
(cm3/g)
Vmicro
(cm3/g)
Vmeso
(cm3/g)
Micropore Percentage (%)
Raw RSS19.6617.761.9000090.3
RSS-IL 500107.5588.8118.740.0490.0450.00382.6
RSS-IL 600355.93261.9893.950.1870.1340.05373.6
RSS-IL 700357.85301.8755.980.1890.1560.03384.4
RSS-IL 800393.99337.0956.900.2060.1720.03485.6
Table 3. CHNS analysis of AC.
Sample NameCHNSO aC/H
Raw RSS49.556.400.410.3043.47.74
RSS-IL 50077.373.320.850.2318.2423.27
RSS-IL 60081.702.940.880.1714.3127.77
RSS-IL 70084.472.300.900.1312.2036.70
RSS-IL 80085.471.861.140.1111.4245.86
a = calculated by difference.
Table 4. Fitted parameters of three isotherm models for CO2 adsorption on RSS-IL 800.
ModelParametersTemperature
25 °C50 °C100 °C
Langmuir Isothermqmax (mmol/g)2.95422.23561.6812
KL (1/bar)3.07731.74660.5874
R20.99040.98860.9945
Freundlich Isothermn1.84841.57781.2309
KF (mmol/g.bar)2.39331.50281.5517
R20.98670.99200.9971
Temkin IsothermB0.58640.43470.5818
KT (mmol/g.bar)40.899523.180612.9017
R20.97840.96510.9293
Table 5. CO2 adsorption capacity with different biomass materials at 25 °C and 1 bar.
AdsorbentTreatment MethodCO2 Adsorption Capacity (mmol/g)Reference
Banana peel ACChemical/KOH1.10[60]
RSS ACChemical/KOH1.24[34]
Grass biomass ACPhysical/hydrothermal1.45[61]
Coconut shell ACChemical/H3PO41.70[62]
Norit® SX2
(commercial AC)
Physical/steam1.88[33]
Norit ROX
(commercial AC)
Chemical/Na2CO3
(air oxidation)
2.02[63]
Palm Kernel Shell ACPhysical/CO22.13[33]
RSS ACChemical/malic acid2.26[17]
Zeolite 13XPhysical/hydrothermal2.42[64]
MOF-5 Chemical/DMF2.43[65]
RSS AC (RSS-IL 800)Chemical/[C4Py][Tf2N] IL2.44This study
Rice husk ACPhysical/CO23.10[3]
Publisher’s Note: MDPI stays neutral with regard to jurisdictional claims in published maps and institutional affiliations.